
Study of Partial Discharge Inception Voltage in Inverter Fed Electric Motor Insulation Systems


Abstract
:1. Introduction
2. Literature Review
2.1. Variables Affecting PDIV
2.1.1. Environmental Conditions
Pressure
Humidity
Temperature
2.1.2. Electrical Factors
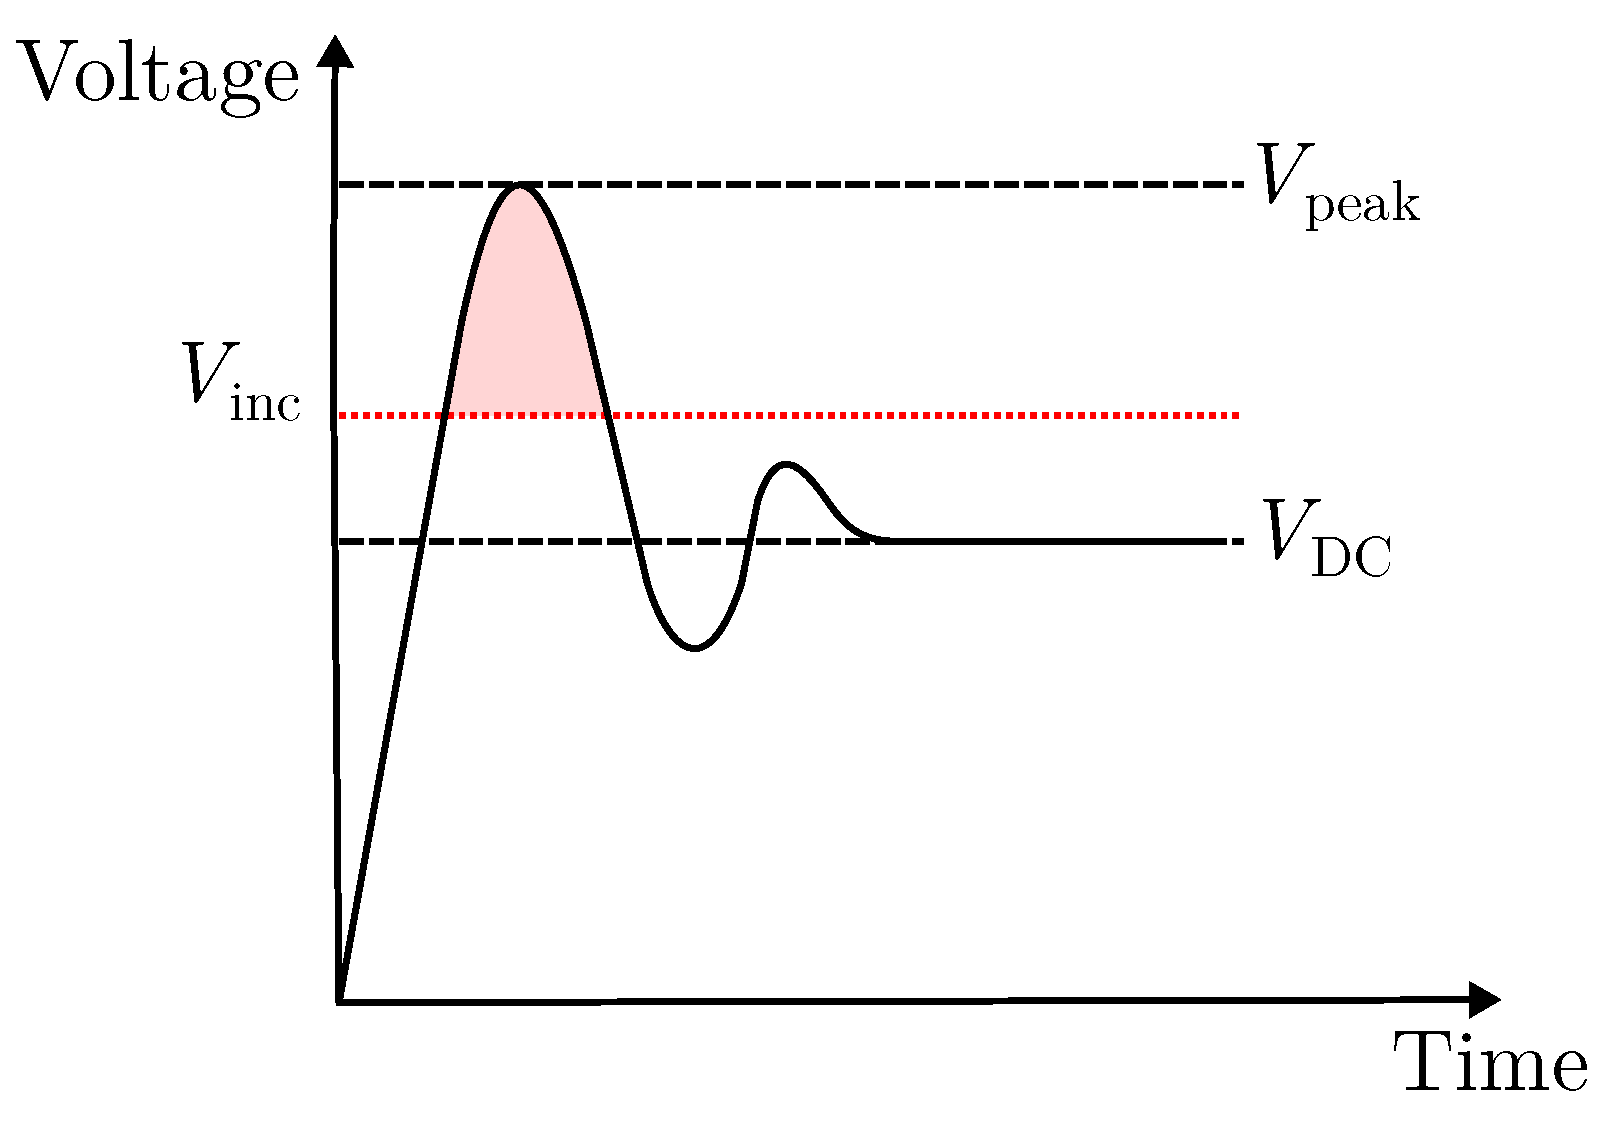
Waveform and Polarity
Switching Frequency
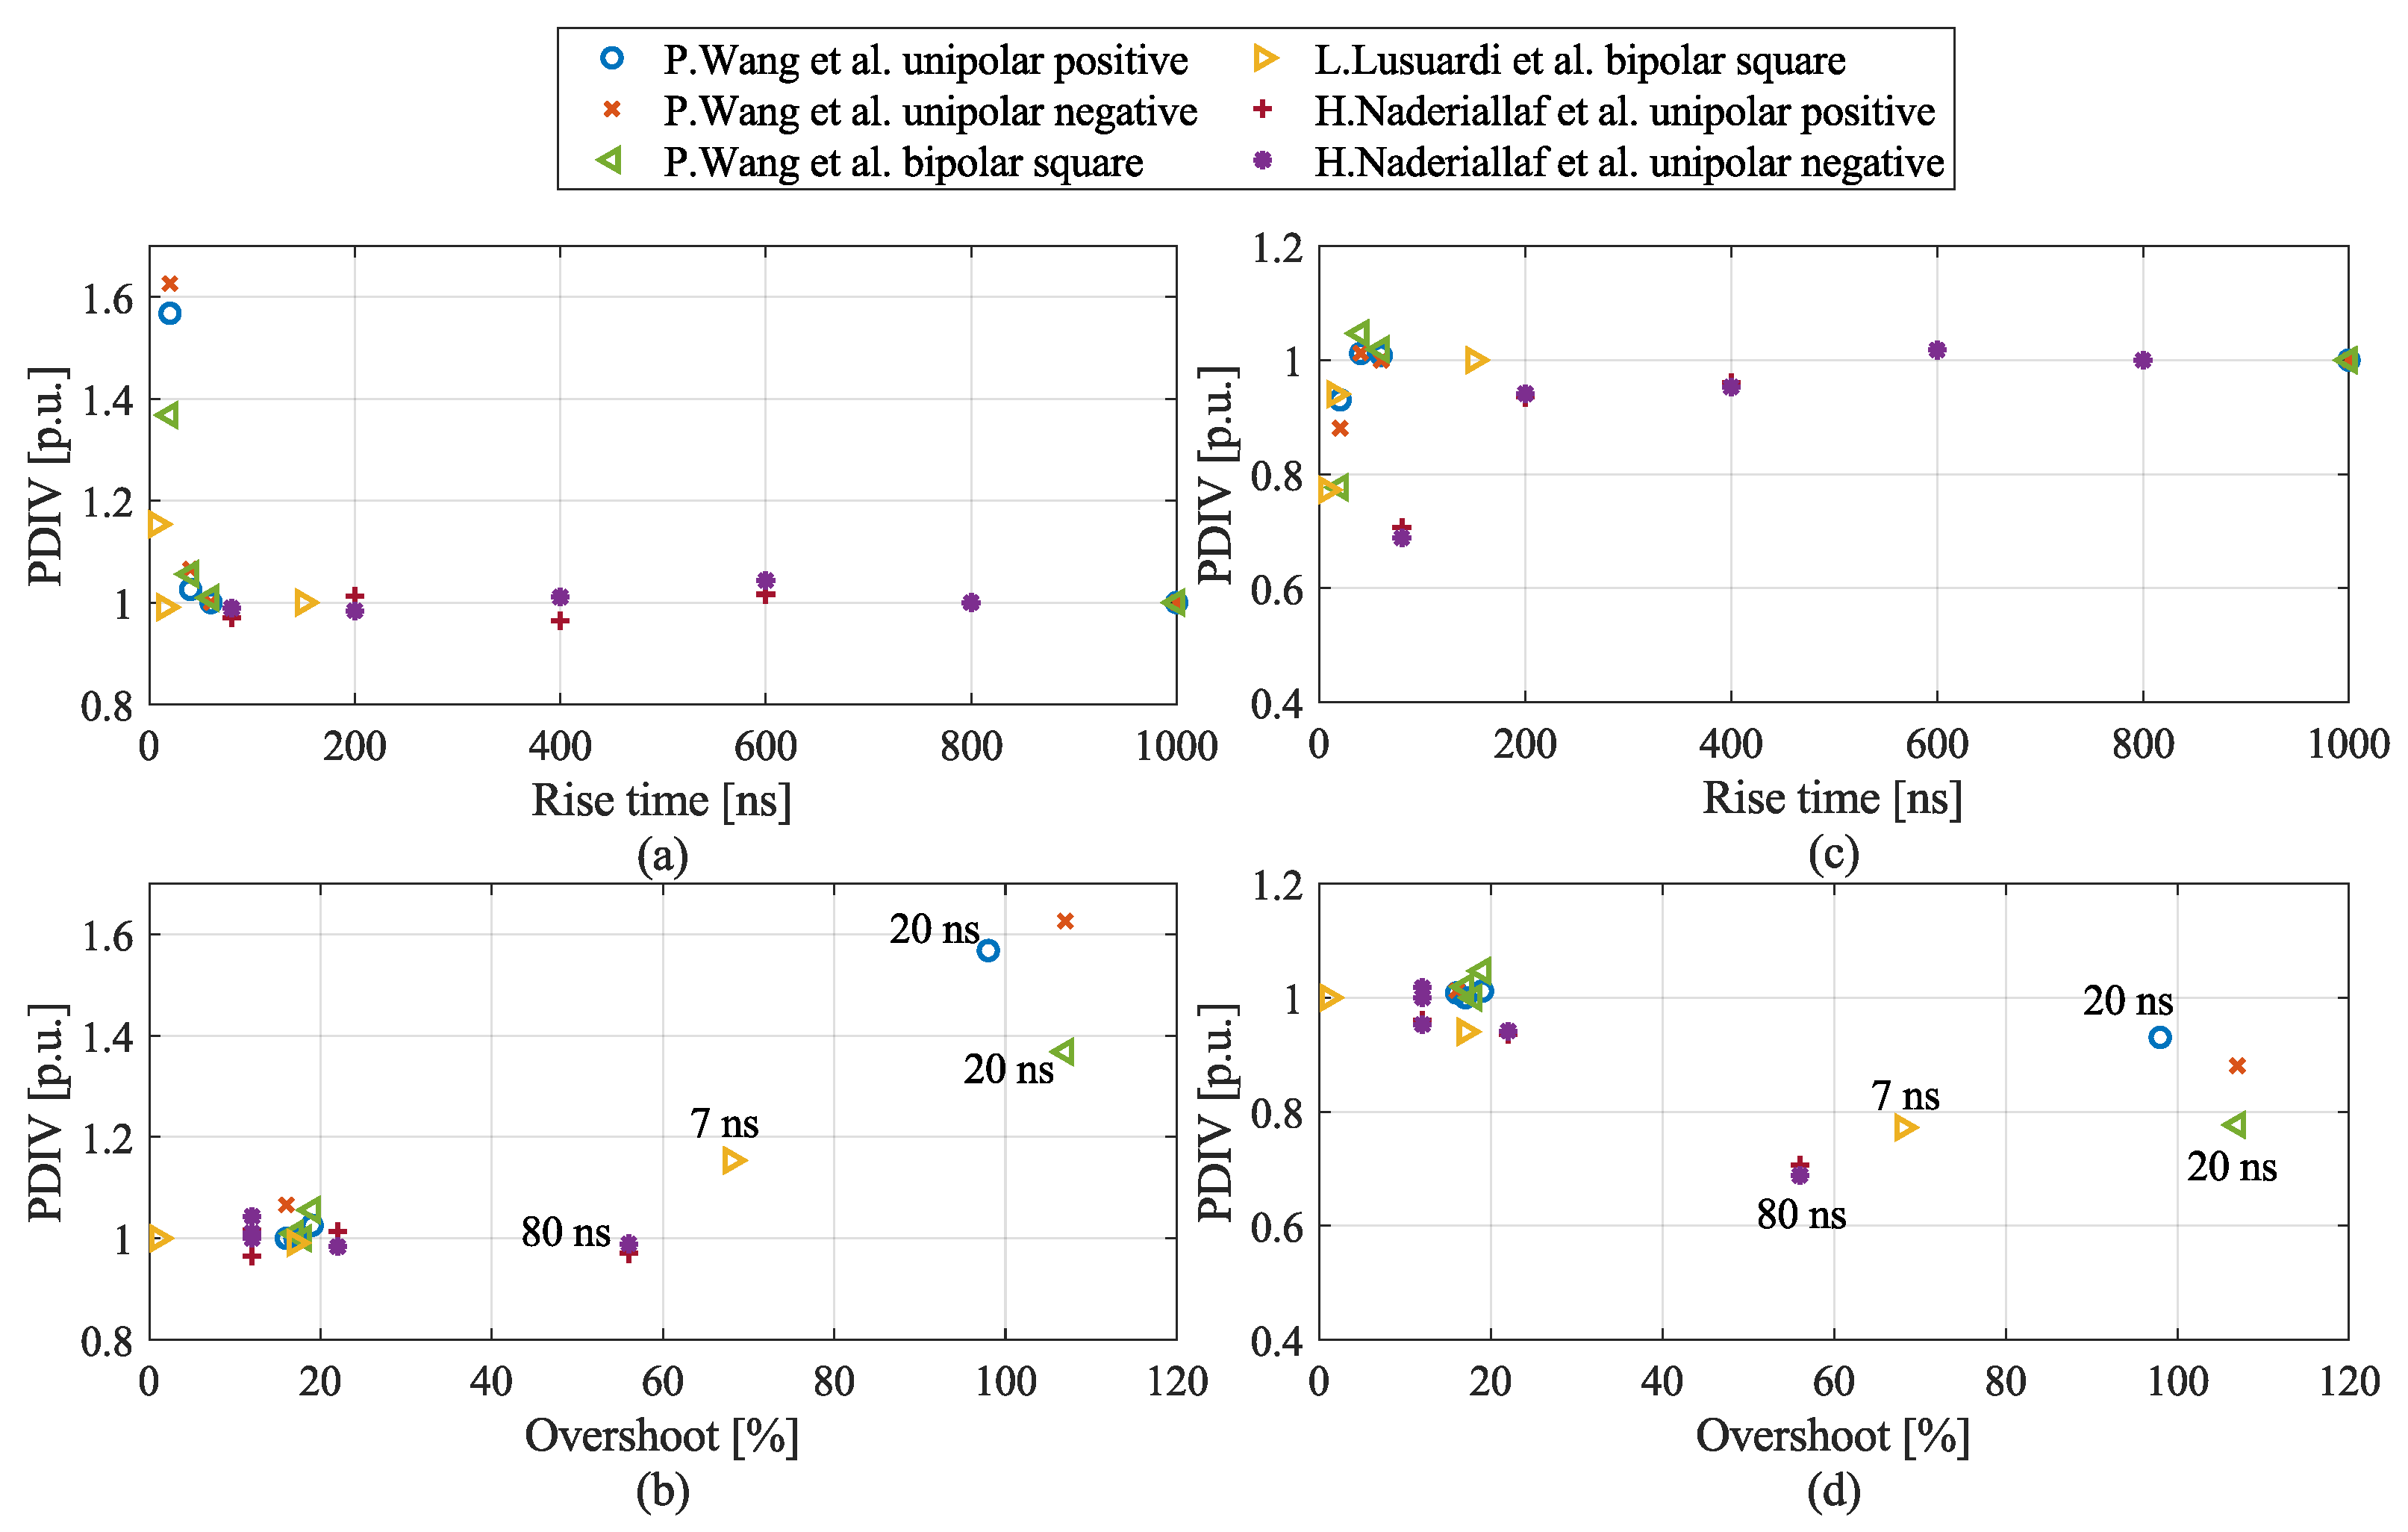
Rise Time
Pulse Width
2.1.3. Summary of Variables Affecting PDIV
2.2. PDIV Modelling
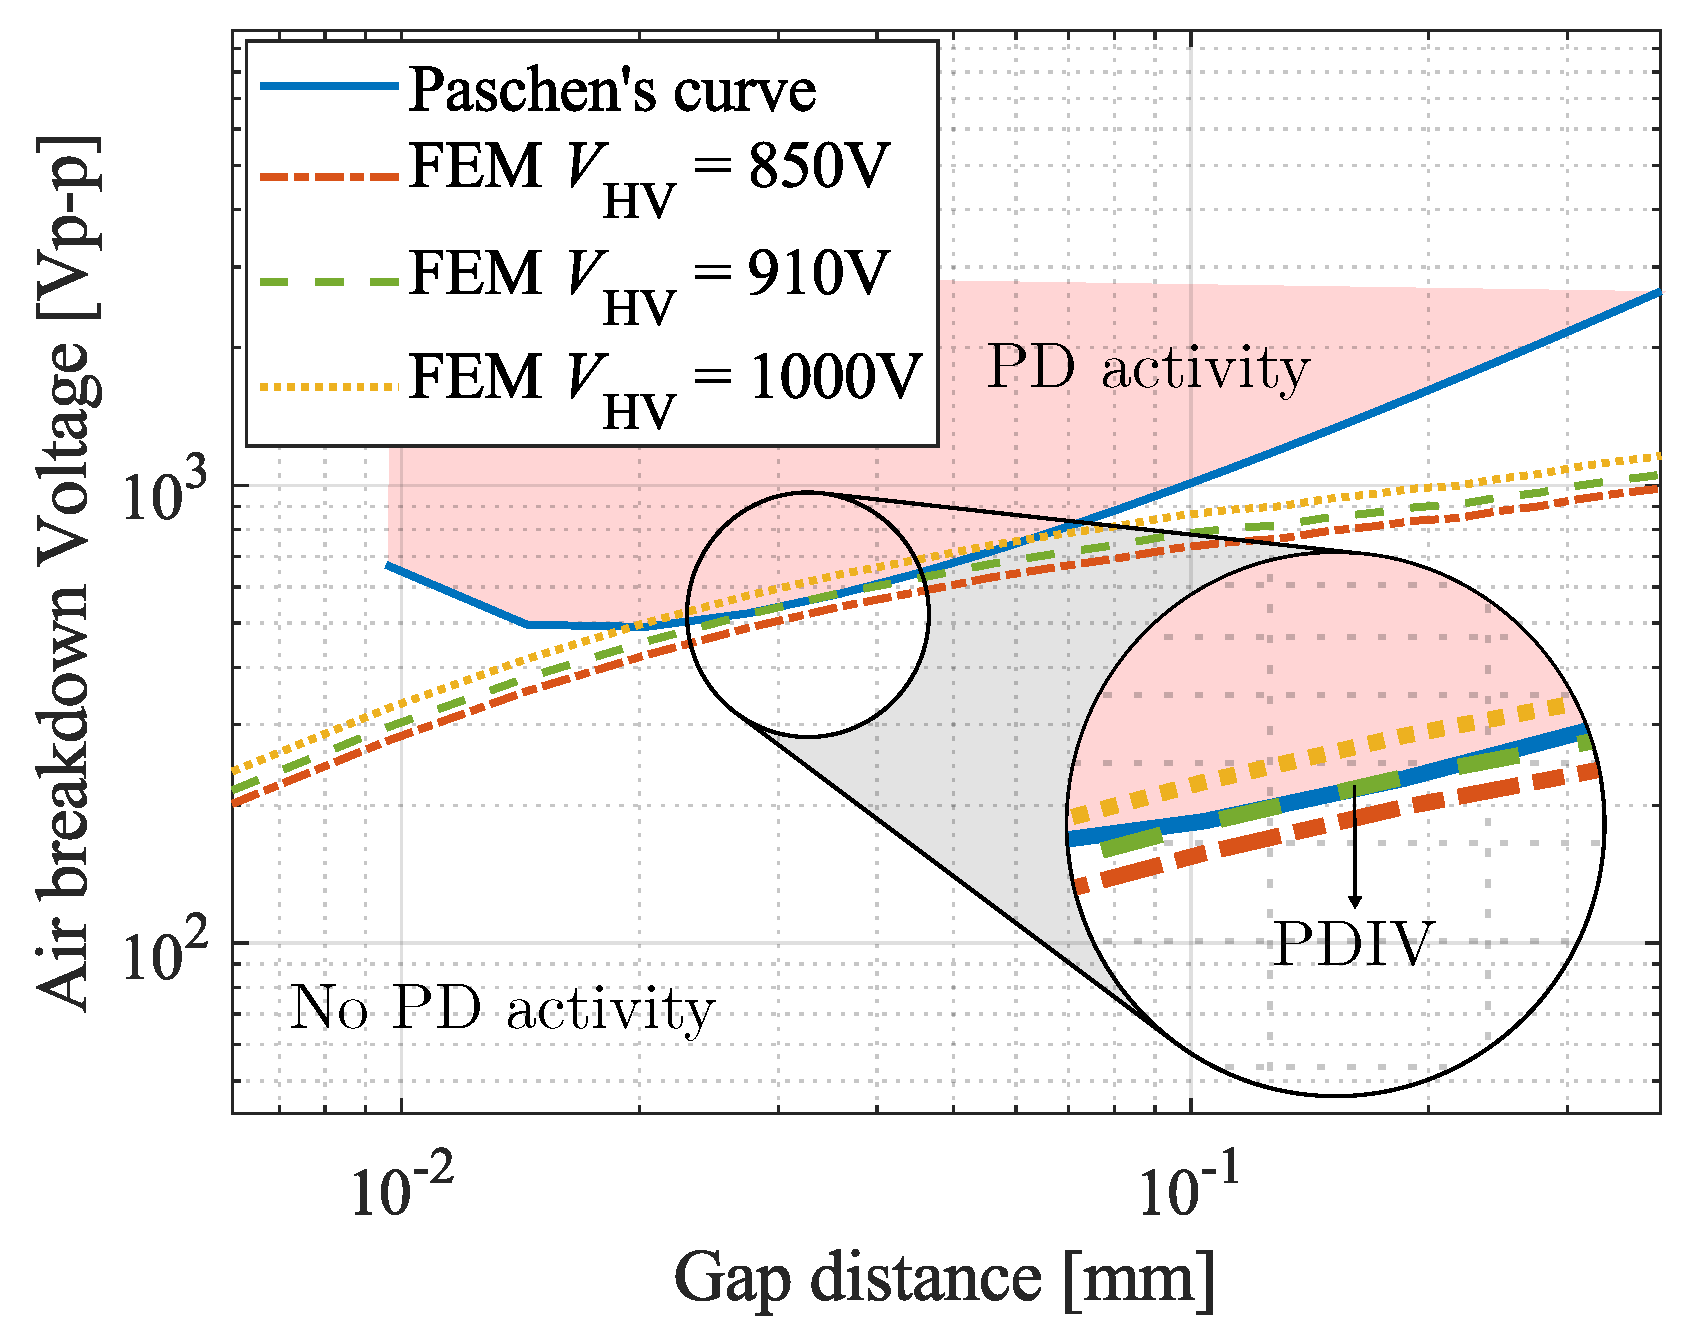
2.2.1. Paschen’s Law
- (1)
- In the general use of Paschen’s law (using parallel plate electrodes), for a given pressure, the first ionisation phenomena () is considered constant in the distance , defining as the perpendicular distance between electrode surfaces. Several authors have used the same definition to model the PDIV on twisted pairs with FEM simulations [60,68,69] or analytical models [59]. Indeed, the difference between the real and straight field length has been shown to be lower than 1% for small distances, while it is about 7% for distances larger than 50 [69]. Adversely, Gómez de la Calle et al. [70] stated that this simplification of assuming a constant effective first ionisation phenomenon is not correct for this specified geometry. In twisted pairs, the path defined by the perpendicular distance between wires does not match with the path followed by the electric field lines. Therefore, this approach is questioned.
- (2)
- Paschen’s law is based on Townsend’s ionisation mechanism. Although several authors used Paschen’s law for the definition of the PDIV [59,60,62,63,70], in [70], the author notes that some works have proven that the streamer inception mechanism is more effective. Additionally, L. Lusuardi et al. [71] argued that, as enamelled twisted pairs, electrodes are covered by an insulation film, so the emission of secondary electrons from the insulated cathode by positive ions is extremely unlikely. Accordingly, Paschen’s law can not be used to estimate the PDIV and should be replaced by the streamer criterion. The main concept of this criterion is the single-electron-avalanche mechanism, which defines the breakdown voltage of the air when the number of electrons reaches a critical number. The relationship between the number of electrons along a field line and the critical electron number is defined by the Schumann criteria (Equation (4)):where is the effective ionisation coefficient of the anode, is the critical number of electrons for the breakdown, and is a dimensionless constant, generally taken as 18 for air.
- (3)
- Independent of the use of Paschen’s law or Schumann’s criteria, there is no consensus in the literature regarding the definition of the value for Paschen’s law and for the Schumann criteria. Concerning , although it is well defined for metal electrodes, there is uncertainty about its value for different kinds of enamel materials [62,70]. Regarding the Schumann constant , although it is generally defined as a constant value (18 for air), the prediction of the PDIV using this value seems not to be very accurate [71].
- (4)
Townsend’s Secondary Ionisation Coefficient () and Schumann’s Criteria Constant () Correction
Temperature Correction
2.2.2. Analytical Equations
Dakin Model
Parallel-Plate Capacitor Model
Lusuardi Model
Estimation Considering Rise Time and Pulse Width
2.2.3. FEM Simulations
FEM and Paschen’s Law
FEM and Schumann Criteria
- Define an initial voltage for the 2D FEM simulation model and compute the electric field and the constant electric field line length, similar to in [70].
- Import a database of gas ionisation parameters as a function of the specific electric field . Where is defined as in Equation (7).
- Verify if the Schumann criteria are satisfied (4) for at least one electric field line. If not, repeat the process, increasing the voltage.
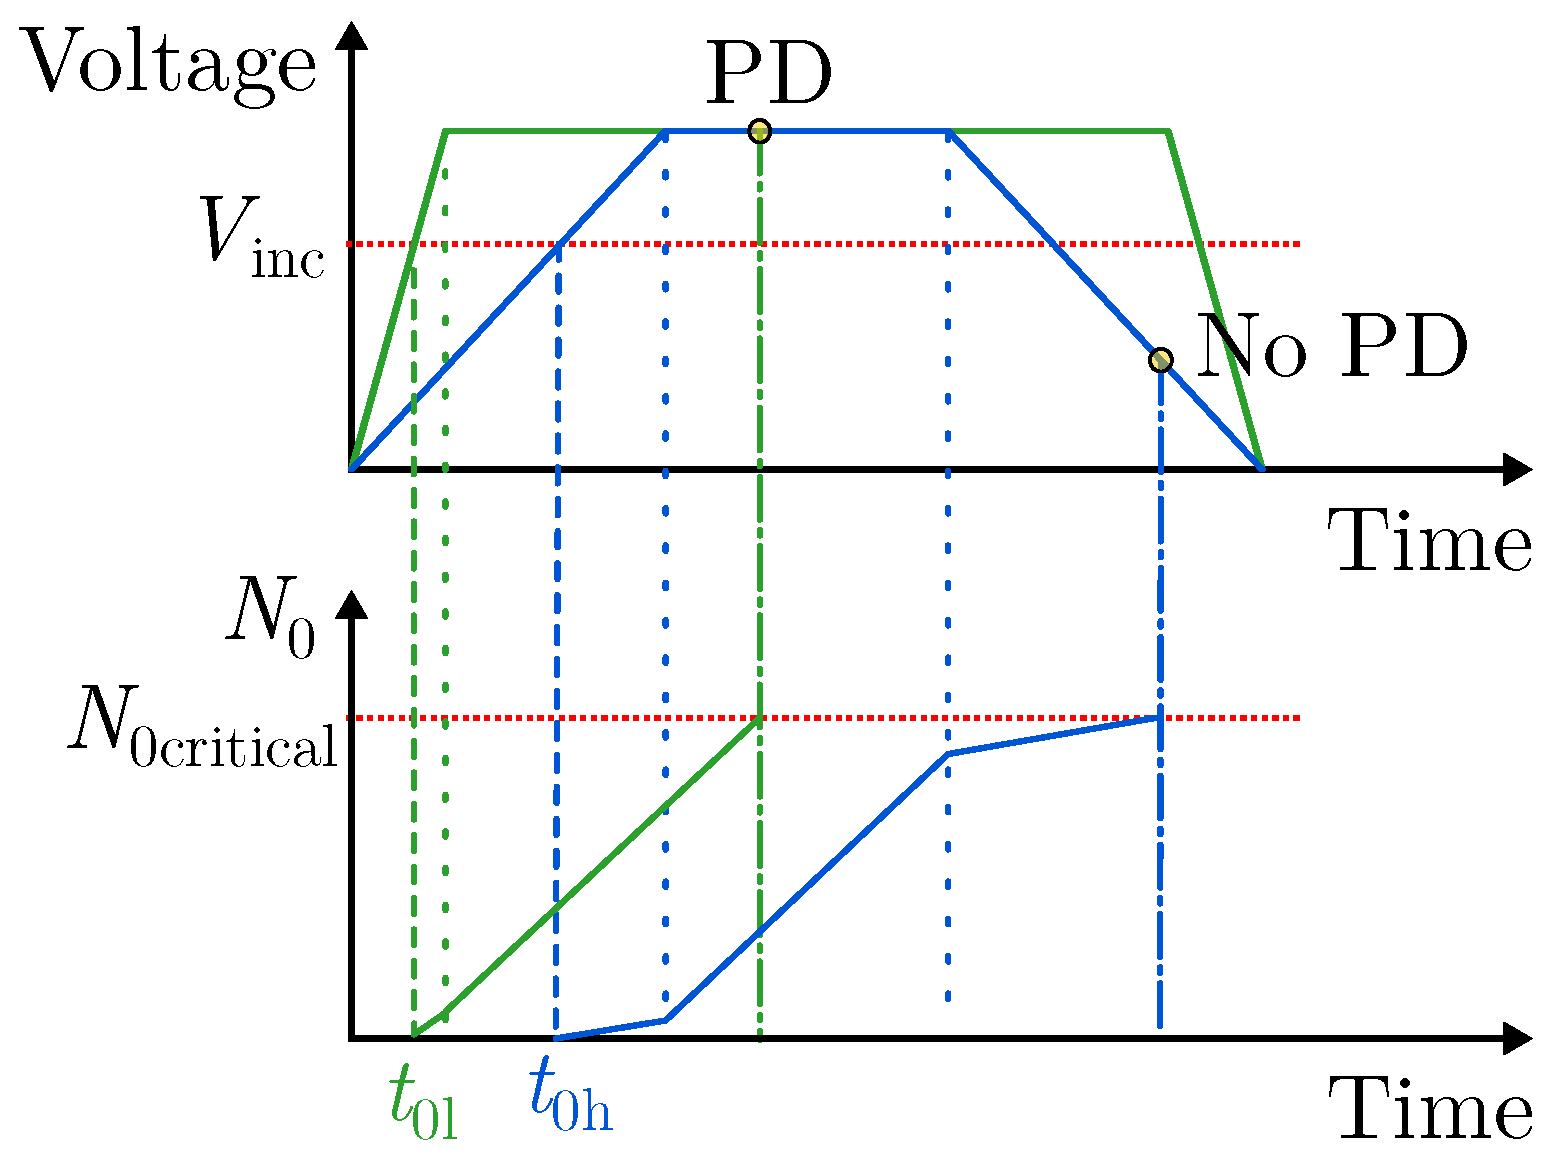
2.2.4. Probability Model
2.2.5. Summary of PDIV Estimation Models
3. Materials and Methods
3.1. Samples
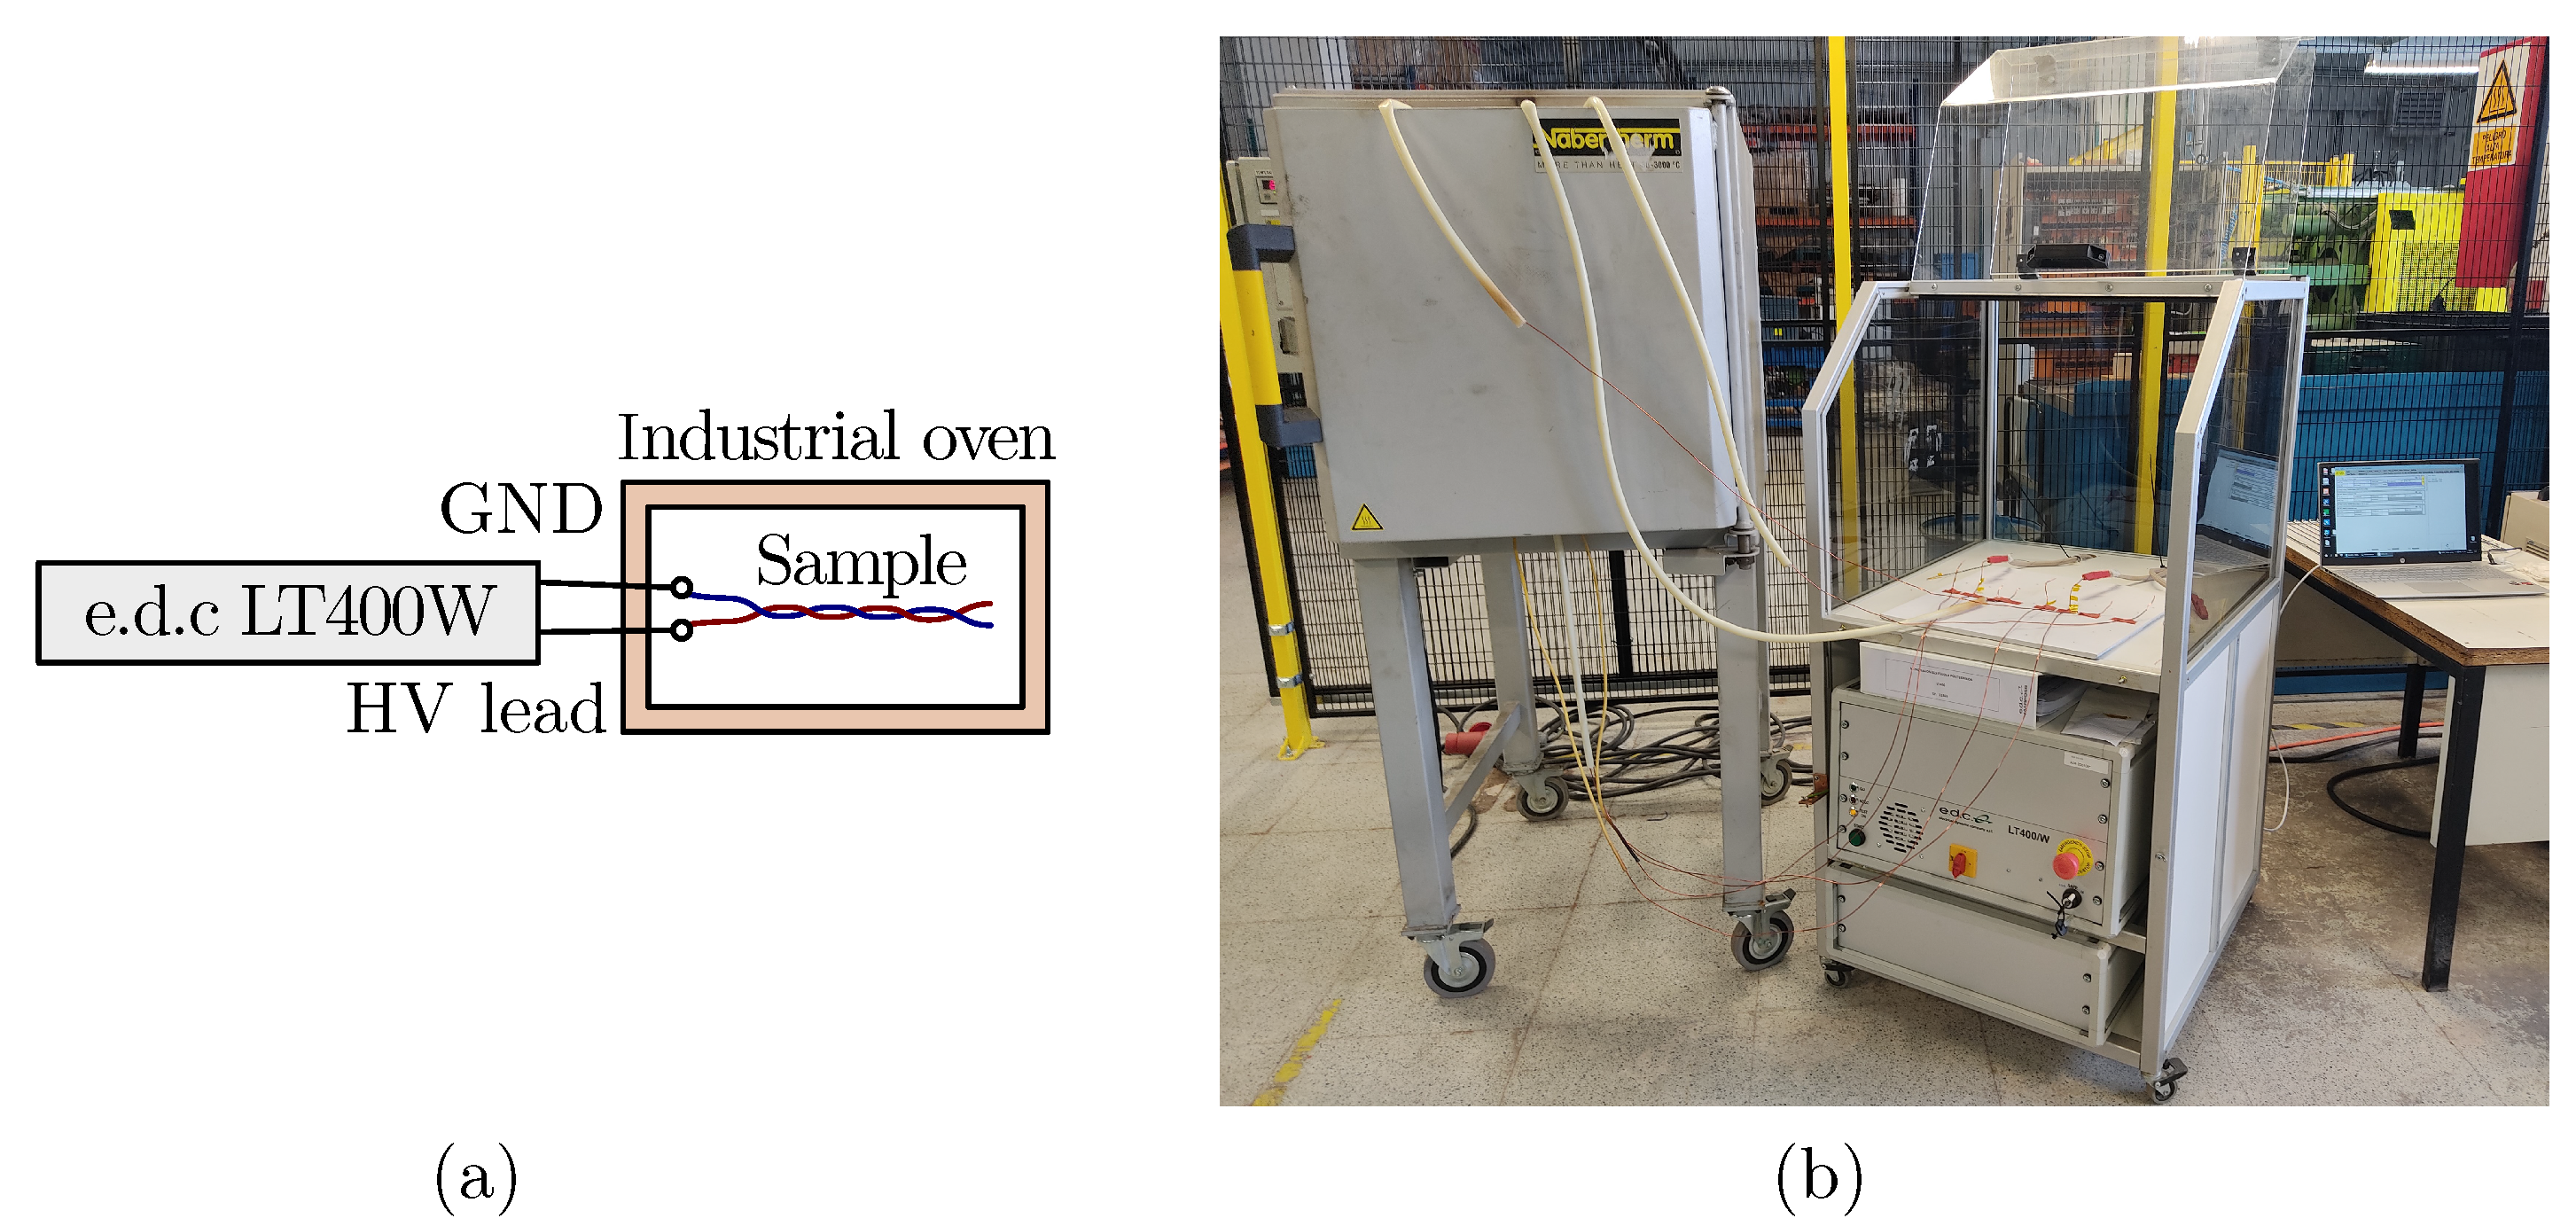
3.2. Set Up
3.3. PDIV Measurement Procedure
4. Analysis of PDIV and Modelling Tool Performance for Variable Temperature
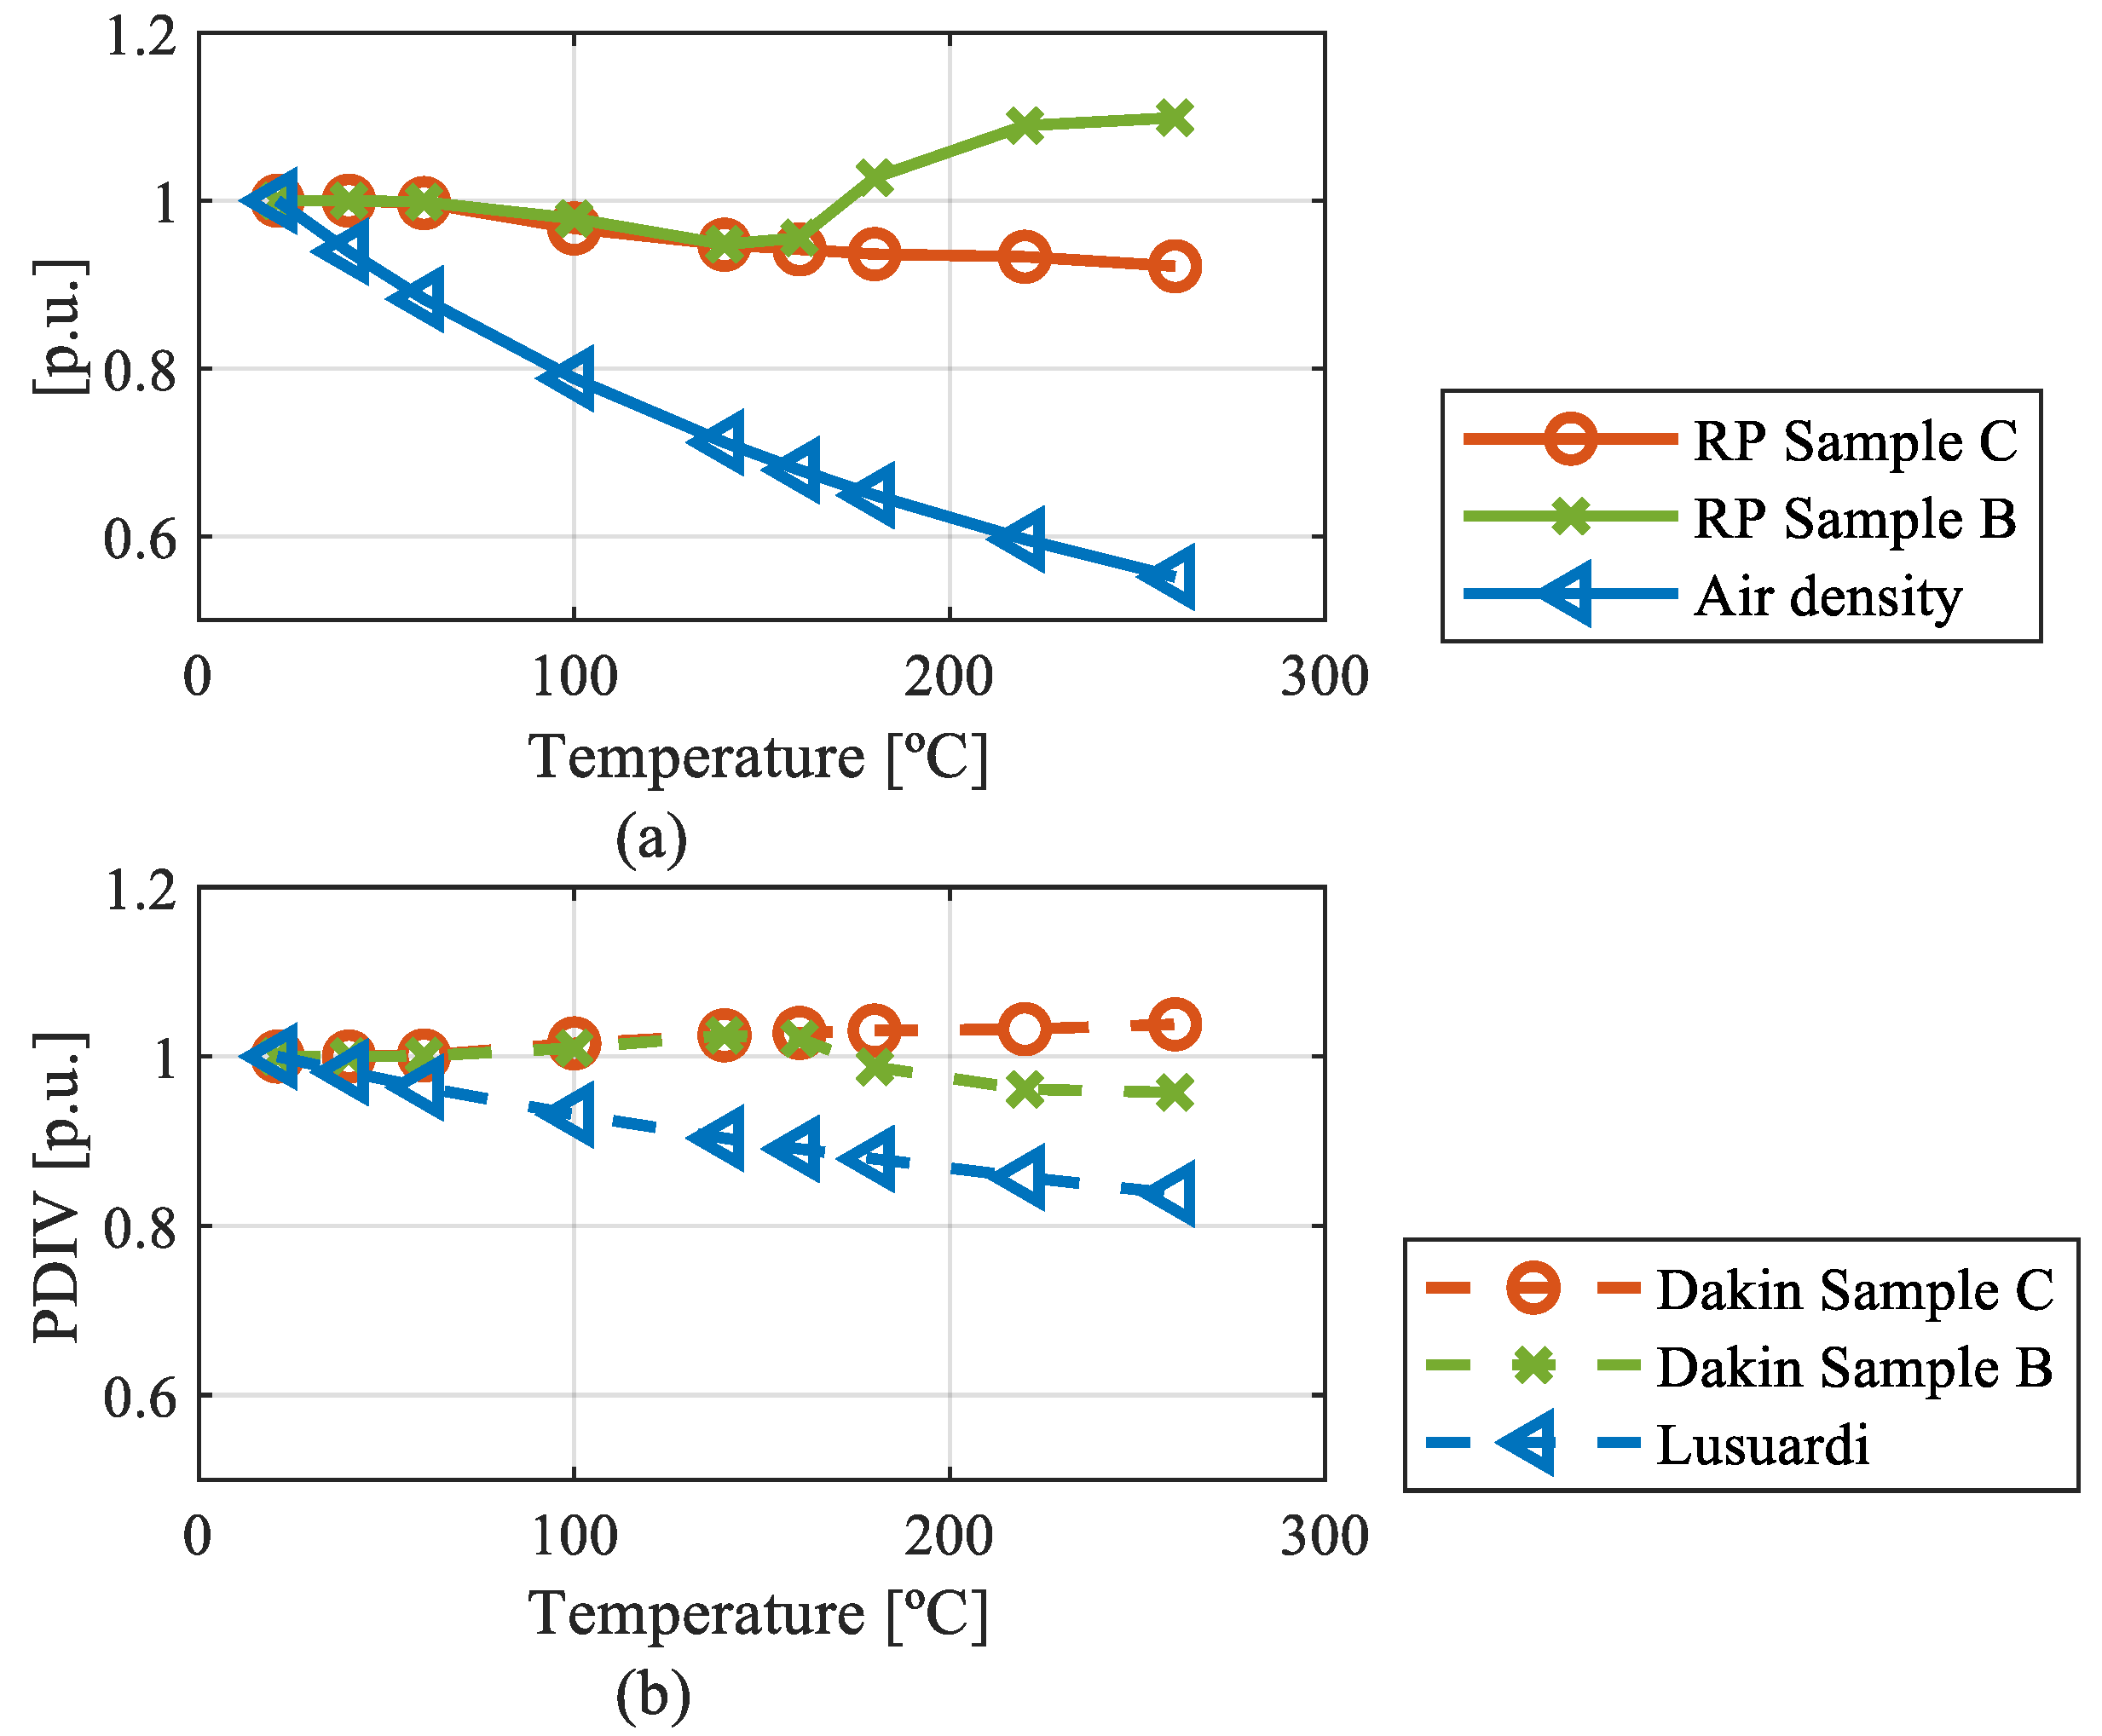
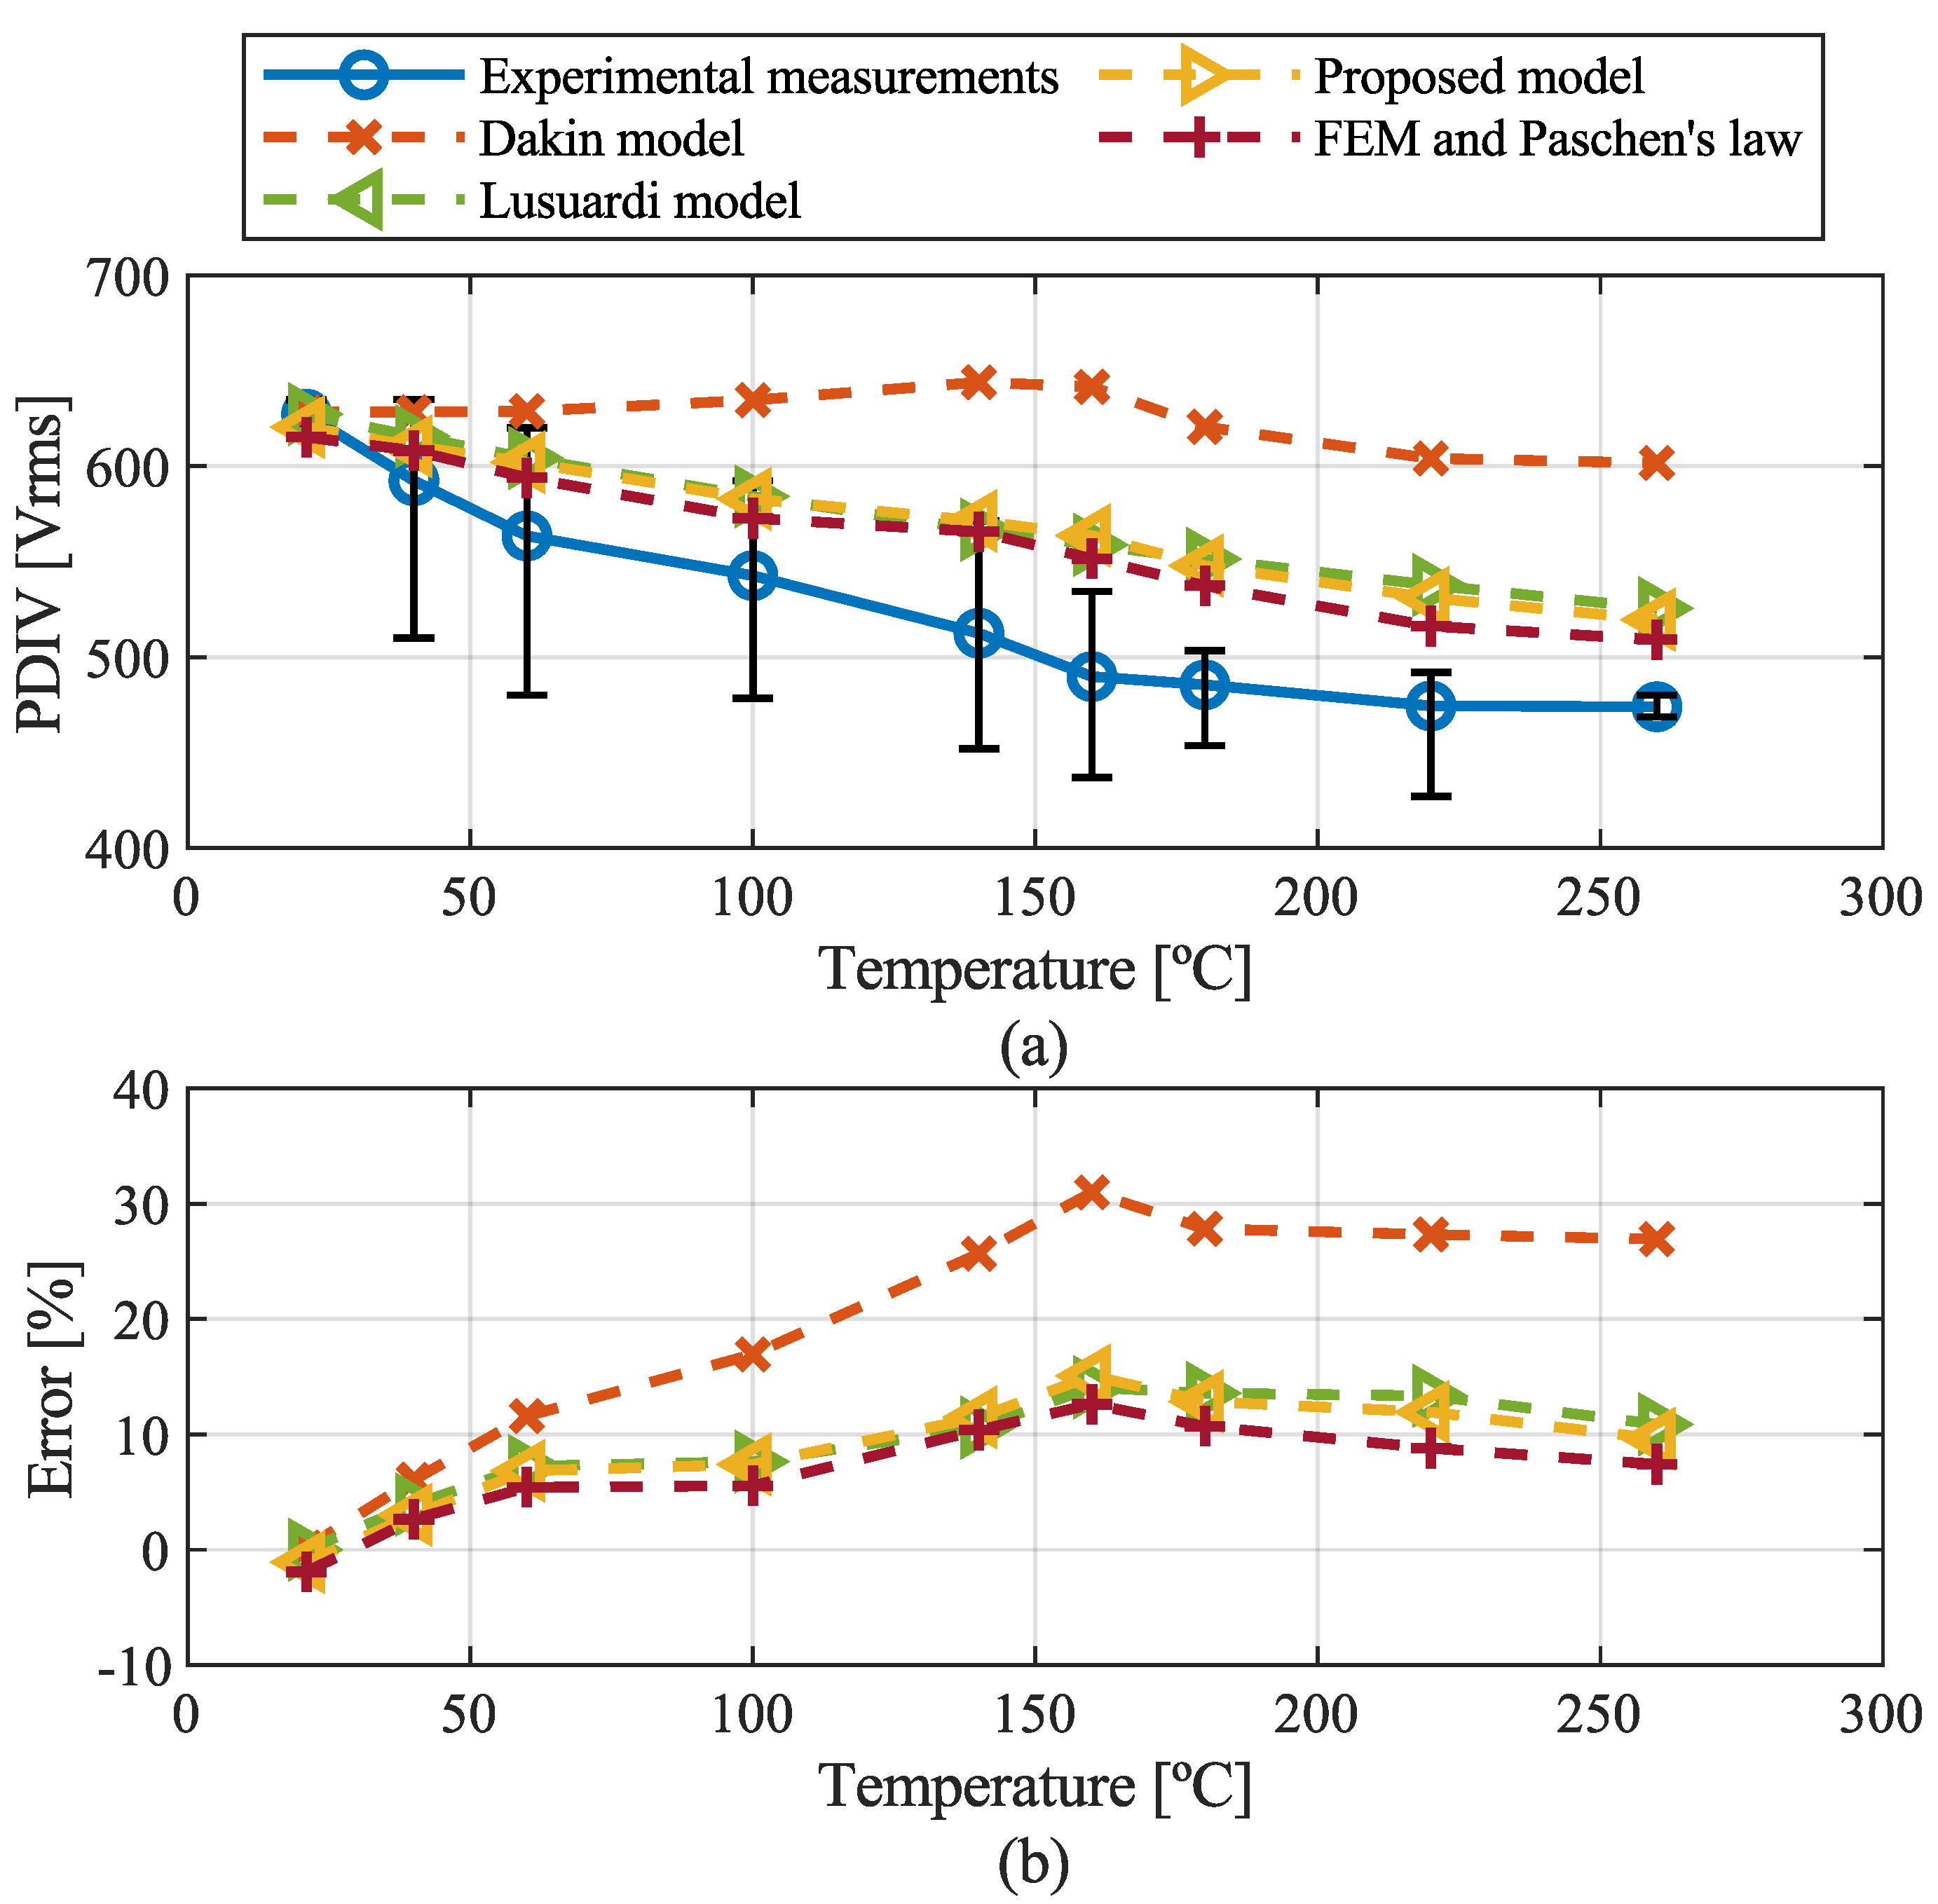
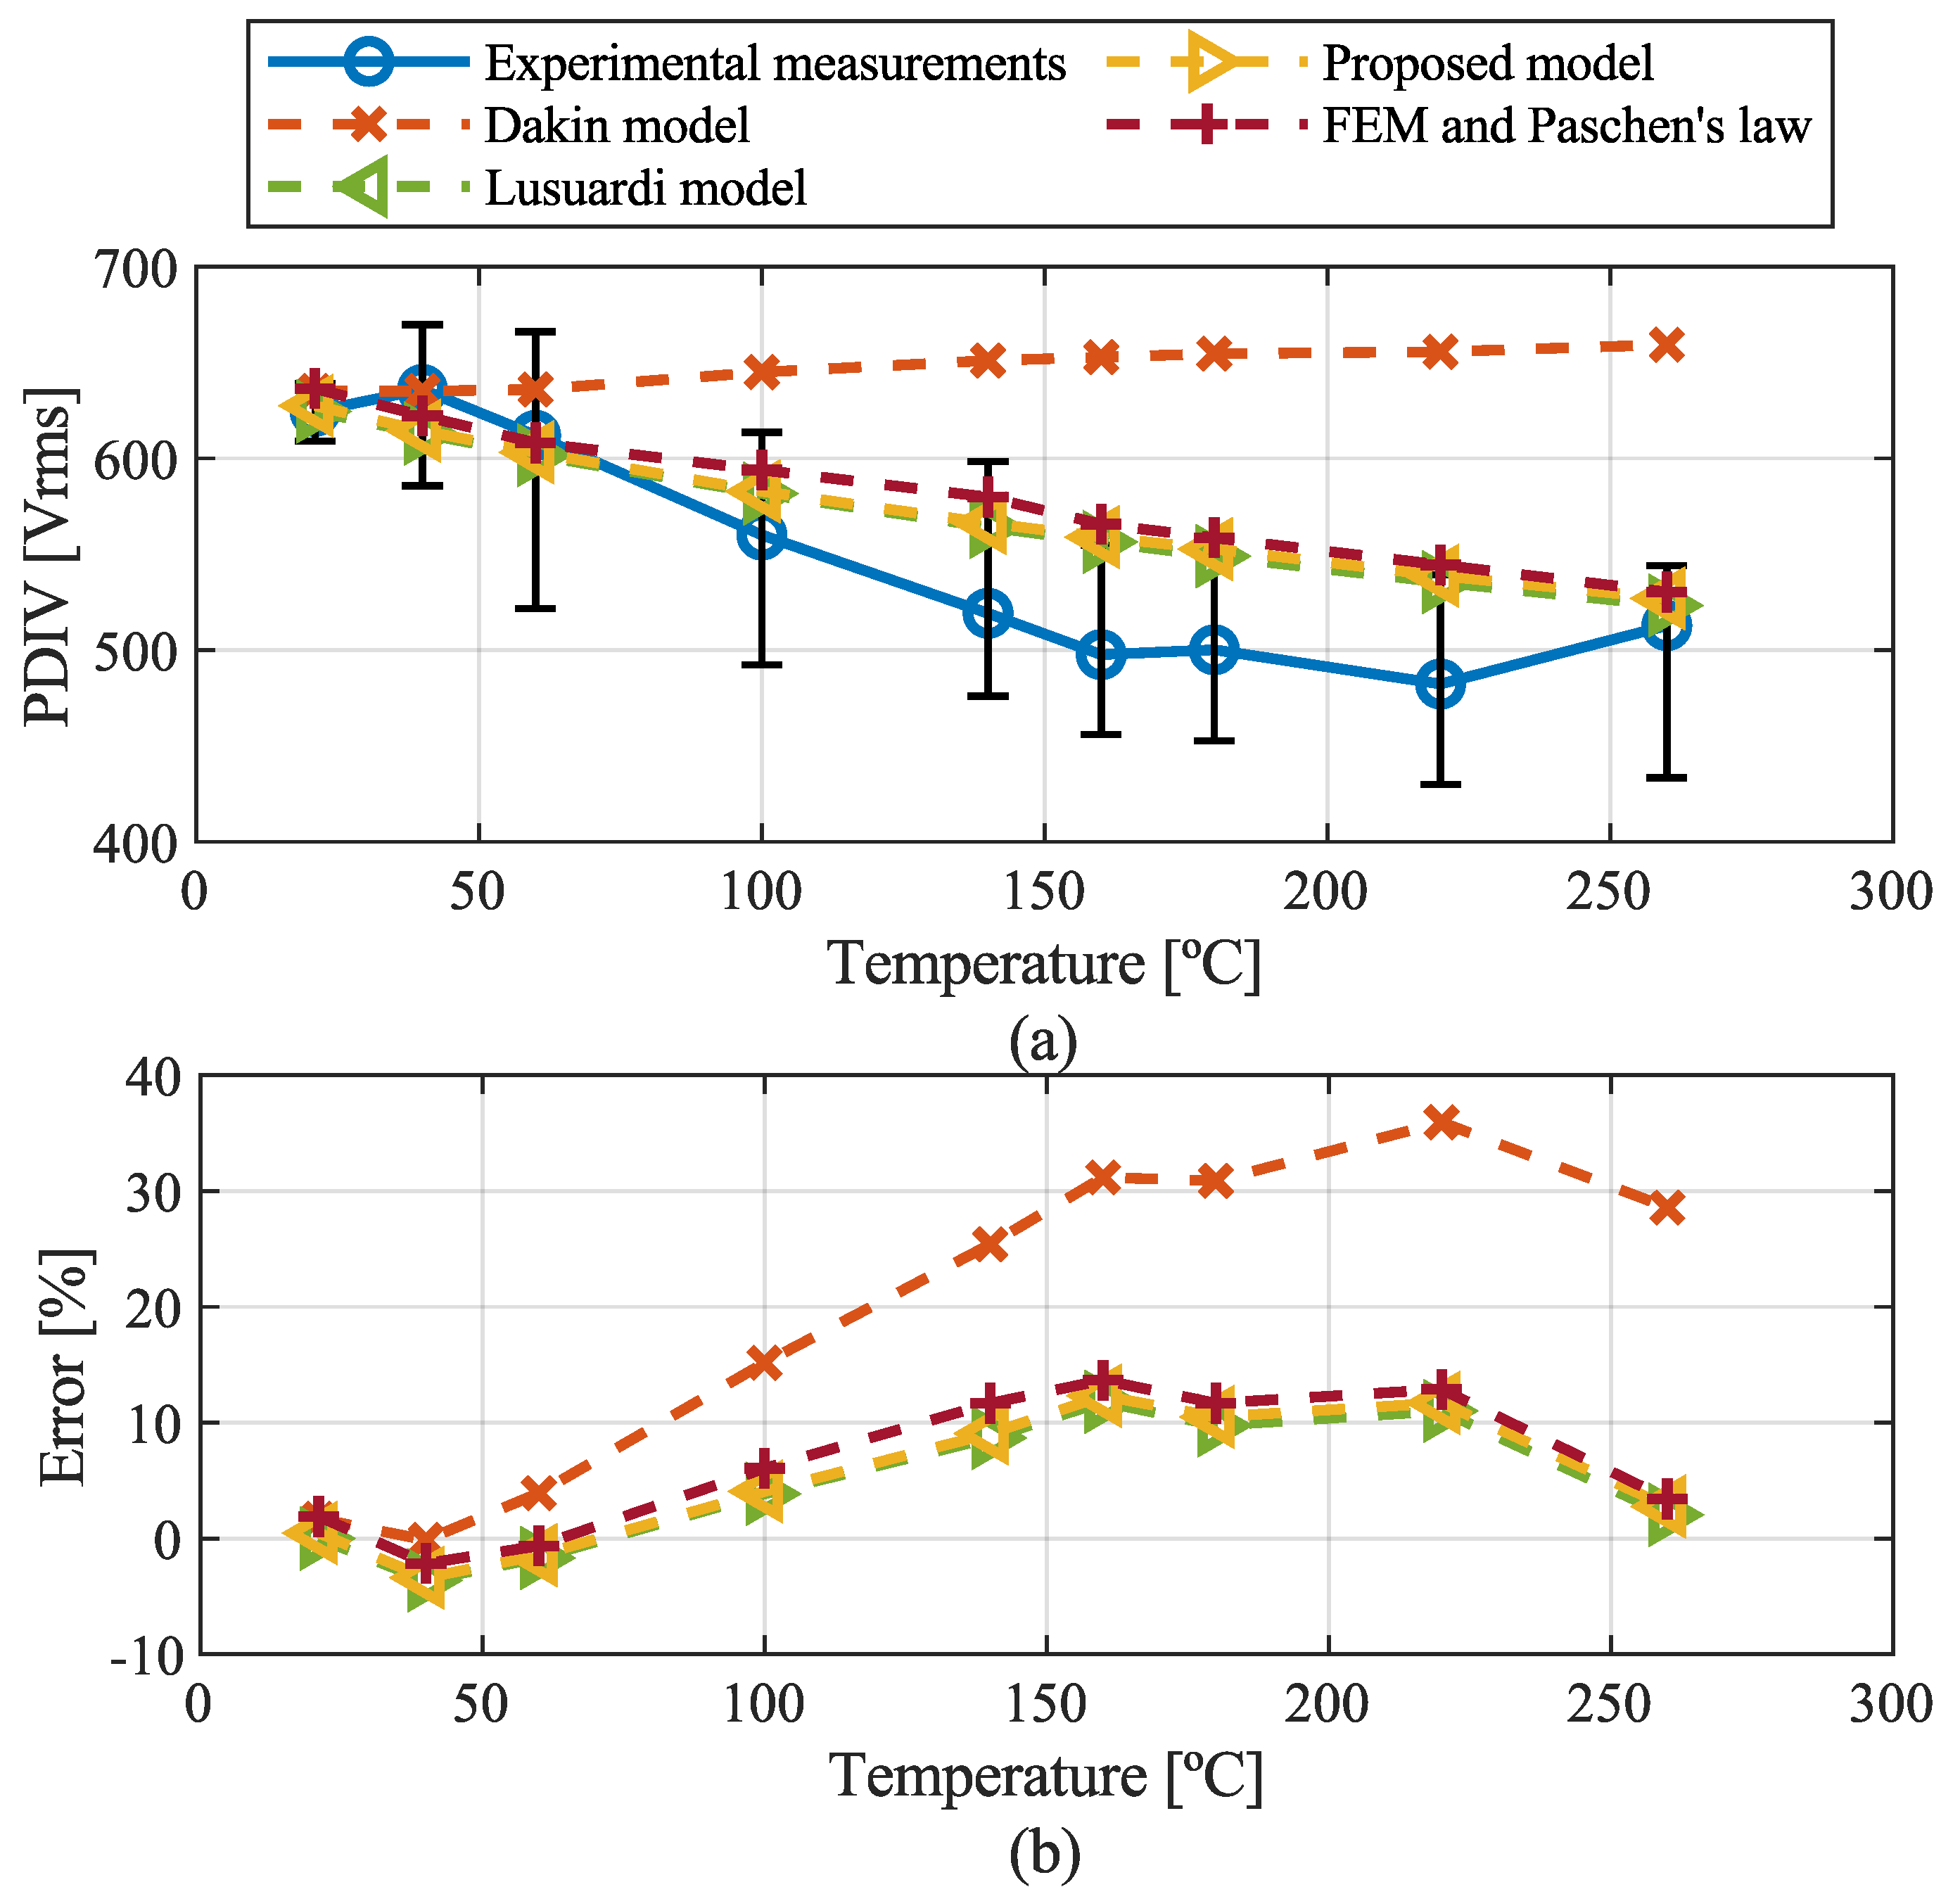
4.1. The Effect of Temperature on PDIV
4.2. Performance of PDIV Models for Variable Temperature
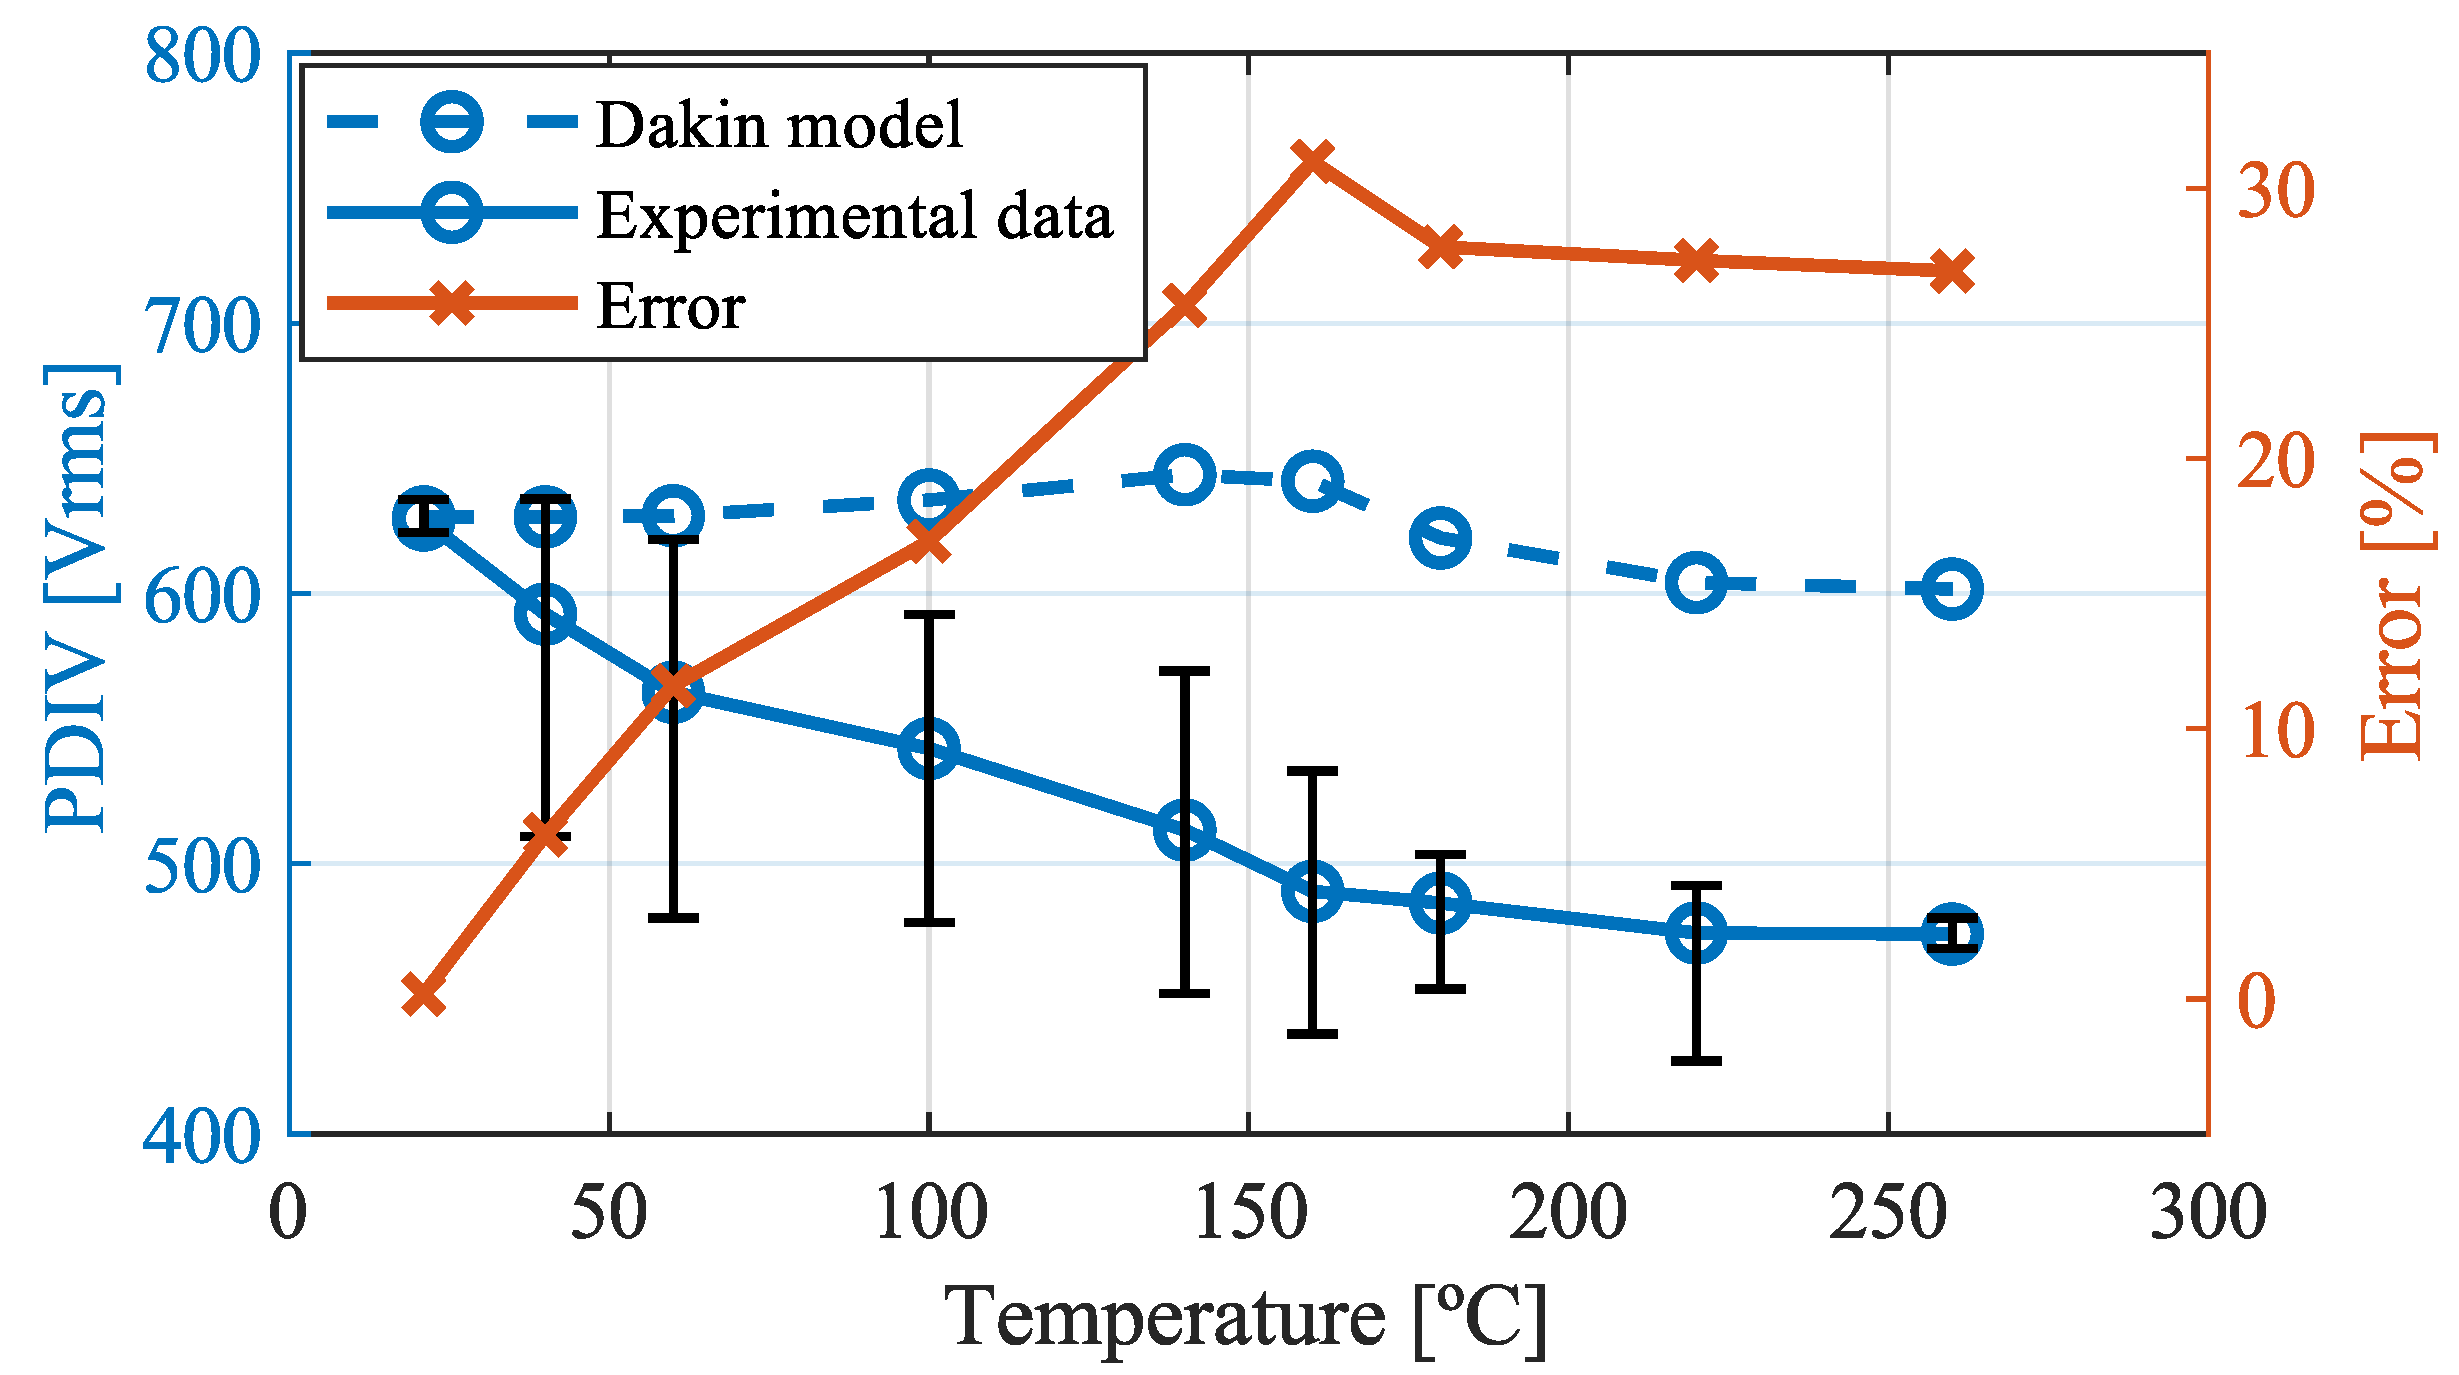
4.2.1. Dakin Model
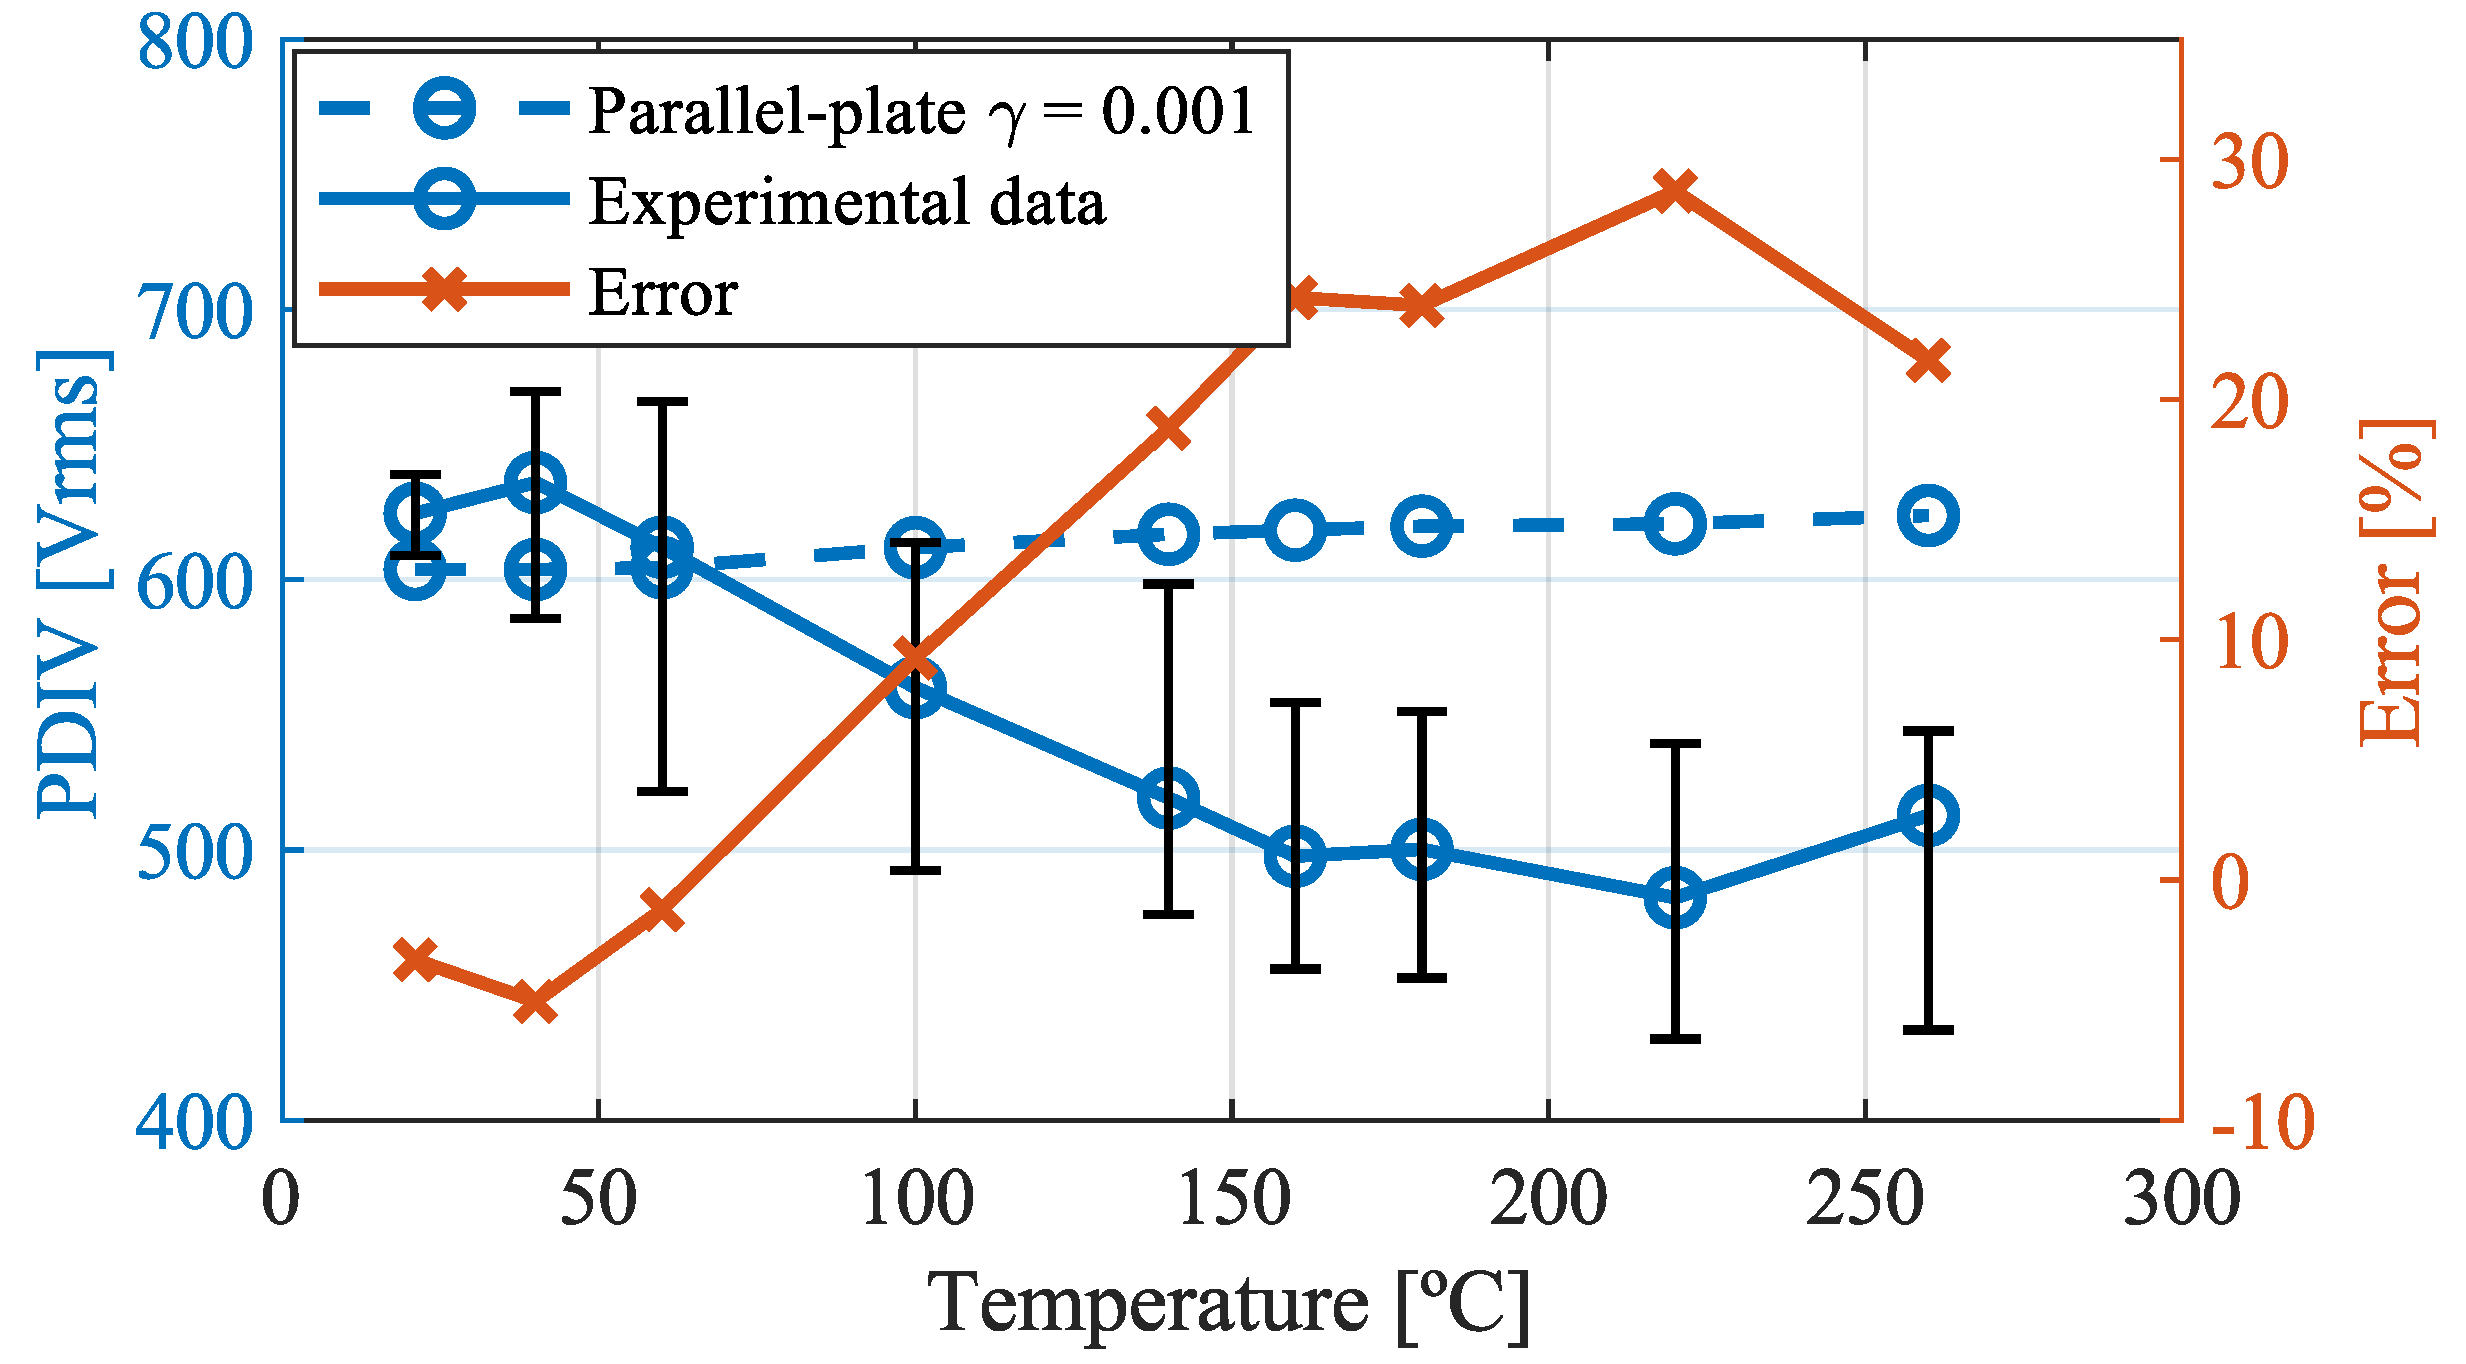
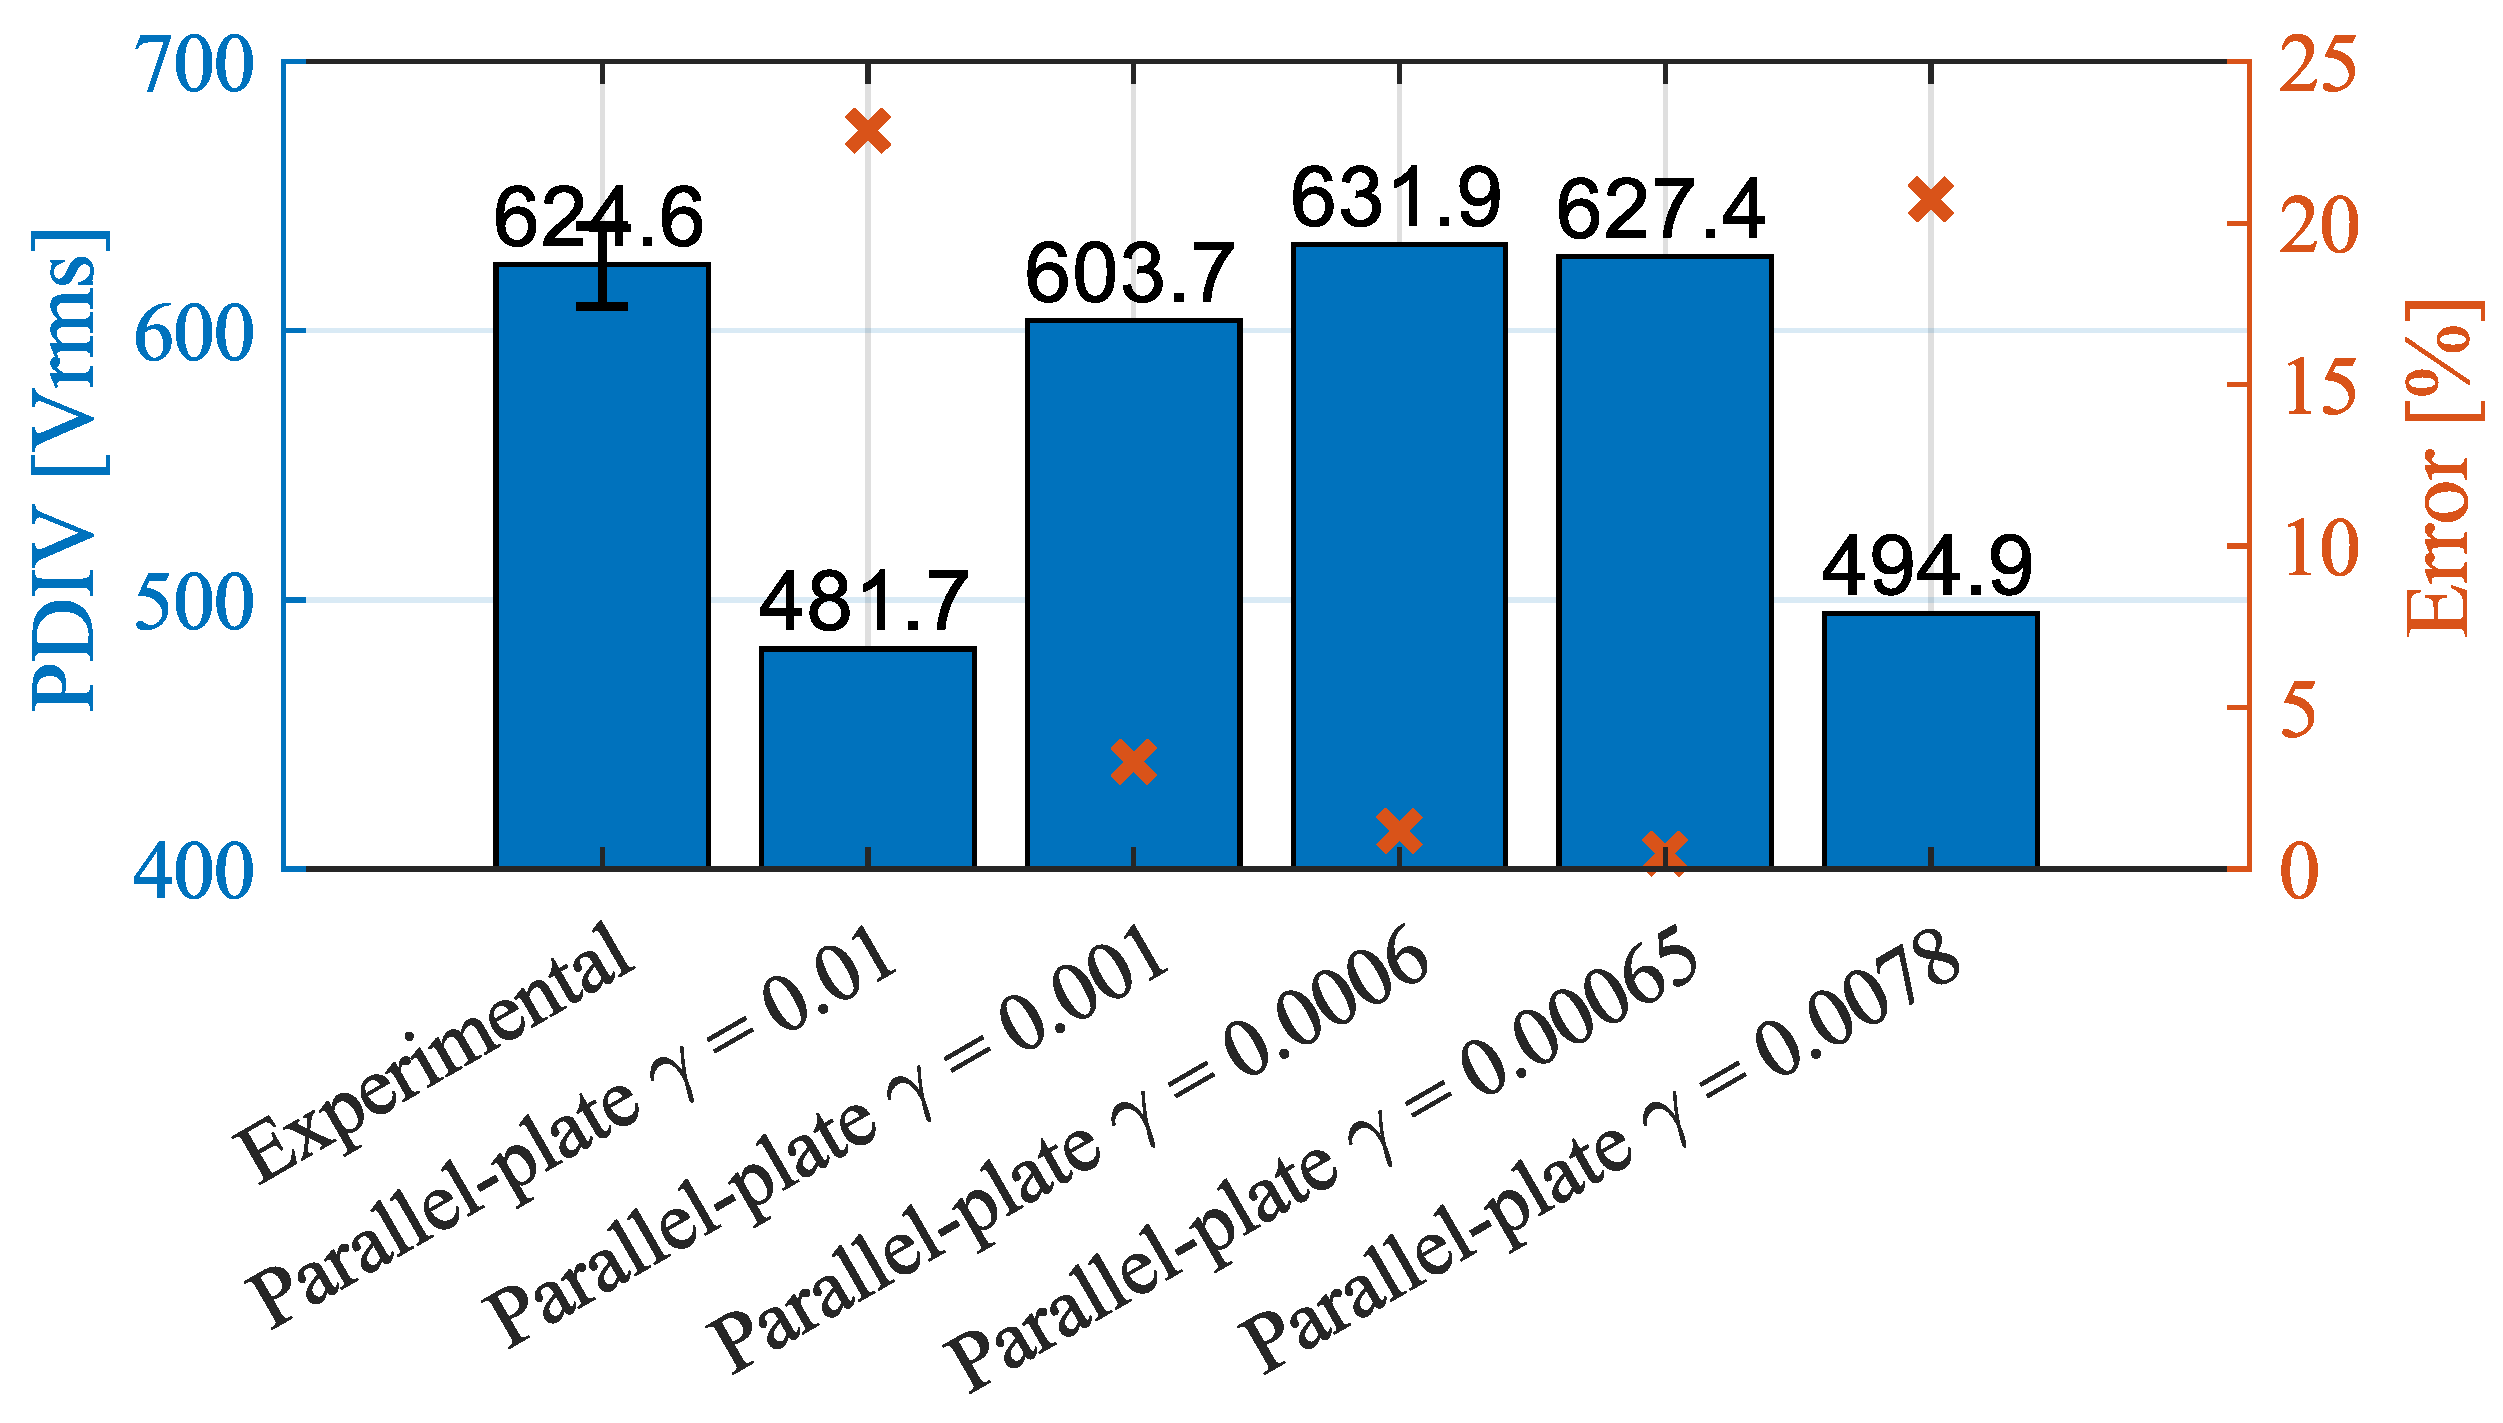
4.2.2. Parallel-Plate Capacitor Model
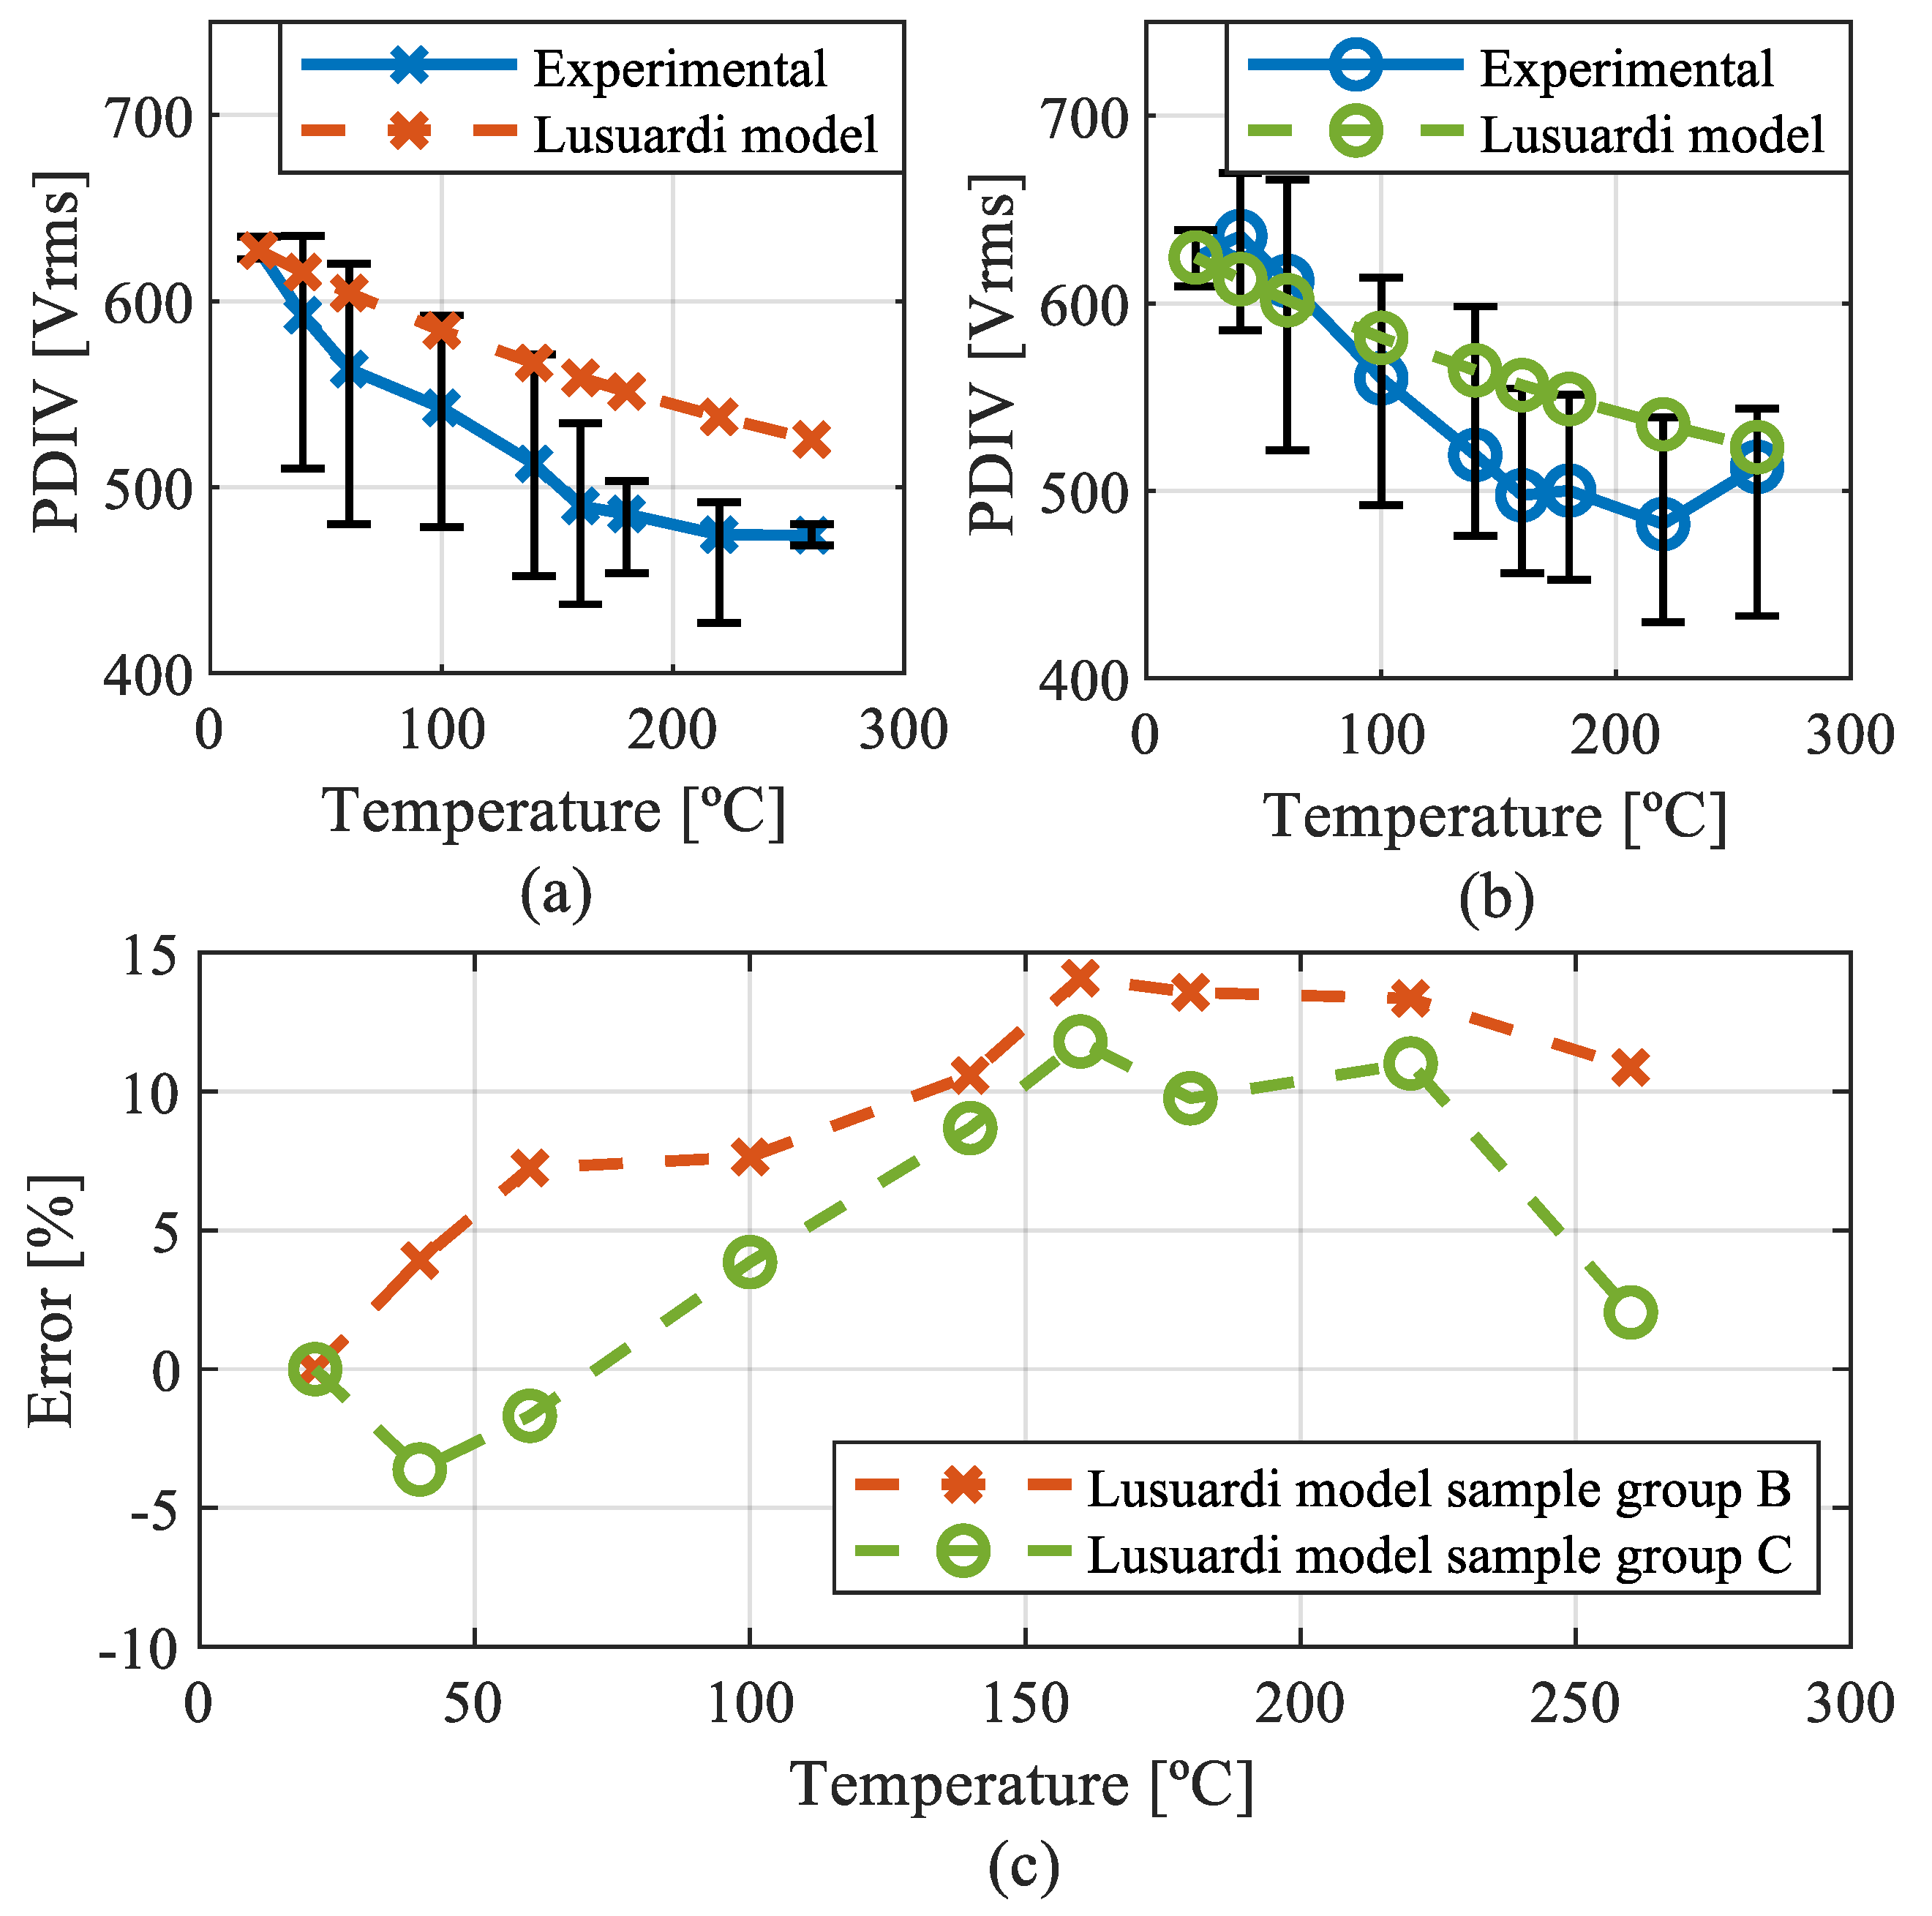
4.2.3. Lusuardi Model
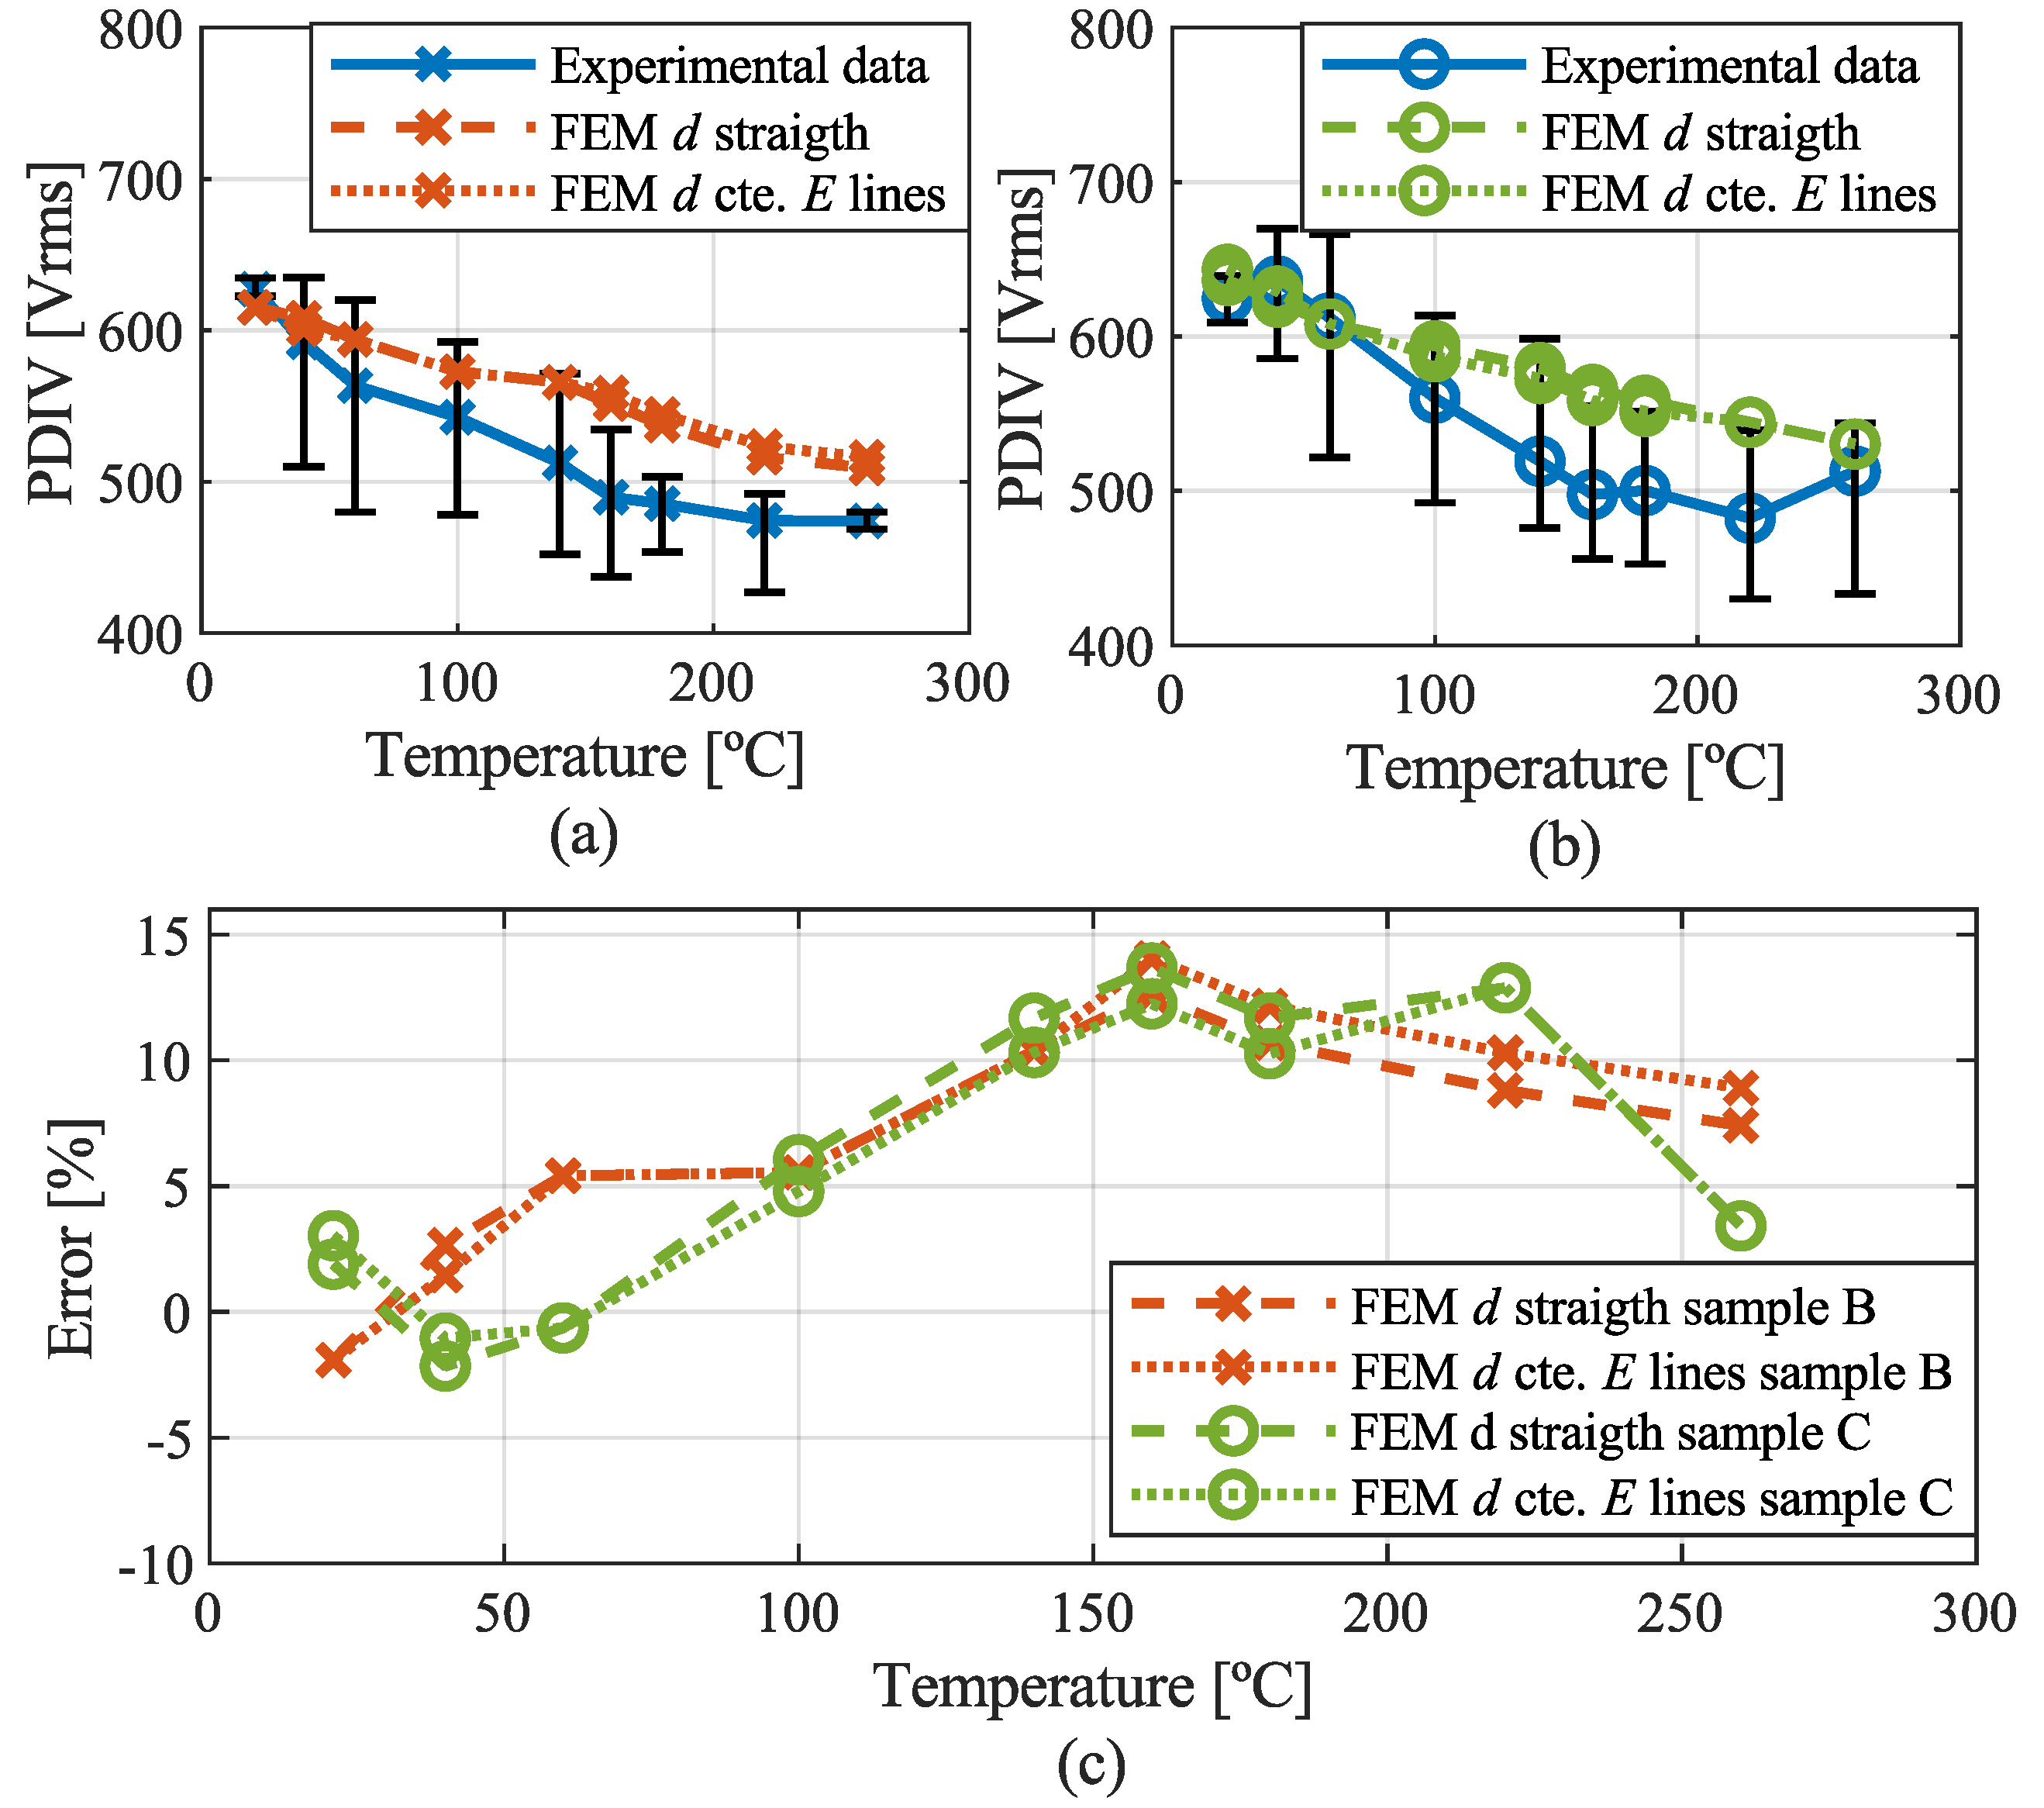
4.2.4. FEM and Paschen’s Law
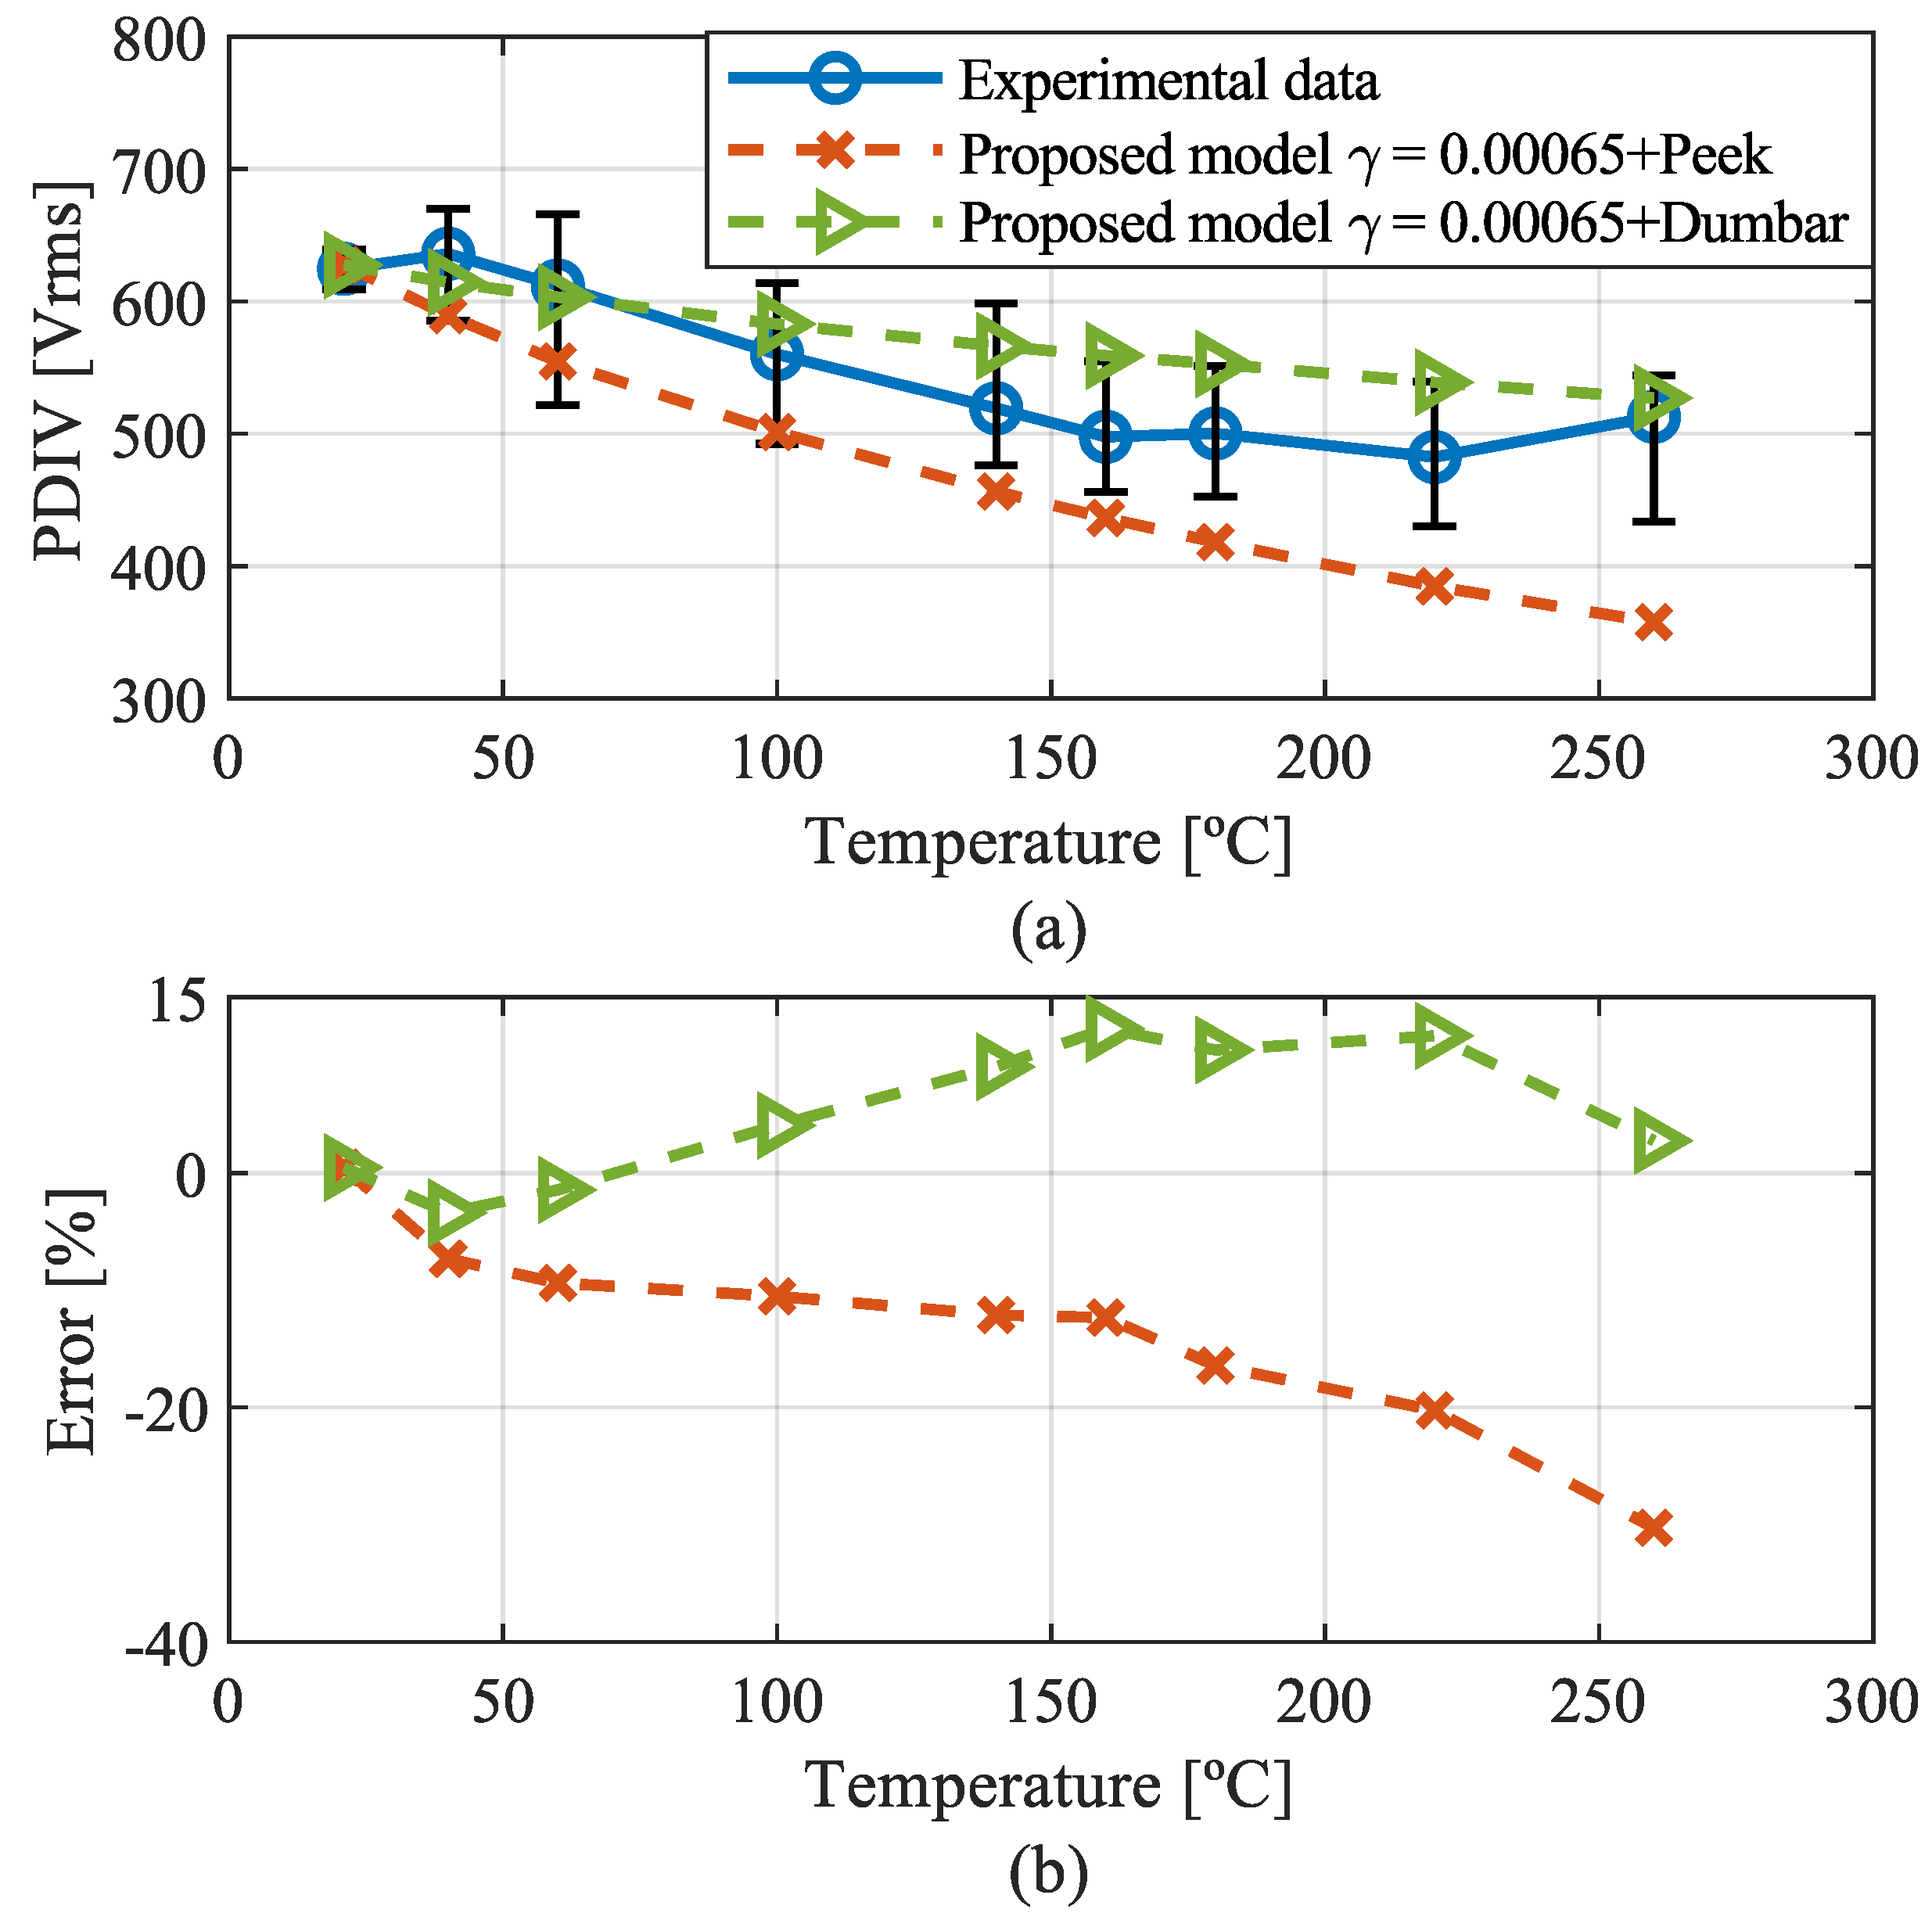
4.2.5. Proposed Model
4.2.6. Comparison of Models
5. Discussion
5.1. Variables Affecting PDIV
5.2. PDIV Estimation Models
6. Conclusions
Author Contributions
Funding
Institutional Review Board Statement
Informed Consent Statement
Data Availability Statement
Conflicts of Interest
Abbreviations
| EV | Electric Vehicle |
| RH | Relative Humidity |
| AC | Alternating Current |
| DC | Direct Current |
| PD | Partial Discharge |
| PDIV | Partial Discharge inception Voltage |
| RPDIV | Repetitive Partial Discharge inception Voltage |
| RP | Relative Permittivity |
| FEM | Finite Element Method |
References
- Commission, E. European Green Deal: Commission Proposes Transformation of EU Economy and Society to Meet Climate Ambitions. 2021. Available online: https://ec.europa.eu/commission/presscorner/detail/en/IP_21_3541 (accessed on 1 August 2022).
- Laszlo, B. Introduction to the Fundamental Technologies of Power Density—Power Management—Technical Articles—TI E2E Support Forums. 2020. Available online: https://e2e.ti.com/blogs_/b/powerhouse/posts/introduction-to-the-fundamental-technologies-of-power-density (accessed on 1 August 2022).
- Morya, A.K.; Gardner, M.C.; Anvari, B.; Liu, L.; Yepes, A.G.; Doval-Gandoy, J.; Toliyat, H.A. Wide Bandgap Devices in AC Electric Drives: Opportunities and Challenges. IEEE Trans. Transp. Electrif. 2019, 5, 3–20. [Google Scholar] [CrossRef]
- Han, D.; Li, Y.; Sarlioglu, B. Analysis of SiC based power electronic inverters for high speed machines. In Proceedings of the 2015 IEEE Applied Power Electronics Conference and Exposition (APEC), Charlotte, NC, USA, 15–19 March 2015; pp. 304–310. [Google Scholar] [CrossRef]
- Kumar, K.; Santra, S.B. Performance Analysis of a Three-Phase Propulsion Inverter for Electric Vehicles Using GaN Semiconductor Devices. IEEE Trans. Ind. Appl. 2018, 54, 6247–6257. [Google Scholar] [CrossRef]
- Xu, Y.; Yuan, X.; Ye, F.; Wang, Z.; Zhang, Y.; Diab, M.; Zhou, W. Impact of High Switching Speed and High Switching Frequency of Wide-Bandgap Motor Drives on Electric Machines. IEEE Access 2021, 9, 82866–82880. [Google Scholar] [CrossRef]
- Morya, A.; Toliyat, H.A. Insulation design for Wide Bandgap (WBG) device based voltage source converter fed motors. In Proceedings of the 2017 IEEE 5th Workshop on Wide Bandgap Power Devices and Applications (WiPDA), Albuquerque, NM, USA, 30 October–1 November 2017; pp. 74–79. [Google Scholar] [CrossRef]
- Carlsson, A.; Josefsson, V.; Nategh, S.; Boglietti, A.; Arvidsson, R. Insulation System Design for 800 V Traction Motors Used in E-mobility Applications. In Proceedings of the 2022 International Conference on Electrical Machines (ICEM), Valencia, Spain, 5–8 September 2022; pp. 1321–1326. [Google Scholar] [CrossRef]
- He, J.; Chen, H.; Katebi, R.; Weise, N.; Demerdash, N.A. Mitigation of uneven surge voltage stress on stator windings of induction motors fed by SiC-MOSFET-based adjustable speed drives. In Proceedings of the 2017 IEEE International Electric Machines and Drives Conference (IEMDC), Miami, FL, USA, 21–24 May 2017; pp. 1–7. [Google Scholar] [CrossRef]
- IEC 60034-18-41:2014; Rotating Electrical Machines—Part 18-41: Partial Discharge Free Electrical Insulation Systems (Type I) Used in Rotating Electrical Machines Fed from Voltage Converters—Qualification and Quality Control Tests. IEC: Geneva, Switzerland, 2014.
- Scott, M.J.; Brockman, J.; Hu, B.; Fu, L.; Xu, L.; Wang, J.; Darbali Zamora, R. Reflected wave phenomenon in motor drive systems using wide bandgap devices. In Proceedings of the 2014 IEEE Workshop on Wide Bandgap Power Devices and Applications, Knoxville, TN, USA, 13–15 October 2014; pp. 164–168. [Google Scholar] [CrossRef]
- Selema, A.; Ibrahim, M.N.; Sergeant, P. Electrical Machines Winding Technology: Latest Advancements for Transportation Electrification. Machines 2022, 10, 563. [Google Scholar] [CrossRef]
- Hemmati, R.; Wu, F.; El-Refaie, A. Survey of Insulation Systems in Electrical Machines. In Proceedings of the 2019 IEEE International Electric Machines & Drives Conference (IEMDC), San Diego, CA, USA, 12–15 May 2019; pp. 2069–2076. [Google Scholar] [CrossRef] [Green Version]
- Cruz, J.d.S.; Fruett, F.; da Rocha Lopes, R.; Takaki, F.L.; de Andrade Tambascia, C.; de Lima, E.R.; Giesbrecht, M. Partial Discharges Monitoring for Electric Machines Diagnosis: A Review. Energies 2022, 15, 7966. [Google Scholar] [CrossRef]
- He, J.; Li, C.; Jassal, A.; Thiagarajan, N.; Zhang, Y.; Prabhakaran, S.; Feliz, C.; Graham, J.; Kang, X. Multi-Domain Design Optimization of dv/dt Filter for SiC-Based Three-Phase Inverters in High-Frequency Motor-Drive Applications. In Proceedings of the 2018 IEEE Energy Conversion Congress and Exposition (ECCE), Portland, OR, USA, 23–27 September 2018; pp. 5215–5222. [Google Scholar] [CrossRef]
- Montanari, G.C.; Seri, P. The effect of inverter characteristics on partial discharge and life behavior of wire insulation. IEEE Electr. Insul. Mag. 2018, 34, 32–39. [Google Scholar] [CrossRef]
- Grau, V.; De Doncker, R.W. The Effects of Steep Voltage Slopes on Insulation Systems of Coil Windings caused by Next Generation Power Semiconductor Devices. In Proceedings of the 2019 IEEE Electrical Insulation Conference (EIC), Calgary, AB, Canada, 16–19 June 2019; pp. 26–29. [Google Scholar] [CrossRef]
- Florkowski, M.; Florkowska, B.; Zydron, P. Partial Discharges in Insulating Systems of Low Voltage Electric Motors Fed by Power Electronics—Twisted-Pair Samples Evaluation. Energies 2019, 12, 768. [Google Scholar] [CrossRef]
- Akram, S.; Wang, P.; Nazir, M.T.; Zhou, K.; Bhutta, M.S.; Hussain, H. Impact of impulse voltage frequency on the partial discharge characteristic of electric vehicles motor insulation. Eng. Fail. Anal. 2020, 116, 104767. [Google Scholar] [CrossRef]
- Guastavino, F.; Dardano, A.; Ratto, A.; Torello, E. Electrical aging test on twisted pair specimens under different environmental conditions. In Proceedings of the Conference on Electrical Insulation and Dielectric Phenomena, CEIDP, Virginia Beach, VA, USA, 18–21 October 2009; pp. 81–84. [Google Scholar] [CrossRef]
- Savin, S.; Ait-Amar, S.; Roger, D. Turn-to-turn capacitance variations correlated with PDIV for AC motors monitoring. IEEE Trans. Dielectr. Electr. Insul. 2013, 20, 34–41. [Google Scholar] [CrossRef]
- Liu, X.; Zhang, T.; Bai, Y.; Ding, X.; Wang, Y. Effects of accelerated repetitive impulse voltage aging on performance of model stator insulation of wind turbine generator. IEEE Trans. Dielectr. Electr. Insul. 2014, 21, 1506–1515. [Google Scholar] [CrossRef]
- Succi, R.; Han, T.; Cavallini, A. An Investigation on the Dielectric Properties of Thermally-Aged Kapton and its Capability to Withstand Partial Discharges. In Proceedings of the 2019 IEEE Conference on Electrical Insulation and Dielectric Phenomena (CEIDP), Richland, WA, USA, 20–23 October 2019; pp. 381–384. [Google Scholar] [CrossRef]
- Guastavino, F.; Briano, L.; Gallesi, F.; Torello, E. Effect of Thermal Stress Over the Partial Discharge Inception Voltage on Twisted Pairs. In Proceedings of the 2020 IEEE Conference on Electrical Insulation and Dielectric Phenomena (CEIDP), East Rutherford, NJ, USA, 18–30 October 2020; pp. 366–368. [Google Scholar] [CrossRef]
- Lehr, J.; Ron, P. Electrical Breakdown in Gases; John Wiley & Sons, Inc.: Hoboken, NJ, USA, 2017; pp. 369–438. [Google Scholar] [CrossRef]
- Lusuardi, L.; Rumi, A.; Cavallini, A.; Barater, D.; Nuzzo, S. Partial Discharge Phenomena in Electrical Machines for the More Electrical Aircraft. Part II: Impact of Reduced Pressures and Wide Bandgap Devices. IEEE Access 2021, 9, 27485–27495. [Google Scholar] [CrossRef]
- Abadie, C.; Billard, T.; Lebey, T. Partial Discharges in Motor Fed by Inverter: From Detection to Winding Configuration. IEEE Trans. Ind. Appl. 2019, 55, 1332–1341. [Google Scholar] [CrossRef]
- Meyer, D.R.; Cavallini, A.; Lusuardi, L.; Barater, D.; Pietrini, G.; Soldati, A. Influence of impulse voltage repetition frequency on RPDIV in partial vacuum. IEEE Trans. Dielectr. Electr. Insul. 2018, 25, 873–882. [Google Scholar] [CrossRef]
- Fenger, M.; Stone, G.C. Investigations into the effect of humidity on stator winding partial discharges. IEEE Trans. Dielectr. Electr. Insul. 2005, 12, 341–346. [Google Scholar] [CrossRef]
- Radmilović-Radjenović, M.; Radjenović, B.; Nikitović, Ž.; Matejčik, Š.; Klas, M. The humidity effect on the breakdown voltage characteristics and the transport parameters of air. Nucl. Instruments Methods Phys. Res. Sect. B: Beam Interact. Mater. Atoms 2012, 279, 103–105. [Google Scholar] [CrossRef]
- Hayakawa, N.; Shimizu, F.; Okubo, H. Estimation of partial discharge inception voltage of magnet wires under inverter surge voltage by volume-time theory. IEEE Trans. Dielectr. Electr. Insul. 2012, 19, 550–557. [Google Scholar] [CrossRef]
- Fabiani, D.; Montanari, G.C.; Testa, L.; Schifani, R.; Guastavino, F.; Bellucci, F.; Deorsola, F. Effect of water adsorption on the dielectric properties of polymer nanocomposites. In Proceedings of the International Symposium on Electrical Insulating Materials, Yokkaichi, Japan, 7–11 September 2008; pp. 510–513. [Google Scholar] [CrossRef]
- Fabiani, D.; Montanari, G.C.; Cavallini, A.; Mazzanti, G. Relation between space charge accumulation and partial discharge activity in enameled wires under PWM-like voltage waveforms. IEEE Trans. Dielectr. Electr. Insul. 2004, 11, 393–405. [Google Scholar] [CrossRef]
- Han, T.; Cavallini, A. Dielectric properties and partial discharge endurance of thermally aged nano-structured polyimide. IEEE Electr. Insul. Mag. 2020, 36, 39–46. [Google Scholar] [CrossRef]
- Kikuchi, Y.; Murata, T.; Fukumoto, N.; Nagata, M.; Wakimoto, Y.; Yoshimitsu, T. Investigation of partial discharge with twisted enameled wires in atmospheric humid air by optical emission spectroscopy. IEEE Trans. Dielectr. Electr. Insul. 2010, 17, 839–845. [Google Scholar] [CrossRef]
- Kimura, K.; Hikita, M.; Hayakawa, N.; Nagata, M.; Kadowaki, K.; Murakami, Y. Round-robin test on repetitive PD inception voltage of twisted-pairs. In Proceedings of the Conference on Electrical Insulation and Dielectric Phenomena, CEIDP, West Lafayette, IN, USA, 17–20 October 2010; pp. 5–8. [Google Scholar] [CrossRef]
- Matsumoto, S.; Nam, N.N.; Nagaba, D.; Ogiya, T. Partial discharge characteristics of twisted magnet wire under high frequency AC voltage. In Proceedings of the International Symposium on Electrical Insulating Materials, Niigata, Japan, 1–5 June 2014; pp. 57–60. [Google Scholar] [CrossRef]
- Muto, D.; Oya, M.; Aoi, T.; Ueno, T. A study on partial discharge phenomena of winding wires. Furukawa Rev. 2014, 45, 13–21. [Google Scholar]
- Hassan, W.; Hussain, G.A.; Mahmood, F.; Amin, S.; Lehtonen, M. Effects of Environmental Factors on Partial Discharge Activity and Estimation of Insulation Lifetime in Electrical Machines. IEEE Access 2020, 8, 108491–108502. [Google Scholar] [CrossRef]
- He, J.; Wu, G.; Gao, B.; Wu, J. Study on aging characteristics for inverter-fed traction motor inter-turn insulation based on analysis of dielectric characteristic parameters. In Proceedings of the Conference on Electrical Insulation and Dielectric Phenomena, CEIDP, Vancouver, BC, Canada, 14–17 October 2007; pp. 81–84. [Google Scholar] [CrossRef]
- Zenda, Y.; Takenouchi, S.; Kozako, M.; Hikita, M.; Okamoto, T.; Jintong, S.; Izumi, A.; Karasawa, K. Effect of Temperature on RPDIV of Enamel Twisted Pair under Repetitive Impulse Voltage Application with Different Rise Time. In Proceedings of the Conference on Electrical Insulation and Dielectric Phenomena, CEIDP, Vancouver, BC, Canada, 12–15 December 2021; pp. 603–606. [Google Scholar] [CrossRef]
- Aakre, T.G.; Ildstad, E.; Hvidsten, S. Partial discharge inception voltage of voids enclosed in epoxy/mica versus voltage frequency and temperature. IEEE Trans. Dielectr. Electr. Insul. 2020, 27, 214–221. [Google Scholar] [CrossRef]
- Wei, Z.; You, H.; Fu, P. Twisted Pairs Under Single Voltage Pulses Generated by Silicon-Carbide Devices. IEEE Trans. Transp. Electrif. 2022, 8, 1674–1683. [Google Scholar] [CrossRef]
- Montanari, G.C.; Seri, P. About the Definition of PDIV and RPDIV in Designing Insulation Systems for Rotating Machines Controlled by Inverters. In Proceedings of the 2018 IEEE Electrical Insulation Conference (EIC), San Antonio, TX, USA, 17–20 June 2018; pp. 554–557. [Google Scholar] [CrossRef]
- Wang, P.; Zhou, W.; Wang, K.; Li, J.; Zhou, Q.; Lei, Y. Comparison of PD characteristics for inverter-fed motor insulation under inusoidal and repetitive square wave voltage conditions. Gaodianya Jishu/High Volt. Eng. 2016, 42, 3895–3900. [Google Scholar] [CrossRef]
- Rumi, A.; Cavallini, A.; Lusuardi, L. Impact of WBG Converter Voltage Rise-Time and Switching Frequency on the PDIV of Twisted Pairs. In Proceedings of the 2020 IEEE 3rd International Conference on Dielectrics, ICD 2020, Valencia, Spain, 5–31 July 2020; pp. 902–905. [Google Scholar] [CrossRef]
- Wei, Z.; You, H.; Hu, B.; Na, R.; Wang, J. Partial Discharge Behavior on Twisted Pair under Ultra-short Rise Time Square-wave Excitations. In Proceedings of the 2019 IEEE Electrical Insulation Conference (EIC), Calgary, AB, Canada, 16–19 June 2019; pp. 493–496. [Google Scholar] [CrossRef]
- Wang, P.; Cavallini, A.; Montanari, G.C. The influence of square wave voltage duty cycle on PD behavior. In Proceedings of the Conference on Electrical Insulation and Dielectric Phenomena, CEIDP, Ann Arbor, MI, USA, 18–21 October 2015; pp. 338–341. [Google Scholar] [CrossRef]
- Wang, P.; Yang, N.; Zheng, C.; Li, Y. Effect of repetitive impulsive and square wave voltage frequency on partial discharge features. In Proceedings of the IEEE International Conference on Properties and Applications of Dielectric Materials, Xi’an, China, 20–24 May 2018; pp. 152–155. [Google Scholar] [CrossRef]
- Wang, P.; Cavallini, A.; Montanari, G.C. The influence of impulsive voltage frequency on PD features in turn insulation of inverter-fed motors. In Proceedings of the 2014 IEEE Conference on Electrical Insulation and Dielectric Phenomena, CEIDP 2014, Des Moines, IA, USA, 19–22 October 2014; pp. 35–38. [Google Scholar] [CrossRef]
- Pan, C.; Wu, K.; Chen, G.; Gao, Y.; Florkowski, M.; Lv, Z.; Tang, J. Understanding Partial Discharge Behavior from the Memory Effect Induced by Residual Charges: A Review. IEEE Trans. Dielectr. Electr. Insul. 2020, 27, 1951–1965. [Google Scholar] [CrossRef]
- Cavallini, A.; Lindell, E.; Montanari, G.C.; Tozzi, M. Inception of partial discharges under repetitive square voltages: Effect of voltage waveform and repetition rate on PDIV and RPDIV. In Proceedings of the 2010 Annual Report Conference on Electrical Insulation and Dielectic Phenomena, West Lafayette, IN, USA, 17–20 October 2010; pp. 1–4. [Google Scholar] [CrossRef]
- Lusuardi, L.; Cavallini, A.; Degano, M. The impact of impulsive voltage waveforms on the electrical insulation of actuators for more electrical aircraft (MEA). In Proceedings of the IECON 2017—43rd Annual Conference of the IEEE Industrial Electronics Society, Beijing, China, 29 October–1 November 2017; pp. 4414–4418. [Google Scholar] [CrossRef]
- Naderiallaf, H.; Giangrande, P.; Galea, M. Investigating the Effect of Waveform Characteristics on PDEV, PDIV and RPDIV for Glass Fibre Insulated Wire. In Proceedings of the 2022 International Conference on Electrical Machines (ICEM), Valencia, Spain, 5–8 September 2022; pp. 1327–1333. [Google Scholar] [CrossRef]
- Hu, B.; Wei, Z.; You, H.; Na, R.; Liu, R.; Xiong, H.; Fu, P.; Zhang, J.; Wang, J. A Partial Discharge Study of Medium-Voltage Motor Winding Insulation Under Two-Level Voltage Pulses With High Dv/Dt. IEEE Open J. Power Electron. 2021, 2, 225–235. [Google Scholar] [CrossRef]
- Fu, P.; Zhao, Z.; Li, X.; Cui, X.; Yang, Z. The role of time-lag in the surface discharge inception under positive repetitive pulse voltage. Phys. Plasmas 2018, 25, 093518. [Google Scholar] [CrossRef]
- Benmamas, L.; Teste, P.; Odic, E.; Krebs, G.; Hamiti, T. Contribution to the analysis of PWM inverter parameters influence on the partial discharge inception voltage. IEEE Trans. Dielectr. Electr. Insul. 2019, 26, 146–152. [Google Scholar] [CrossRef]
- Husain, E.; Nema, R.S. Analysis of Paschen Curves for Air, N2 and SF6 Using the Townsend Breakdown Equation. IEEE Trans. Electr. Insul. 1982, EI-17, 350–353. [Google Scholar] [CrossRef]
- Szczepanski, M.; Fetouhi, L.; Sabatou, M.; Dreuilhe, S.; Pin, S.; Van de Steen, C.; Belijar, G. How does PDIV change during isothermal aging of magnet wire. In Proceedings of the 2022 IEEE Electrical Insulation Conference (EIC), Knoxville, TN, USA, 19–23 June 2022; pp. 266–271. [Google Scholar] [CrossRef]
- Madonna, V.; Giangrande, P.; Zhao, W.; Buticchi, G.; Zhang, H.; Gerada, C.; Galea, M. Reliability vs. Performances of Electrical Machines: Partial Discharges Issue. In Proceedings of the 2019 IEEE Workshop on Electrical Machines Design, Control and Diagnosis (WEMDCD), Athens, Greece, 22–23 April 2019; Volume 1, pp. 77–82. [Google Scholar] [CrossRef]
- Driendl, N.; Pauli, F.; Hameyer, K. Modeling of Partial Discharge Processes in Winding Insulation of Low-Voltage Electrical Machines Supplied by High du/dt Inverters. In Proceedings of the IECON 2019—45th Annual Conference of the IEEE Industrial Electronics Society, Lisbon, Portugal, 14–17 October 2019; Volume 1, pp. 7102–7107. [Google Scholar] [CrossRef]
- Collin, P.; Malec, D.; Lefevre, Y. About the relevance of using Paschen’s criterion for partial discharges inception voltage (PDIV) estimation when designing the electrical insulation system of inverter fed motors. In Proceedings of the 2019 IEEE Electrical Insulation Conference (EIC), Calgary, AB, Canada, 16–19 June 2019; pp. 513–516. [Google Scholar] [CrossRef]
- Duchesne, S.; Parent, G.; Moenecley, J.; Roger, D. Prediction of PDIV in motor coils using finite element method. In Proceedings of the 2016 IEEE International Conference on Dielectrics (ICD), Montpellier, France, 3–7 July 2016; Volume 2, pp. 638–641. [Google Scholar] [CrossRef]
- Nakaya, H.; Kozako, M.; Hikita, M.; Ohya, M.; Muto, D.; Tomizawa, K. Partial discharge inception voltage of enamel twisted-pair samples with several laminated insulation layers. In Proceedings of the 2013 Annual Report Conference on Electrical Insulation and Dielectric Phenomena, Chenzhen, China, 20–23 October 2013; pp. 1270–1273. [Google Scholar] [CrossRef]
- Sili, E.; Cambronne, J.P. A New Empirical Expression of the Breakdown Voltage for Combined Variations of Temperature and Pressure. Int. J. Aerosp. Mech. Eng. 2012, 6, 611–616. [Google Scholar]
- Chalise, S.R.; Grzybowski, S.; Taylor, C.D. Accelerated electrical degradation of machine winding insulation. In Proceedings of the 41st North American Power Symposium, Starkville, MS, USA, 4–6 October 2009; pp. 1–6. [Google Scholar] [CrossRef]
- Okubo, H.; Hayakawa, N.; Montanari, G.C. Technical Development on Partial Discharge Measurement and Electrical Insulation Techniques for Low Voltage Motors Driven by Voltage Inverters. IEEE Trans. Dielectr. Electr. Insul. 2007, 14, 1516–1530. [Google Scholar] [CrossRef]
- Hayakawa, N.; Okubo, H. Partial discharge characteristics of inverter-fed motor coil samples under ac and surge voltage conditions. IEEE Electr. Insul. Mag. 2005, 21, 5–10. [Google Scholar] [CrossRef]
- Benmamas, L.; Teste, P.; Krebs, G.; Odic, E.; Vangraefschepe, F.; Hamiti, T. Contribution to partial discharge analysis in inverter-fed motor windings for automotive application. In Proceedings of the 2017 IEEE Electrical Insulation Conference (EIC), Baltimore, MD, USA, 11–14 June 2017; pp. 348–351. [Google Scholar] [CrossRef]
- Gómez de la Calle, M.; Martínez-tarifa, J.M.; Member, S.; Manuel, Á.; Solanilla, G.; Robles, G.; Member, S. Uncertainty Sources in the Estimation of the Partial Discharge Inception Voltage in Turn-to-Turn Insulation Systems. IEEE Access 2020, 8, 157510–157519. [Google Scholar] [CrossRef]
- Lusuardi, L.; Cavallini, A.; Calle, M.G.D.; Robles, G. Insulation Design of Low Voltage Electrical Motors Fed by PWM Inverters. IEEE Electr. Insul. Mag. 2019, 35, 7–15. [Google Scholar] [CrossRef]
- Sili, E.; Koliatene, F.; Cambronne, J.P. Pressure and temperature effects on the paschen curve. In Proceedings of the Conference on Electrical Insulation and Dielectric Phenomena, CEIDP, Cancun, Mexico, 16–19 October 2011; pp. 464–467. [Google Scholar] [CrossRef]
- Kemari, Y.; Steen, C.V.d.; Belijar, G.; Laudebat, L.; Diaham, S.; Valdez-Nava, Z.; Abadie, C. A Townsend’s secondary ionization coefficient estimation method for partial discharge inception voltage prediction for insulating polymers. In Proceedings of the 2022 IEEE 4th International Conference on Dielectrics (ICD), Palermo, Italy, 3–7 July 2022; pp. 226–229. [Google Scholar] [CrossRef]
- Dakin, T.W.; Philofsky, H.M.; Divens, W.C. Effect of electric discharges on the breakdown of solid insulation. Trans. Am. Inst. Electr. Eng. Part I Commun. Electron. 1954, 73, 155–162. [Google Scholar] [CrossRef]
- Halleck, M.C. Calculation of Corona-Starting Voltage in Air-Solid Dielectric Systems. Trans. Am. Inst. Electr. Eng. Part III Power Appar. Syst. 1956, 75, 211–216. [Google Scholar] [CrossRef]
- Gómez, M.; Calle, D. Partial Discharge Inception Voltage in Turn-To-Turn Insulation Systems: Modelling and Uncertainties. Ph.D. Thesis, Universidad Carlos III de Madrid, Getafe, Spain, 2021. [Google Scholar]
- Lau, Y.Y.; Liu, Y.; Parker, R.K. Electron emission: From the Fowler-Nordheim relation to the Child-Langmuir law. Phys. Plasmas 1994, 1, 2082–2085. [Google Scholar] [CrossRef]
- Ito, K.; Shibata, T.; Kawasaki, T. Development of High Voltage Wire for New Structure Motor in Full Hybrid Vehicle. SAE Int. J. Altern. Powertrains 2016, 5, 272–277. [Google Scholar] [CrossRef]
- En, N.E.; Iec, N.I.; Une-en, N.; Goi, M.; Politeknikoa, E. UNE-EN 60317-0-1; Especificaciones para tipos particulares de hilos para bobinas electromagnéticas Parte 0-1: Requisitos generales Hilo de cobre de sección circular esmaltado. UNE: Madrid, Spain, 2014. [Google Scholar]
- UNE-EN IEC 60172; Norma Española Temperatura de los Hilos Esmaltados y Recubiertos con Cinta para Bobinas Electromagnéticas. UNE: Madrid, Spain, 2021.
- UNE-EN 60270:2002/A1; Técnicas de Ensayo en Alta Tensión Medidas. Medidas de las Descargas Parciales. UNE: Madrid, Spain, 2016.
- Real Decreto 178/2021 de 23 de Marzo, por el que Se Modifica el Real Decreto 1027/2007, de 20 de Julio, por el que se Aprueba el Reglamento de Instalaciones Térmicas en los Edificios. Available online: https://www.boe.es/eli/es/rd/2021/03/23/178 (accessed on 6 February 2023).
- Guastavino, F.; Gianoglio, C.; Torello, E.; Ferraris, M.; Gianelli, W. Electrical Aging Tests on Conventional and Nanofilled Impregnation Resins. In Proceedings of the Conference on Electrical Insulation and Dielectric Phenomena, CEIDP, Cancun, Mexico, 21–24 October 2018; pp. 156–158. [Google Scholar] [CrossRef]
- Park, J.; An, J.; Han, K.; Choi, H.S.; Seouk Park, I. Enhancement of cooling performance in traction motor of electric vehicle using direct slot cooling method. Appl. Therm. Eng. 2022, 217, 119082. [Google Scholar] [CrossRef]
- UNE-EN IEC 60317-0-2; Norma Española Bobinas Electromagnéticas Parte 0-2: Requisitos Generales Hilo de Cobre de Sección Rectangular Esmaltado. UNE: Madrid, Spain, 2021.


| Affecting Variable | Effect on PDIV | Range | Measuring Conditions | Reason | Notes | Ref. |
|---|---|---|---|---|---|---|
| Pressure | Decrease | 5–50/70 mbar | - | ↓ air breakdown V | Range depends on air gap and material | [26] |
| Increase | 100–1013 mbar | - | ↑ air breakdown V | [26,27,28] | ||
| Humidity | Decrease | >50% | V 5 kV ≤ 50 C | ↑ insulation permittivity and bulk space charge | - | [20,29,34] |
| 10–97% | V ≤ 3.5 kV = 25, 90 C | [20,36,37,38,39] | ||||
| Increase | <50% | V ≥ 5 kV ≤ 50 C | ↑ air breakdown V, ↓ area of PD activity | - | [20,29] | |
| 50–97% | V ≤ 3.5 kV = 30 C | Surface discharge more prominent than internal | [39] | |||
| Negligible | 50–95% | V ≤ 3.5 kV = 25 C Pure water washing | PDIV dependency due to bare hand contaminants | - | [38] | |
| Temperature | Decrease | 25–230 C | - | ↓ air breakdown V and change of permittivity | [26,38,39,40] | |
| Waveform and polarity | Negligible | Sinusoidal | - | It is defined by peak-to-peak applied voltage | Under absence of overshoot | [26,33,44] |
| Bipolar square | After prolonged PD exposition PDIV increased by memory effect | [26,33,44] | ||||
| Unipolar square +/− | Consecutive PDIV measurements increased by memory effect | [26,33,44] | ||||
| Switching frequency | Decrease * | 2–10,000 Hz | - | ↑ space charge due to homo-discharge memory effect | - | [48,49,52] |
| 10–75 kHz | ↑ average amplitude of overvoltage | [28,53] | ||||
| Negligible | 1–200 kHz | - | No memory effect on the detection of first PD | If permittivity of the insulation is independent on frequency | [26,37,46,47] | |
| Rise time | Increase | 60–1000 ns | No overshoot | ↓ time for initial electron generation | - | [43,47] |
| Negligible | 7–1000 ns | Overshoot in low rise time waveforms | Resulting from overshoot rather than rise time | - | [26,45,46,52,54] | |
| 150 ns | No overshoot | Compared to 60 Hz sinusoidal | [26,46] | |||
| Pulse width | Decrease | 2–800 | Rise time 100–1000 ns | ↑ time for initial electron generation | Change frequency and duty rate | [43,55,56] |
| Increase | 1000–9000 | Rise time 70 ns, 100 Hz | non-conducting duration > conducting time | Same frequency, change duty rate | [57] | |
| Negligible | 0.5–100 | Rise time > 160 ns | Critical initial electron number during rising edge | Same frequency, change of duty rate | [52,54,57] | |
| 100–900 | Rise time 70 ns, 1 kHz | Non-conducting time > conducting time | [57] |
| Model | Use Data | Changing Variables | Pros | Cons | Ref. | ||||
|---|---|---|---|---|---|---|---|---|---|
| T | P | HR | |||||||
| Dakin | , | ✓ * | x | x | x | x | Simple and ↓ computational cost. Independent on insulation enamel material and diameter | Room conditions | [38,59,74,78] |
| Parallel plate | , , A, B, , | x | ✓ | x | x | x | Simple and ↓ computational cost. Independent on insulation enamel material and diameter | Room conditions. Difficult to define | [59] |
| Lusuardi | , , | ✓ ** | ✓ | x | x | x | Simple and ↓ computational cost | Not valid for high change with T. Neccesary experimental PDIV | [26] |
| Considering and | , , | x | x | x | ✓ | ✓ | Simple and not high computational cost | Room conditions and possibly necessary adjustment with experiments | [43] |
| FEM and Paschen’s straight distance | , , A, B, , | ✓ | ✓ | x | x | x | Independent on insulation enamel material and diameter | ↑ computational cost. Difficult to define | [38,60,62,69] |
| FEM and Paschen’s cte. E field lines | , , A, B, , | ✓ | ✓ | x | x | x | Independent on insulation enamel material and diameter | ↑↑ computational cost. Difficult to define | [70] |
| FEM and Schumann cte. E field lines | , , , , | ✓ | ✓ | x | x | x | Independent on insulation enamel material and diameter | ↑↑ computational cost. Difficult to obtain air property database and define | [71] |
| Extended volume–time theory | , , , , | x | x | x | ✓ | ✓ | Independent on insulation enamel material and diameter. Temperature and pressure correction can be implemented | ↑↑ computational cost, FEM used. | [31,43,61] |
| Group Name | Wire Copper Diameter (mm) | Insulation Base Coat | Base Coat Percentage (%) | Insulation Surface Coat | Surface Coat Percentage (%) | Thermal Class (C) |
|---|---|---|---|---|---|---|
| B | 0.8 | Polyester (PE) | 72 | PAI | 28 | 200 |
| C | 0.9 | - | - | PI | 100 | 240 |
| Group Name | (mm) | (mm) | (mm) | |
|---|---|---|---|---|
| B | 0.8 | 0.28 | 0.001 | 0.0002 |
| C | 0.9 | 0.2975 | 0.001 | 0.00065 |
Disclaimer/Publisher’s Note: The statements, opinions and data contained in all publications are solely those of the individual author(s) and contributor(s) and not of MDPI and/or the editor(s). MDPI and/or the editor(s) disclaim responsibility for any injury to people or property resulting from any ideas, methods, instructions or products referred to in the content. |
© 2023 by the authors. Licensee MDPI, Basel, Switzerland. This article is an open access article distributed under the terms and conditions of the Creative Commons Attribution (CC BY) license (https://creativecommons.org/licenses/by/4.0/).
Share and Cite
Elorza Azpiazu, L.; Almandoz, G.; Egea, A.; Ugalde, G.; Badiola, X. Study of Partial Discharge Inception Voltage in Inverter Fed Electric Motor Insulation Systems. Appl. Sci. 2023, 13, 2417. https://doi.org/10.3390/app13042417
Elorza Azpiazu L, Almandoz G, Egea A, Ugalde G, Badiola X. Study of Partial Discharge Inception Voltage in Inverter Fed Electric Motor Insulation Systems. Applied Sciences. 2023; 13(4):2417. https://doi.org/10.3390/app13042417
Chicago/Turabian StyleElorza Azpiazu, Leire, Gaizka Almandoz, Aritz Egea, Gaizka Ugalde, and Xabier Badiola. 2023. "Study of Partial Discharge Inception Voltage in Inverter Fed Electric Motor Insulation Systems" Applied Sciences 13, no. 4: 2417. https://doi.org/10.3390/app13042417
APA StyleElorza Azpiazu, L., Almandoz, G., Egea, A., Ugalde, G., & Badiola, X. (2023). Study of Partial Discharge Inception Voltage in Inverter Fed Electric Motor Insulation Systems. Applied Sciences, 13(4), 2417. https://doi.org/10.3390/app13042417