

A Novel Measurement Method for Determining Geometric Errors of Rotary Tables by Using LaserTRACER and Reflectors

Abstract
:1. Introduction
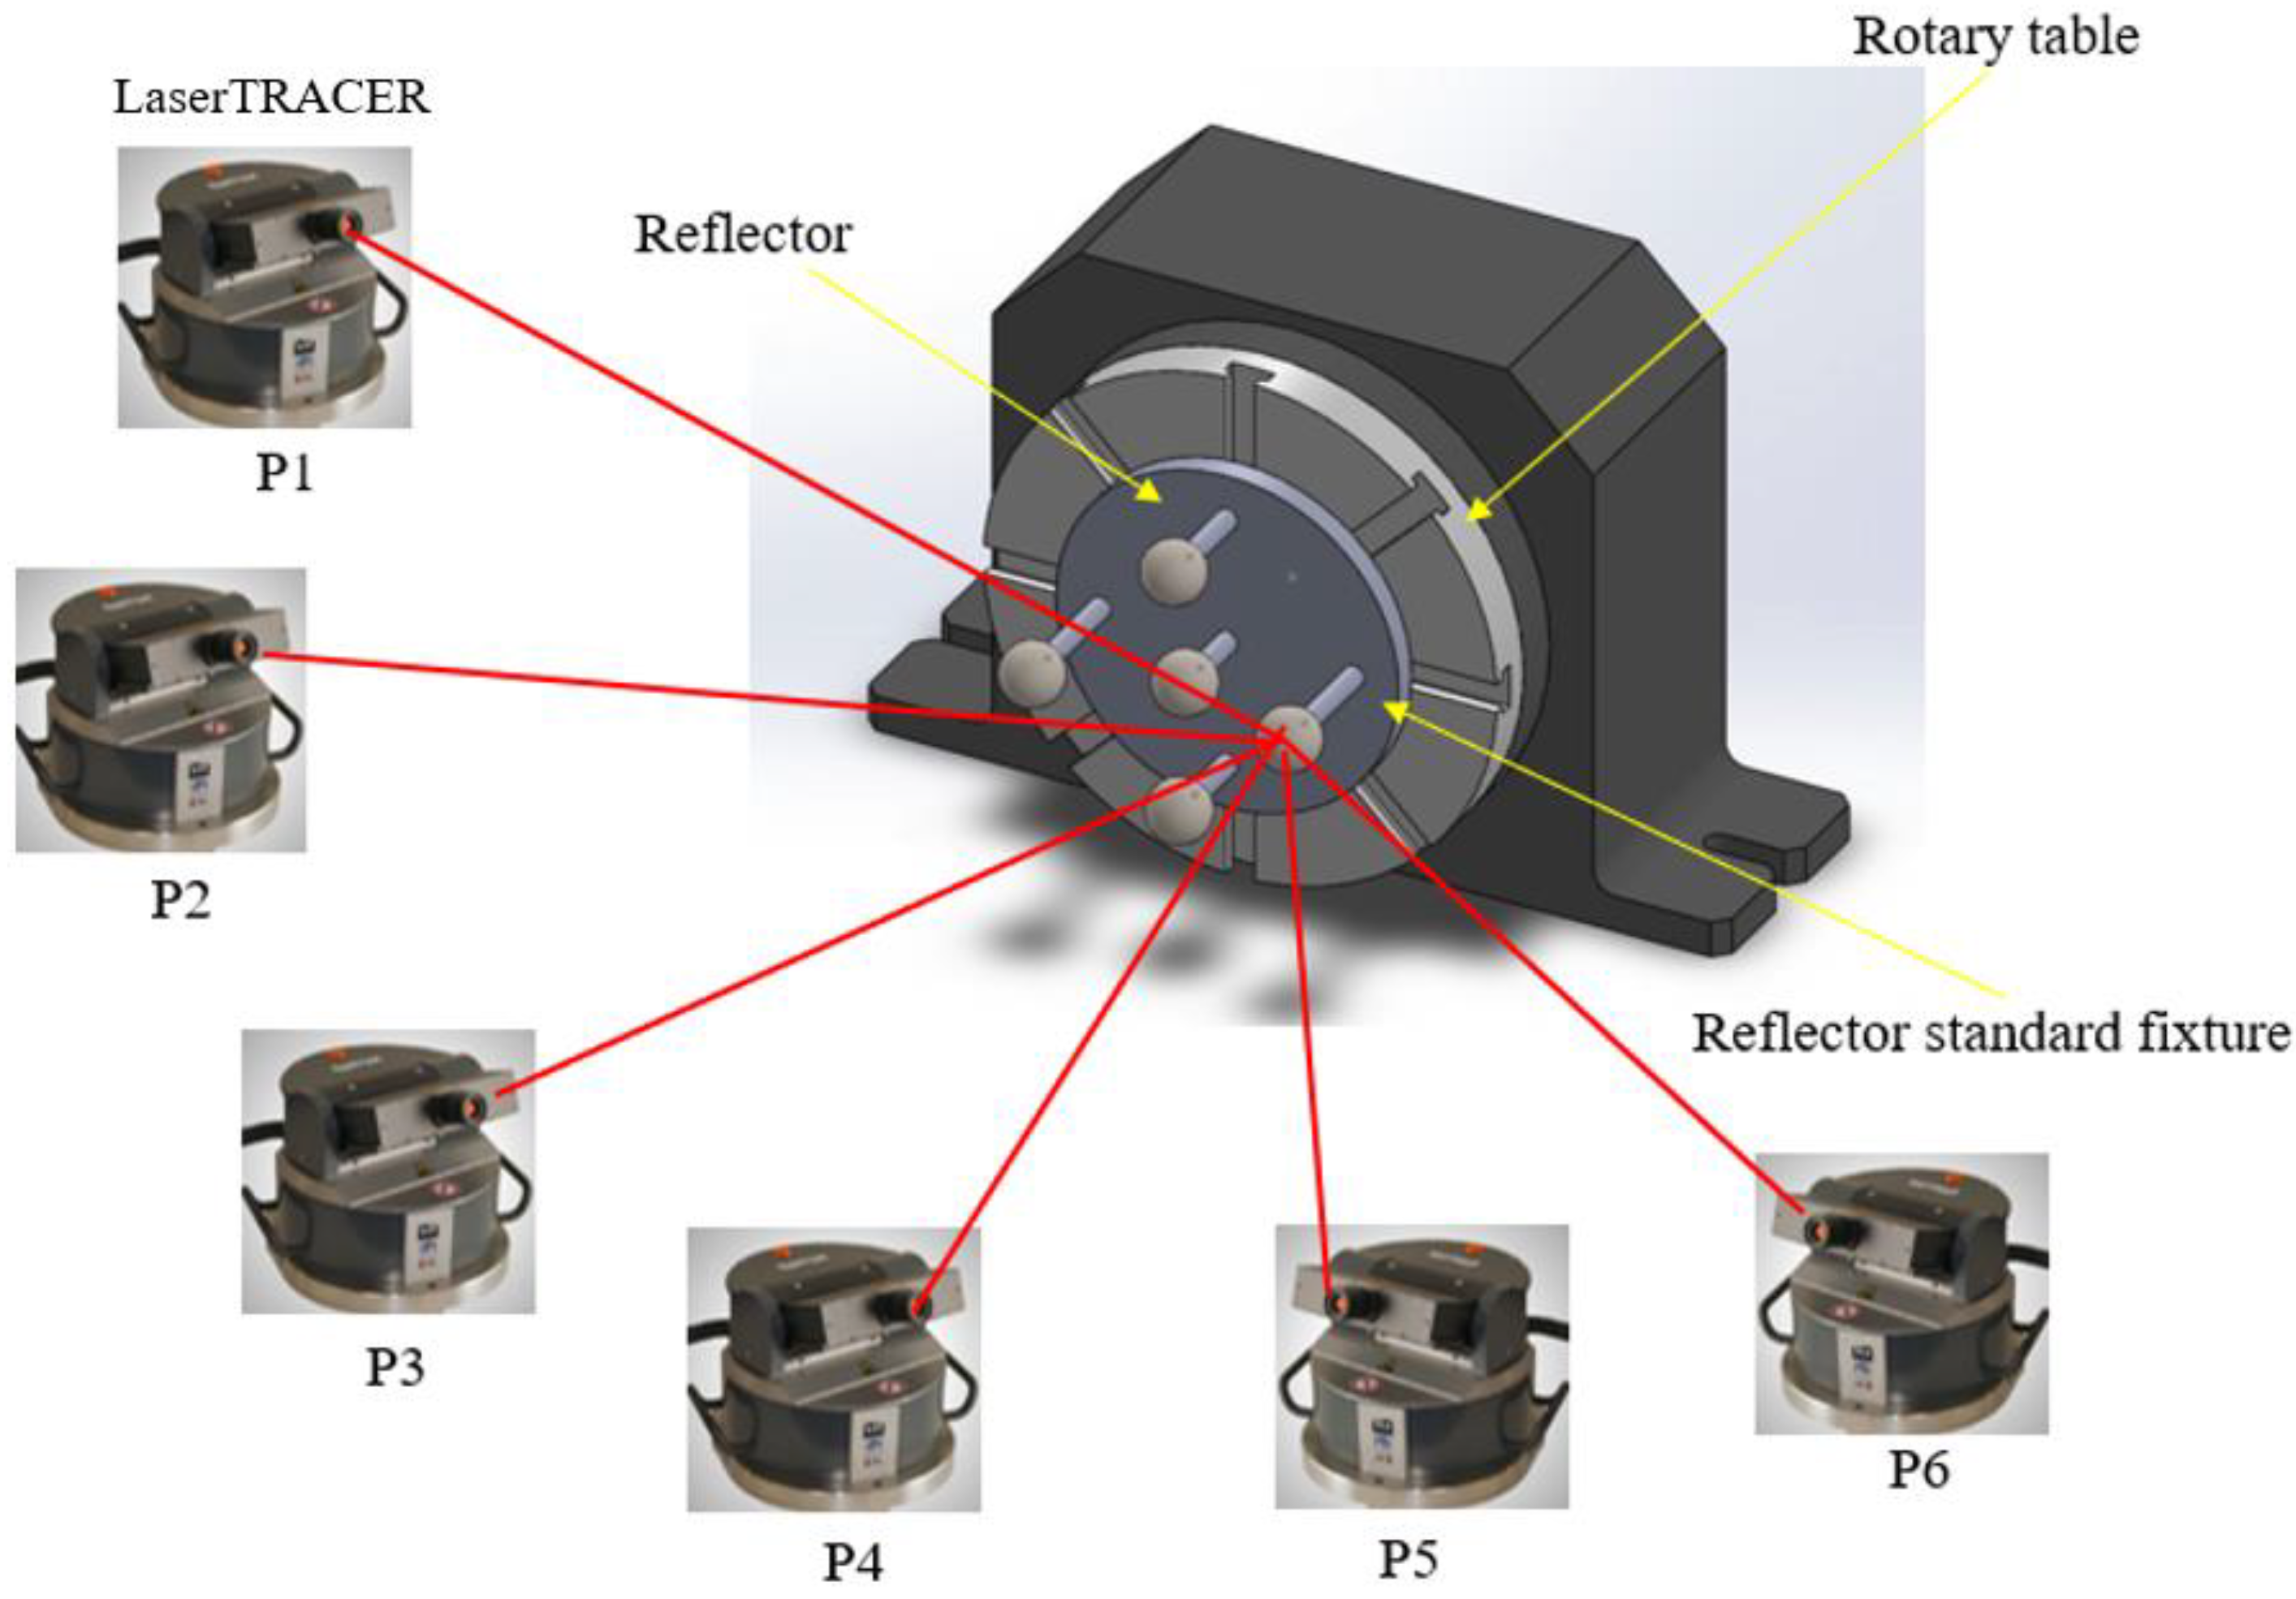
2. Measurement Principles
3. Geometric Error Measurement Algorithm
3.1. Set-Up Error Identification
3.2. 6-DOF Geometric Error Identification
4. Simulation Verification
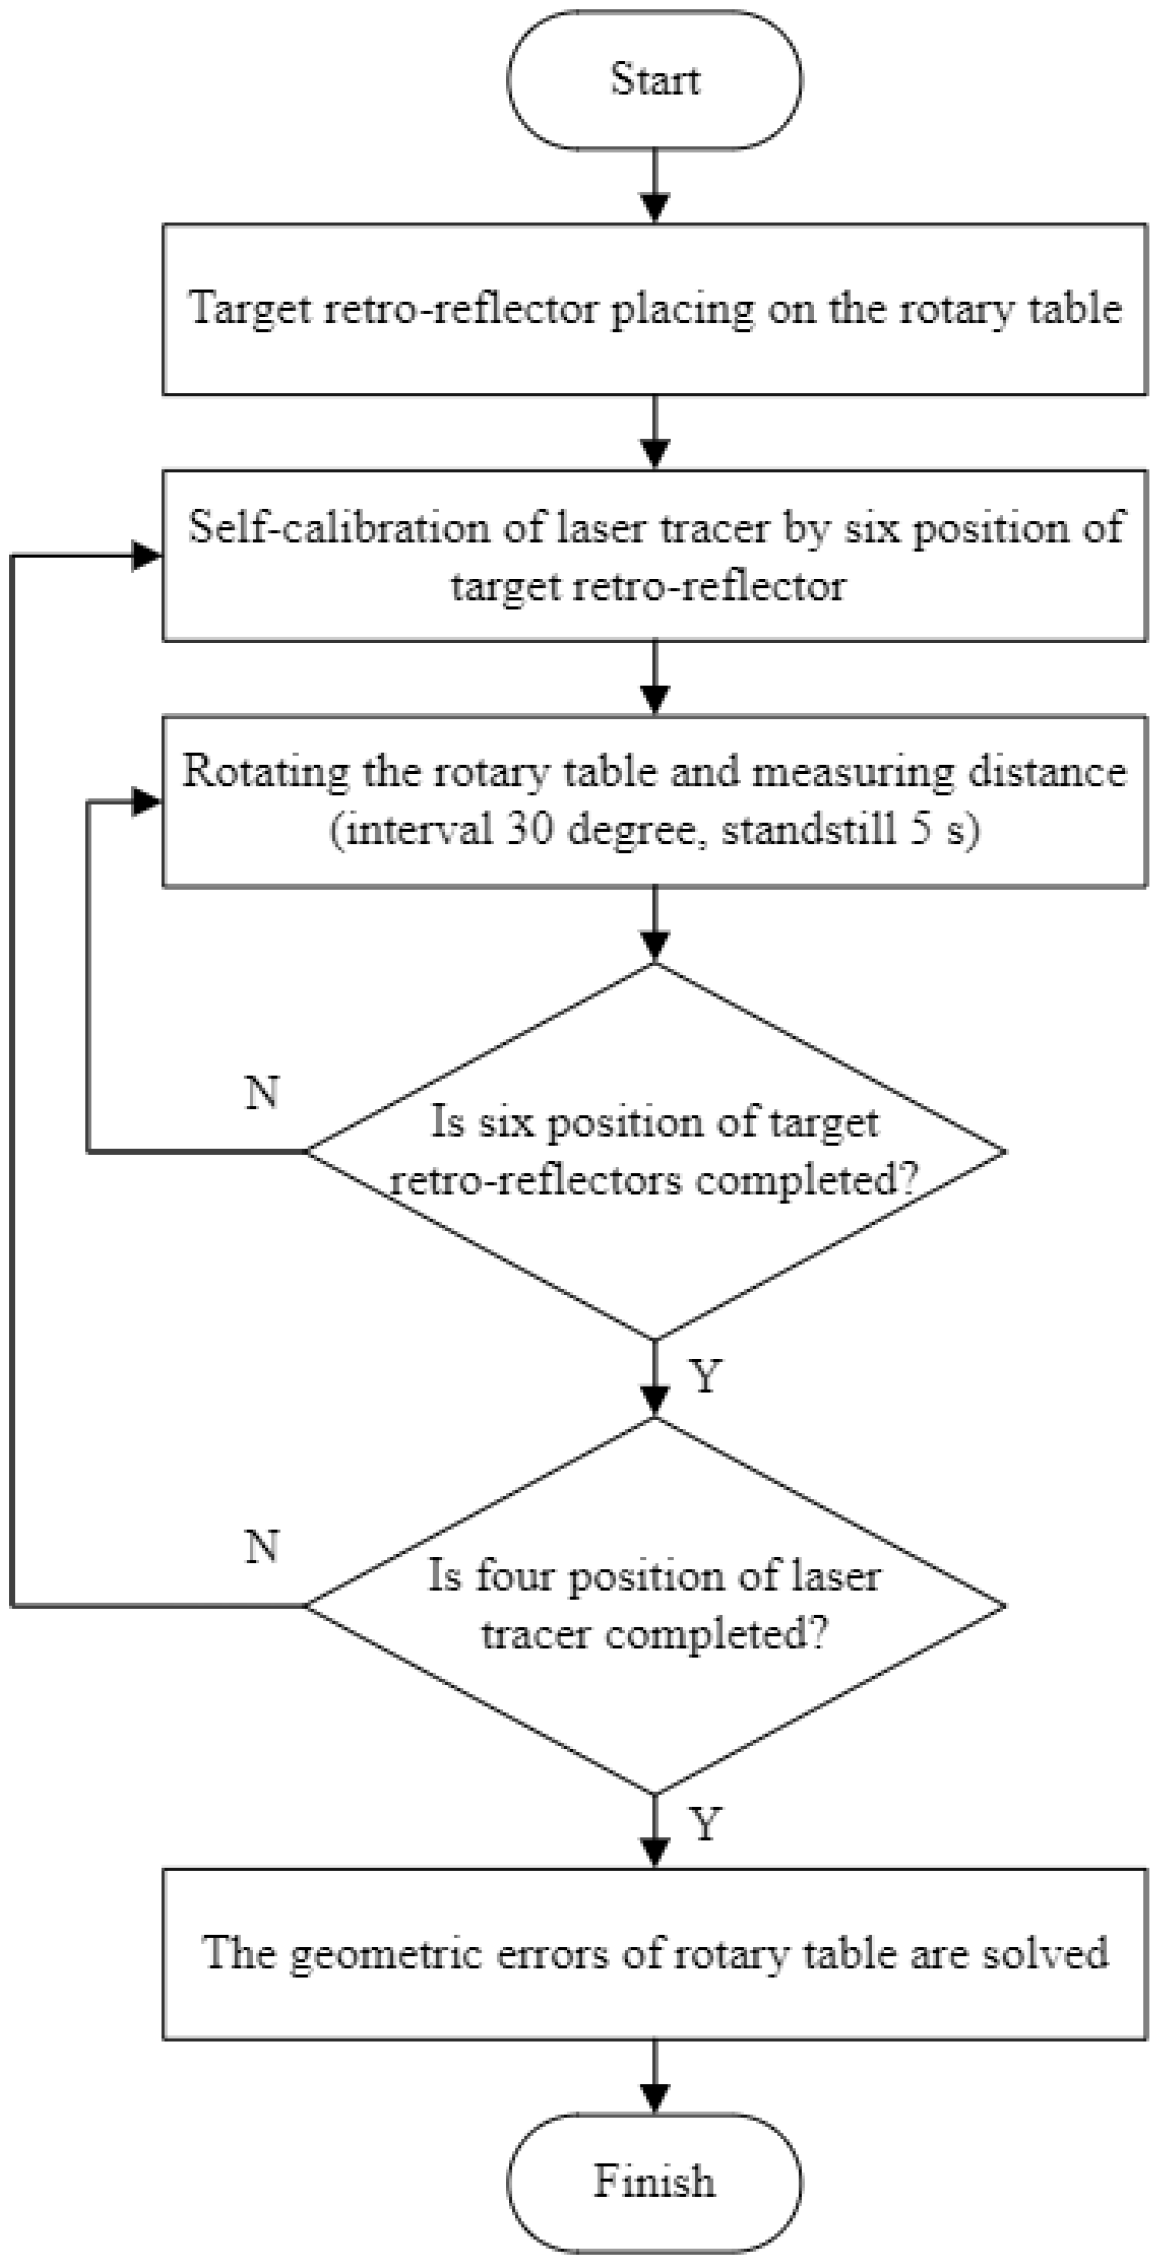
5. Experiment Verification
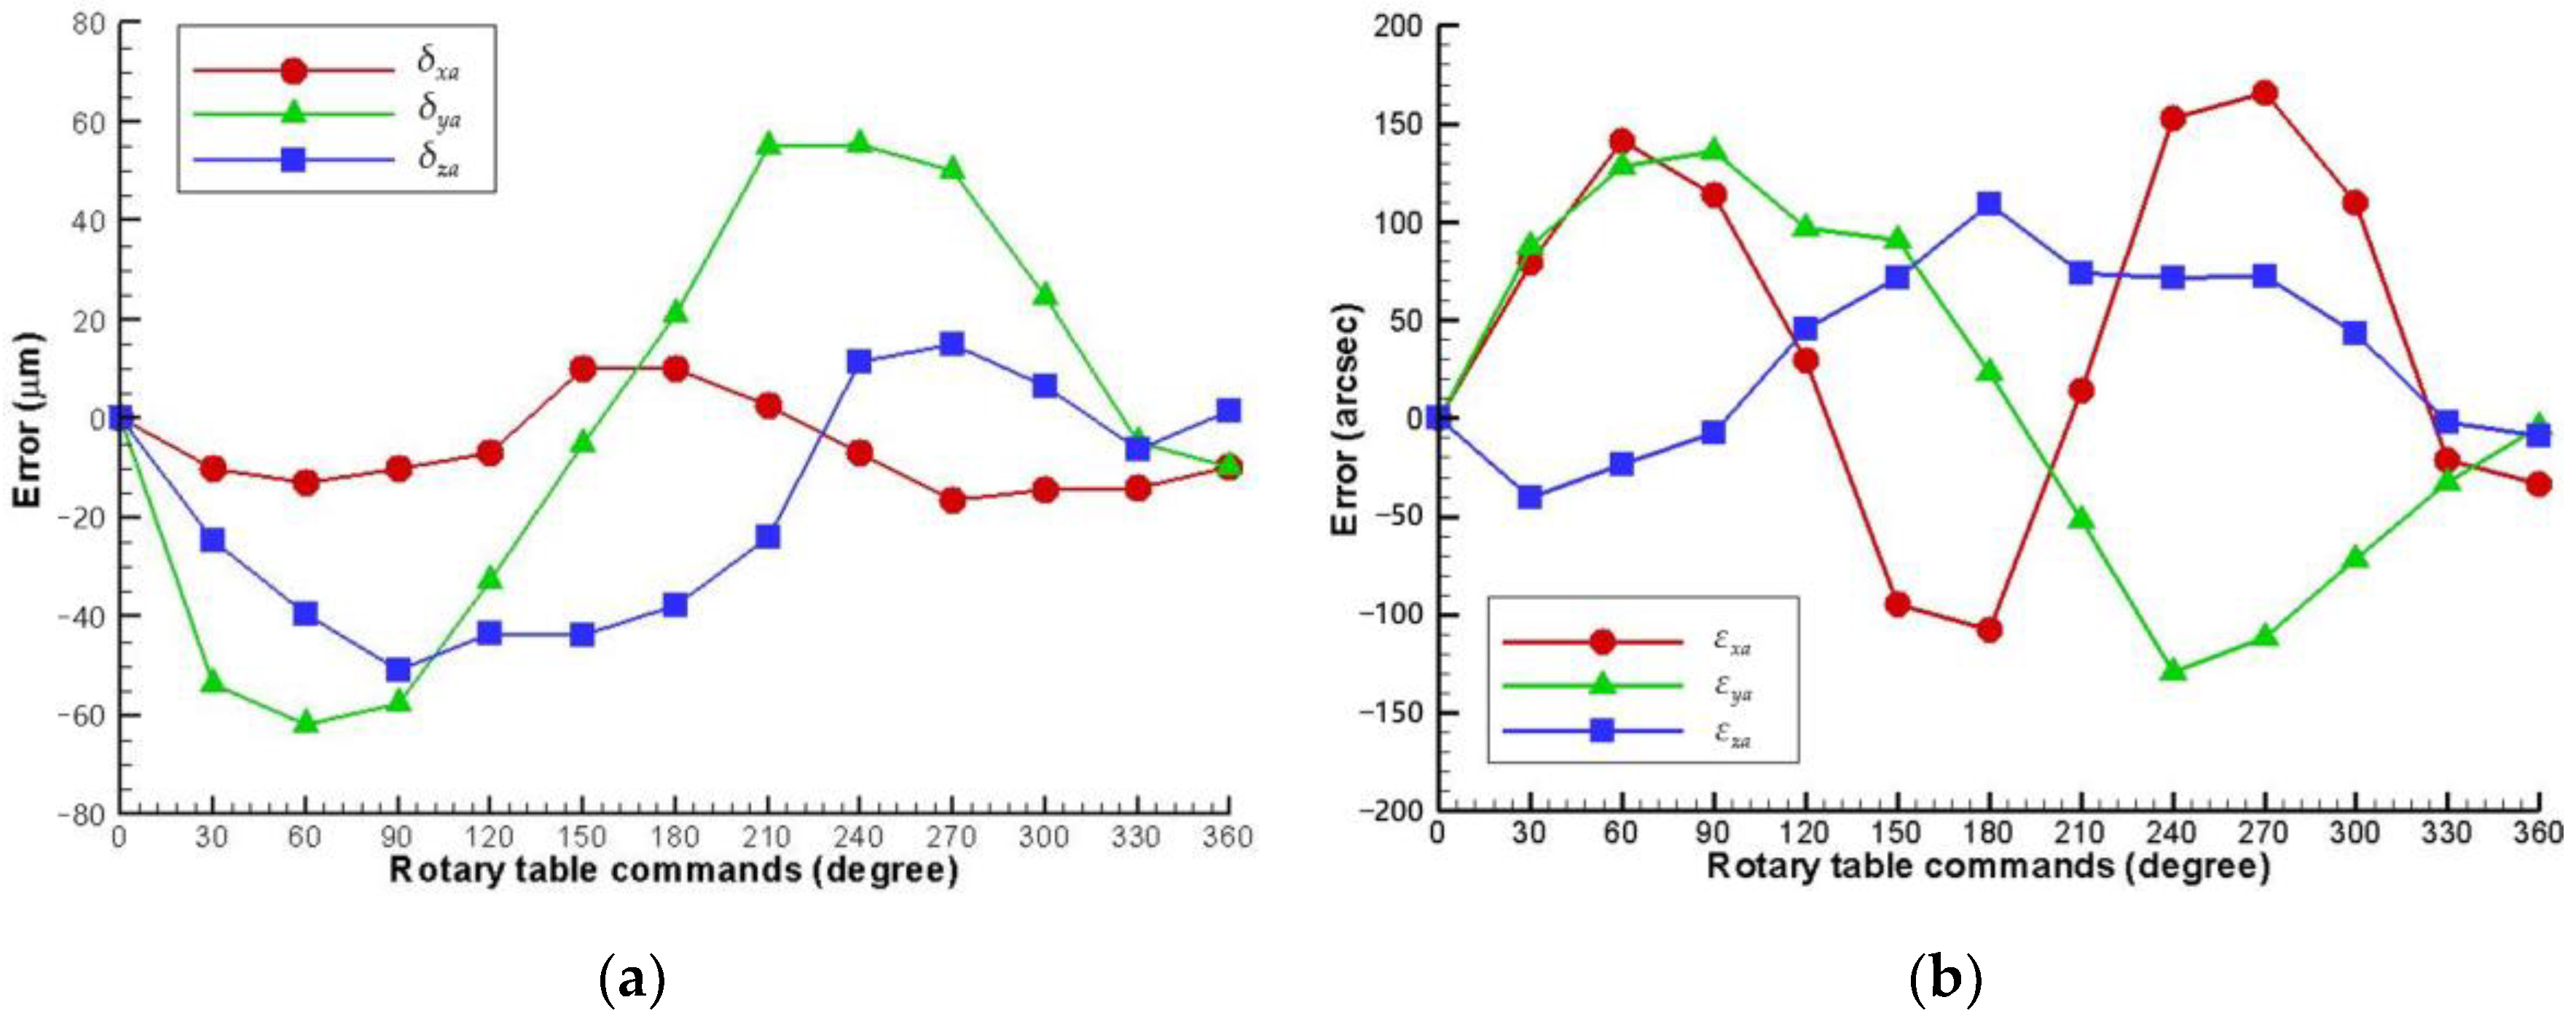
5.1. Geometric Error and Set-Up Error Identification Experiment
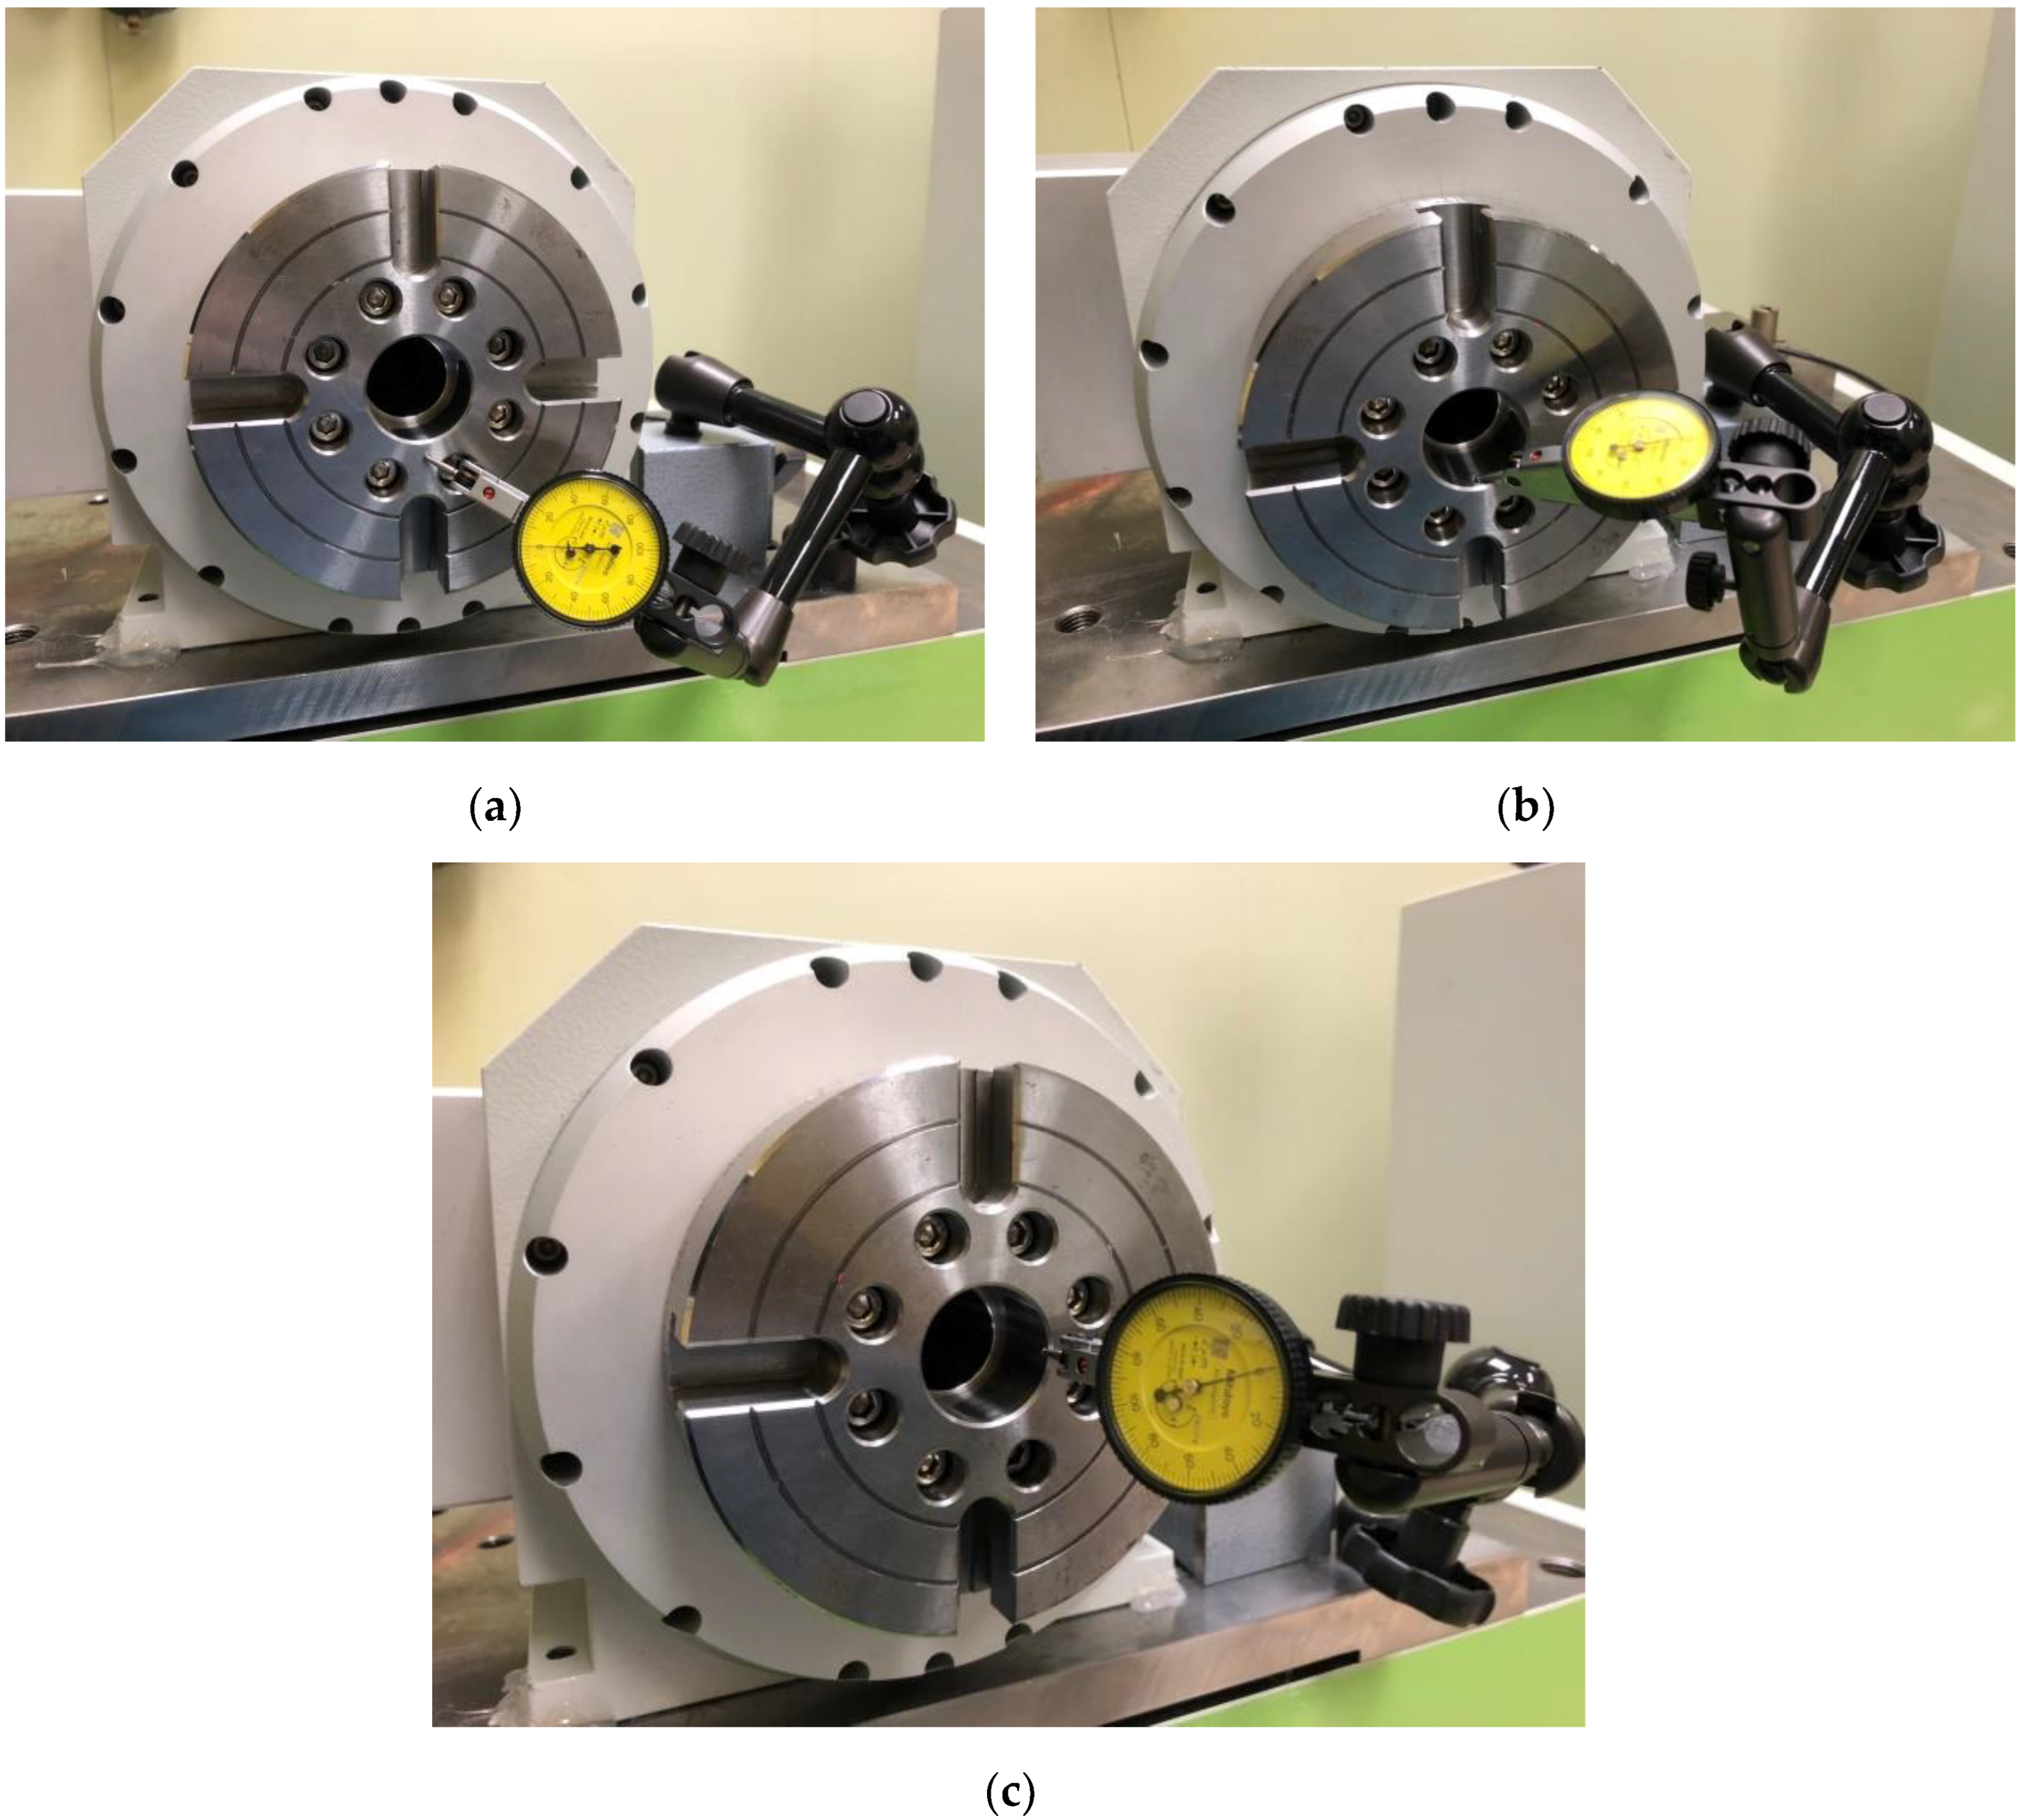
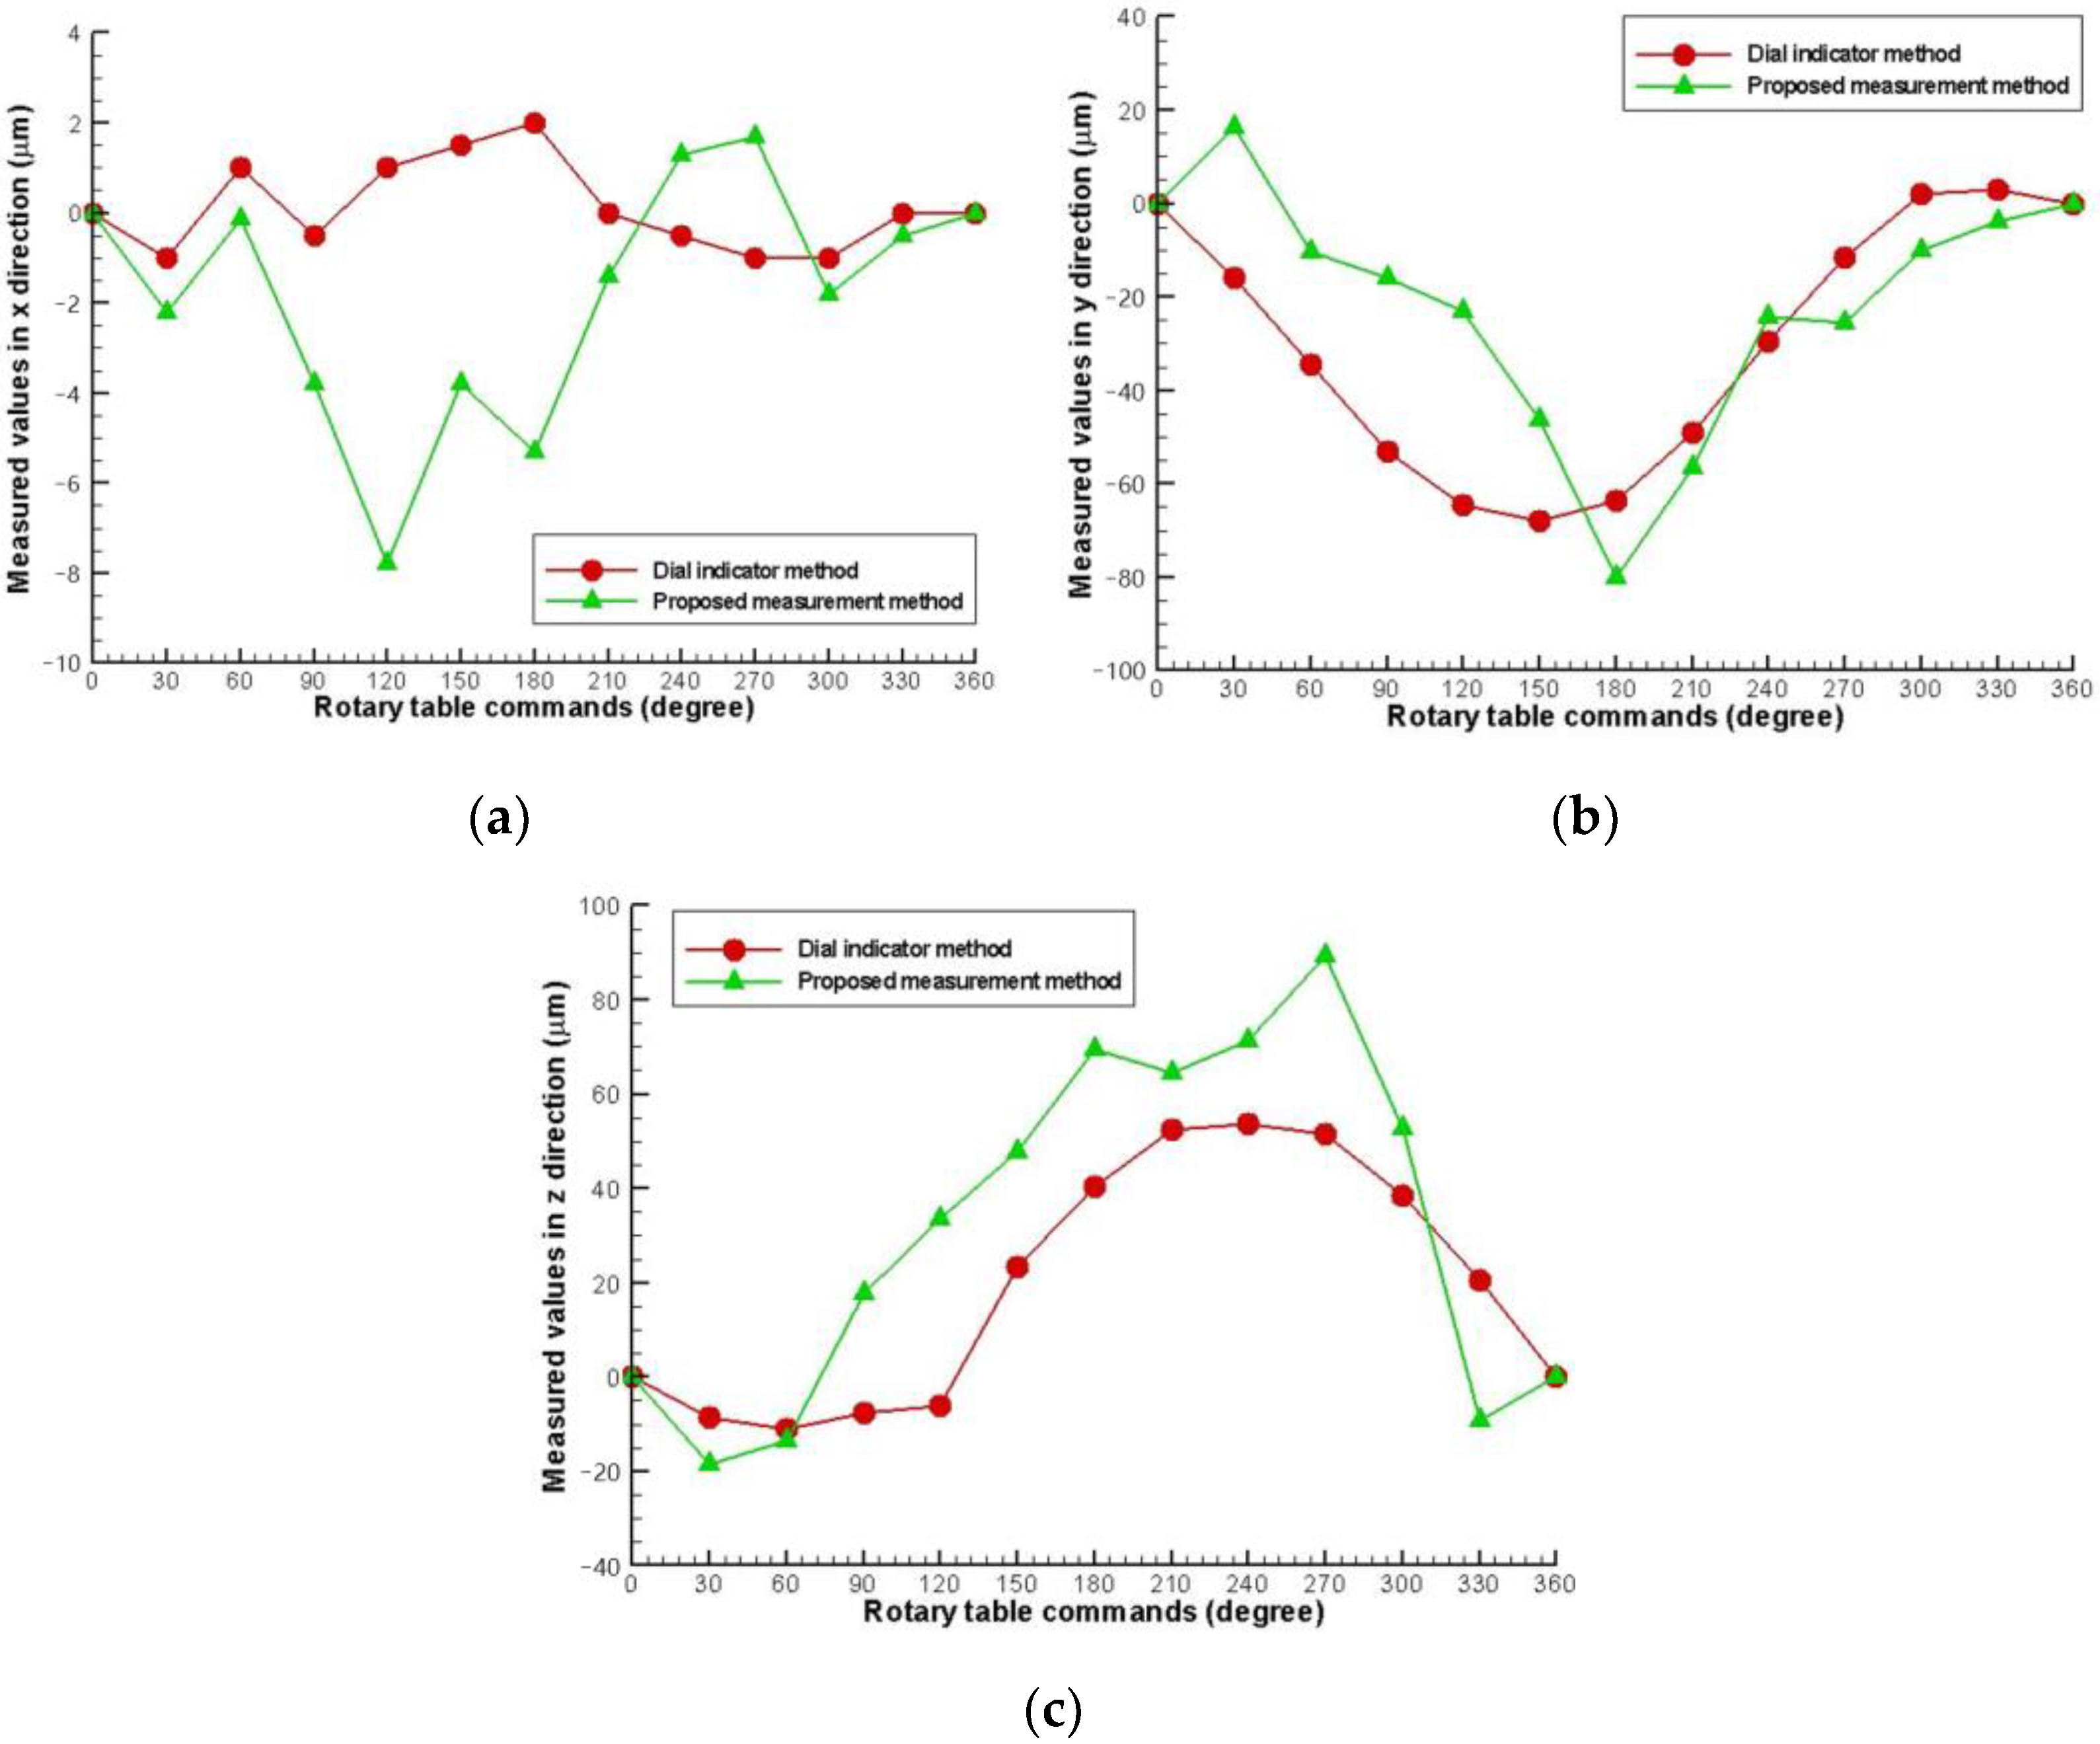
5.2. Verification with Traditional Measurement Method
6. Conclusions
Author Contributions
Funding
Institutional Review Board Statement
Informed Consent Statement
Data Availability Statement
Conflicts of Interest
References
- Varga, J.; Tóth, T.; Kaščák, Ľ.; Spišák, E. The Effect of the Machining Strategy on the Surface Accuracy When Milling with a Ball End Cutting Tool of the Aluminum Alloy Alcu4mg. Appl. Sci. 2022, 12, 10638. [Google Scholar] [CrossRef]
- Ni, M.; Ni, N.; Liu, H.; Jiang, L.; Mo, W. Design Optimization for the Coating of Machine Tools Based on Eye-Tracking Experiments and Virtual Reality Technology. Appl. Sci. 2022, 12, 10640. [Google Scholar] [CrossRef]
- Yang, X.; You, Y. Linear Tool Path-Smoothing Method in High-Speed Machining Based on Error Feasible Area and Curvature Optimization. Appl. Sci. 2022, 12, 9443. [Google Scholar] [CrossRef]
- Stan, S.-D.; Popişter, F.; Oarcea, A.; Ciudin, P. Comparative Study Using Cad Optimization Tools for the Workspace of a 6dof Parallel Kinematics Machine. Appl. Sci. 2022, 12, 9258. [Google Scholar] [CrossRef]
- Li, B.; Zhang, H.; Ye, P. Error Constraint Optimization for Corner Smoothing Algorithms in High-Speed Cnc Machine Tools. Int. J. Adv. Manuf. Technol. 2018, 99, 635–646. [Google Scholar] [CrossRef]
- Tsutsumi, M.; Saito, A. Identification of Angular and Positional Deviations Inherent to 5-Axis Machining Centers with a Tilting-Rotary Table by Simultaneous Four-Axis Control Movements. Int. J. Mach. Tools Manuf. 2004, 44, 1333–1342. [Google Scholar] [CrossRef]
- Chen, Y.-T.; More, P.; Liu, C.-S. Identification and Verification of Location Errors of Rotary Axes on Five-Axis Machine Tools by Using a Touch-Trigger Probe and a Sphere. Int. J. Adv. Manuf. Technol. 2019, 100, 2653–2667. [Google Scholar] [CrossRef]
- Jeong, J.H.; Khim, G.; Oh, J.S.; Chung, S.-C. Method for Measuring Location Errors Using a Touch Trigger Probe on Four-Axis Machine Tools. Int. J. Adv. Manuf. Technol. 2018, 99, 1003–1012. [Google Scholar] [CrossRef]
- Zha, J.; Li, L.; Han, L.; Chen, Y. Four-Station Laser Tracer-Based Geometric Error Measurement of Rotary Table. Meas. Sci. Technol. 2020, 31, 065008. [Google Scholar] [CrossRef]
- Ibaraki, S.; Oyama, C.; Otsubo, H. Construction of an Error Map of Rotary Axes on a Five-Axis Machining Center by Static R-Test. Int. J. Mach. Tools Manuf. 2011, 51, 190–200. [Google Scholar] [CrossRef]
- Xiang, S.; Yang, J. Using a Double Ball Bar to Measure 10 Position-Dependent Geometric Errors for Rotary Axes on Five-Axis Machine Tools. Int. J. Adv. Manuf. Technol. 2014, 75, 559–572. [Google Scholar] [CrossRef]
- ISO 230-1:2012; Test Code for Machine Tools—Part 1: Geometric Accuracy of Machines Operating under No-Load or Quasi-Static Conditions. International Organization for Standardization: Geneva, Switzerland, 2012.
- ISO 230-7: 2015; Test Code for Machine Tools—Part 7: Geometric Accuracy of Axes of Rotation. International Organization for Standardization: Geneva, Switzerland, 2015.
- Lee, K.-I.; Yang, S.-H. Robust Measurement Method and Uncertainty Analysis for Position-Independent Geometric Errors of a Rotary Axis Using a Double Ball-Bar. Int. J. Mach. Tools Manuf. 2013, 14, 231–239. [Google Scholar] [CrossRef]
- ISO 10791-1:2015; Test Conditions for Machining Centres—Part 1: Geometric Tests for Machines with Horizontal Spindle (Horizontal Z-Axis). International Organization for Standardization: Geneva, Switzerland, 2015.
- ISO 10791-2:2001; Test Conditions for Machining Centres—Part 2: Geometric Tests for Machines with Vertical Spindle or Universal Heads with Vertical Primary Rotary Axis (vertical Z-Axis). International Organization for Standardization: Geneva, Switzerland, 2001.
- ISO 10791-3:1998; Test Conditions for Machining Centres—Part 3: Geometric Tests for Machines with Integral Indexable or Continuous Universal Heads (Vertical Z-Axis). International Organization for Standardization: Geneva, Switzerland, 1998.
- ISO 10791-6:2014; Test Conditions for Machining Centres—Part 6: Accuracy of Speeds and Interpolations. International Organization for Standardization: Geneva, Switzerland, 2014.
- Chen, Y.-T.; More, P.; Liu, C.-S.; Cheng, C.-C. Identification and Compensation of Position-Dependent Geometric Errors of Rotary Axes on Five-Axis Machine Tools by Using a Touch-Trigger Probe and Three Spheres. Int. J. Adv. Manuf. Technol. 2019, 102, 3077–3089. [Google Scholar] [CrossRef]
- Ibaraki, S.; Iritani, T.; Matsushita, T. Calibration of Location Errors of Rotary Axes on Five-Axis Machine Tools by on-the-Machine Measurement Using a Touch-Trigger Probe. Int. J. Mach. Tools Manuf. 2012, 58, 44–53. [Google Scholar] [CrossRef]
- Liu, C.-S.; Hsu, H.-C.; Lin, Y.-X. Design of a Six-Degree-of-Freedom Geometric Errors Measurement System for a Rotary Axis of a Machine Tool. Opt. Lasers Eng. 2020, 127, 105949. [Google Scholar] [CrossRef]
- Schwenke, H.; Knapp, W.; Haitjema, H.; Weckenmann, A.; Schmitt, R.; Delbressine, F. Geometric Error Measurement and Compensation of Machines—An Update. CIRP Ann. Manuf. Technol. 2008, 57, 660–675. [Google Scholar] [CrossRef]
- Ibaraki, S.; Knapp, W. Indirect Measurement of Volumetric Accuracy for Three-Axis and Five-Axis Machine Tools: A Review. Int. J. Mach. Tools Manuf. 2012, 6, 110–124. [Google Scholar] [CrossRef]
- Jiang, X.; Cripps, R.J. A Method of Testing Position Independent Geometric Errors in Rotary Axes of a Five-Axis Machine Tool Using a Double Ball Bar. Int. J. Mach. Tools Manuf. 2015, 89, 151–158. [Google Scholar] [CrossRef]
- Xia, H.-J.; Peng, W.-C.; Ouyang, X.-B.; Chen, X.-D.; Wang, S.-J.; Chen, X. Identification of Geometric Errors of Rotary Axis on Multi-Axis Machine Tool Based on Kinematic Analysis Method Using Double Ball Bar. Int. J. Mach. Tools Manuf. 2017, 122, 161–175. [Google Scholar] [CrossRef]
- Ibaraki, S.; Iritani, T.; Matsushita, T. Error Map Construction for Rotary Axes on Five-Axis Machine Tools by on-the-Machine Measurement Using a Touch-Trigger Probe. Int. J. Mach. Tools Manuf. 2013, 68, 21–29. [Google Scholar] [CrossRef]
- He, Z.; Fu, J.; Zhang, L.; Yao, X. A New Error Measurement Method to Identify All Six Error Parameters of a Rotational Axis of a Machine Tool. Int. J. Mach. Tools Manuf. 2015, 88, 1–8. [Google Scholar] [CrossRef]
- Li, J.; Feng, Q.; Bao, C.; Zhao, Y. Method for Simultaneous Measurement of Five Dof Motion Errors of a Rotary Axis Using a Single-Mode Fiber-Coupled Laser. Opt. Express 2018, 26, 2535–2545. [Google Scholar] [CrossRef] [PubMed]
- Muralikrishnan, B.; Lee, V.; Blackburn, C.; Sawyer, D.; Phillips, S.; Ren, W.; Hughes, B. Assessing Ranging Errors as a Function of Azimuth in Laser Trackers and Tracers. Meas. Sci. Technol. 2013, 24, 065201. [Google Scholar] [CrossRef]
- Lee, H.-W.; Chen, J.-R.; Pan, S.-P.; Liou, H.-C.; Hsu, P.E. Relationship between Iso 230-2/-6 Test Results and Positioning Accuracy of Machine Tools Using Lasertracer. Appl. Sci. 2016, 6, 105. [Google Scholar] [CrossRef]
- Chen, J.R.; Ho, B.-L.; Lee, H.-W.; Pan, S.-P.; Hsieh, T.-H. Geometric Error Measurement of Machine Tools Using Autotracking Laser Interferometer. Sens. Mater. 2018, 30, 2429. [Google Scholar] [CrossRef]
- Zhang, Z.; Hu, H. A General Strategy for Geometric Error Identification of Multi-Axis Machine Tools Based on Point Measurement. Int. J. Adv. Manuf. Technol. 2013, 69, 1483–1497. [Google Scholar] [CrossRef]
- Haitao, L.; Junjie, G.; Yufen, D.; Jindong, W.; Xinrong, H. Identification of Geometric Deviations Inherent to Multi-Axis Machine Tools Based on the Pose Measurement Principle. Meas. Sci. Technol. 2016, 27, 125008. [Google Scholar] [CrossRef]
- Wang, J.; Guo, J. The Identification Method of the Relative Position Relationship between the Rotary and Linear Axis of Multi-Axis Numerical Control Machine Tool by Laser Tracker. Meas. Sci. Technol. 2019, 132, 369–376. [Google Scholar] [CrossRef]
- Schwenke, H.; Franke, M.; Hannaford, J.; Kunzmann, H. Error Mapping of Cmms and Machine Tools by a Single Tracking Interferometer. CIRP Ann. Manuf. Technol. 2005, 54, 475–478. [Google Scholar] [CrossRef]
- Hughes, E.B.; Wilson, A.; Peggs, G.N. Design of a High-Accuracy Cmm Based on Multi-Lateration Techniques. CIRP Ann. Manuf. Technol. 2000, 49, 391–394. [Google Scholar] [CrossRef]
- Muralikrishnan, B.; Phillips, S.; Sawyer, D. Laser Trackers for Large-Scale Dimensional Metrology: A Review. Precis. Eng. 2016, 44, 13–28. [Google Scholar] [CrossRef]
- Gąska, A.; Krawczyk, M.; Kupiec, R.; Ostrowska, K.; Gąska, P.; Sładek, J. Modeling of the Residual Kinematic Errors of Coordinate Measuring Machines Using Lasertracer System. Int. J. Adv. Manuf. Technol. 2014, 73, 497–507. [Google Scholar] [CrossRef]
- Wang, J.; Guo, J.; Zhang, G.; Guo, B.A.; Wang, H. The Technical Method of Geometric Error Measurement for Multi-Axis Nc Machine Tool by Laser Tracker. Meas. Sci. Technol. 2012, 23, 045003. [Google Scholar] [CrossRef]
- Toshiyuki, T.; Yoshihiko, K.; Mitsuo, G.; Tomizo, K. Restriction on the Arrangement of Laser Trackers in Laser Trilateration. Meas. Sci. Technol. 1998, 9, 1357. [Google Scholar]
- Toshiyuki, T.; Mitsuo, G.; Tomizo, K.; Yoshihisa, T.; Yoshihiko, K. The First Measurement of a Three-Dimensional Coordinate by Use of a Laser Tracking Interferometer System Based on Trilateration. Meas. Sci. Technol. 1998, 9, 38. [Google Scholar]
- ISO/IEC Guide 98-3:2008; Uncertainty of Measurement—Part 3: Guide to the Expression of Uncertainty in Measurement (GUM:1995). International Organization for Standardization: Geneva, Switzerland, 2008.
- ISO 13528: 2015; Statistical Methods for Use in Proficiency Testing by Interlaboratory Comparison. International Organization for Standardization: Geneva, Switzerland, 2015.


| Oya | Oza | Sya | Sza | |
|---|---|---|---|---|
| Unit | μm | μm | arcsec | arcsec |
| Given value | 10 | 10 | 20 | 20 |
| Estimated value | 9.55 | 10.35 | 20.87 | 19.15 |
| Absolute difference (μm/arcsec) Relative difference (%) | 0.45 μm, 4.5% | 0.35 μm, 3.5% | 0.87″, 4.35% | 0.85″, 4.25% |
| Symbol | Unit | Range of Given Value | Average Difference |
|---|---|---|---|
| δxa | μm | ±10 | 0.65 μm, 3.25% |
| δya | μm | ±10 | 0.49 μm, 2.45% |
| δza | μm | ±10 | 0.34 μm, 1.70% |
| εxa | arcsec | ±20 | 0.92 arcsec, 2.30% |
| εya | arcsec | ±20 | 0.67 arcsec, 1.68% |
| εza | arcsec | ±20 | 0.41 arcsec, 1.02% |
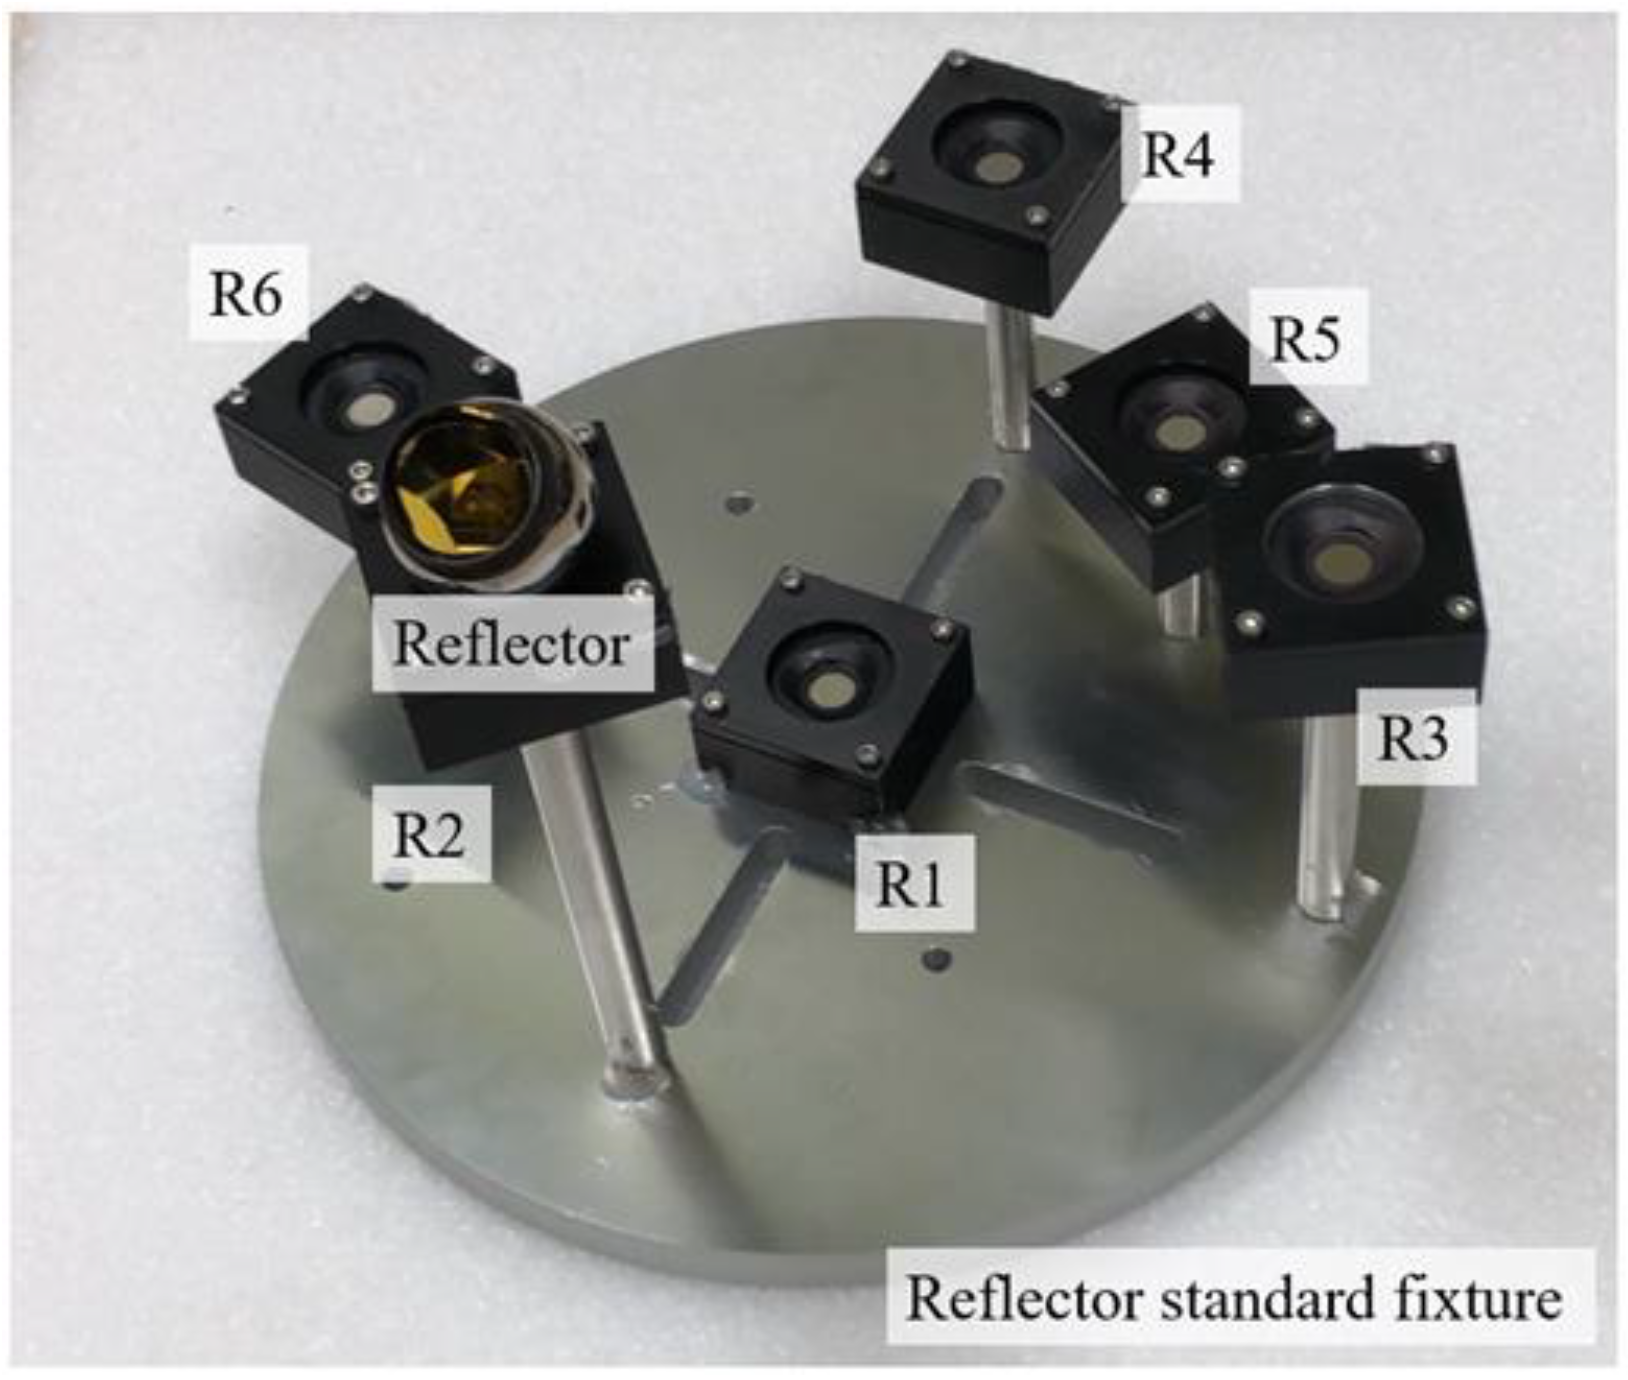
| x (mm) | y (mm) | z (mm) | |
|---|---|---|---|
| R1 | 0 | 0 | 0 |
| R2 | 152.3164 | 99.5804 | 3.1107 |
| R3 | 101.3756 | −4.1159 | 124.6657 |
| R4 | 75.0115 | −104.496 | −3.2143 |
| R5 | 50.72 | 3.6551 | −115.3568 |
| R6 | 50.7571 | −65.6545 | 65.1476 |
| Oya | Oza | Sya | Sza | |
|---|---|---|---|---|
| Unit | μm | μm | arcsec | arcsec |
| Measured value | 59.4 | 192.6 | 12.78 | 108.70 |
Disclaimer/Publisher’s Note: The statements, opinions and data contained in all publications are solely those of the individual author(s) and contributor(s) and not of MDPI and/or the editor(s). MDPI and/or the editor(s) disclaim responsibility for any injury to people or property resulting from any ideas, methods, instructions or products referred to in the content. |
© 2023 by the authors. Licensee MDPI, Basel, Switzerland. This article is an open access article distributed under the terms and conditions of the Creative Commons Attribution (CC BY) license (https://creativecommons.org/licenses/by/4.0/).
Share and Cite
Hsu, C.-H.; Chen, J.-R.; Hsu, F.-H.; Chen, Y.-T. A Novel Measurement Method for Determining Geometric Errors of Rotary Tables by Using LaserTRACER and Reflectors. Appl. Sci. 2023, 13, 2419. https://doi.org/10.3390/app13042419
Hsu C-H, Chen J-R, Hsu F-H, Chen Y-T. A Novel Measurement Method for Determining Geometric Errors of Rotary Tables by Using LaserTRACER and Reflectors. Applied Sciences. 2023; 13(4):2419. https://doi.org/10.3390/app13042419
Chicago/Turabian StyleHsu, Chi-Hua, Jr-Rung Chen, Fan-Hsi Hsu, and Yu-Ta Chen. 2023. "A Novel Measurement Method for Determining Geometric Errors of Rotary Tables by Using LaserTRACER and Reflectors" Applied Sciences 13, no. 4: 2419. https://doi.org/10.3390/app13042419
APA StyleHsu, C.-H., Chen, J.-R., Hsu, F.-H., & Chen, Y.-T. (2023). A Novel Measurement Method for Determining Geometric Errors of Rotary Tables by Using LaserTRACER and Reflectors. Applied Sciences, 13(4), 2419. https://doi.org/10.3390/app13042419