Article

Influence of Sample Preparation/Extraction Method on the Phytochemical Profile and Antimicrobial Activities of 12 Commonly Consumed Medicinal Plants in Romania

1
Faculty of Agriculture, University of Life Sciences “King Mihai I” from Timisoara, Calea Aradului No. 119, 300645 Timisoara, Romania
2
Agricultural Research and Development Station Lovrin, Principala Street No. 200, 307260 Lovrin, Romania
3
Faculty of Food Engineering, University of Life Sciences “King Mihai I” from Timisoara, Calea Aradului No. 119, 300645 Timisoara, Romania
4
Faculty of Veterinary Medicine, University of Life Sciences “King Mihai I” from Timisoara, Calea Aradului No. 119, 300645 Timisoara, Romania
*
Authors to whom correspondence should be addressed.
Appl. Sci. 2023, 13(4), 2530; https://doi.org/10.3390/app13042530
Submission received: 30 January 2023 / Revised: 10 February 2023 / Accepted: 14 February 2023 / Published: 16 February 2023
(This article belongs to the Special Issue Antioxidant, Antibacterial and Anti-drug Ingredients in Plants)

Abstract

:
This paper aims to evaluate the influence of preparation and extraction methods on the phytochemical profile and microbiological activity of 12 medicinal plants from the west side of Romania. First, the proximate composition (humidity, proteins, lipids, and ash) and elemental composition of the raw material were evaluated. Two levels of plant shredding were used: coarse shredding (CS) and fine grinding of plants to obtain powder (FG), and three extraction methods: conventional solvent extraction (CES), ultrasound-assisted extraction (UAE), and microwave extraction (MWE). The phytochemical profile investigated referred to antioxidant activity (AA), total polyphenol content (TPC), and flavonoid content (TFC), using spectrophotometric methods, and individual polyphenols detected using the LC/MS method. The preparation/extraction method for each medicinal plant was optimized using statistical analysis. The optimized extracts for each medicinal plant were tested to evaluate the antimicrobial potential against 9 standard strains. The results showed that the sample preparation method before extraction (shredding or grinding) influences the content of phytocompounds by increasing them in powder form. The use of green technologies, especially MWE, leads to the highest content of TPC, TFC, and AA. The TPC value ranged between 4.83–19.2 mgGAE/g DM in the samples CS and between 19.00–52.85 mgGAE/g DM in the samples FG. The highest antioxidant value was found in the Origanum vulgare extract, both in the case of the crushed sample (22.66 mM Fe2+/100 g) and the powder sample (81.36 mM Fe2+/100 g), followed by Melissa officinalis, The TFC values varied in the range of 1.02–3.46 mgQE/g DM when CES was used, between 2.36–12.09 mgQE/g DM for UAE, and between 1.22–9.63 mgQE/g DM in the case of the MWE procedure. The antimicrobial activity highlighted the effectiveness of the extracts, especially on the strains of H. influenzae, C. albicans, C. parapsilosis, S. aureus, and S. flexneri. Reduced antimicrobial activity was recorded for the strains of S. pyogenes and P. aeruginosa. The best antimicrobial activity was registered by Thymus serpyllum, with an inhibition rate of 132.93% against E. coli and 78.40% against C. albicans.

1. Introduction

Medicinal plants represent an inexhaustible source of biologically active compounds with multiple roles in the body and are successfully used in complementary medicine as an alternative to traditional medicine. Medicinal plants are species of cultivated or wild-grown plants that, because of their chemical composition, have pharmaceutical properties [1]. They are used in natural remedies and treatments in human and animal therapeutics [2]. The chemical composition includes a diversity of biologically active compounds such as alkaloids, essential oils, tannins, vitamins, and minerals with beneficial effects on health [3,4,5,6]. Essential oils (EOs) and extracts from medicinal plants are also used in food as antibacterial and/or antibiofilm agents [7,8,9].
The variety of spontaneous indigenous flora offers combinations of biologically active compounds with a functional role, which increased the scientific and practical interest in their exploitation in the form of extracts, essential oils, and supplements and their commercialization on a large scale. According to the Plant Extracts Global Market Report 2022, published in September 2022 [10], the global plant extracts market grew from USD 22.67 billion in 2021 to USD 25.35 billion in 2022, with a CAGR of 11.8%, and for the year 2026, an increase of up to USD 35.18 billion is expected.
The biological activities of the compounds in plants depend on the quality and quantity of the active principles in different plant-based preparations [11]. In this regard, it is very important, from a scientific and applied point of view, to optimize the preparation and extraction process of the active principles from a certain plant in order to extract the compounds with a functional role as efficiently as possible.
Shredding and grinding represent the processes applicable to plant material before extraction. The degree of extraction is influenced by the particle size; a smaller particle size results in a larger contact surface between plant material and solvents, and the degree of extraction will be higher. By shredding, coarse particles are obtained, while powder samples have an advanced degree of homogenization and smaller particles, resulting in better contact with the extraction solvents. Previous studies have shown that particle sizes smaller than 0.5 mm lead to an efficient extraction yield of active principles [12].
Sustainable and green technologies involve plant processing methods so that, through clean, environmentally friendly, low-energy processes, food products rich in active principles that are healthy and have a functional role in the body are obtained. These techniques are also part of the circular economy concept.
The extraction techniques applied for medicinal plants are divided into conventional methods (percolation, maceration, Soxhlet extraction, heat-assisted extraction) and non-conventional methods (ultrasound-assisted extraction, microwave-assisted extraction, supercritical fluid extraction, accelerated solvent extraction) [13].
The conventional methods of extraction using solvents (CES) involve a large volume of solvents, high energy consumption, a long extraction time, and usually a lower quantity of active compounds extracted. For these reasons, these methods are considered unsustainable and less effective [14]. Maceration, the most conventional method of extracting active principles from plants, involves compound mass transfer and solubility in adequate solvents combined with heat and/or agitation [13].
Green technologies are considered sustainable and environmentally friendly. These technologies are characterized by reducing or eliminating solvents with high toxicity and preserving the natural environment [15]. Two methods applied to extract the active principle from medicinal plants that are considered environmentally friendly are microwave extraction (MWE) and ultrasound-assisted extraction (UAE). UAE is a technique that uses the thermal, cavitation, and mechanical properties of ultrasound and produces cell wall disruption of the plant matrix in order to release the active principles [16]. The MWE technique is based on the migration of molecules with polarity in an electric field [17]. These techniques present the advantage of a reduced extraction time and a high extraction yield of the active principle.
Considering the increased interest in using extracts from medicinal plants in medicine, pharmacy, and the food industry, scientific research has focused on finding optimal solutions for extracting active principles with minimal cost and reduced impact on the environment.
In this regard, the objectives of this study are to optimize the process of obtaining some ethanolic extracts from medicinal plants in order to improve the total polyphenol content (TPC), the antioxidant activity (AA), the total flavonoid content (TFC), and the antimicrobial potential. It was studied the influence of (i) sample preparation method: coarse shredding (CS), and fine grinding to obtain powder (FG); (ii) the influence of extraction method: conventional solvent extraction (CES); ultrasound-assisted extraction (UAE) and microwave extraction (MWE). In this study, a number of 12 medicinal plants with wide use in Romania were analyzed: Mentha x piperita (MP), Thymus vulgaris (TV), Salvia officinalis (SO), Achillea millefolium (AM), Origanum vulgare (OV), Echinacea purpurea (EP), Hyssopus officinalis (HO), Salvia officinalis with seeds (SO2), Lavandula angustifolia (LA), Melissa officinalis (ML), Hypericum perforatum (HP), Calendula officinalis (CO). Also, the proximate composition in humidity, proteins, lipids, carbohydrates, ash and mineral substances was determined, and the antimicrobial profile against 9 standard strains was evaluated.

2. Materials and Methods

2.1. Plant Material

The medicinal plants were grown in the experimental fields of Agricultural Research Development Station Lovrin, located in Lovrin, Timis County, Romania (45.96740, 20.76853). The plants were harvested manually by cutting plants in the full flowering stage. The plant vouchers were deposited at the herbarium of the University of Life Sciences “King Mihai I” in Timisoara. The characteristics of studied medicinal plants are presented in the Table 1.

2.2. The Preparation of Plant Material

The plants were dried at room temperature until the moisture content of the vegetal material fell below 14%. Then, two levels of plant shredding were used: (i) coarse shredding (CS); and (ii) fine grinding of plants to obtain powder (FG). The CS fraction was obtained by coarsely shredding the dry plant material with a knife, while the FG fraction was obtained by grinding with a laboratory mill (GM 2000; Grindomix; Retsch Technology GMbH, Haan, Germany) to a fine powder. The flow chart of the whole process is presented in Figure 1.

2.3. The Obtaining of Plant Extracts

Three methods to extract the active principles from plants have been proposed: (i) conventional extraction with solvents (CES), (ii) ultrasound-assisted extraction (UAE), and (iii) microwave extraction (MWE). For all 12 medicinal plants tested, the three method extractions mentioned above were applied to each of the two formulations of the analyzed plant material (CS and FG), resulting in a total of 72 analyzed samples. The extracts, obtained as follows, were stored at 2–4 °C until tested for antioxidant and antimicrobial activities.

2.3.1. Conventional Extraction with Solvents (CES)

The plant sample (0.5 g) was extracted with 30 mL of 70% ethanol (Sigma-Aldrich; Merck KGaA, Darmstadt, Germany) using a Holt plate stirrer (IDL, Freising, Germany) for 30 min. In the case of the SO2 sample, seeds were used, and the procedure for extracting the active principles was the same as for the other samples. The samples were then filtered and maintained at 4 °C until the chemical and microbiological investigations. A separate sample for each extract was prepared to calculate the dry residue (DR). In this regard, 1 g of plant material and 10 mL of ethanol (Sigma-Aldrich; Merck KGaA, Darmstadt, Germany) were extracted by stirring using the above procedure. The extract was dried in a drying oven (Binder GmbH, Tuttlingen, Germany) at 100 °C, and the amount obtained was reported to the plant material used.

2.3.2. Ultrasound-Assisted Extraction (UAE)

The mixture of sample (0.5 g) and 30 mL of 70% ethanol was placed in an ultrasonic water bath (FALC Instruments, Treviglio, Italy), and the extraction proceeded for 30 min at room temperature with a frequency of 40 kHz and 216 W of ultrasonic power. The extracts were filtered through Whatman filter paper (Sigma-Aldrich; Merck KGaA, Darmstadt, Germany) and stored at 4 °C for further analysis.

2.3.3. Microwave Extraction (MWE)

The mixture of sample (0.5 g) and 30 mL of 70% ethanol was subjected to microwave extraction for 10 min at a power of 600 W. The extracts were then filtered through Whatman filter paper (Sigma-Aldrich; Merck KGaA, Darmstadt, Germany) and stored at 4 °C for further analysis.

2.4. Chemical Analysis

2.4.1. Proximate Composition of Medicinal Plants

The proximate composition of medicinal plants included humidity, proteins, lipids, and mineral substances and was determined according to the guidelines of the standard method of the Association of Official Analytical Chemists (AOAC) (2000) [18]. The carbohydrate content (%) was obtained from the difference. The energy value was determined taking into account the calories in each fraction (lipids, proteins, and carbohydrates).

2.4.2. Elemental Composition of Medicinal Plants

The macro- and microelement composition was determined after sample mineralization at 650 °C by calcination in the oven (SLN 53 STD, POL-EKO-Aparatura SP, Wodzislaw, Poland) and extraction in 20% HCl (Sigma-Aldrich Chemie GmbH, München, Germany). The method used to quantify the main macro- and micro-elements was atomic absorption spectroscopy (AAS). The procedure for identification and quantification is described by Posta et al. [19].

2.4.3. Total Phenolic Content (TPC) of Medicinal Plant Extracts

The Folin-Ciocalteu method was used in order to determine the total phenolic content (TPC) [20]. The results were done in mg gallic acid equivalent (GAE)/g dry matter (DM) as a mean of three determinations. The calibration curve was performed in the range of 2.5–250 µg/mL concentrations using standard gallic acid (Sigma-Aldrich Chemie GmbH, München, Germany).
In order to compare the TPC between the obtained experimental variants (GS/FG) and the applied extraction methods (CES, UAE, and MWE), the following indicator was used
I n c r e a s i n g   T P C F G / G S ( % ) = [ T P C F G T P C G S   T P C G S ] × 100  
where
TPCFG—TPC of FG sample (mg GAE/g DM)
TPCGS—TPC of GS sample (mg GAE/g DM)

2.4.4. Total Flavonoids Content (TFC) of Medicinal Plant Extracts

The total flavonoid content (TFC) was determined according to the method presented by Plustea et al. [21]. The results were done in mg quercetin (QE)/g sample as a mean of three determinations. The calibration curve was obtained in the concentration range of 0.5–50 µg/mL using standard quercetin (Sigma-Aldrich Chemie GmbH, München, Germany).
In order to compare the TFC between the obtained experimental variants (GS/FG) and the applied extraction methods (CES, UAE, and MWE), the following indicator was used
I n c r e a s i n g   T F C F G / G S ( % ) = [ T F C F G T F C G S   T F C G S ] × 100  
where
TFCFG—TFC of FG sample (mg GAE/g DM)
TFCGSTFC of GS sample (mg GAE/g DM)

2.4.5. Antioxidant Activity (AA) of Medicinal Plant Extracts

The antioxidant activity of medicinal plant extracts was evaluated according to the FRAP method [22]. The results were given in mM Fe2+/100 g DM as the mean of three determinations. For the preparation of the calibration curve, standards with known concentrations of ferrous ions in the range of 0.05–0.4 μM/mL
In order to compare the AA between the obtained experimental variants (GS/FG) and the applied extraction methods (CES, UAE, and MWE), the following indicator was used
I n c r e a s i n g   A A F G / G S ( % ) = [ A A F G A A G S   A A G S ] × 100  
where
AAFG—AA of FG sample expressed as FRAP (mM Fe2+/100 g DM)
AAGS—AA of GS sample expressed as FRAP (mM Fe2+/100 g DM)

2.4.6. Individual Polyphenols Content Detected by LC-MS

The individual polyphenol (IP) content was determined using the LC-MS method, as presented by Cadariu et al. [23]. The equipment used was LC-MS (Shimadzu 2010 EV, Kyoto, Japan) with electrospray ionization and SPD-10A UV and LC-MS 2010 detectors. The chromatographic separation was done using a Nucleodur CE 150/2 C18 Gravity SB column (150 mm × 2.0 mm) (Macherey-Nagel GmbH & Co. KG, Düren, Germany) and a flow rate of 0.2 mL/min. The elution gradient was used to separate the compounds from a mixture of A (aqueous formic acid solution, pH = 3) and B (acetonitrile and formic acid solution, pH = 3). The gradient applied was: first 20 min 5% B, between 20–50 min 5–40% B, (between 50–55 min 40–95% B and between 55–60 min 95% B. The calibration curves were run in the 20–50 g/mL range. The individual polyphenols were expressed as mg/g dry matter (DM) as mean value of three determinations ± standard deviation (SD).

2.5. Microbiological Assay

The optimized extracts for each medicinal plant obtained according to the methodology presented in the statistical part were tested in order to assess the antimicrobial activity against seven standardized bacterial strains: Streptococcus pyogenes (ATCC 19615), Staphylococcus aureus (ATCC 25923), Escherichia coli (ATCC 25922), Shigella flexneri (ATCC 12022), Pseudomonas aeruginosa (ATCC 27853), Haemophilus influenzae type B (ATCC 10211), Salmonella typhimurium (ATCC 14028) and two fungal strains: Candida parapsilopsis (ATCC 22019) and Candida albicans (ATCC 10231).
The antimicrobial activity was tested according to the CLSI Standard [24]. First, the minimum inhibitory concentration (MIC) for each extract was determined by measurement of optical density (OD) spectrophotometrically at 540 nm [25]. The microdilution method tested different extract concentrations (15–60 mg/mL). The MIC value was determined using Equation (4)
M I C = N C N t N c × 100 ( % )  
where
Nc—number of microorganisms in the positive control
Nt—number of microorganisms in the treated samples
The bacterial inhibition rate (BIR) was calculated using the following formula
B a c t e r i a l   i n h i b i t i o n   r a t e   ( B I R ) = 100 [ O D s a m p l e O D n e g a t i v e   c o n t r o l × 100 ]   ( % )  
where
ODsample—optical density (540 nm) for extracts in the presence of the selected bacteria (mean of 3 determinations);
ODnegative control—optical density (540 nm) for the selected bacteria in BHI (mean of 3 determinations).

2.6. Statistical Analysis

Differences between means were analyzed with a one-way ANOVA, followed by multiple comparisons using the t-test (two-sample assuming equal variances) using GraphPad Prism 8.0.2. Differences were considered significant when p-values < 0.05. Principal component analysis (PCA) was performed using the Euclidean distance, according to Statistica 10.0 (StatSoft Inc., Tulsa, OK, USA).

3. Results and Discussion

3.1. Proximate Composition of Medicinal Plants

The proximate composition of the analyzed medicinal plants is presented in Table 2. The results highlight that the humidity of the samples, dried at room temperature, varies between 6 and 12%. The average moisture content in medicinal samples was 8.57%; the minimum value was recorded in HP (6.19%), and the maximum value was detected in EP (12.45%).
The ash content varied significantly from 3.57% HP to 12.82% MO, with an average value of 8.035%. No significant differences were recorded (p < 0.05) between the pairs: MP/MO, LA/AM/SO1, TS/OV.
The lipid content varied between 0.43 mg/100 g in HO and 3.84 mg/100 g in SO2. The content of seeds in SO2 samples is responsible for the highest lipid value.
The protein content of the analyzed medicinal plants varies between 8.75 and 21.34%. The minimum value of the protein content was recorded in the case of species TS and the maximum in the case of species MO. According to the t-test (p < 0.05), no significant differences were recorded between the MP/HP, LA/SO2/SO1, and LA/OV.
The proximate composition of the analyzed plants is consistent with data reported in the specialized literature. Zain et al. (2013) revealed values between 5.55–14.22% for moisture, 2.32–21.15% for ash, 4.51–12.10% proteins, 2.52–16.49% lipids, and 32.35–92.65% carbohydrates in different medicinal plants [26].
Similar results regarding the proximate composition were reported in the literature for medicinal plants from the Lamiaceae family from the Banat region, Romania. Thus, the protein content varied between 4.81–8.25%, lipid 5.64–8.96%, mineral substances, expressed as ash, between 7.44–10.69%, and the carbohydrate content between 64.54–74.02%, for an average moisture content of 8.79 % [27].
Another study reported the protein content in the medicinal plant as MP between 2.19 and 7.69%, lipid between 0.5 and 5% depending on the humidity content of the sample, and ash content between 3.5% in the fresh plant and 22% in the dry plant material [28]. Some differences regarding the obtained chemical composition values are due to environmental, pedological, and agrotechnical factors and botanical variation.

3.2. Elemental Composition of Medicinal Plants

The experimental results regarding the elemental composition (Table 3) highlight that potassium was the macroelement with the highest concentration present in the analyzed plant matrices, followed by calcium and magnesium. Potassium content varies between 9045.2 ppm in LA and 3459 ppm in AM, in agreement with literature studies that reported a wide value range (715–29,688 ppm) [29]. No significant differences in K content (p < 0.05) were recorded between the MO/HP, TS/AM/OV, and HO/SO2.
The potassium content reported in the literature data for medicinal plants from the Lamiaceae family varies depending on the geographical area and pedological, agrotechnical, and climatic conditions. Thus, for medicinal plants from Jordan, the level of K was lower compared to the data recorded in the current study, being between 665 and 880 ppm [30], while other authors determined a potassium content similar to that reported in this study, being between 2450 and 14,991 ppm [26].
The calcium content varies between 2748.35 ppm, the minimum value recorded in OV, and 7575.43 ppm in LA. The previous analysis of the elemental composition of some medicinal plants revealed a calcium intake between 82 and 2223 ppm, with maximum values recorded in the case of the Lamiaceae family (1656 ppm for SO and 2223 ppm for OV) [30].
The magnesium content varies within tight limits (357.61–463.01 ppm), except for LA, for which a maximum value of 605.26 ppm is recorded. Magnesium content varies widely in medicinal plants from different geographical areas. A content between 1292 and 45,460 ppm has been reported in medicinal plants from Pakistan [26], while in samples from Spain, Bulgaria, and Egypt, the level of Mg was between 1616 and 6405 ppm [29]. No significant differences regarding the Mg content were recorded (p < 0.05) between the pairs: Mp/HP/EP, TS/AM/OV, and MO/CO.
Regarding the microelement composition of the plant matrices studied, it is noted that plants from the Lamiaceae family (MP, SO, LA, OV, MO) are characterized by a high intake of iron, zinc, and EP copper. Maximum values of trace elements were recorded: for manganese in MP (46.1 ppm), for zinc in LA (35.71 ppm), for iron in TS (489 ppm), and for copper in HO (14.57 ppm). No significant differences regarding the Mn content (p < 0.05) were recorded between the pairs: AM/OV/HO/LA/MO/HP, TS/SO1, and Zn content (MP/HP, TS/OV, SO1/CO, SO2/LA).
Literature studies indicate an iron content between 89–853 ppm [29], 166.5–479.5 ppm [27], copper between 5.5–9.74 ppm [31] and 89–853 ppm [29], zinc between 23–68 ppm [29] and 3.3–5.12 ppm [27], respectively, and Mn between 46–2134 ppm [29].
The content of elements in plants is influenced by the preferential absorption of plants, the content of elements in the soil, its characteristics, and the culture technology.

3.3. Total Phenols Content (TPC) of Medicinal Plant Extracts

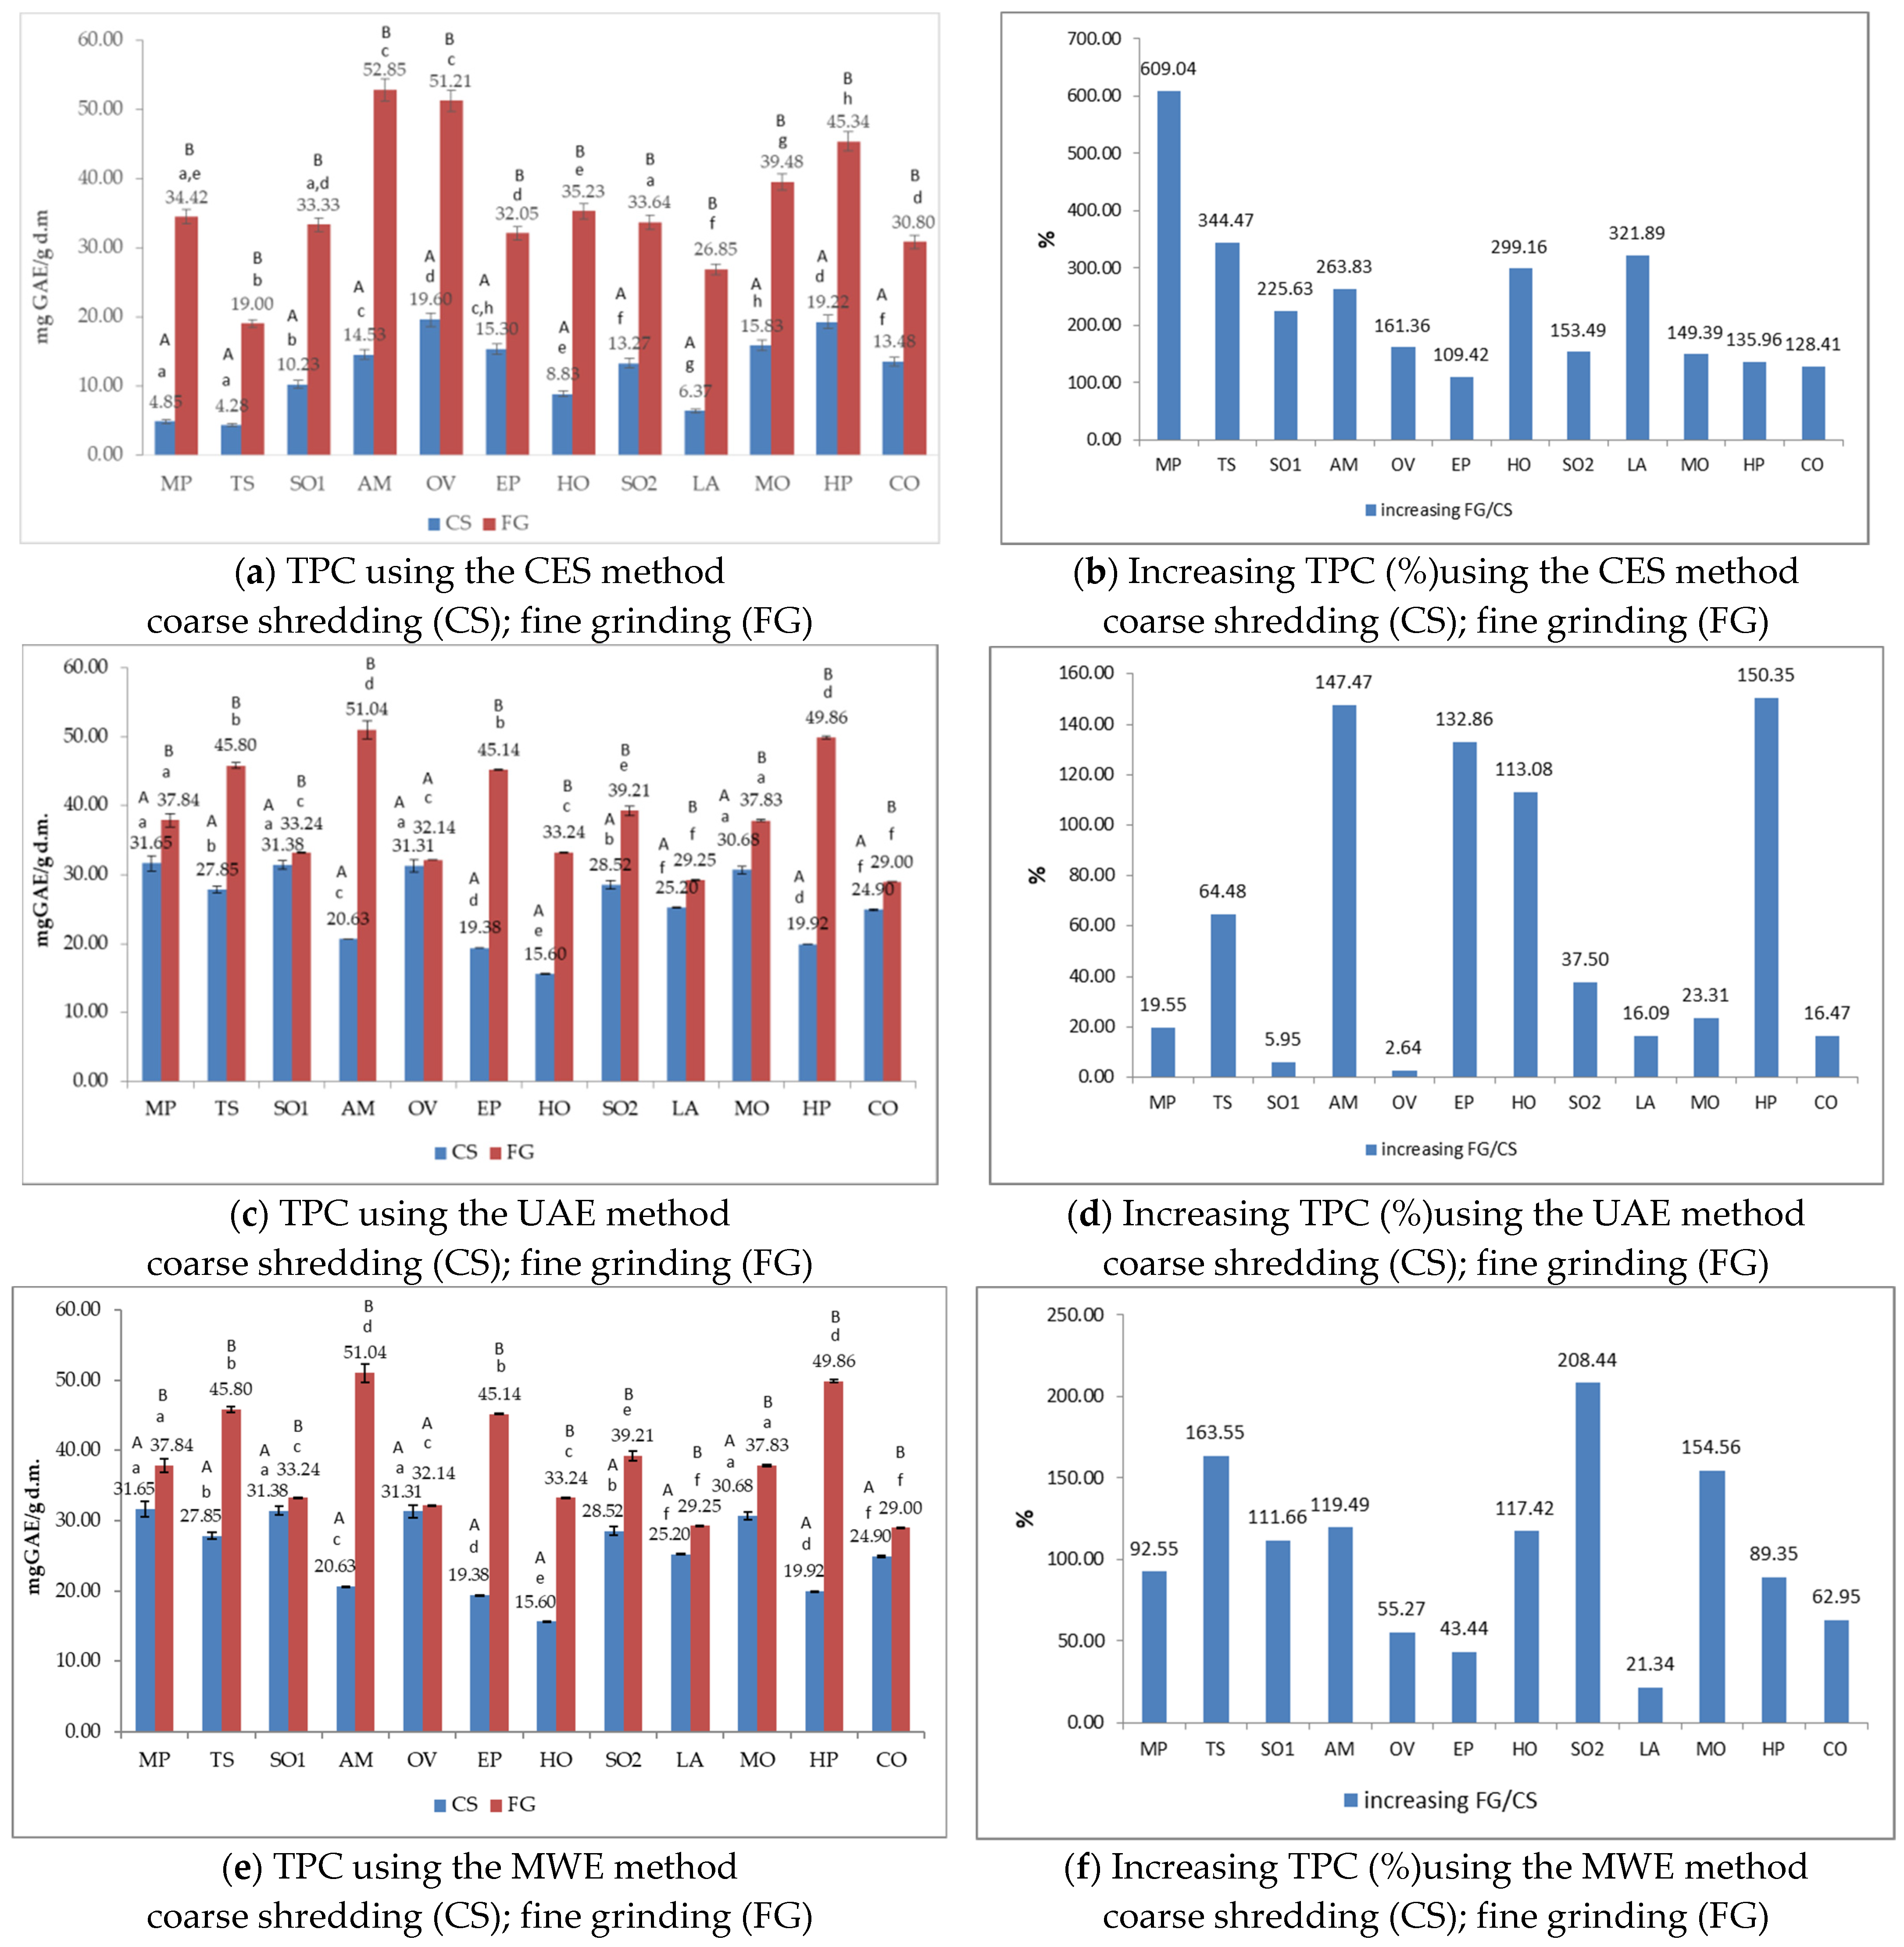
Figure 2 shows the TPC for the CS/FG samples extracted by CES, UAE, and MWE. Figure 2a,c,e present the content of total polyphenols (TPC) expressed as mgGAE/g dry matter (DM) using CES, UAE, and UWE. Figure 2b,d,f present the increasing/decreasing of TPC (%) after different preparations of the sample (FG/CS) calculated according to Equation (1).
From the results obtained regarding CES (Figure 2a), it can be observed that the TPC in the FG samples is higher than the GS for all analyzed medicinal plants. The TPC value ranged between 4.83–19.2 mgGAE/g DM in the samples CS and between 19.00–52.85 mgGAE/g DM in the samples FG. The maximum TPC content was recorded in AM, OV and HP plants. In the case of CES extraction, significant increases in TPC were recorded forfine grinding (FG) compared to coarse shredding (CS) (Figure 2b). The maximum increase percentage was observed for the MP extract (609.04%) and the minimum for the EP extract (109.42%).
Except for the OV extract, for which no significant differences (p < 0.05) in terms of TPC were observed between the coarsely ground (CS) and powder (FG) variants extracted by the UAE and MWE processes, significant differences were identified for all other medicinal plants. Regarding the differences in TPC between the plants analyzed and processed by the same procedure, most of the samples have statistically significant differences (p < 0.05). The exception was the pairs MP/OV/SO1, AM/EP, OV/HP samples obtained by coarse grinding (CS) and extracted by CES, and between the pairs AM/OV, SO1/CO/EP, MP/SO1/SO2, MP/HO samples obtained by fine grinding (FG) and extracted by CES.
For the GS samples, TPC values obtained by the UAE vary between 12.98 mgGAE/g DM (SO2) and 42.96 mgGAE/g DM (HP), and for FG samples between 29.17 mgGAE/g DM (CO) and 81.35 mgGAE/g DM (HP) (Figure 2c). In the case of the samples extracted using UAE, processing the sample in powder form leads to better extraction of total polyphenols. Other authors reported similar values in alcoholic extracts from medicinal plants: 86.05–274.73 mgGAE/g DM [32], 2.41–7.42 mgGAE/g DM [33], and 51–258 mgGAE/g [34].
Regarding the difference between powdered and crushed samples, the highest value was recorded in the case of HP (38.39 mgGAE/g DM) and the lowest in the case of LA (5.14 mgGAE/g DM). The increase in TPC by processing the sample in powder form compared to the crushed version is minimal for LA (21.34%) and the highest for SO2 (208.44%) (Figure 2d).
The antioxidant activity of phenols is due to their redox properties due to the hydroxyl groups. In the literature studies, the TPC content of medicinal plants belonging to the Lamiaceae family varied between 59.89 and 61.99 mg GAE/g [35], 40 and 60 mg GAE/g DM [36], and 14.53 and 33.22 mg GAE/g DM [37].
Males et al. [38] highlighted the importance of the extraction method on the content of TPC extracted from SO. The TPC determined in the SO extract was 27.05 mg GAE/g DM, similar to the one we obtained in this study in the CS samples (21.81 mg GAE/g DM). Similar results (25.58 mg GAE/g) were obtained for the hydro-methanolic or methanol-acetone extract (17.1 mg GAE/g) [39,40], while extraction with methanol alone led to a lower content of TPC (2.23 mg GAE/g) [41] and 2.337 mg GAE/g, respectively [42]. An content of 9.15 mg GAE/g. was obtained when supercritical fluid extraction of TPC from sage leaves leads was applied [43].
The effect of the extraction solvent on the TPC content was reported by Hassan et al. [44]. The maximum content was recorded in the case of extraction with ethyl acetate (143.5 mg GAE/g) and the lowest in the case of extraction with methylene chloride (41.6 mg GAE/g).
Other studies reported a TPC content of 15.05 mg GAE/g in ethanolic TV extract [38], respectively 10.7–12.63 mg GAE/g in the methanolic extract determined by Goyal et al. [45] or 15.06 mg GAE/g for the methanolic extracts of thyme flowers reported by Jabri Karoui et al. [46]. In HP extract, the TPC was reported in the concentration of 77.72 ± 1.83 mg GAE/g plant material and TFC 1.30 ± 0.10 mg GAE/g [47], while in MP 70.06 mg GAE/g and SO 50.89 mg GAE/g was detected [48].
The TPC for the CS samples extracted with MWE (Figure 2e) is maximum in the plant extracts from the Lamiaceae family: SO1 (33.24 mgGAE/g DM), MP (31.65 mgGAE/g DM), MO (30.68 mgGAE/g DM), TS (27.85 mgGAE/g DM), and minimum in the case of HO (15.60 mgGAE/g DM), HP (19.92 mgGAE/g DM), and EP (19.38 mgGAE/g DM). TPC in FG extracted by MWE was maximum in the cases of AM (51.04 mgGAE/g DM), HP (49.86 mgGAE/g DM), and EP (45.14 mgGAE/g DM) and minimum in the case of OV (15.03 mgGAE/g DM).
Maximum differences between the content of TPC extracted by MWE in CS and FG forms were recorded in the cases of AM (30.42 mgGAE/g DM), HP (29.95 mgGAE/g DM), and EP (25.75 mgGAE/g DM). The differences between the TPC (%) of the crushed microwave-extracted samples and powder are maximum in the case of HP extract (60.06%), followed by AM (59.59%) and EP (57.06%). Minimal percentage differences were recorded in the cases of OV extract (2.57%) and SO (5.62%). The increase in TPC content (%) using MWE from the sample processed in powder form (FG) compared to the crushed sample (CS) (Figure 2f) was maximum in HP extract (150.35%), followed by the 2 medicinal plants from the Asteraceae family: HP (147.47%) and EP (132.86%).
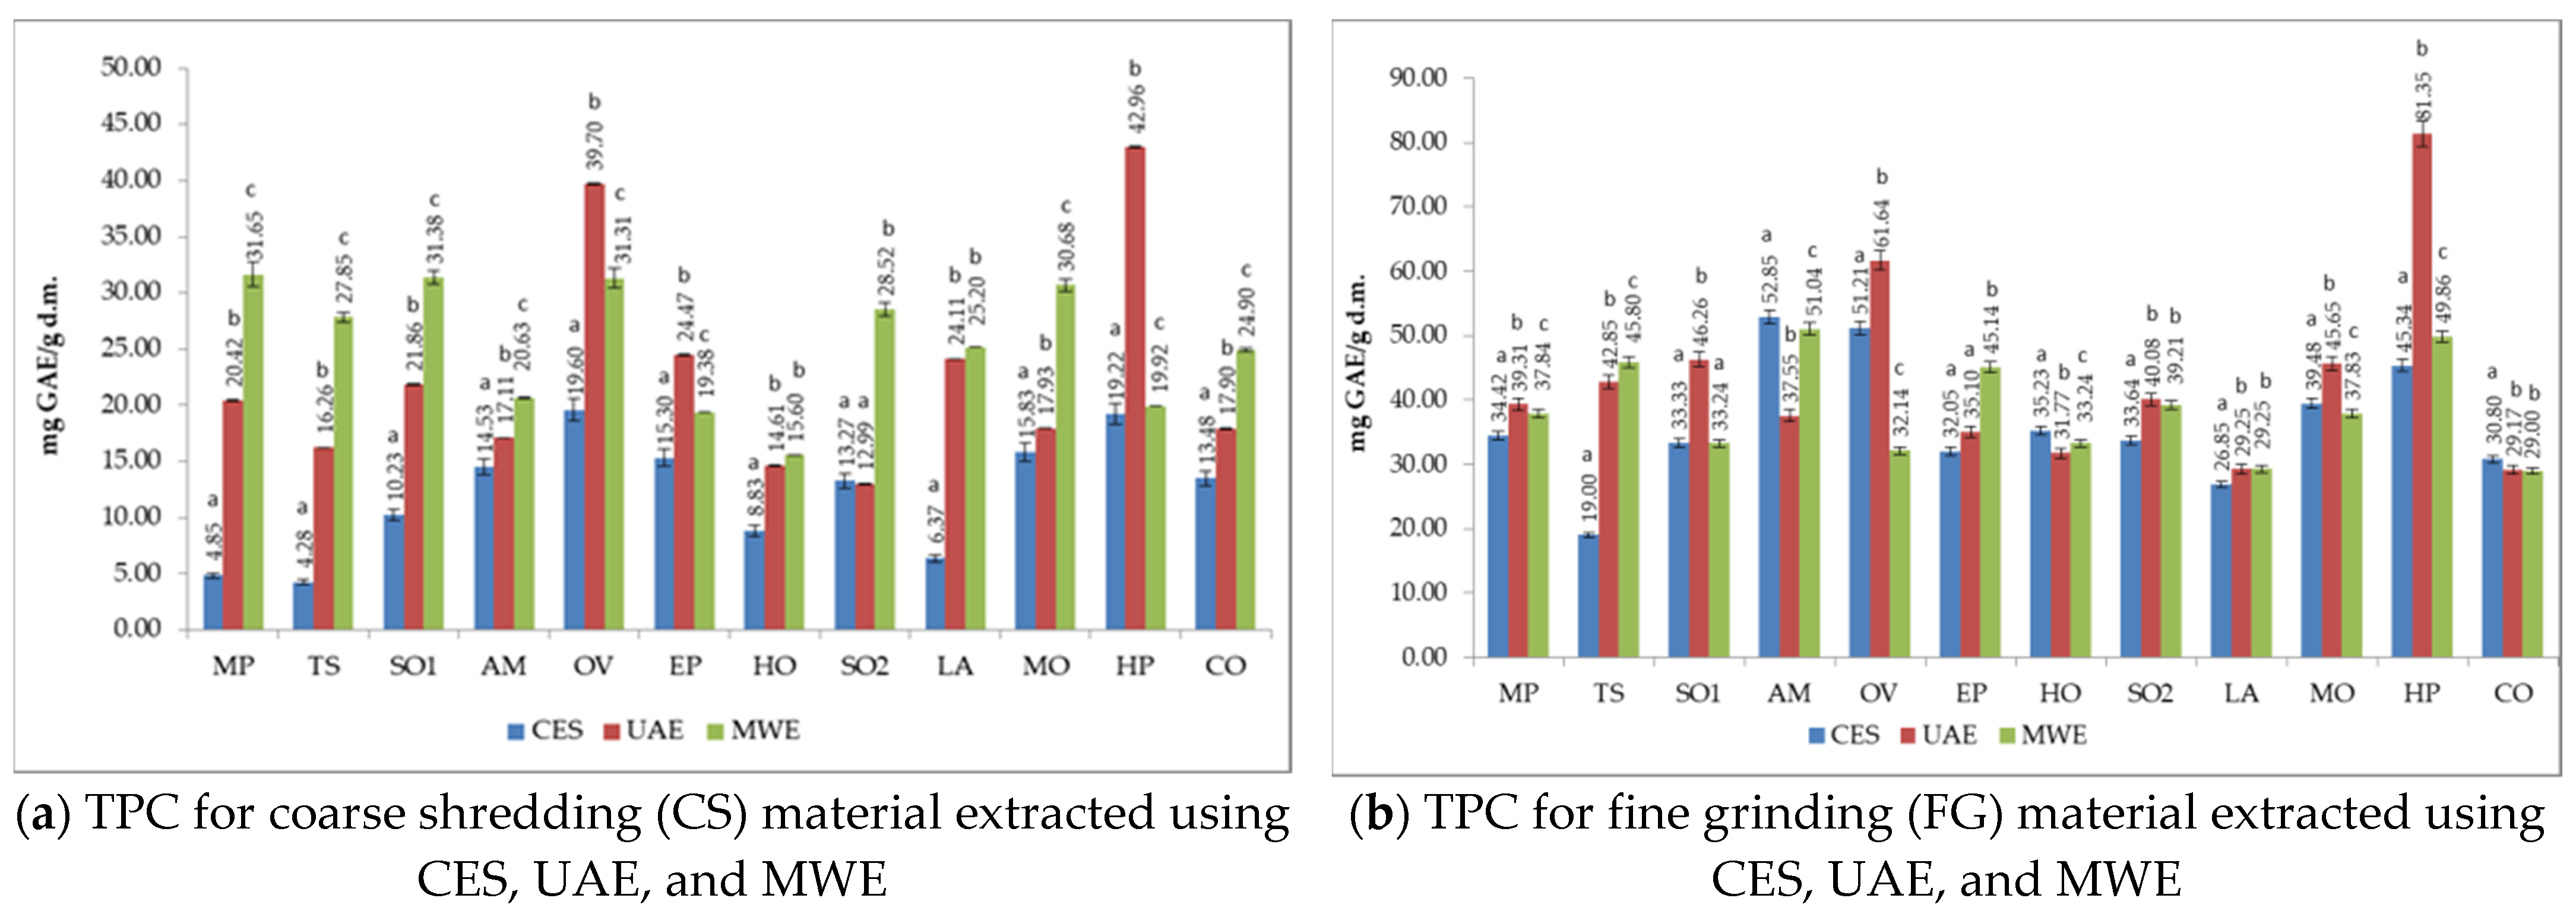
Figure 3 shows the TPC values compared for the three procedures used. It can be observed that MWE ensures the highest extraction of TPC from medicinal plant samples for most of the analyzed samples, except for HP and OV extracts, for which UAE represented the process that led to the highest TPC content, both in the crushed or powdered form of the sample. The preparation of plant material in powder form (FG) increases the ultrasound process’s efficiency in the case of SO and MO extracts.
Significant differences (p < 0.05) from a statistical point of view were recorded between the 3 procedures for the majority of the analyzed plants, prepared in coarse shredding (CS) form. The exceptions were the pairs UAE/MWE in HO and LA extract and the pairs CES/UAE for SO2 extract.
Regarding the FG form, no significant differences (p < 0.05) were obtained between CES and MWE for SO1 and EP and between the pairs UAE and MWE for SO2, LA, and CO.
The classic extraction with solvent (CES) proved to be the procedure with the lowest yield regarding TPC, especially in the case of processing plants in a shredded form (CS). When using the plant material as powder (FG), the conventional extraction method showed efficiency comparable to the other extraction methods and a slightly higher yield in the case of AM, HO, and CO extracts.
Slimestad et al. compared the efficiency of UAE and Soxhlet extraction procedures for 9 medicinal plants from Norway, highlighting the advantage of using UAE compared to the Soxhlet method [49]. On the contrary, another study reported that the extract obtained from EP using the classical solvent extraction contained a higher amount of total phenols and flavonoids than the ultrasound extract [50]. The TPC using classical extraction was 60.2 mg/g and 46.8 mg/g when ultrasound extraction was performed.

3.4. The Antioxidant Activity (AA) of Medicinal Plant Extracts

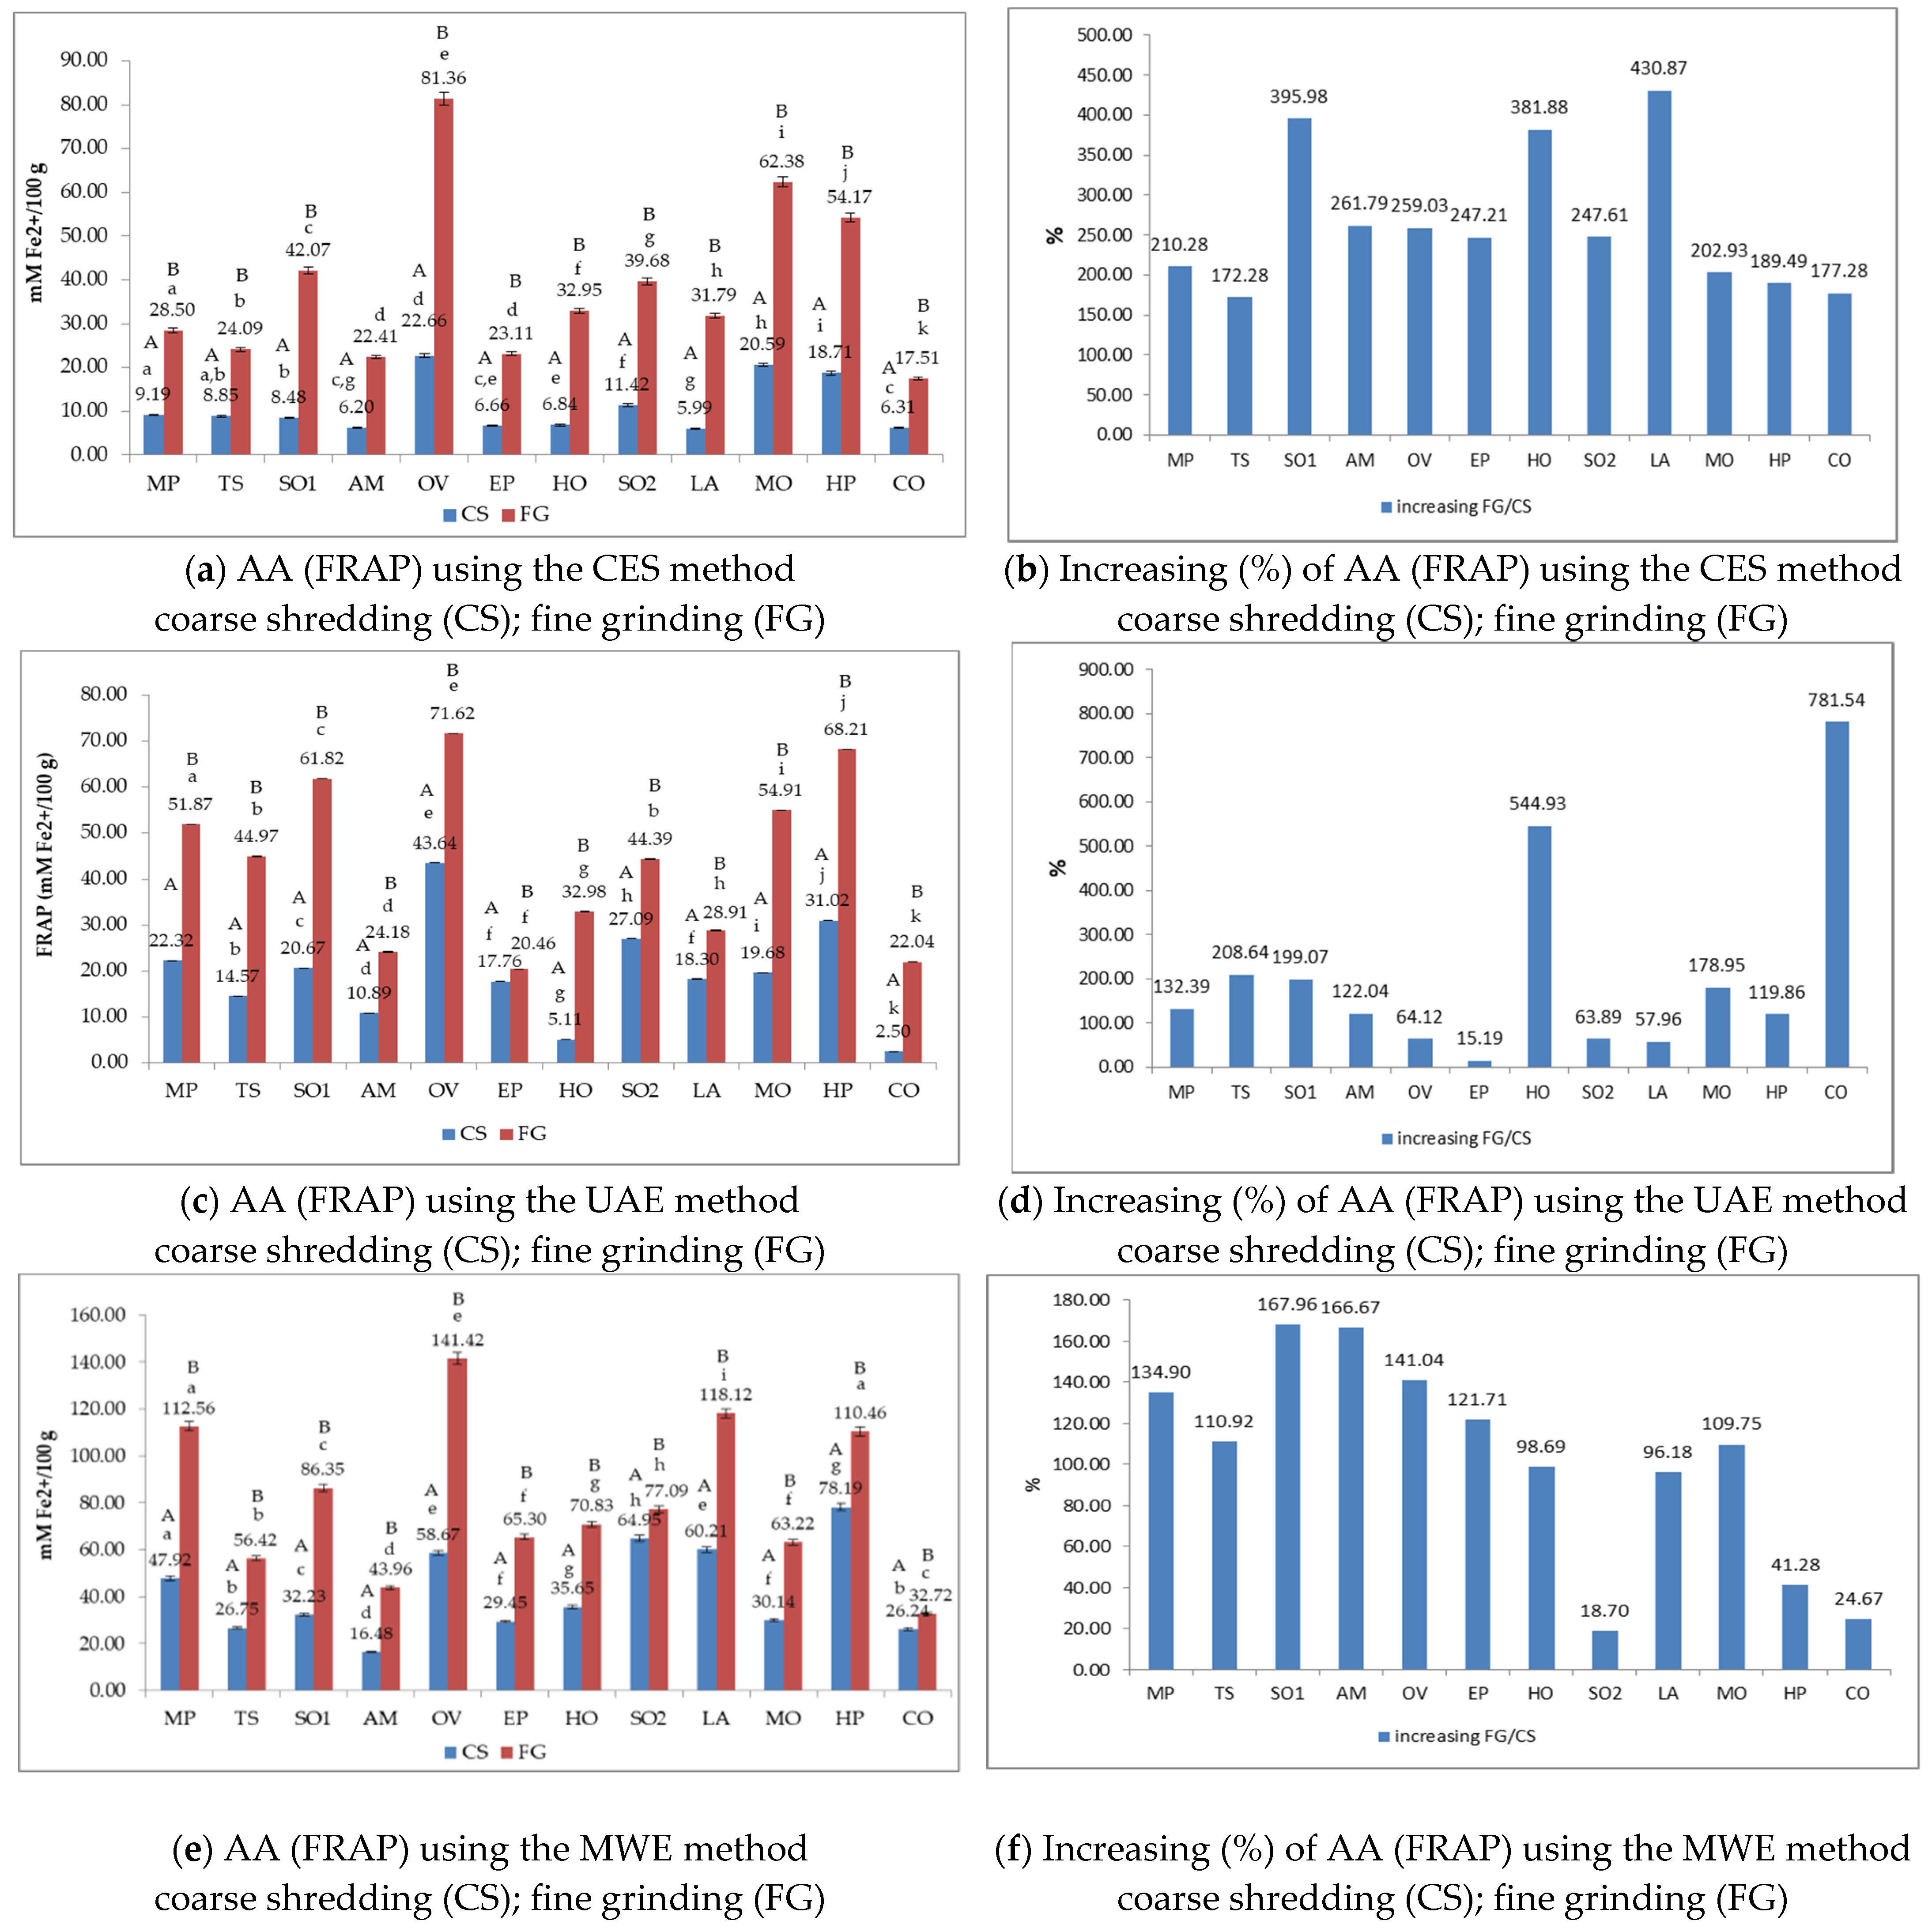
Figure 4 shows the AA, expressed as FRAP, for the CS/FG samples extracted by CES, UAE, and MWE. Figure 4a,c,e present the FRAP values (mM Fe2+/100 g) using CES, UAE, and UWE, and Figure 4b,d,f present the increasing/decreasing FRAP values (%) after different preparations of samples (FG/CS) calculated according to (3).
From the results obtained regarding the extraction by the conventional method (Figure 4a), it can be observed that the highest antioxidant value was found in the OV extract, both in the case of the crushed sample (22.66 mM Fe2+/100 g) and the powder sample (81.36 mM Fe2+/100 g), followed by MO (20.59 mM Fe2+/100 g in the CS sample and 62.38 mM Fe2+/100 g in the FG sample. The lowest FRAP value for the FG sample was recorded in the CO extract (17.51 mM Fe2+/100 g) and for the CS sample in the LA extract (5.99 mM Fe2+/100 g).
In the case of the samples processed by fine grinding into powder form, the AA is higher than the coarse grinding extract for all analyzed extracts. The highest difference was observed in the cases of OV (58.70 mM Fe2+/100 g) and MO (41.79 mM Fe2+/100 g), and the smallest in the case of CO extract (11.19 mM Fe2+/100 g). Expressed in percentages (Figure 4b), the highest increase in AA was recorded for LA extract (430.87%), followed by SO (395.98%), and the lowest in the case of TS (172.28%).
Regarding the AA of the samples extracted by UAE (Figure 4c), it was observed that the highest FRAP value was obtained for OV extract, both in CS form (43.64 mM Fe2+/100 g) and FG form (71.62 mM Fe2+/100 g) followed by HP extract, crushed (31.02 mM Fe2+/100 g), and powder (68.21 mM Fe2+/100 g). The lowest variation was observed in the cases of CO extract through both processing procedures: CS (2.50 mM Fe2+/100 g) or FG (22.04 mM Fe2+/100 g). The highest difference between the AA of the two forms of processing was observed in the case of SO extract (41.15 mM Fe2+/100 g), followed by HP (37.19 mM Fe2+/100 g), and the smallest for EP extract (2.70 mM Fe2+/100 g).
Regarding the percentage evaluation (Figure 4d), the highest increase was observed in the cases of CO extract (781.54%) and HO (544.93%) and the lowest in the case of EP extract (15.19%).
The results obtained agree with those reported by other authors, who reported the AA of medicinal plant extracts expressed as FRAP between 64 and 220 (mM Fe2+/100g extract) [51].
Concerning the MWE (Figure 4e), the increase of AA was also observed in the samples processed in powder form compared to the crushed samples. The highest FRAP value was identified in the OV sample (141.42 mM Fe2+/100 g), followed by LA (118.12 mM Fe2+/100 g), and the lowest for CO extract (32.72 mM Fe2+/100 g). The difference between the two procedures is maximum in OV extract (82.72 mM Fe2+/100 g) and minimum in CO extract (6.48 mM Fe2+/100 g). The highest FRAP increase (Figure 4f) was observed for SO1 (167.96%) and the smallest for SO2 extract (18.7%).
Between the processing in the form of powder (FG) and coarse shredding (CS), significant differences (p < 0.05) were recorded for all plants extracted using the three procedures (CES, UAE, and MWE).
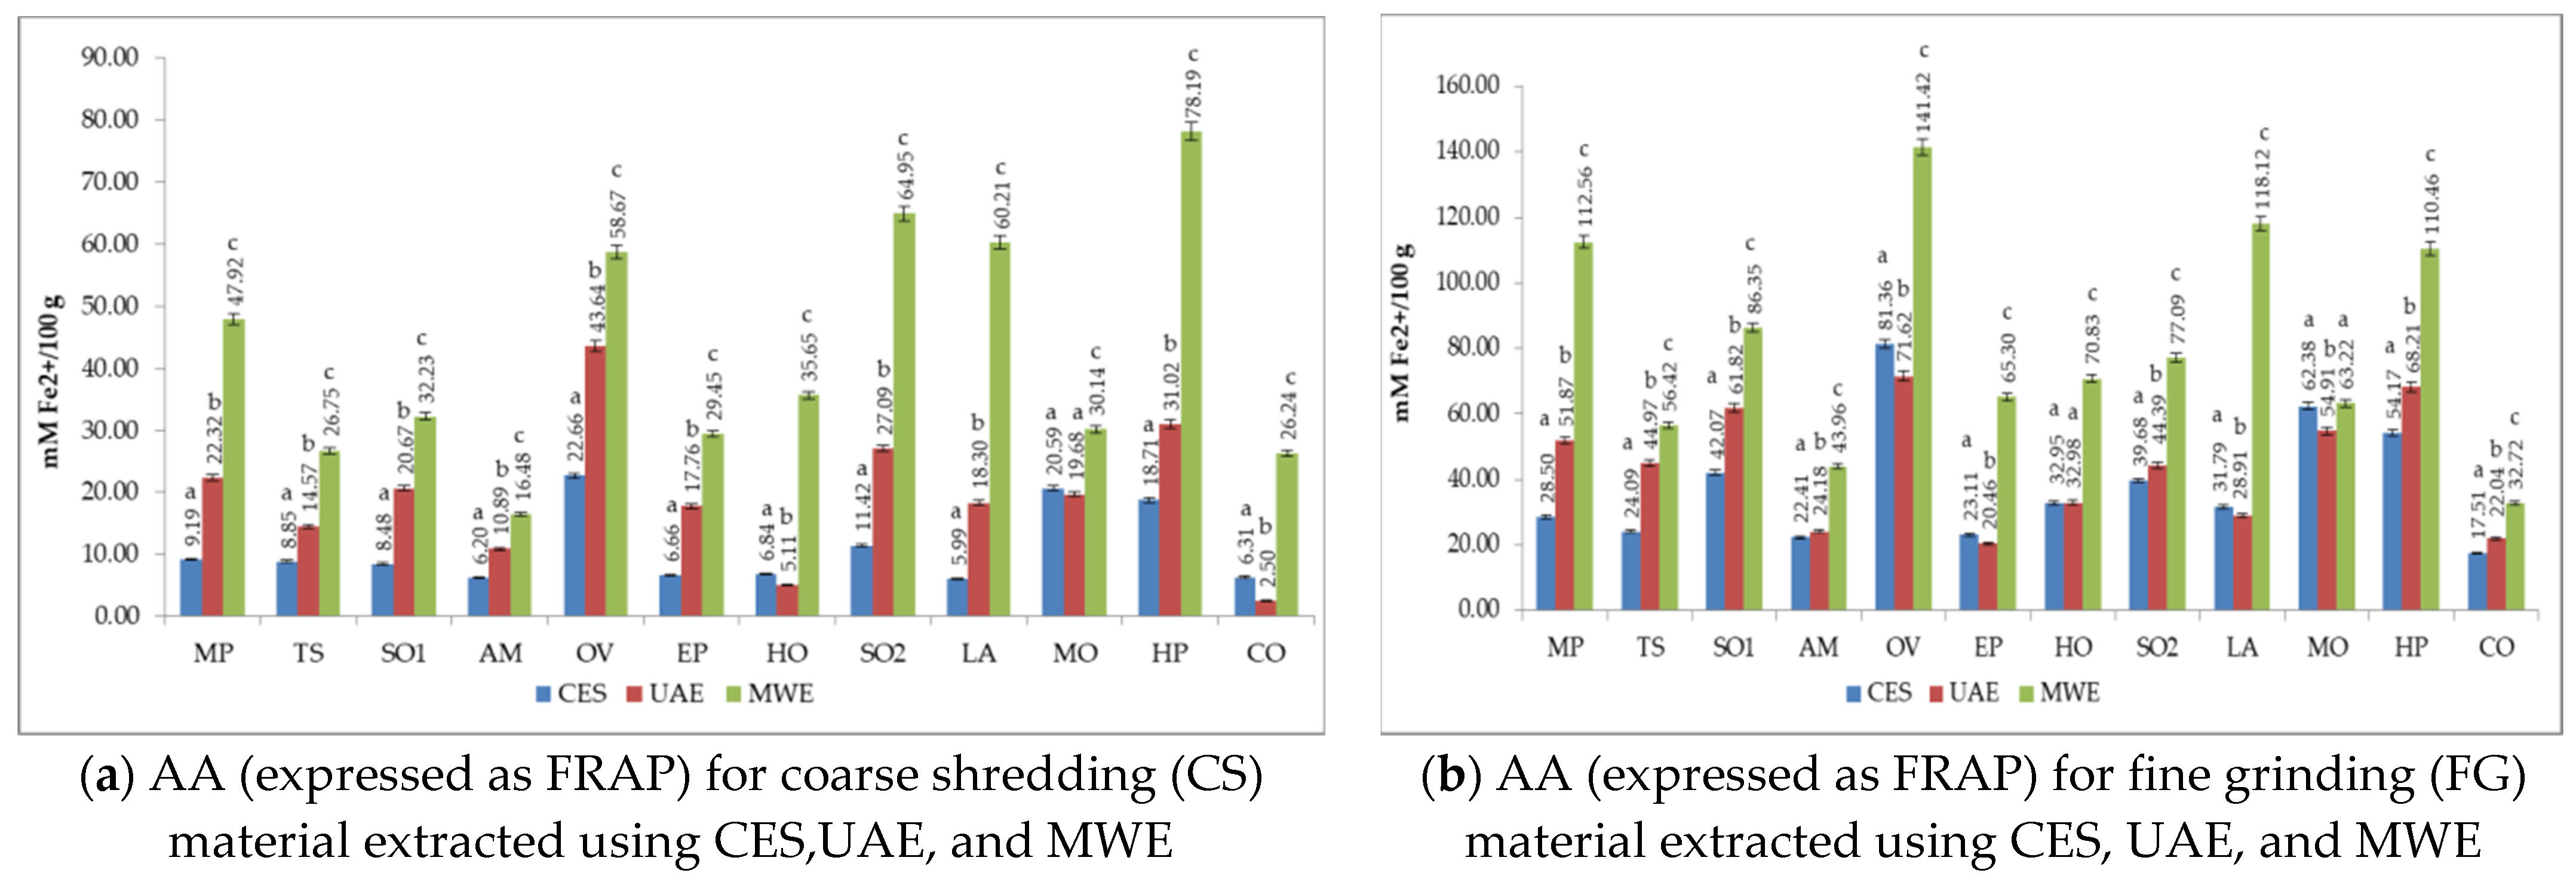
Figure 5 shows that the maximum AA of the extracts was obtained, both for CS and FG samples, for most of the medicinal plants studied in the MWE process, followed by UAE and CES. Between the 3 procedures for the majority of the analyzed plants, prepared in coarse shredding (CS) form, significant differences were observed. The CES/UAE pairs for MO extract were the exceptions. Regarding the FG form, no significant differences (p < 0.05) were obtained between the pairs of CES/UAE for the MO and HO extracts.

3.5. The Total Flavonoids Content (TFC) of Medicinal Plant Extracts

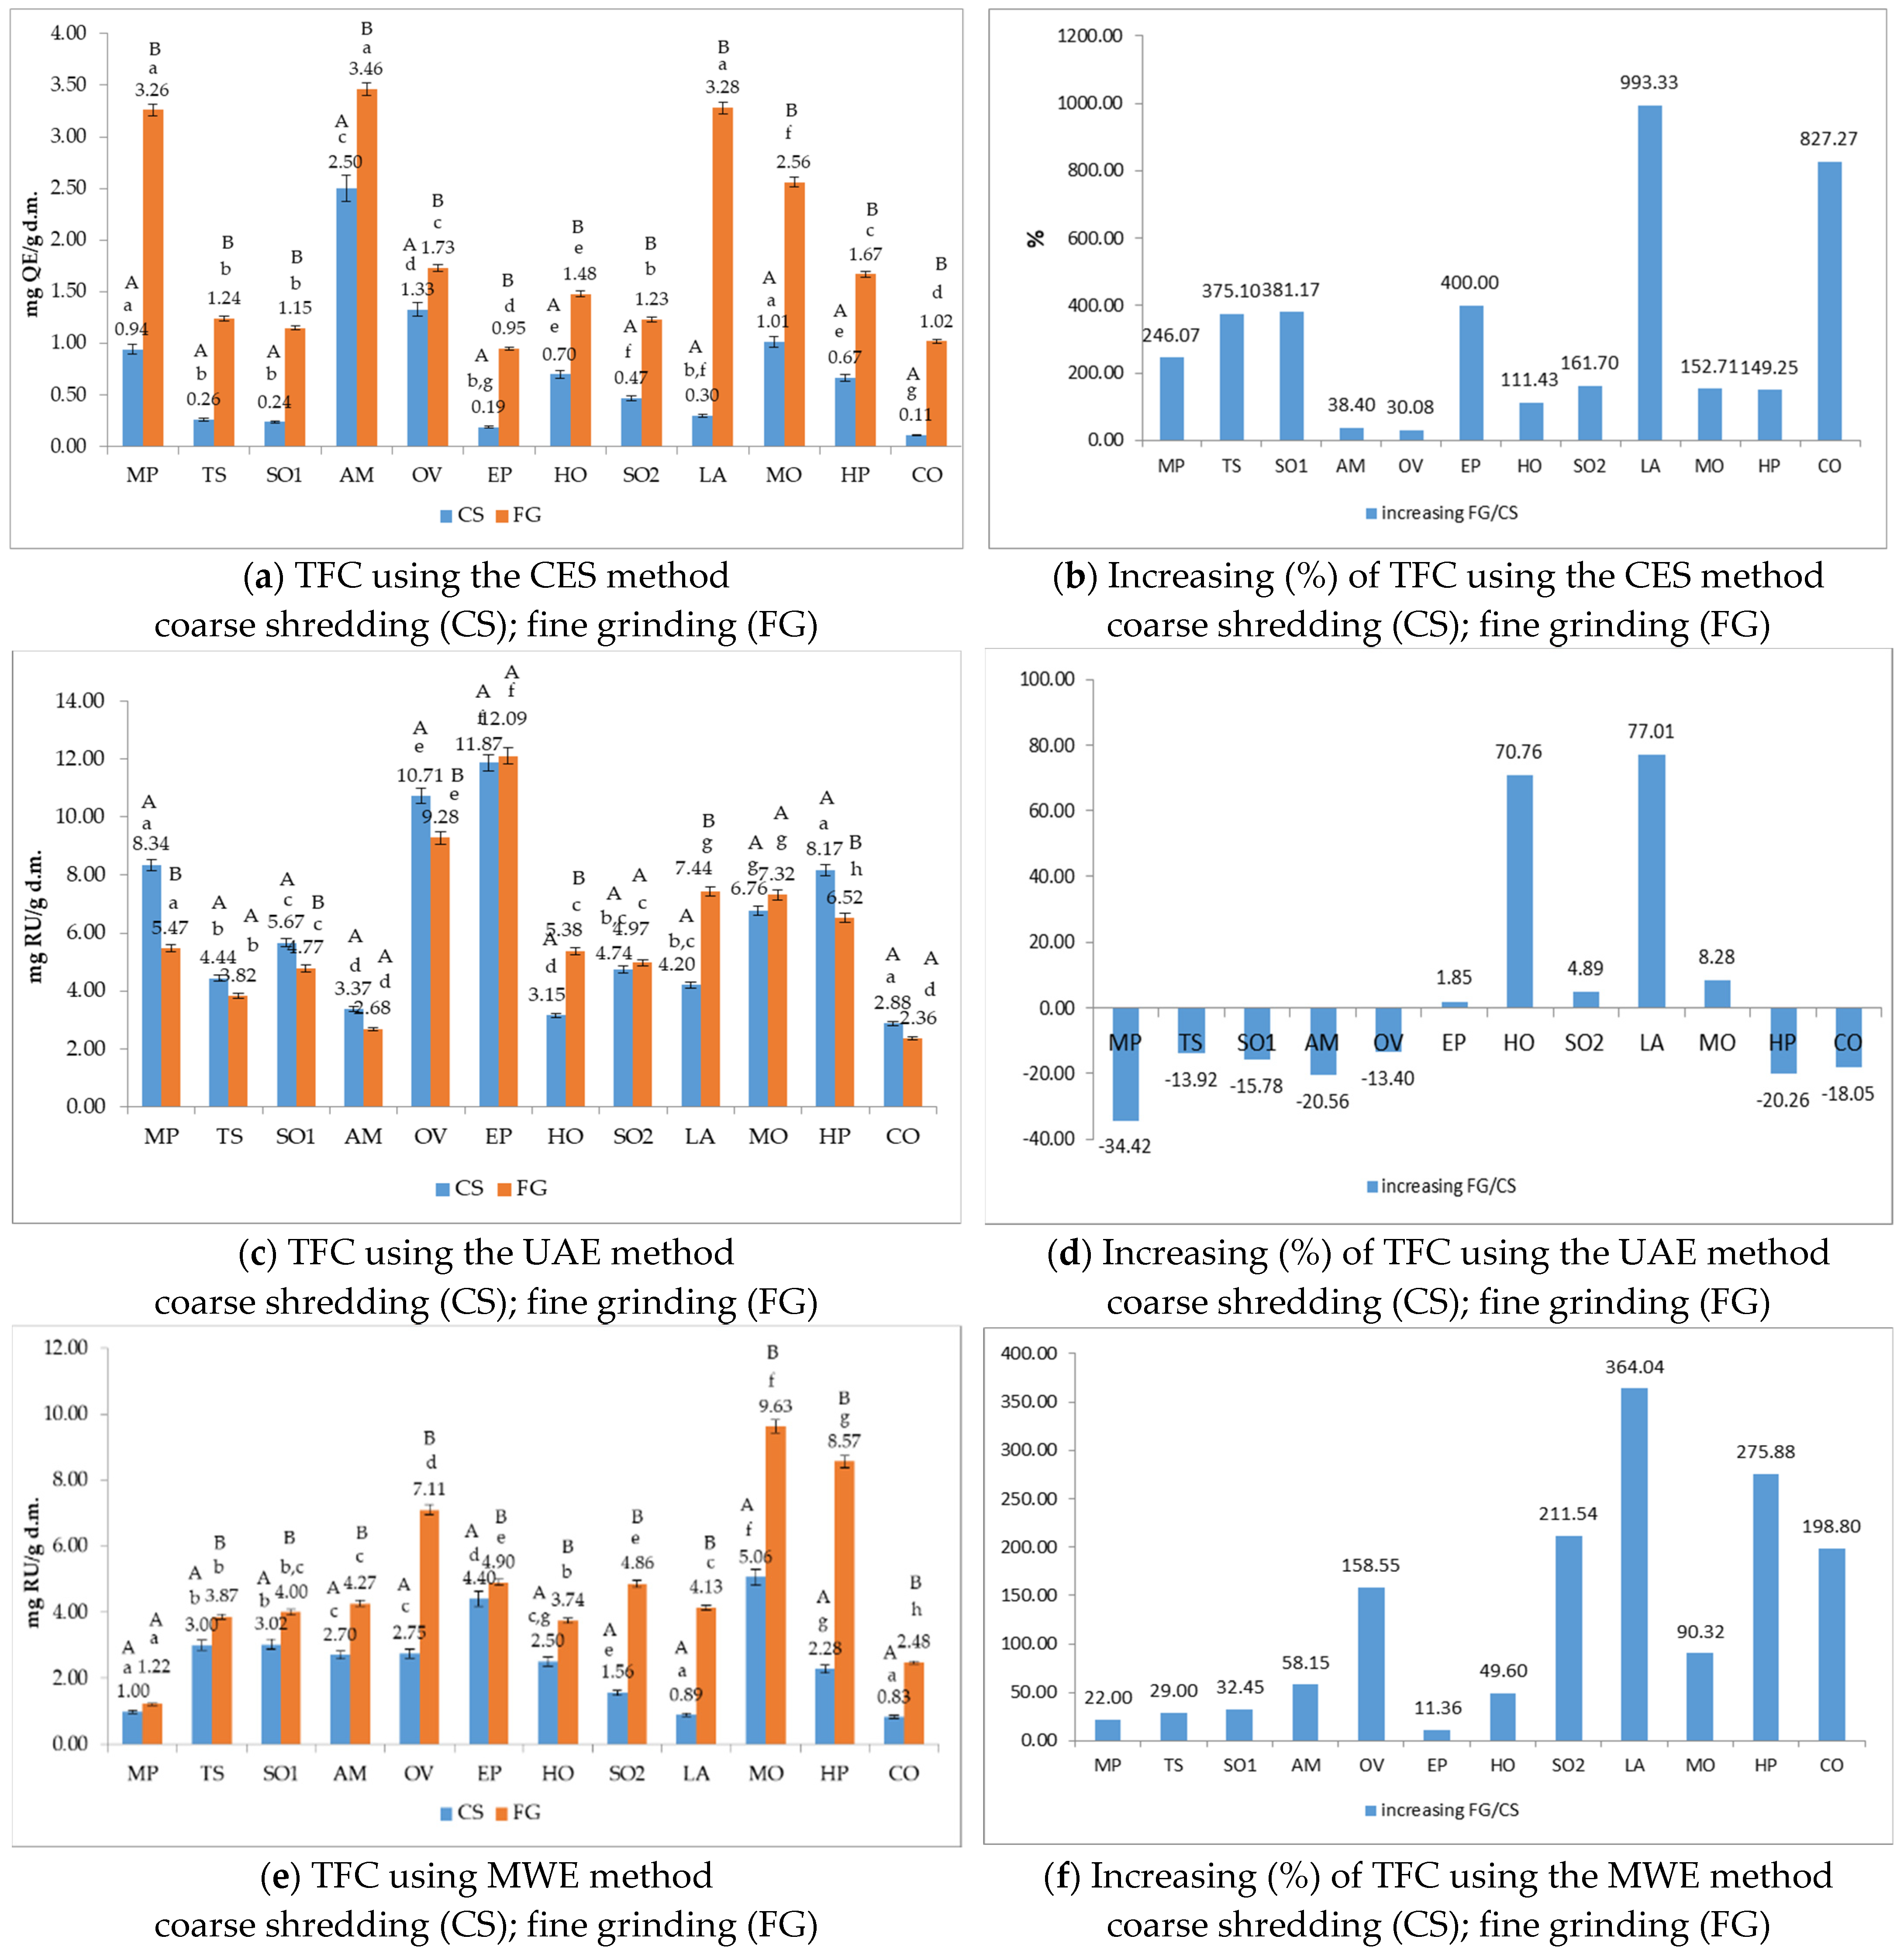
Figure 6 shows the TFC for the CS/FG samples extracted by CES, UAE, and MWE. Figure 6a,c,e present the content of total flavonoids (TFC) expressed as mgQE/g dry matter (DM) using CES, UAE, and UWE. Figure 6b,d,f present the increasing/decreasing of TFC (%) after different preparations of the sample (FG/CS) calculated according to Equation (2).
Flavonoids are secondary plant metabolites with antioxidant in vitro and in vivo activity due to the presence of free OH groups, especially 3-OH [52].
The level of TFC varied between 0.11 and 2.50 mgQE/g DM for samples of CS extracted by CES, between 2.88 and 11.87 mgQE/g DM for samples extracted using UAE, and between 0.83–5.06 mgQE/g DM when MWE was applied. The maximum content of flavonoids was recorded for the CES procedure, MP, LA, and AM extracts. For the UAE process, in the case of OV, MO, and HP extracts, and when MWE was used for MP, EP, and HP extracts (Figure 6a,c,e).
Regarding the samples analyzed in powder form (FG), the TFC values varied in the range of 1.02–3.46 mgQE/g DM when CES was used, between 2.36–12.09 mgQE/g DM for UAE extraction, and between 1.22–9.63 mgQE/g DM in the case of the MWE procedure. With respect to the UAE, favoring the flavonoid extraction process was observed in the case of the crushed version compared to the powder sample for some of the analyzed samples.
The percentage of TFC increased when the vegetal matrix was prepared in powder form (FG) compared to coarse shredding (CS), and both extracts by CES recorded the highest value in the LA sample and the lowest in the OV extract (Figure 6b). On the contrary, coarse grinding (CS) favors TFC extraction compared to plant material in powder form (GV) in the case of MP, TS, AM, OV, HP, CO, and SO1 extracts, and the percentage of decrease is between 13.4 and 34.42%. For EP, HO, LA, and MO SO2 extracts, a slight increase is recorded in the case of the powder form compared to the crushed version (Figure 6d). Processing in the form of powder (FG) leads to a significant increase in TFC compared to the crushed version (CS) if the extraction is carried out using microwaves (MWE) (Figure 6f).
Between the processing in the form of powder (FG) and coarse shredding (CS), significant statistical differences were recorded for all plants extracted using CES. No significant differences were obtained for the TS, AM, EP, SO2, MO, and CO extracts when the extraction was done by UAE or for the MP extract processed by MWE.
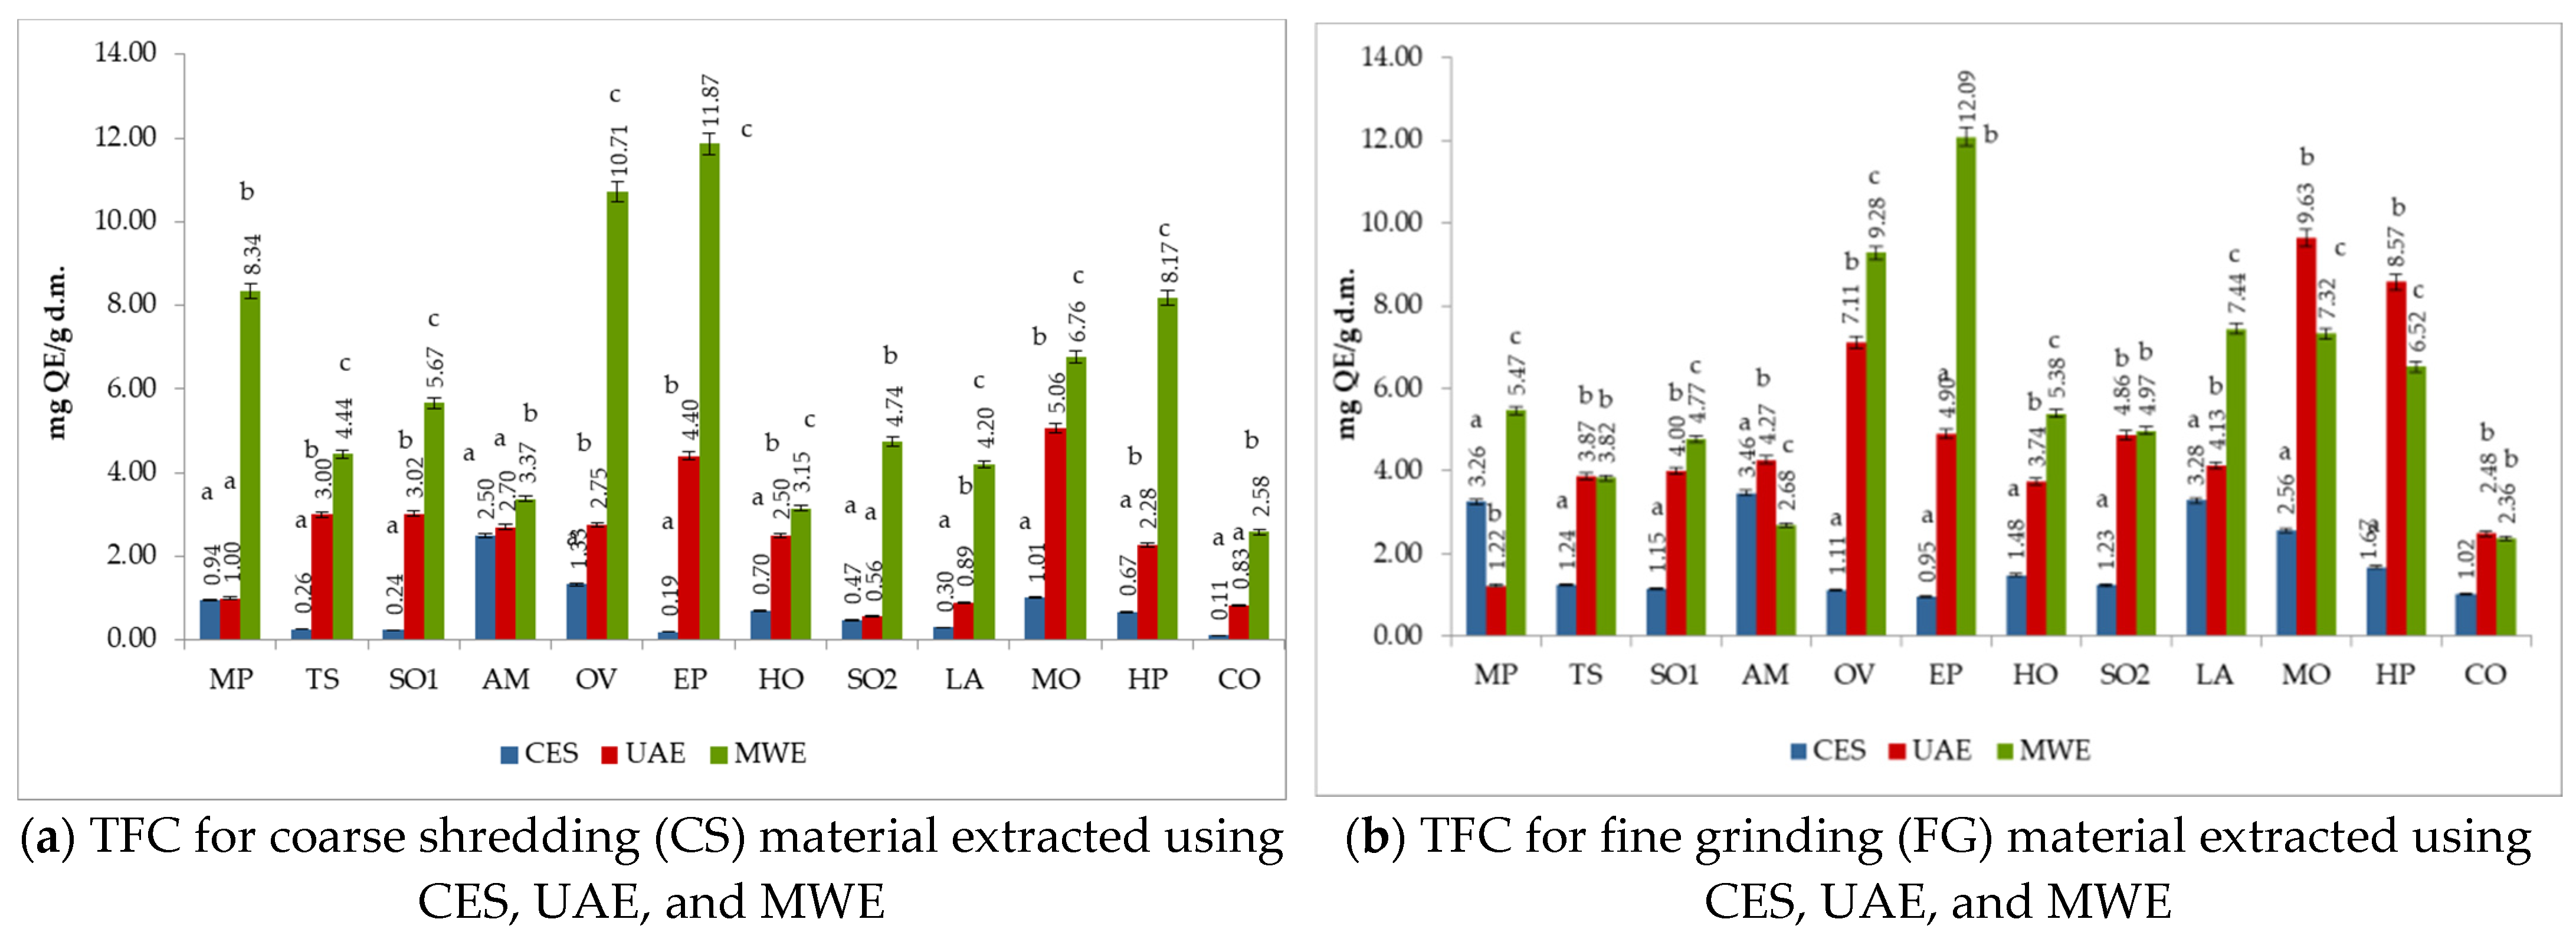
Figure 7 presents the TFC comparatively for the three extraction procedures (CES, UAE, and MWE) and for the two preparation types (CS/FG). Significant statistical differences (p < 0.05) were recorded between the 3 procedures for the majority of the analyzed plants, prepared in coarse shredding (CS) form. The exceptions were the pairs CES/UAE for MP, AM, SO2, and CO extracts. Regarding the FG form, no significant statistical differences (p < 0.05) were obtained between the pairs CES/UAE for the EP extract and between the pairs UAE and MWE for the TS, CO, and SO2 extracts.
The results are similar to those reported in the specialized literature. Literature studies reported TFC in the sage extract at 6.91 mg QE/g [13], 0.923 mg QE/g [42], and 5 mg QE/g, respectively [41]. In the thyme aqueous extract, the TFC content was 3.17 mg QE/g [38], respectively, between the 1.412–2.076 mg QE/g values reported for Thymus species extracted in different solvents [45] and Thymus vulgaris L. methanolic extract [46]. Higher values were reported in the study of Stanislavic et al. in EP extract when classical extraction was used (33.3 mg/g). Also, these authors reported a reduction in TFC when ultrasound extraction was performed (27.0 mg/g) [50].

3.6. The Individual Polyphenols Detected by LC-MS

Table 4 shows the experimental results regarding the chromatographic profile of IP separated by LC-MS. Epicatechin is found in concentrations of 0.18–0.53 mg/g, quercitin 0.05–0.37 mg/g, kaempferol 0.05–0.67 mg/g, gallic acid 0.08–2.17 mg/g, protocatechuic acid 0.05–0.23 mg/g, and rosmarinic acid between 3.39–9.16 mg/g.
Another study reported in the hydroalcoholic extract of MP found rosmarinic acid at 0.23 mg/g, rutin at 9.9 mg/g, but epicatechin was not detectable, and in the extract of SO leaf at 4.69 mg/g, rosmarinic acid but no rutin or epicatechin were reported [48].
The group of Mekinic and al. [53] reported the content of individual polyphenols in different plant extracts belonging to the Lamiaceae family. They identified gallic acid in ethanolic extract of SO (0.09 mg/g), TV (0.13 mg/g), MP (0.06 mg/g), MO (0.07 mg/g), OV (0.05 mg/g), protocatechuic acid in TV (0.13 mg/g) and in MO (0.34 mg/g), but this compound was undetectable in SO, MP and OV extract. Rosmarinic acid was the most relevant individual polyphenol found at a concentration of 25.2 mg/g in SO, 45.8 mg/g in TV, 72.4 mg/g in MO, 51.8 mg/g in MP, and 17.46 mg/g in OV extract. Epicatechin was detected at a concentration between 0.41 and 1.32 mg/g in SO, MP, and OV but was undetectable in TV and MO, while the highest concentration of kaempferol was 0.37 mg/g in TV extract [53].
Vlase et al. obtained in the alcoholic extract of HO a content of hydroxycinnamic acids below 0.2 µg/g plant material, except for ferulic acid at 36.92 ± 1.00 µg/g. Rutin was found in a concentration of 21.93 ± 0.72 µg/g, quercitin 1.79 ± 0.03 µg/g, quercitrin 4.02 ± 0.07 µg/g, and luteolin 29.10 ± 0.19 µg/g [47].
In the alcoholic extract of TS, it was identified as epicatechin (9–11 µg/g), quercitin (0.47–0.65 µg/g), rutin (2.54–2.94 µg/g), kaempferol (0.19–0.53 µg/g), and hydroxycinnamic acids: caffeic acid (0.07–0.53 µg/g), gallic acid (3.89–4.18 µg/g), and ferulic acid (2.65–3.03 µg/g) [54].
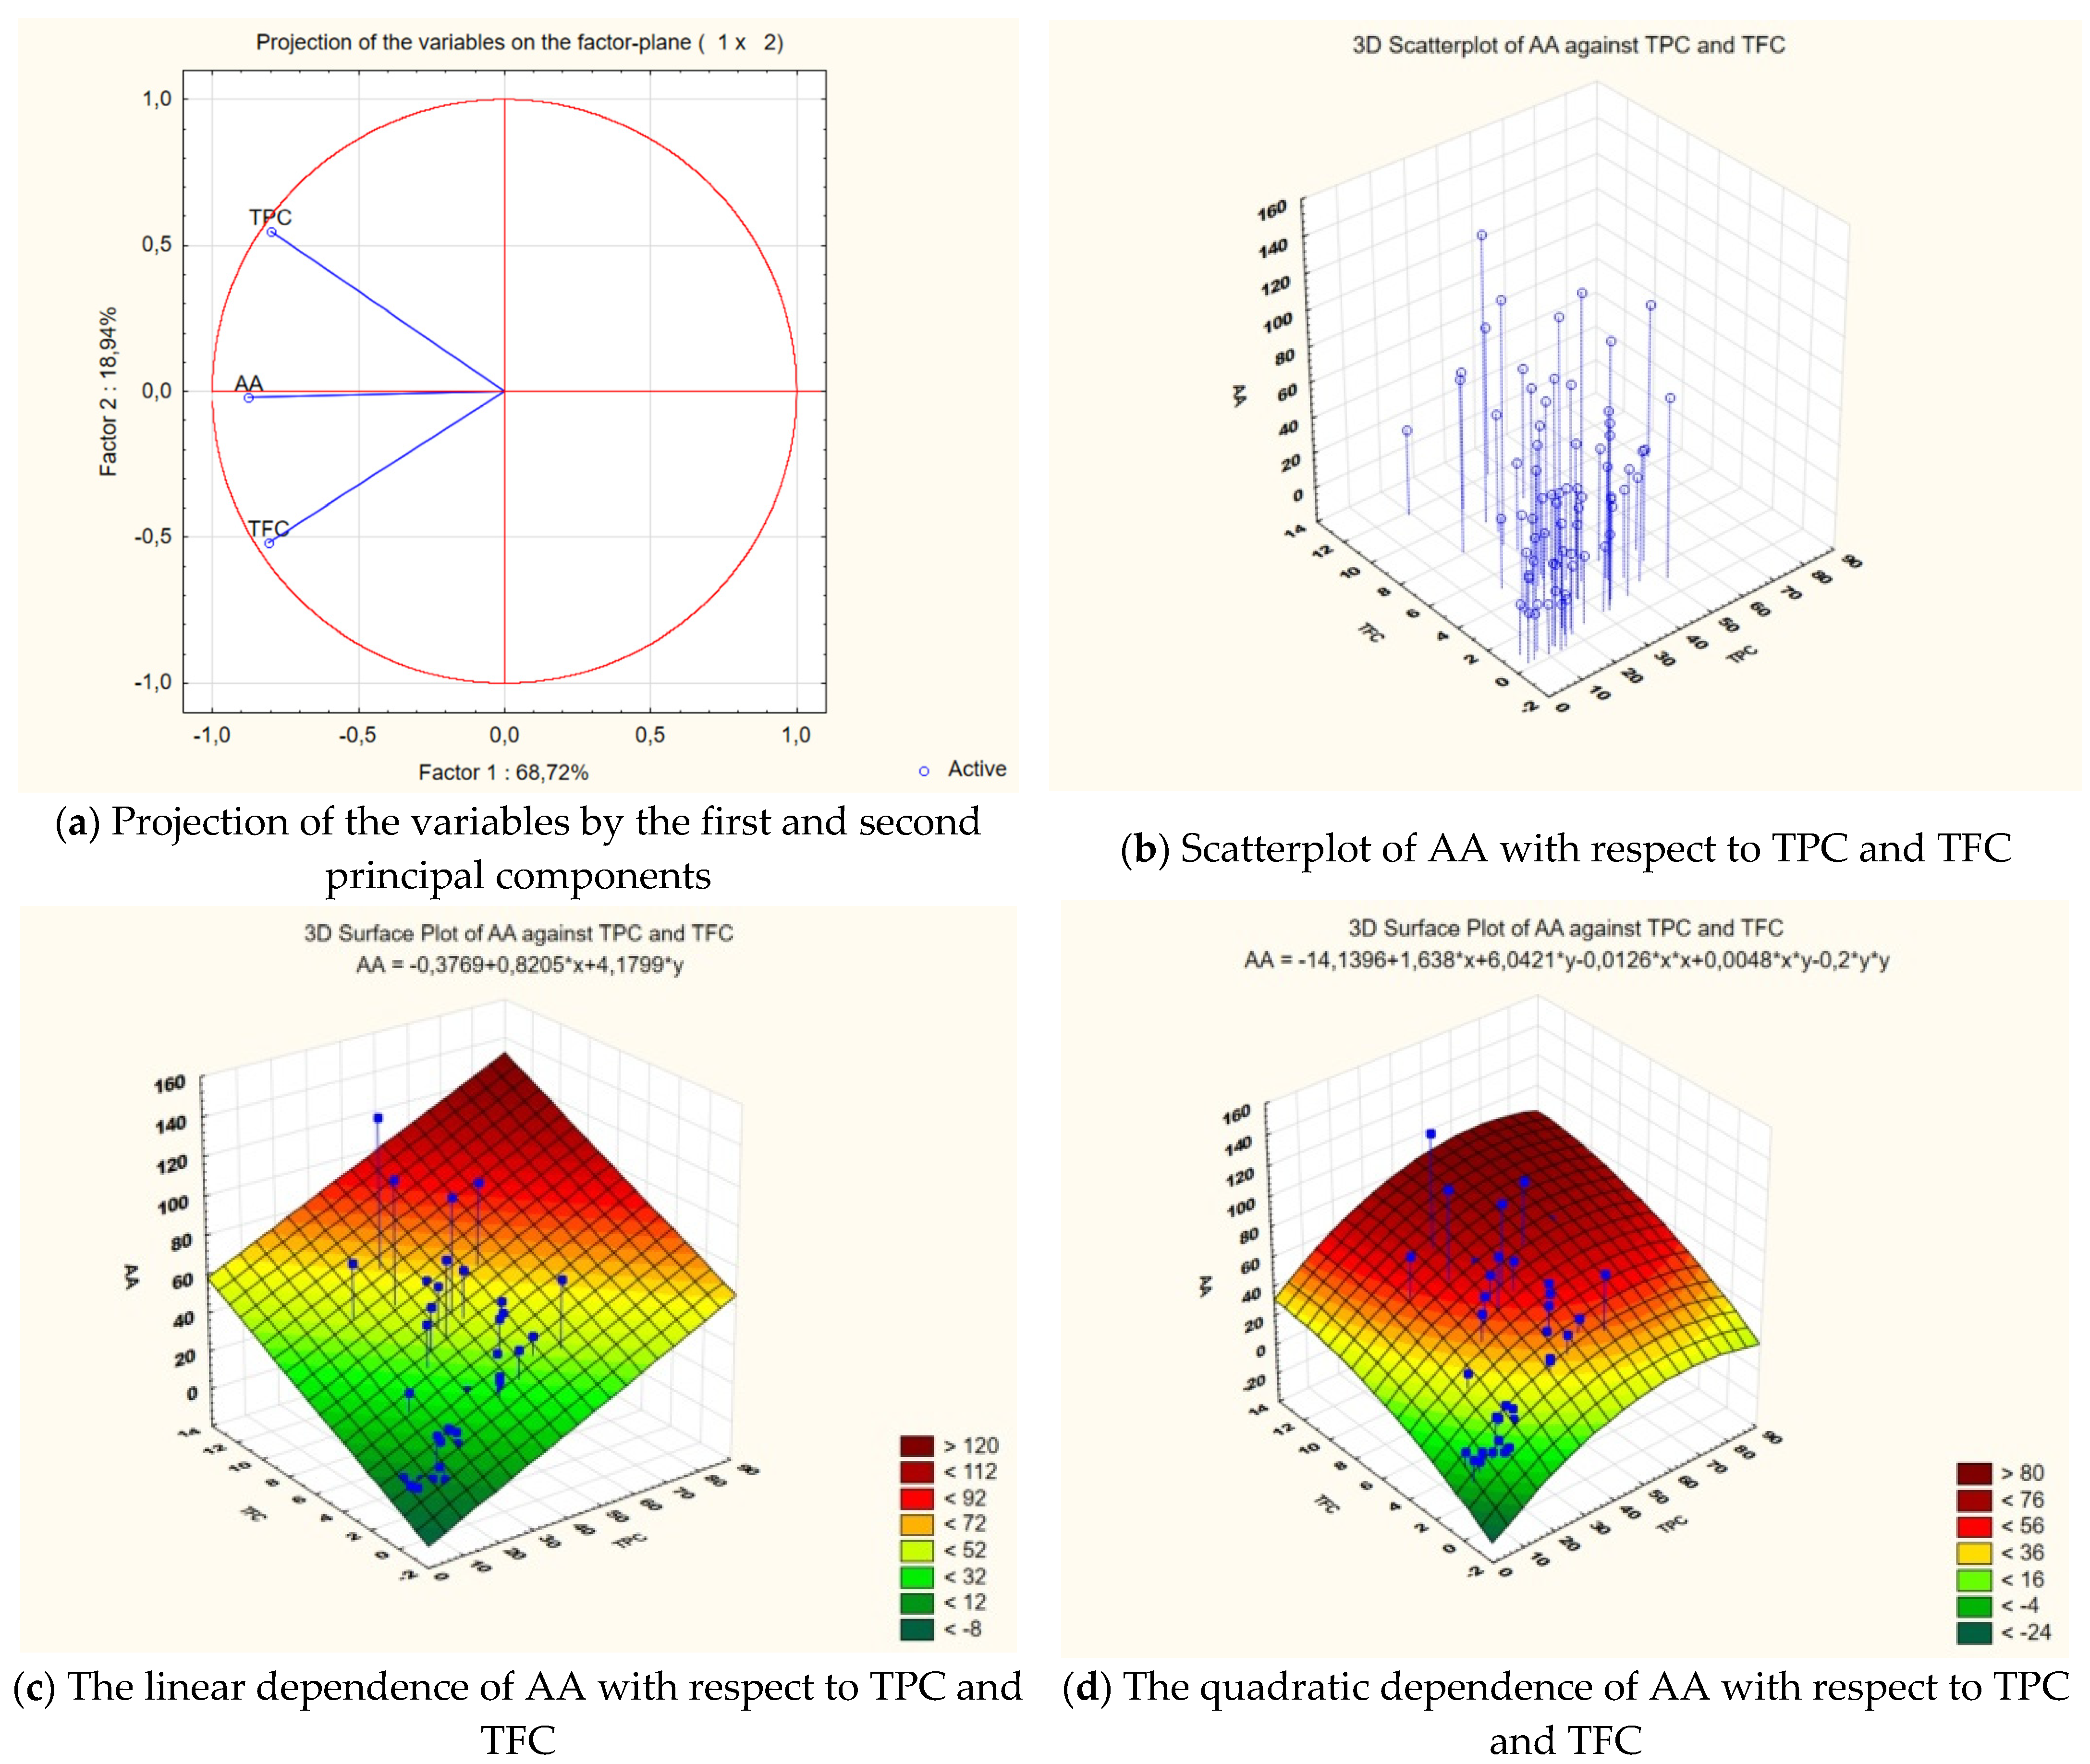
PCA was applied, based on a linear correlation matrix, to the mean values of the analyzed parameters to study their contribution to total data variation (Figure 8a). Three components were obtained using PCA analysis. The first two principal components accounted for 68.72% and 18.94% of the variance, respectively, for 87.66% (Figure 8b). Furthermore, the linear (Figure 8c) and quadratic (Figure 8d) functional dependences of AA concerning TPC and TFC were determined. The most important variable integrated into the first component was AA, which was negatively correlated with it. On the other hand, TPC was positively correlated with the second component, and TFC was negatively correlated with it.

3.7. The Antimicrobial Activity of Medicinal Plant Extracts

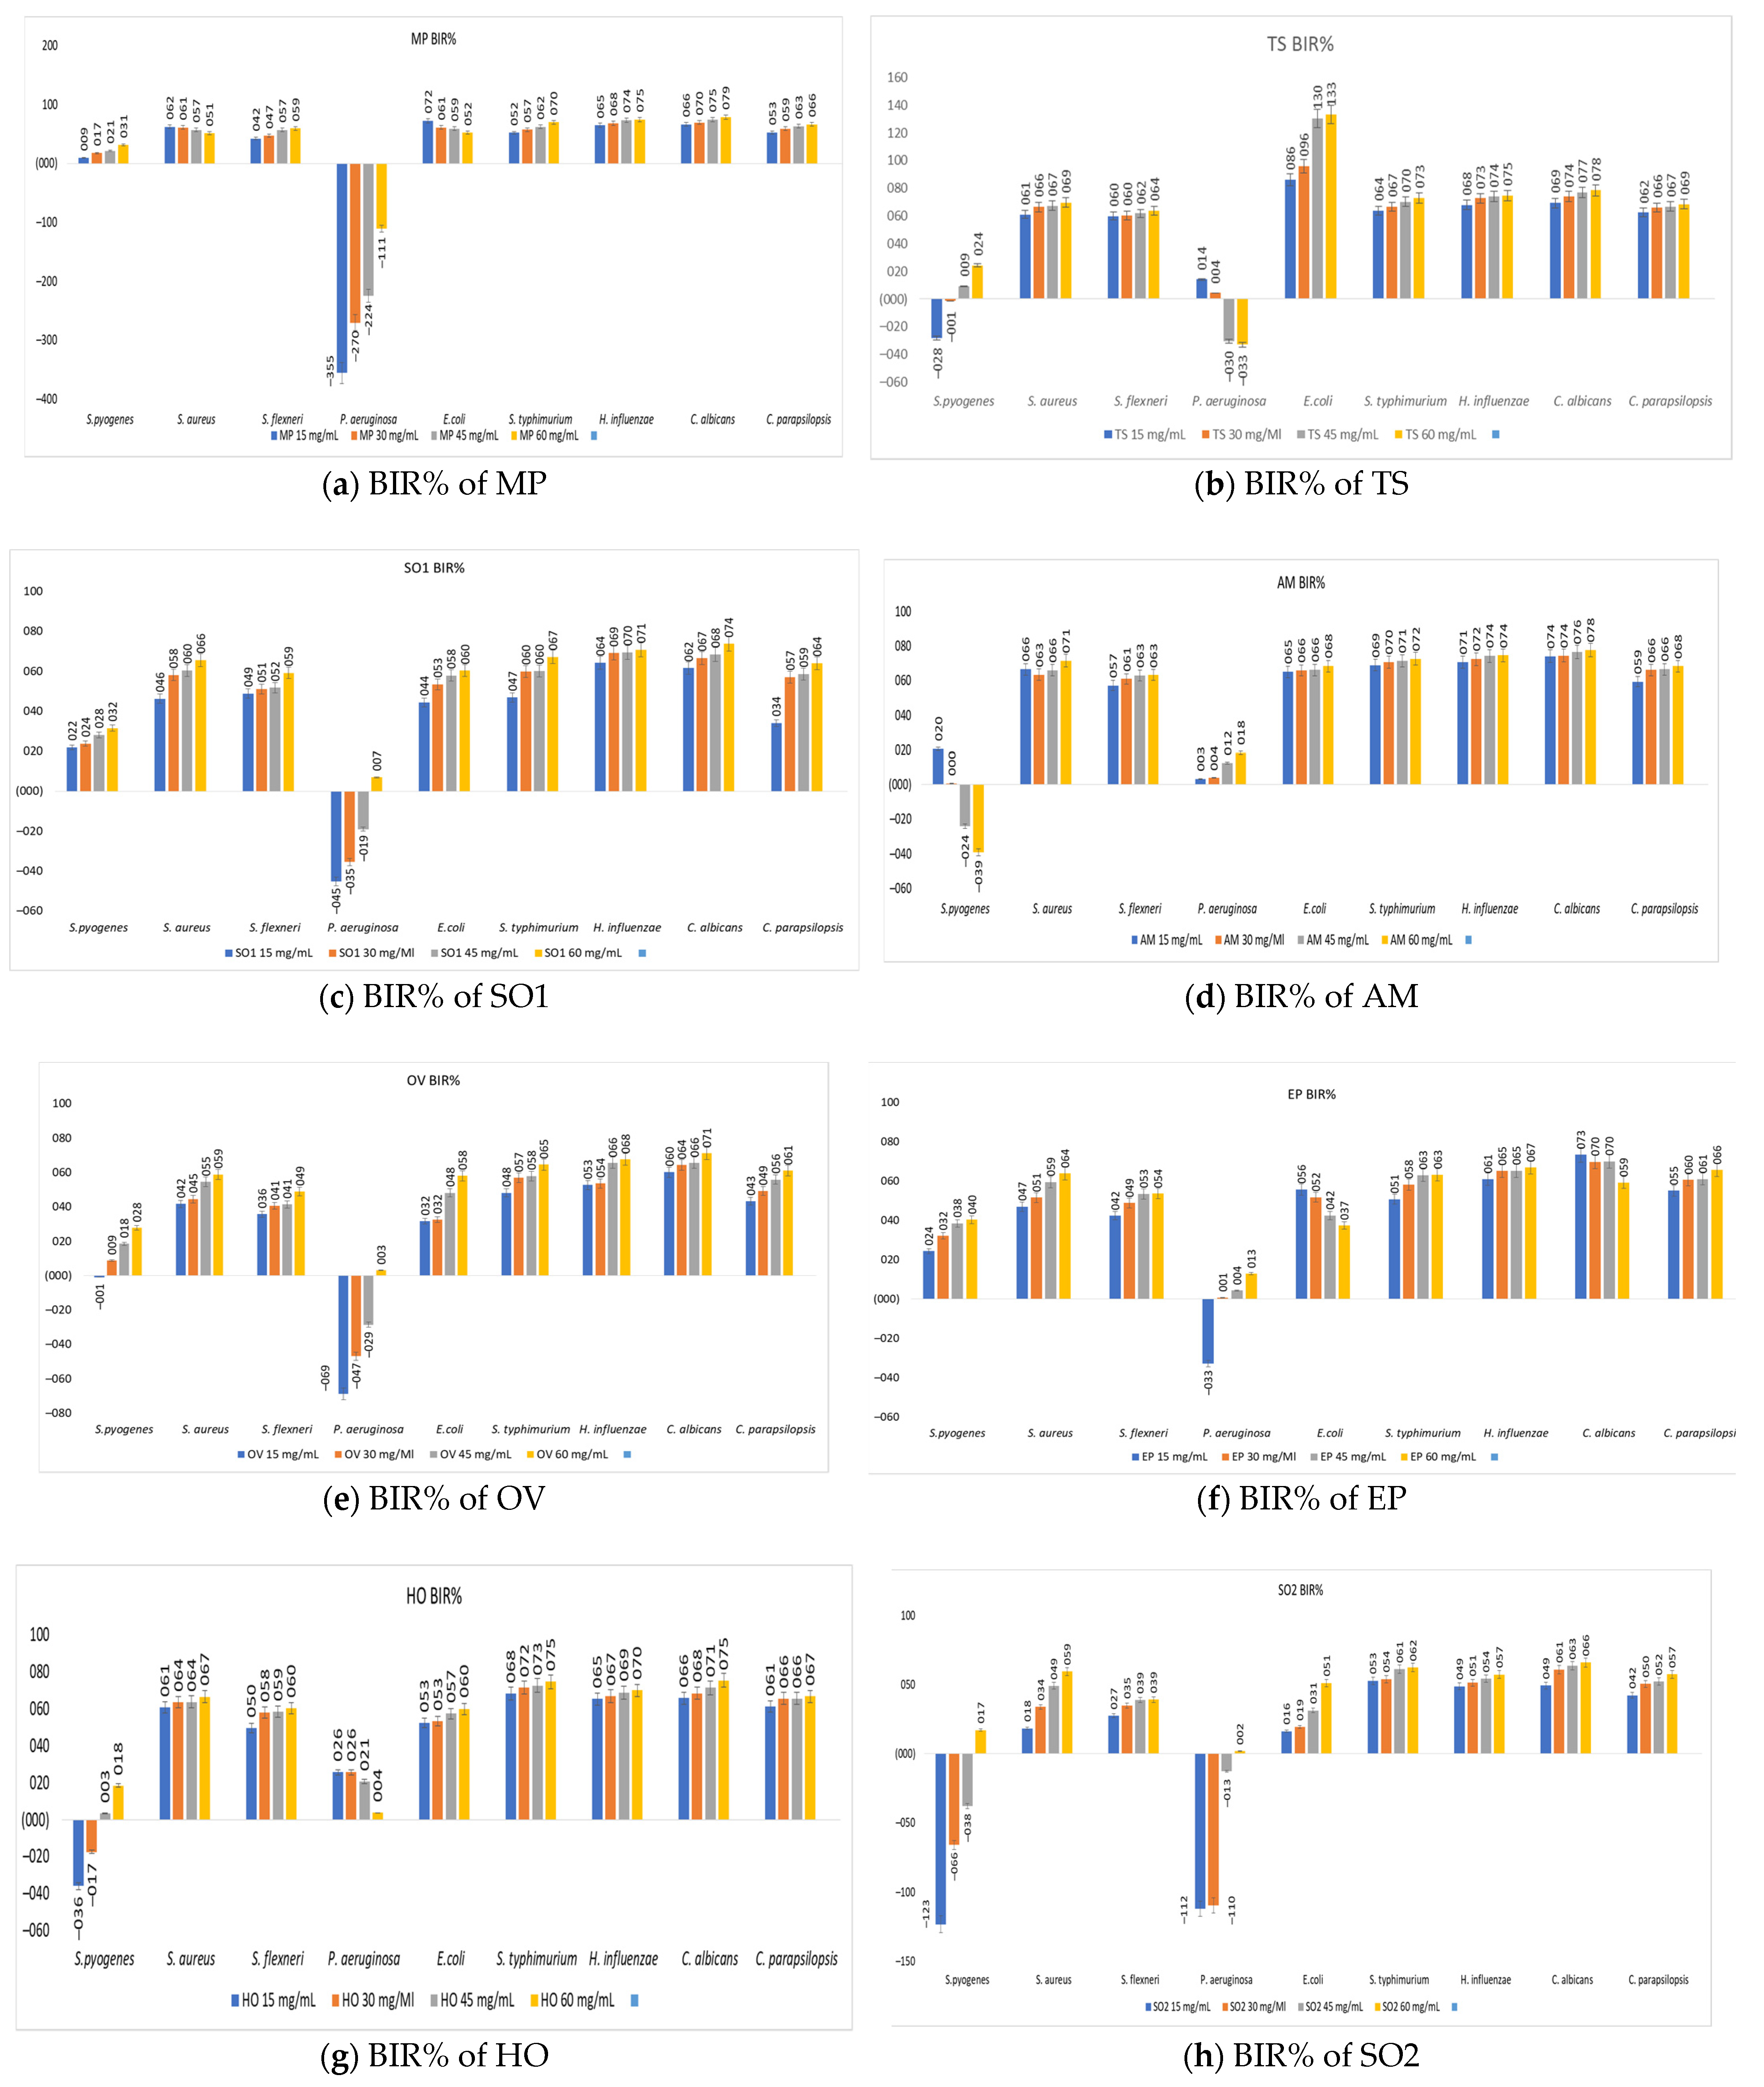
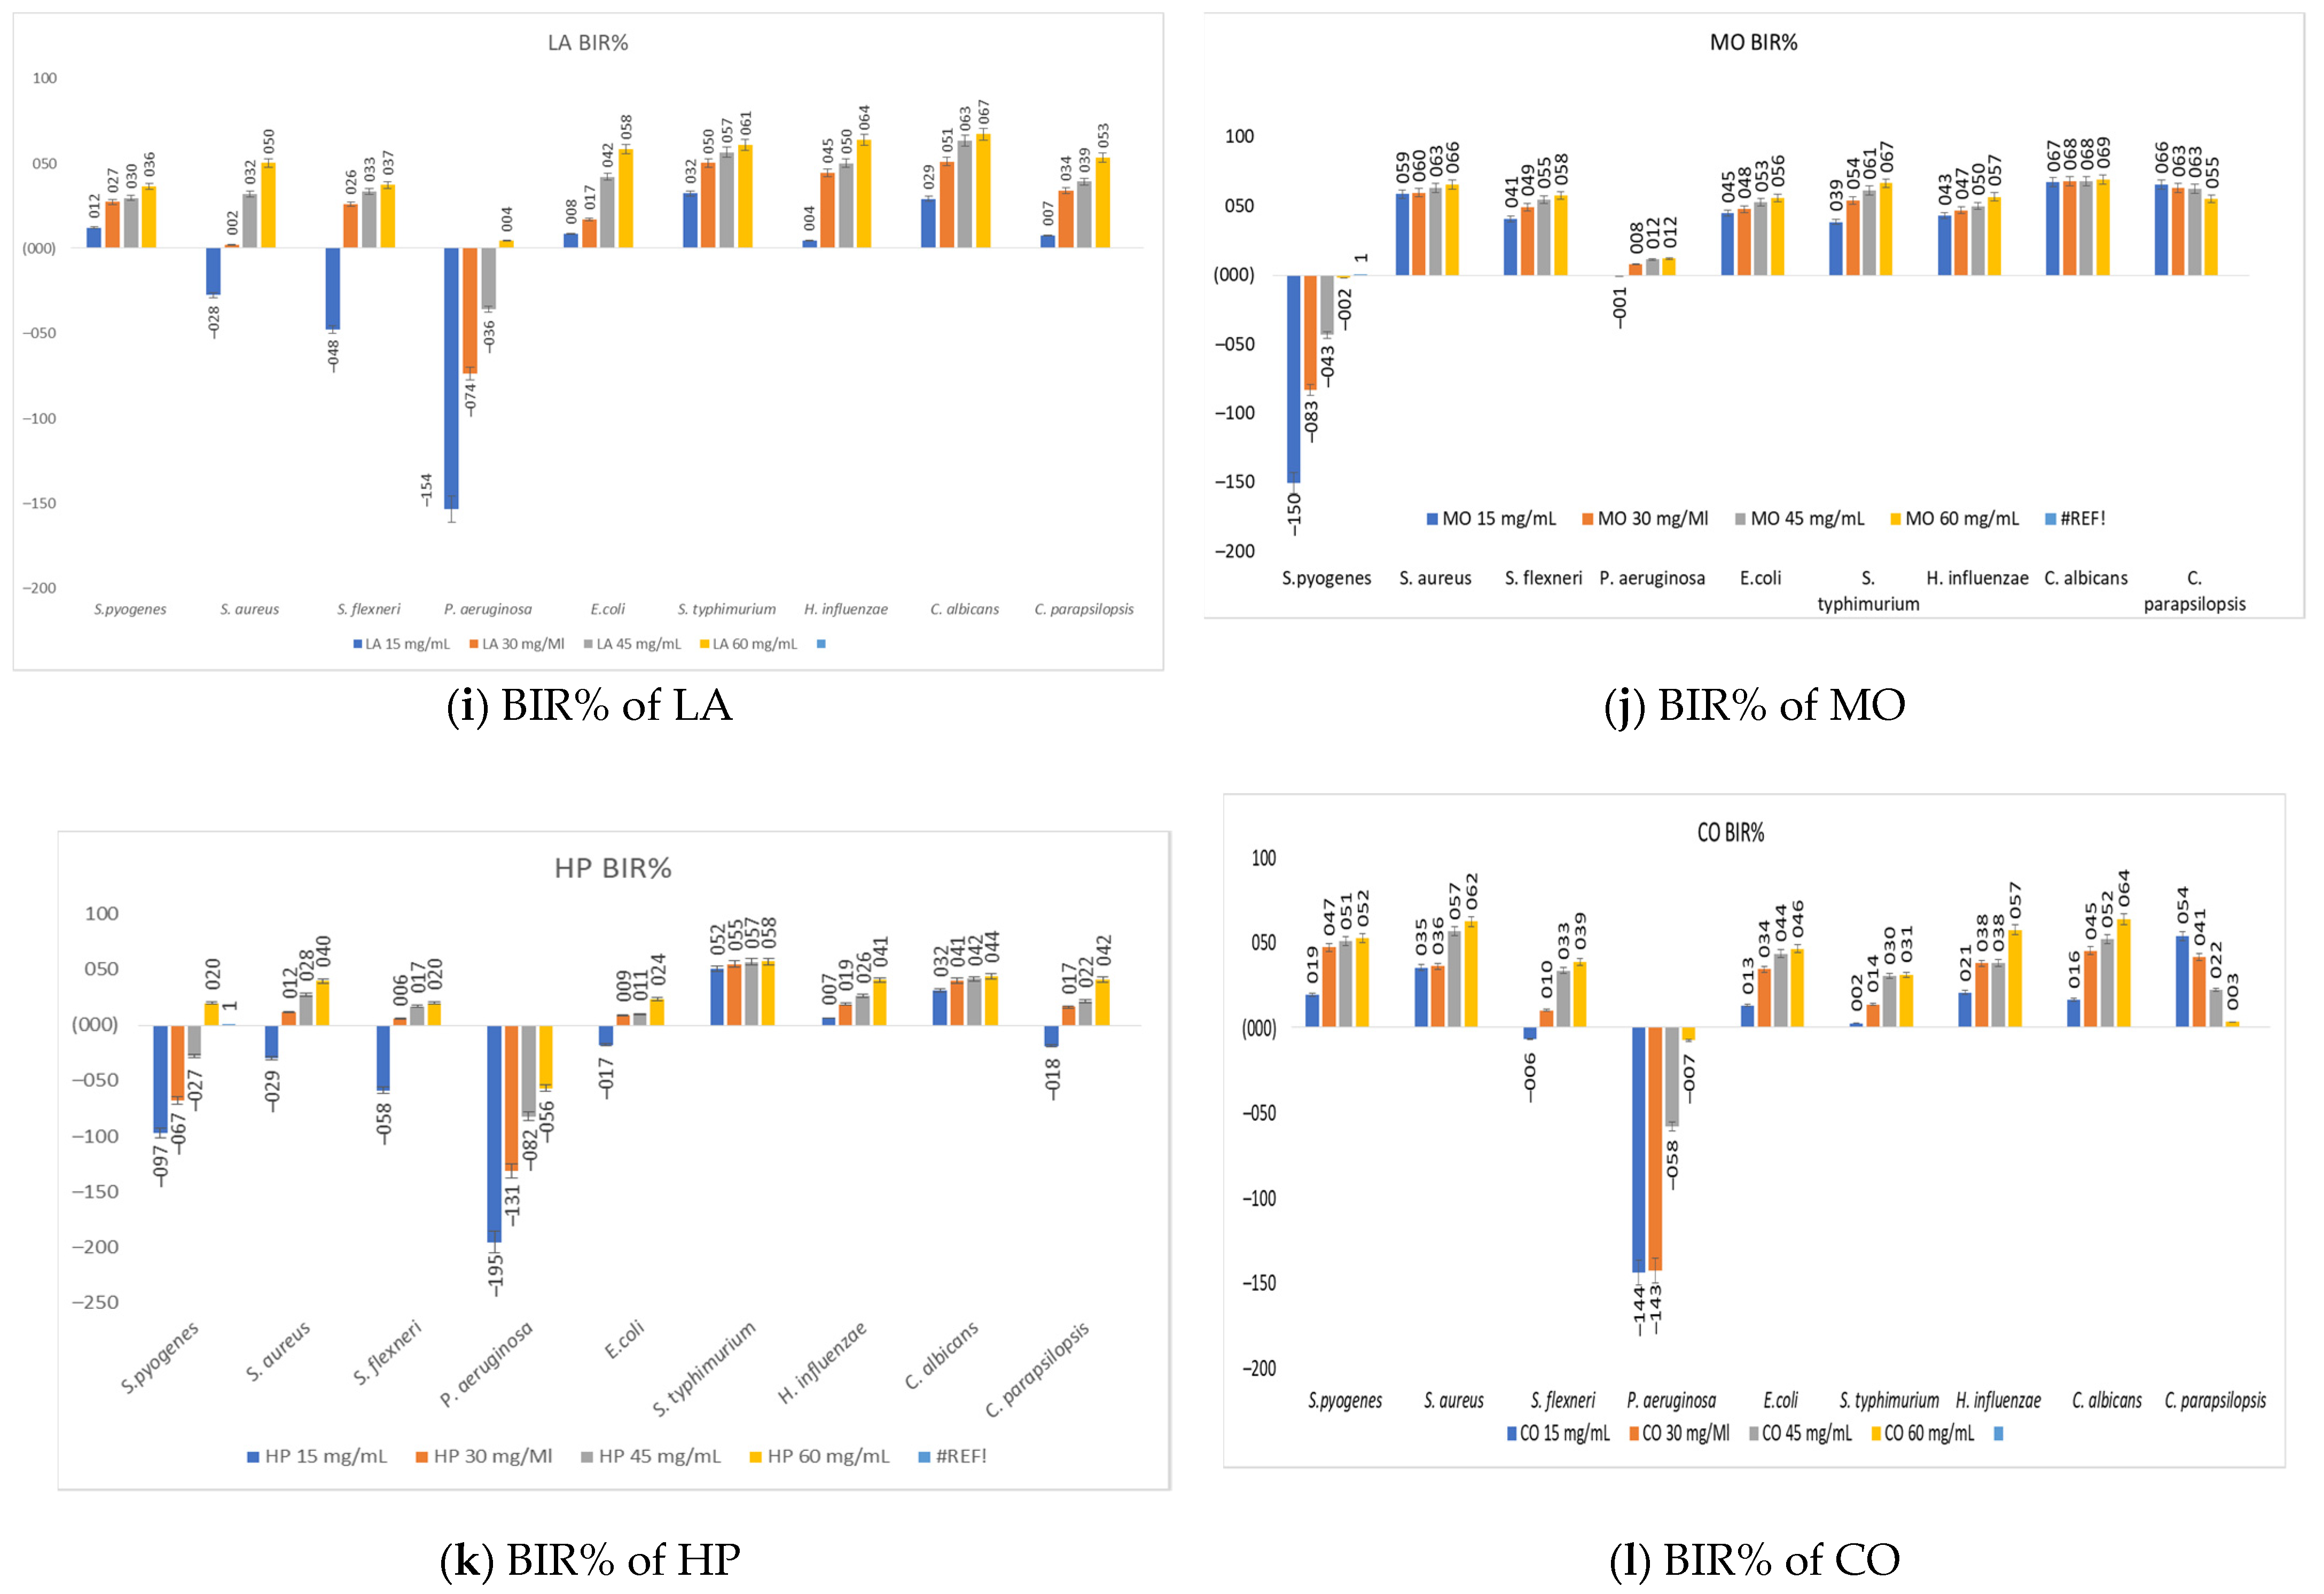
The extracts with the highest values recorded in terms of TPC, TFC, and AA content for each analyzed medicinal plant were tested against 9 standard strains. Figure 9a–l present the analyzed strains and the BIR (%) calculated according to formula 5 for the analyzed extracts.
Regarding the antimicrobial effect of the MP extract (Figure 9a), the trend is positive and increasing with the tested concentration in the cases of S. pyogenes, H. influenzae, S. flexneri, S. typhimurium, C. albicans, and C. parapsilosis. In the case of P. aeruginosa, it can be considered to have a positive trend correlated with the increase in MP concentration, but the results are negative, the tested concentration not being sufficient to reach the MIC. With increasing concentration, the reducing inhibition effect was observed when MP extract was applied against S. aureus and E. coli. However, even at the minimum concentrations applied (15 mg/mL), a positive BIR is observed, which means that there is antimicrobial potential, but it does not increase when the concentration of the extract is higher.
The results obtained in the case of TS extract (Figure 9b) highlighted a good antimicrobial effect, with a positive trend in the majority of tested strains and an average inhibition of around 65% in the maximum concentration tested. The best result was obtained against E. coli, where the BIR values ranged between 85.98–132.93%. In the case of S. pyogenes, the first two concentrations tested (15 and 30 mg/mL) showed negative BIR% results, but the concentration of 60 mg/Ml TS in the extract led to a BIR% of 24.27%.
The SO1 extract (Figure 9c) showed similar, positive antimicrobial efficacy against S. aureus, E. coli, S. flexneri, H. influenzae, S. typhimurium, and both strains of fungi, with maximum values between 59.25% and 73.79%. For all strains tested, the evolution is directly correlated with the increase in concentration of SO1 extract. The effectiveness of the sage extract was average in the case of S. pyogenes, with values varying between 21.84% and 31.55%. P. aeruginosa showed negative results, although there was a positive trend in the first three tested concentrations; the concentration of 75% was the only positive value of 7%.
Regarding the alcoholic extract of AM (Figure 9d), positive results were obtained against H. influenzae, S. aureus, E. coli, S. flexneri, S. typhimurium, C. albicans, and C. parapsilosis strains. P. aeruginosa proved more resistant to the activity of the extract, with the BIR% values obtained varying between 3.05 and 18.29%. In the case of S. pyogenes, the trend is negative, with a value of 20.395% for a concentration of 15 mg/mL AM in the extract, a value that decreases to −39.32% BIR in the case of a concentration of 60 mg/mL.
The antimicrobial effect of OV extract (Figure 9e) is good against S. flexneri, S. aureus, E. coli, H. influenzae, S. typhimurium, and the two strains of Candida. S. pyogenes proved the first effective concentration at 30 mg/mL OV, and in the case of P. aeruginosa, only the highest concentration of 60 mg/L was effective with a BIR% of 3.05%.
The EP extract (Figure 9f) showed above-average antimicrobial activity on most ATCC strains tested, with BIR% values that varied between 37.24% for the highest concentration of EP tested against E. coli and 66.79% against H. influenzae. P. aeruginosa showed MIC for the second concentration tested (30 mg/mL), the first concentration tested having a negative BIR% value (−32.93%).
Regarding the antimicrobial activity of the HO extract (Figure 9g), S. pyogenes was the most resistant, with a MIC value only proven at a concentration of 50% HO. At the maximum concentration, the BIR% obtained was 18.45%. In terms of effectiveness, P. aeruginosa follows, with a MIC value at 15 mg/mL concentration but with a negative evolution trend that started from 25.61% BIR at 15 mg/mL and reached 3.66% at the maximum tested concentration of 60 mg/mL. The rest of the strains tested have approximately similar trends and BIR% values, which varied between 49.56 and 68.37% in the case of the 15% tested concentration and between 60.06% and 75.36%, respectively, in the case of the 60 mg/mL concentration.
The antimicrobial activity of the SO2 extract (Figure 9h) proved to be much weaker than the other extracts, but a positive evolution trend correlated with the concentration for all tested strains. S. pyogenes and P. aeruginosa showed negative BIR% values for the first three concentrations tested, with MIC being demonstrated only for the 60 mg/mL concentration in the case of both strains, with values of 16.99% BIR for S. pyogenes and 1.83% BIR for P. aeruginosa. The rest of the tested strains showed approximately similar efficacy, with values varying between 38.99% and 65.78% BIR in the 60 mg/mL concentration case.
The LA extract (Figure 9i) showed weaker effectiveness as measured by BIR% values than the rest of the tested extracts. S. aureus, S. flexneri, and P. aeruginosa do not demonstrate sensitivity to the LA extract from the first tested concentration. S. aureus and S. flexneri were inhibited starting with a concentration of 30%, while P. aeruginosa showed MIC only in the case of the last tested concentration. The rest of the strains show sensitivity, starting with the first concentration, with the evolution trend being positive. The recorded BIR% values varied, in the case of the last tested concentration, between 36.41% and 67.11%.
Regarding the activity of the MO extract (Figure 9j), the results obtained are promising regarding the strains of S. flexneri, S. aureus, E. coli, H. influenzae, S. typhimurium, and C. albicans. The values obtained in the case of the maximum concentration tested were around 50–60% BIR. S. pyogenes, however, does not demonstrate MIC in the case of any of the 4 tested concentrations. The obtained values are negative, even if they have a positive evolution trend. In the case of P. aeruginosa, the MIC is highlighted only in the case of the 30 mg/mL concentration, the resistance being more pronounced than in the cases of other strains, a fact proven by the low value of BIR% (12.20%) expressed in the case of the maximum tested concentration. C. parapsilosis was the only strain that showed a negative evolution trend correlated with an increased tested concentration in the case of MO extract.
The effectiveness was below average in the HP extract (Figure 9k), with a positive evolution trend across all strains tested. S. pyogenes, S. aureus, S. flexneri, and C. parapsilosis were not sensitive when the first concentration was applied, showing MIC only for the 30 mg/mL concentration. P. aeruginosa, on the other hand, proved to have a high resistance, with the maximum allowed concentration reaching a BIR% of −56.10%.
CO extract has an antimicrobial profile similar to that of HP extract (Figure 9l), notable for an increase in inhibition capacity with the concentration of the extract but with negative BIR values for P. aeruginosa.
The MIC values (mg/mL) for plant extracts and positive control against tested strains are presented in Table 5.
The antimicrobial effects of medicinal plant extracts have been less studied than those of essential oils, considering the lower efficiency of the former. Previous studies showed that the gram-positive bacteria S. aureus were the more susceptible bacteria, while the gram-negative bacteria E. coli were unaffected by medicinal plant extracts [49]. Other authors have proven the interaction of flavonoid compounds with the cell membrane of gram-positive bacteria and the relationship between their chemical profile and antimicrobial activities [49,55]. It was highlighted the correlation between antimicrobial activities of flavonoids and their polarities or lipid-water partition coefficients [55]. Some authors have observed that the lipophilic substituents or the hydroxylation process of the flavonoid ring increase the antibacterial activity, but the other groups, such as acetyl, methoxy, or fluoride, have the opposite effect [56].
Some infusion extracts of Rosmarinus officinalis showed good results against S. oralis, S. aureus, and P. aeruginosa, and the ultrasound process has a positive effect against the mentioned bacteria and E. coli [57].
The effectiveness of Origanum syriacum was tested against P. aeruginosa, E. coli, and S. aureus. The results showed a MIC value of 780 µg/mL using a concentration of 100 mg/mL [58].
According to other literature studies, A. millefolium extracts have MIC concentrations ranging from a few mg/mL to 250 mg/mL, depending on the extraction technology, the solvent polarity, the part of the plant, and the cultivation area [59]. The study of Ivanovic et al. reported a MIC value of 10% against E. coli, S. aureus, and P. aeruginosa when 80% ethanolic extract of Achillea millefolium was used and a MIC value of 8% against C. albicans [60].
Regarding A. millefolium and C. officinalis extracts, it was reported that they displayed significant antimicrobial effects, with MIC values ranging from 0.25 to 0.5 mg/mL against E. coli and S. aureus [61].
Salvia officinalis ethanolic extract had a MIC of 12 µL/mL against S. aureus, 80 µL/mL against E. coli, 60 µL/mL against P. aeruginosa, and 40 µL/mL Candida albicans respectively [62].
Ivasenko et al. reported for T. serpyllum ultrasound extract the MIC between 1.25–2.5 mg/mL against S. aureus, 2.5–5 mg/mL against S. pyogenes, 5–10 mg/mL against E. coli, 5 mg/mL against P. aeruginosa, and between 2.5–10 mg/mL against C. albicans [54].
Ethanolic extract of Origanum vulgare inhibited S. aureus and E. coli standard strains with MIC values between 1.56–3.12 mg/mL [63]. The antimicrobial effect of extracts is assigned to the flavonoids and phenolic acids, although other minor compounds might play a role in the overall activity [64].
The antimicrobial effect of EP tested against E. coli, S. aureus, P. aeruginosa, and C. albicans highlighted that, for both extraction techniques (CES/UAE), the ethanolic extract showed activity against almost all of the tested microorganisms [50].
The antibacterial activity of methanolic extracts of H. perforatum against gram-positive (S. epidermidis, S. aureus, and E. faecalis) and gram-negative (E. coli, and P. aeruginosa) bacteria applied at a concentration of 1000 µL/mL, showed a positive effect against all the tested strains. The alcoholic extract of HP had higher activity against gram-positive bacteria. Also, it was highlighted that the antimicrobial effect can be affected by the time of plant collection [65]. Moderate antibacterial activity against S. aureus and a low antibacterial effect on E. coli and S. typhimurium were reported for extracts of H. officinalis from the spontaneous flora of Romania [47].
The study regarding the antimicrobial effect of ethanolic extracts of five medicinal plants belonging to the Lamiaceae family (SO, MP, MO, TV, and OV) highlighted that the most effective was the SO extract. The MICs of all plant extracts were detected against all gram-positive bacteria and ranged from 0.34 to over 6.85 mg/mL [53].

4. Conclusions

The experimental results highlighted that the type and level of active principles in the analyzed extracts differed depending on the species, the method of processing the plant material, and the extraction process. The processing in the form of powder (FG) leads to a higher content of active principles compared to the processing in the form of shredding (CS). The comparative analysis of the 3 extraction methods—conventional solvent extraction (CES), ultrasound-assisted extraction (UAE), and microwave extraction (MWE)—led to the conclusion that the optimal extraction method for the extraction of active principles from most medicinal plants is the microwave method, followed by ultrasound extraction and extraction with solvents. Regarding the antimicrobial activity, the effectiveness of the extracts was observed, especially on the strains of H. influenzae, C. albicans, C. parapsilopsis, S. aureus, and S. flexneri, while reduced antimicrobial activity was recorded on the strains of S. pyogenes and P. aeruginosa.
The information presented in the paper has an innovative and applicative character, representing a useful tool in establishing the optimal conditions for processing/extracting medicinal plants to obtain a maximum content of compounds with antioxidant or antimicrobial activity specific to a strain, depending on the intended destination.

Author Contributions

All authors contributed to the study’s conception and design. Conceptualization original draft preparation, N.M.H., A.C. and E.A.; methodology: D.O., I.C., D.L., M.-A.P., E.A., A.C. and C.B.; formal analysis: N.M.H., D.O., I.C., D.L., M.-A.P., E.A., A.C., I.M.I., G.P. and C.B.; review, editing and validation: N.M.H., A.C. and E.A.; Supervising: I.M.I. and G.P. All authors have read and agreed to the published version of the manuscript.

Funding

This research was supported by the research project no. 2381/31.03.2022, “Obtaining and characterizing natural extracts with an antioxidant and antimicrobial role for use as feed additives and in the food industry,” financed by S.D.E.A. Lovrin, Romania, and the project “Increasing the impact of excellence research on the capacity for innovation and technology transfer within USAMVB Timisoara,” project code 6PFE Program 1—Development of the national system of research—development, institutional development projects—development projects of excellence in R.D.I.

Institutional Review Board Statement

Not applicable.

Data Availability Statement

The reports of the analyses performed are available at the Interdisciplinary Research Platform (PCI) belonging to the University of Life Sciences "King Mihai I" from Timisoara.

Conflicts of Interest

The authors declare no conflict of interest.

References

  1. Sagbo, I.J.; Hussein, A.A. Antidiabetic Medicinal Plants Used in the Eastern Cape Province of South Africa: An Updated Review. Processes 2022, 10, 1817. [Google Scholar] [CrossRef]
  2. Kumar, M.; Devi, H.; Prakash, S.; Rathore, S.; Thakur, M.; Puri, S.; Pundir, A.; Bangar, S.P.; Changan, S. Ethnomedicinal Plants Used in the Health Care System: Survey of the Mid Hills of Solan District, Himachal Pradesh, India. Plants 2021, 10, 1842. [Google Scholar] [CrossRef] [PubMed]
  3. Aleebrahim-Dehkordy, E.; Nasri, H.; Baradaran, A.; Nasri, P.; Tamadon, M.R.; Hedaiaty, M.; Beigrezaei, S.; Rafieian-Kopaei, M. Medicinal Plants, Effective Plant Compounds (Compositions) and their Effects on Stomach Cancer. Int. J. Prev. Med. 2017, 8, 96. [Google Scholar] [CrossRef]
  4. Pohl, P.; Bielawska-Pohl, A.; Dzimitrowicz, A.; Greda, K.; Jamroz, P.; Lesniewicz, A.; Szymczycha-Madeja, A.; Welna, M. Understanding element composition of medicinal plants used in herbalism-A case study by analytical atomic spectrometry. J. Pharm. Biomed. Anal. 2018, 159, 262–271. [Google Scholar] [CrossRef]
  5. Daur, I. Chemical composition of selected Saudi medicinal plants. Arab. J. Chem. 2015, 8, 329–332. [Google Scholar] [CrossRef] [Green Version]
  6. Marrelli, M. Medicinal Plants. Plants 2021, 10, 1355. [Google Scholar] [CrossRef]
  7. Guimarães, R.; Milho, C.; Liberal, Â.; Silva, J.; Fonseca, C.; Barbosa, A.; Ferreira, I.C.F.R.; Alves, M.J.; Barros, L. Antibiofilm Potential of Medicinal Plants against Candida spp. Oral Biofilms: A Review. Antibiotics 2021, 10, 1142. [Google Scholar] [CrossRef]
  8. Slobodníková, L.; Fialová, S.; Rendeková, K.; Kováč, J.; Mučaji, P. Antibiofilm Activity of Plant Polyphenols. Molecules 2016, 21, 1717. [Google Scholar] [CrossRef] [Green Version]
  9. Ampofo, E.K.; Amponsah, I.K.; Asante-Kwatia, E.; Armah, F.A.; Atchoglo, P.K.; Mensah, A.Y. Indigenous Medicinal Plants as Biofilm Inhibitors for the Mitigation of Antimicrobial Resistance. Adv. Pharmacol. Pharm. Sci. 2020, 2020, 8821905. [Google Scholar] [CrossRef]
  10. Available online: https://www.marketsandmarkets.com/Market-Reports/botanical-extracts-market-3151938.html (accessed on 20 December 2022).
  11. Villalva, M.; Santoyo, S.; Salas-Pérez, L.; Siles-Sánchez, M.D.L.N.; Rodríguez García-Risco, M.; Fornari, T.; Reglero, G.; Jaime, L. Sustainable Extraction Techniques for Obtaining Antioxidant and Anti-Inflammatory Compounds from the Lamiaceae and Asteraceae Species. Foods 2021, 10, 2067. [Google Scholar] [CrossRef]
  12. Azwanida, N.N. A Review on the Extraction Methods Use in Medicinal Plants, Principle, Strength and Limitation. Med. Aromat. Plants 2015, 4, 196. [Google Scholar] [CrossRef]
  13. Aćimović, M.; Šovljanski, O.; Pezo, L.; Travičić, V.; Tomić, A.; Zheljazkov, V.D.; Ćetković, G.; Švarc-Gajić, J.; Brezo-Borjan, T.; Sofrenić, I. Variability in Biological Activities of Satureja montana Subsp. montana and Subsp. variegata Based on Different Extraction Methods. Antibiotics 2022, 11, 1235. [Google Scholar] [CrossRef] [PubMed]
  14. Shams, K.A.; Abdel-Azim, N.S.; Saleh, I.A.; Hegazy, M.-E.F.; El-Missiry, M.M.; Hammouda, F.M. Green technology: Economically and environmentally innovative methods for extraction of medicinal & aromatic plants (MAP) in Egypt. J. Chem. Pharm. Res. 2015, 7, 1050–1074. [Google Scholar]
  15. Soquetta, M.B.; Terra, L.d.M.; Bastos, C.P. Green technologies for the extraction of bioactive compounds in fruits and vegetables. CyTA J. Food 2018, 16, 400–412. [Google Scholar] [CrossRef]
  16. Azmin, S.N.H.M.; Manan, Z.A.; Alwi, S.R.W.; Chua, L.S.; Mustaffa, A.A.; Yunus, N.A. Herbal Processing and Extraction Technologies. Sep. Purif. Rev. 2016, 45, 305–320. [Google Scholar] [CrossRef]
  17. Picot-Allain, C.; Mahomoodally, M.F.; Ak, G.; Zengin, G. Conventional versus green extraction techniques—A comparative perspective. Curr. Opin. Food Sci. 2021, 40, 144–156. [Google Scholar] [CrossRef]
  18. Association of Official Analytical Chemists (AOAC). Official Methods of Analysis of AOAC International; AOAC: Rockville, MD, USA, 2000. [Google Scholar]
  19. Poșta, D.S.; Radulov, I.; Cocan, I.; Berbecea, A.A.; Alexa, E.; Hotea, I.; Iordănescu, O.A.; Băla, M.; Cântar, I.C.; Rózsa, S.; et al. Hazelnuts (Corylus avellana L.) from Spontaneous Flora of the West Part of Romania: A Source of Nutrients for Locals. Agronomy 2022, 12, 214. [Google Scholar] [CrossRef]
  20. Ciulca, S.; Roma, G.; Alexa, E.; Radulov, I.; Cocan, I.; Madosa, E.; Ciulca, A. Variation of Polyphenol Content and Antioxidant Activity in Some Bilberry (Vaccinium myrtillus L.) Populations from Romania. Agronomy 2021, 11, 2557. [Google Scholar] [CrossRef]
  21. Plustea, L.; Negrea, M.; Cocan, I.; Radulov, I.; Tulcan, C.; Berbecea, A.; Popescu, I.; Obistioiu, D.; Hotea, I.; Suster, G.; et al. Lupin (Lupinus spp.)-Fortified Bread: A Sustainable, Nutritionally, Functionally, and Technologically Valuable Solution for Bakery. Foods 2022, 11, 2067. [Google Scholar] [CrossRef]
  22. Benzie, I.F.F.; Strain, J.J. The ferric reducing ability of plasma (FRAP) as a measure of “antioxidant power”: The FRAP assay. Anal. Biochem. 1996, 239, 70–76. [Google Scholar] [CrossRef] [Green Version]
  23. Cadariu, A.I.; Cocan, I.; Negrea, M.; Alexa, E.; Obistioiu, D.; Hotea, I.; Radulov, I.; Poiana, M.-A. Exploring the Potential of Tomato Processing Byproduct as a Natural Antioxidant in Reformulated Nitrite-Free Sausages. Sustainability 2022, 14, 11802. [Google Scholar] [CrossRef]
  24. Clinical and Laboratory Standards Institute (CLSI). Methods for Dilution Antimicrobial Susceptibility Tests for Bacteria That Grow Aerobically, 11th ed.; Wayne, P., Ed.; CLSI: Malvern, VIC, Australia, 2018. [Google Scholar]
  25. Obistioiu, D.; Cocan, I.; Tîrziu, E.; Herman, V.; Negrea, M.; Cucerzan, A.; Neacsu, A.-G.; Cozma, A.L.; Nichita, I.; Hulea, A.; et al. Phytochemical Profile and Microbiological Activity of Some Plants Belonging to the Fabaceae Family. Antibiotics 2021, 10, 662. [Google Scholar] [CrossRef] [PubMed]
  26. Zain, U.; Musa, K.B.; Jameel, A.K.; Imam, B.B.; Riaz, U.; Naser, M.A.; Shumaila, N. Proximate and nutrient analysis of selected medicinal plants of Tank and South Waziristan area of Pakistan. Afr. J. Pharm. Pharmacol. 2013, 7, 179–184. [Google Scholar]
  27. Tomescu, A.; Rus, C.; Pop, G.; Alexa, E.; Radulov, I.; Imbrea, I.M.; Negrea, M. Researches regarding proximate and selected elements composition of some medicinal plants belonging to the lamiaceae family. Agron. Ser. Sci. Res. Lucr. Stiintifice Ser. Agron. 2015, 58, 211531074. [Google Scholar]
  28. Mainasara, M.M.; Bakar, M.F.A.; Waziri, A.H.; Musa, A.R. Comparison of Phytochemical, Proximate and Mineral Composition of Fresh and Dried Peppermint (Mentha piperita) Leaves. J. Sci. Technol. 2018, 10. Available online: https://penerbit.uthm.edu.my/ojs/index.php/JST/article/view/3002 (accessed on 20 December 2022). [CrossRef] [Green Version]
  29. Queralt, I.; Ovejero, M.; Carvalho, M.; Marques, A.; Llabrés, J. Quantitative determination of essential and trace element content of medicinal plants and their infusions by XRF and ICP techniques. X-Ray Spectrom. Int. J. 2005, 34, 213–217. [Google Scholar] [CrossRef]
  30. Ereifej, K.; Ranya, E.; Taha, R.; Ali, M.A.; Muhammad, H.A. Minerals, proximate composition and their correlations of medicinal plants from Jordan. J. Med. Plants Res. 2012, 6, 5757–5762. [Google Scholar]
  31. Gjorgieva, D.; Kadifkova-Panovska, T.; Bačeva, K.; Stafilov, T. Metalic trace elements in medicinal plants from Macedonia. Middle-East J. Sci. Res. 2011, 7, 109–114. [Google Scholar]
  32. Cocan, I.; Alexa, E.; Danciu, C.; Radulov, I.; Galuscan, A.; Obistioiu, D.; Morvay, A.A.; Sumalan, R.M.; Poiana, M.A.; Pop, G.; et al. Phytochemical screening and biological activity of Lamiaceae family plant extracts. Exp. Ther. Med. 2017, 15, 1863–1870. [Google Scholar] [CrossRef] [Green Version]
  33. Marchioni, I.; Najar, B.; Ruffoni, B.; Copetta, A.; Pistelli, L.; Pistelli, L. Bioactive Compounds and Aroma Profile of Some Lamiaceae Edible Flowers. Plants 2020, 9, 691. [Google Scholar] [CrossRef]
  34. Guemari, F.; Laouini, S.E.; Rebiai, A.; Bouafia, A.; Meneceur, S.; Tliba, A.; Majrashi, K.A.; Alshareef, S.A.; Menaa, F.; Barhoum, A. UV-Visible Spectroscopic Technique-Data Mining Tool as a Reliable, Fast, and Cost-Effective Method for the Prediction of Total Polyphenol Contents: Validation in a Bunch of Medicinal Plant Extracts. Appl. Sci. 2022, 12, 9430. [Google Scholar] [CrossRef]
  35. Niculae, M.; Hanganu, D.; Oniga, I.; Benedec, D.; Ielciu, I.; Giupana, R.; Sandru, C.D.; Ciocârlan, N.; Spinu, M. Phytochemical Profile and Antimicrobial Potential of Extracts Obtained from Thymus marschallianus Willd. Molecules 2019, 24, 3101. [Google Scholar] [CrossRef] [PubMed] [Green Version]
  36. Spiridon, I.B.R.; Teaca, C.A. Total phenolic content and antioxidant activity of plants used in traditional Romanian herbal medicine. Cent. Eur. J. Biol. 2011, 6, 388–396. [Google Scholar] [CrossRef]
  37. Derakhshani, Z.; Hassani, A.; Pirzad, A.; Abdollahi, R.; Dalkani, M. Evaluation of phenolic content and antioxidant capacity in some medicinal herbs cultivated in Iran. Bot. Serbica 2012, 36, 117–122. [Google Scholar]
  38. Maleš, I.; Dragović-Uzelac, V.; Jerković, I.; Zorić, Z.; Pedisić, S.; Repajić, M.; Garofulić, I.E.; Dobrinčić, A. Non-Volatile and Volatile Bioactives of Salvia officinalis L., Thymus serpyllum L. and Laurus nobilis L. Extracts with Potential Use in the Development of Functional Beverages. Antioxidants 2022, 11, 1140. [Google Scholar] [CrossRef]
  39. Doymaz, I.; Karasu, S. Effect of air temperature on drying kinetics, colour changes and total phenolic content of sage leaves (Salvia officinalis). Qual. Assur. Saf. Crop. Foods 2018, 10, 269–276. [Google Scholar] [CrossRef]
  40. Francik, S.; Francik, R.; Sadowska, U.; Bystrowska, B.; Zawiślak, A.; Knapczyk, A.; Nzeyimana, A. Identification of Phenolic Compounds and Determination of Antioxidant Activity in Extracts and Infusions of Salvia Leaves. Materials 2020, 13, 5811. [Google Scholar] [CrossRef]
  41. Sytar, O.; Hemmerich, I.; Zivcak, M.; Rauh, C.; Brestic, M. Comparative analysis of bioactive phenolic compounds composition from 26 medicinal plants. Saudi J. Biol. Sci. 2018, 25, 631–641. [Google Scholar] [CrossRef] [Green Version]
  42. Hamrouni-Sellami, I.; Rahali, F.Z.; Rebey, I.B.; Bourgou, S.; Limam, F.; Marzouk, B. Total Phenolics, Flavonoids, and Antioxidant Activity of Sage (Salvia officinalis L.) Plants as Affected by Different Drying Methods. Food Bioprocess Technol. 2013, 6, 806–817. [Google Scholar] [CrossRef]
  43. Pavić, V.; Jakovljević, M.; Molnar, M.; Jokić, S. Extraction of carnosic acid and carnosol from sage (Salvia officinalis L.) leaves by supercritical fluid extraction and their antioxidant and antibacterial activity. Plants 2019, 8, 16. [Google Scholar] [CrossRef] [Green Version]
  44. Hassan, R.A.; Abotaleb, S.T.; Hamed, H.B.; Eldeen, M.S. Antioxidant and Antimicrobial Activities of Melissa officinalis L. (Lemon Balm) Extracts. J. Agric. Chem. Biotechnol. 2019, 10, 183–187. [Google Scholar] [CrossRef] [Green Version]
  45. Goyal, S.P.H.; Guleria, K.; Tewari, G. Variation in Antioxidant Activity and Antioxidant Constituents of Thymus Serpyllum L Grown in Different Climatic Conditions of Uttarakhand Himalayas. DLSJ 2021, 6, 109–116. [Google Scholar] [CrossRef]
  46. Jabri-Karoui, I.; Bettaieb, I.; Msaada, K.; Hammami, M.; Marzouk, B. Research on the phenolic compounds and antioxidant activities of Tunisian Thymus capitatus. J. Funct. Foods 2012, 4, 661–669. [Google Scholar] [CrossRef]
  47. Vlase, L.; Benedec, D.; Hanganu, D.; Damian, G.; Csillag, I.; Sevastre, B.; Mot, A.C.; Silaghi-Dumitrescu, R.; Tilea, I. Evaluation of Antioxidant and Antimicrobial Activities and Phenolic Profile for Hyssopus officinalis, Ocimum basilicum and Teucrium chamaedrys. Molecules 2014, 19, 5490–5507. [Google Scholar] [CrossRef]
  48. Yu, M.; Gouvinhas, I.; Rocha, J.; Barros, A.I. Phytochemical and antioxidant analysis of medicinal and food plants towards bioactive food and pharmaceutical resources. Sci. Rep. 2021, 11, 10041. [Google Scholar] [CrossRef]
  49. Slimestad, R.; Johny, A.; Thomsen, M.G.; Karlsen, C.R.; Rosnes, J.T. Chemical Profiling and Biological Activity of Extracts from Nine Norwegian Medicinal and Aromatic Plants. Molecules 2022, 27, 7335. [Google Scholar] [CrossRef]
  50. Stanisavljević, I.; Stojičević, S.; Veličković, D.; Veljković, V.; Lazić, M. Antioxidant and Antimicrobial Activities of Echinacea (Echinacea purpurea L.) Extracts Obtained by Classical and Ultrasound Extraction. Chin. J. Chem. Eng. 2009, 17, 478–483. [Google Scholar] [CrossRef]
  51. Duque-Soto, C.; Borrás-Linares, I.; Quirantes-Piné, R.; Falcó, I.; Sánchez, G.; Segura-Carretero, A.; Lozano-Sánchez, J. Potential Antioxidant and Antiviral Activities of Hydroethanolic Extracts of Selected Lamiaceae Species. Foods 2022, 11, 1862. [Google Scholar] [CrossRef]
  52. Baba, S.A.; Malik, S.A. Determination of total phenolic and flavonoid content, antimicrobial and antioxidant activity of a root extract of Arisaema jacquemontii Blume. J. Taibah Univ. Sci. 2015, 9, 449–454. [Google Scholar] [CrossRef] [Green Version]
  53. Generalić Mekinić, I.; Skroza, D.; Ljubenkov, I.; Šimat, V.; Smole Možina, S.; Katalinić, V. In vitro Antioxidant and Antibacterial Activity of Lamiaceae Phenolic Extracts: A Correlation Study. Food Technol. Biotechnol. 2014, 52, 119–127. [Google Scholar]
  54. Ivasenko, S.; Orazbayeva, P.; Skalicka–Wozniak, K.; Ludwiczuk, A.; Marchenko, A.; Ishmuratova, M.; Poleszak, E.; Korona-Glowniak, I.; Akhmetova, S.; Karilkhan, I.; et al. Antimicrobial Activity of Ultrasonic Extracts of Two Chemotypes of Thymus serpyllum L. of Central Kazakhstan and their Polyphenolic Profiles. Open Access Maced. J. Med. Sci. 2021, 9, 61–67. [Google Scholar] [CrossRef]
  55. Yuan, G.; Guan, Y.; Yi, H.; Lai, S.; Sun, Y.; Cao, S. Antibacterial activity and mechanism of plant flavonoids to gram-positive bacteria predicted from their lipophilicities. Sci. Rep. 2021, 11, 10471. [Google Scholar] [CrossRef] [PubMed]
  56. Kopel, J.; McDonald, J.; Hamood, A. An Assessment of the In Vitro Models and Clinical Trials Related to the Antimicrobial Activities of Phytochemicals. Antibiotics 2022, 11, 1838. [Google Scholar] [CrossRef] [PubMed]
  57. Macedo, L.M.d.; Santos, É.M.D.; Ataide, J.A.; Silva, G.T.D.S.E.; Guarnieri, J.P.D.O.; Lancellotti, M.; Jozala, A.F.; Rosa, P.C.P.; Mazzola, P.G. Development and Evaluation of an Antimicrobial Formulation Containing Rosmarinus officinalis. Molecules 2022, 27, 5049. [Google Scholar] [CrossRef] [PubMed]
  58. Ahmad, I.H.; Mohammed, S.A.S.; Rana, M.J.; Abuzaitoun, S.; Jondi, W.; Zatar, N. Antimicrobial activities of six plants used in Traditional Arabic Palestinian Herbal Medicine. Afr. J. Microbiol. Res. 2014, 8, 3501–3507. [Google Scholar] [CrossRef] [Green Version]
  59. Stojanović, G.; Radulović, N.; Hashimoto, T.; Palić, R. In vitro antimicrobial activity of extracts of four Achillea species: The composition of Achillea clavennae L. (Asteraceae) extract. J. Ethnopharmacol. 2005, 101, 185–190. [Google Scholar] [CrossRef]
  60. Ivanović, M.; Grujić, D.; Cerar, J.; Islamčević Razboršek, M.; Topalić-Trivunović, L.; Savić, A.; Kočar, D.; Kolar, M. Extraction of Bioactive Metabolites from Achillea millefolium L. with Choline Chloride Based Natural Deep Eutectic Solvents: A Study of the Antioxidant and Antimicrobial Activity. Antioxidants 2022, 11, 724. [Google Scholar] [CrossRef]
  61. Barral-Martinez, M.; Garcia-Oliveira, P.; Nuñez-Estevez, B.; Silva, A.; Finimundy, T.C.; Calhelha, R.; Nenadic, M.; Sokovic, M.; Barroso, F.; Simal-Gandara, J.; et al. Plants of the Family Asteraceae: Evaluation of Biological Properties and Identification of Phenolic Compounds. Chem. Proc. 2021, 5, 51. [Google Scholar]
  62. Dragan, T.; Velikovic, N.V.R.; Mihailo, S.; Risti, A.S. Chemical constituents and antimicrobial activity of the ethanol extracts obtained from the flower, leaf and stem of Salvia officinalis L. J. Serb. Chem. Soc. 2003, 68, 17–24. [Google Scholar]
  63. Dahiya, P.; Purkayastha, S. Phytochemical Screening and Antimicrobial Activity of Some Medicinal Plants Against Multi-drug Resistant Bacteria from Clinical Isolates. Indian J. Pharm. Sci. 2012, 74, 443–450. [Google Scholar] [CrossRef] [Green Version]
  64. Pezzani, R.; Vitalini, S.; Iriti, M. Bioactivities of Origanum vulgare L.: An update. Phytochem. Rev. 2017, 16, 1253–1268. [Google Scholar] [CrossRef]
  65. Saddiqe Zeb, N.I.; Maimoona, A. A review of the antibacterial activity of Hypericum perforatum L. J. Ethnopharmacol. 2010, 131, 511–521. [Google Scholar] [CrossRef] [PubMed]
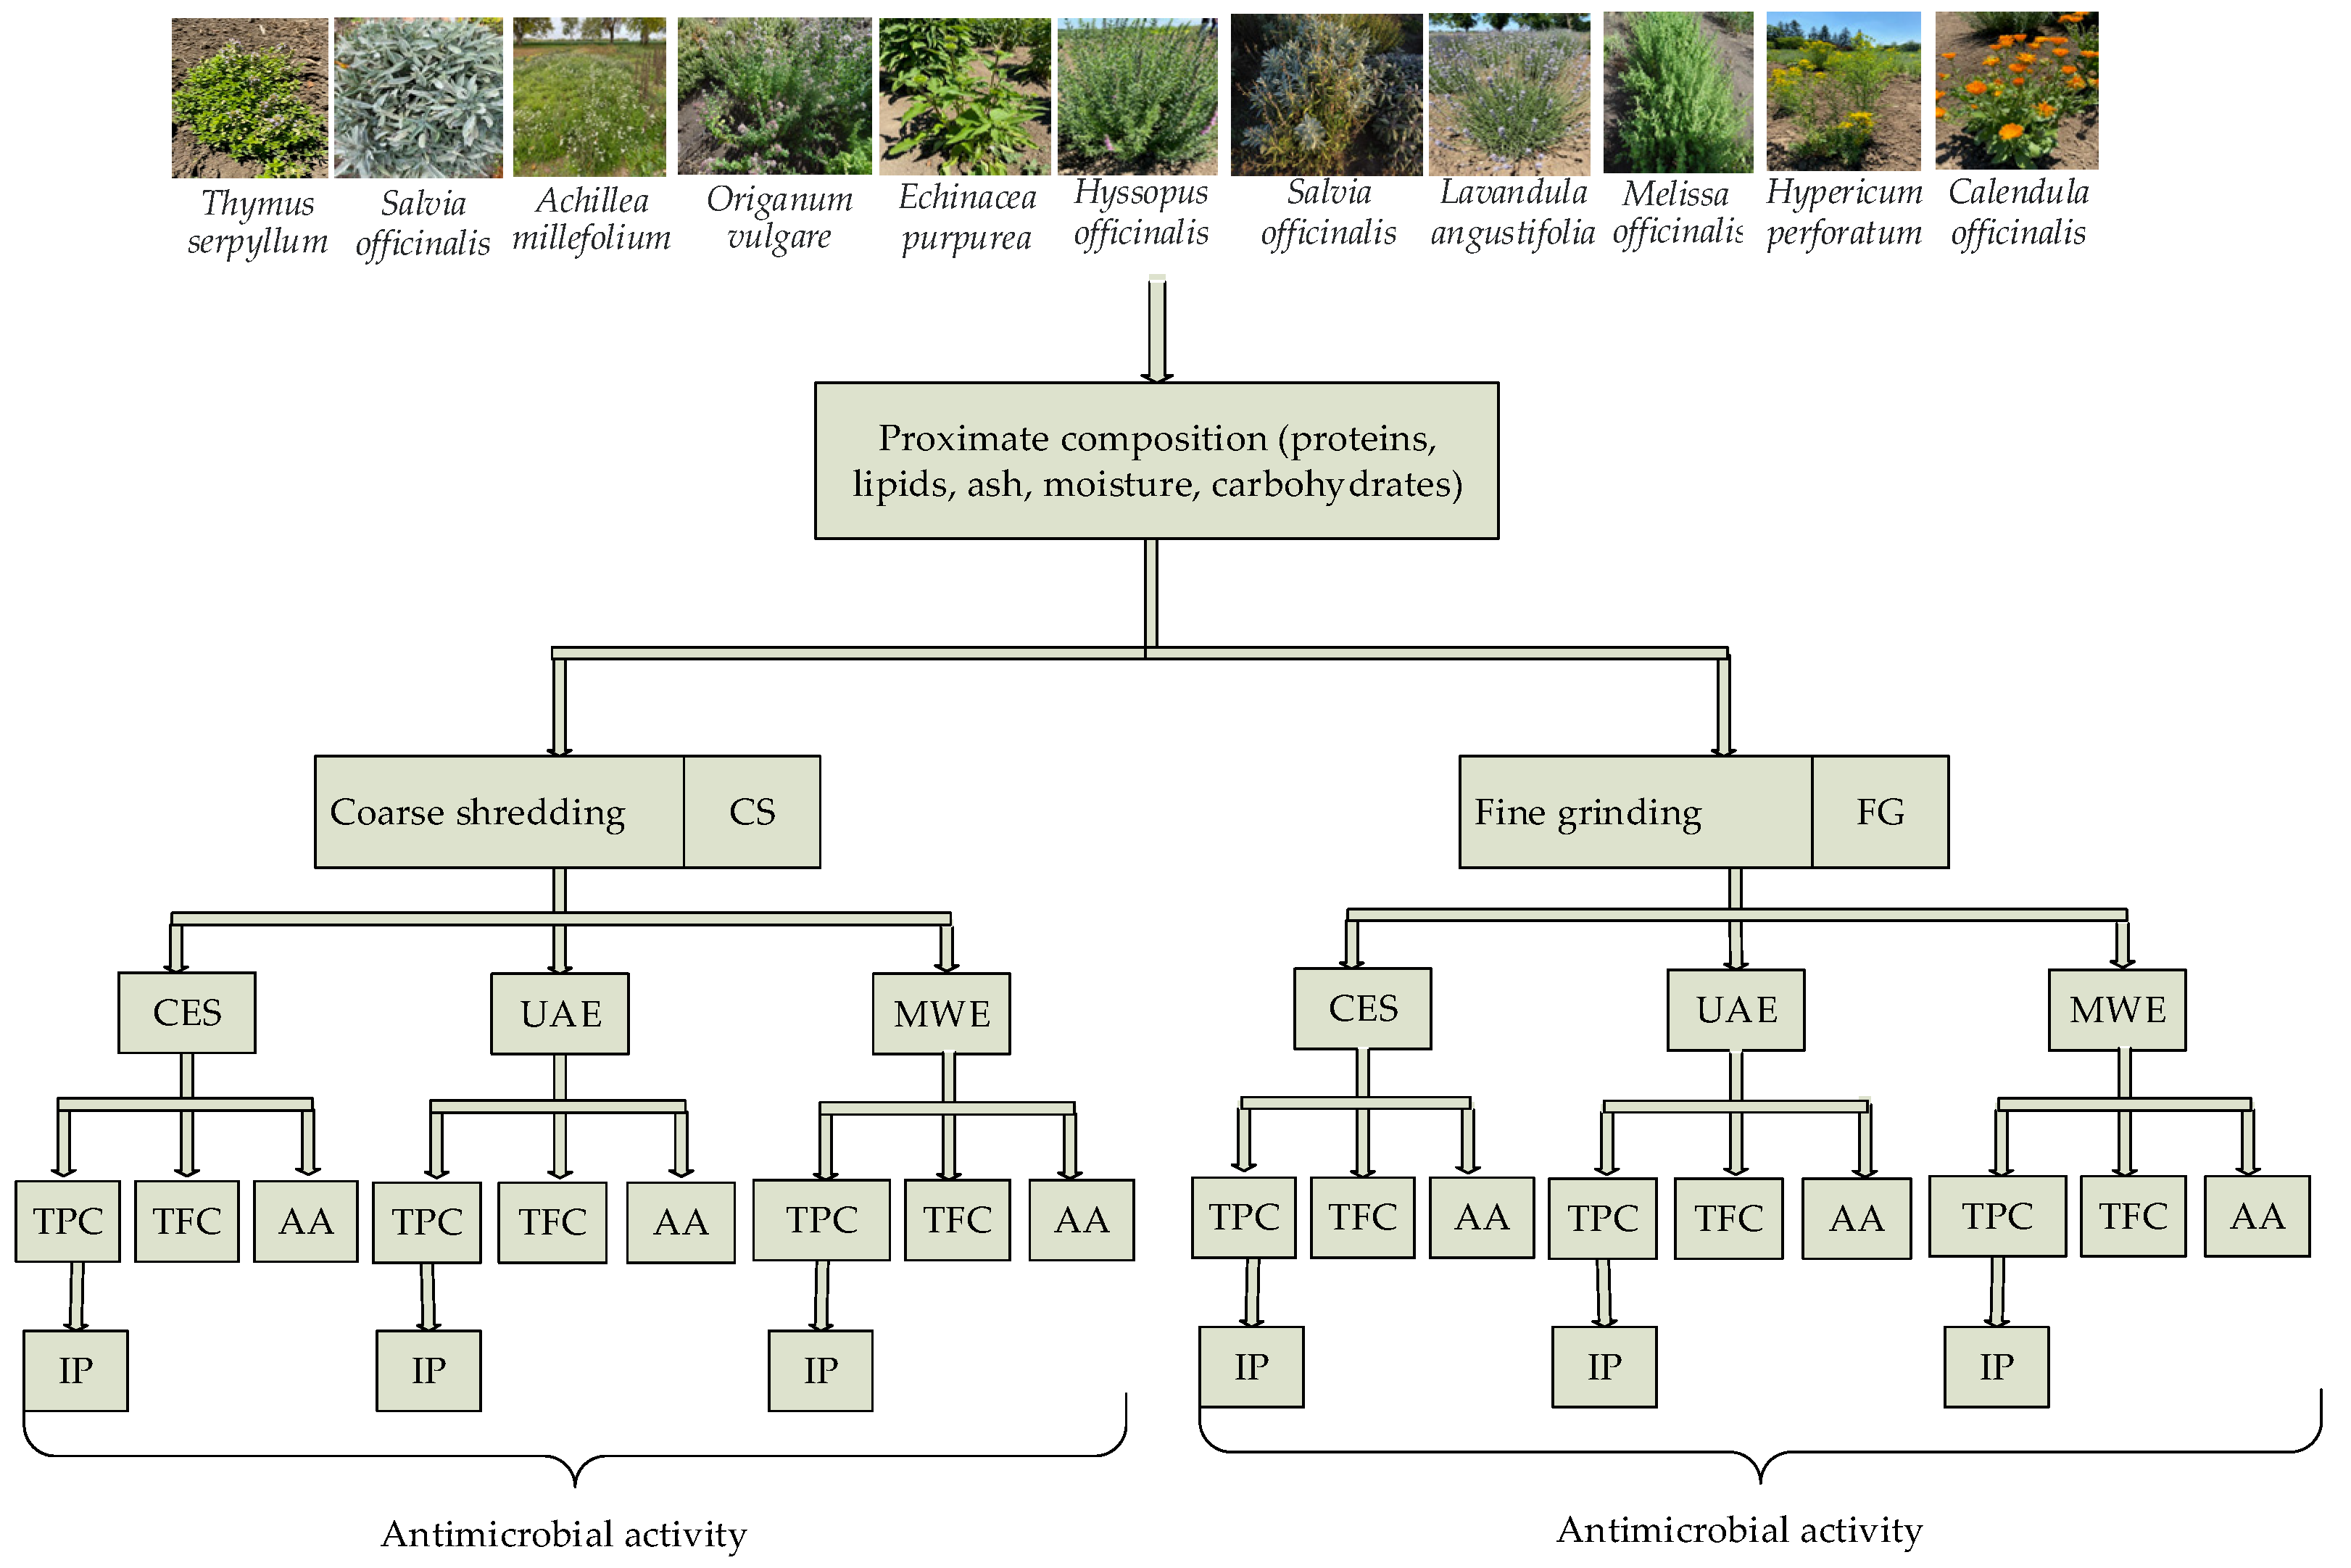
Figure 1. The flow chart of the preparation/extraction methods and analysis process.
Applsci 13 02530 g001
Figure 2. TPC content for CS/FG samples extracted by CES, UAE, and MWE methods. According to the t-test, the different lower-case letters (a–f represent the significant differences (p < 0.05) between samples obtained by the same shredding method. The different capital letters (A, B) represent the significant differences (p < 0.05) between samples from the same plant obtained by different shredding methods.
Applsci 13 02530 g002
Figure 3. The TPC compared for the 3 extraction methods (a) CS, (b) FG. According to the t−test, the different lower-case letters (a–c) represent the significant differences (p < 0.05) between samples from the same plant obtained by different extraction methods.
Applsci 13 02530 g003
Figure 4. AA expressed as FRAP for CS/FG samples extracted by the CES, UAE, and MWE methods. According to the t−test, the different lower-case letters (a–k represent the significant differences (p < 0.05) between samples obtained by the same shredding method. The different capital letters (A, B) represent the significant differences (p < 0.05) between samples from the same plant obtained by different shredding methods.
Applsci 13 02530 g004
Figure 5. The AA (expressed as FRAP) compared for the 3 extraction methods (a) CS; (b) FG. According to the t-test, the different lower-case letters (a–c) represent the significant differences (p < 0.05) between samples from the same plant obtained by different extraction methods.
Applsci 13 02530 g005
Figure 6. TFC for CS/FG samples extracted by CES, UAE, and MWE methods. According to the t-test, the different lower-case letters (a–h) represent the significant differences (p < 0.05) between samples obtained by the same shredding method. The different capital letters (A, B) represent the significant differences (p < 0.05) between samples from the same plant obtained by different shredding methods.
Applsci 13 02530 g006
Figure 7. The TFC compared for the 3 extraction methods (a) CS; (b) FG. According to the t-test, the different lower-case letters (a–c) represent the significant differences (p < 0.05) between samples from the same plant obtained by different extraction methods.
Applsci 13 02530 g007
Figure 8. Linear correlations between AA, TPC, and TFC; linear and quadratic dependence of AA with respect to TPC and TFC.
Applsci 13 02530 g008
Figure 9. The antimicrobial activity of the extracts
Applsci 13 02530 g009aApplsci 13 02530 g009b
Table 1. The characteristics of studied medicinal plants.
Nr.
Crt.
Botanical NameAbreviationFamilyPopular NameThe Vegetal PartVoucher No.
1Mentha x piperitaMPLamiaceaemintaerial partSNH.BUASTM—89/2
2Thymus serpyllumTSLamiaceaeWild thymeaerial partVSNH.BUASTM—101/5
3Salvia officinalisSO1Lamiaceaesageaerial partVSNH.BUASTM—98/1
4Achillea millefoliumAMAsteraceaeyarrowaerial partVSNH.BUASTM—70/2
5Origanum vulgareOVLamiaceaeoreganoaerial partVSNH.BUASTM—93/1
6Echinacea purpureaEPAsteraceae echinaceaaerial partVSNH.BUASTM—124
7Hyssopus officinalisHOLamiaceaehyssopaerial partVSNH.BUASTM—83/1
8Salvia officinalisSO2Lamiaceaesage seedsVSNH.BUASTM—98/2
9Lavandula angustifoliaLALamiaceaelavenderaerial partVSNH.BUASTM—85/5
10Melissa officinalisMOLamiaceaeLemon balmaerial partVSNH.BUASTM—88/3
11Hypericum perforatumHPHypericaceaeSt. John’s wortaerial partVSNH.BUASTM—82/4
12Calendula officinalisCOAsteraceaemarigoldaerial partSNH.USABTM—71/1
Table 2. Chemical and nutritional composition of medicinal plants.
SampleChemical Parameters
Moisture
(g/100 g)
Proteins
(g/100 g)
Lipids
(g/100 g)
Ash
(g/100 g)
Carbohydrates (g/100 g)Energy Value (kcal/100 g)Dry Residue
(%)
MP9.57 ± 0.22 a14.10 ± 0.34 a0.99 ± 0.03 a12.37 ± 0.28 a62.97317.172.00 ± 0.01
TS7.10 ± 0.16 b8.75 ± 0.20 b0.52 ± 0.01 b, c7.60 ± 0.18 b76.03343.802.22 ± 0.03
SO110.76 ± 0.24 c10.79 ± 0.26 c0.78 ± 0.02 c6.84 ± 0.17 c70.83333.503.05 ± 0.02
AM7.15 ± 0.15 b12.51 ± 0.31 d1.12 ± 0.03 a, e6.45 ± 0.16 c72.77351.182.34 ± 0.02
OV7.17 ± 0.16 b9.86 ± 0.23 e0.55 ± 0.01 b7.69 ± 0.19 b74.73343.312.22 ± 0.01
EP12.45 ± 0.31 d15.70 ± 0.38 f1.06 ± 0.03 a9.89 ± 0.25 d60.90315.942.10 ± 0.02
HO8.37 ± 0.22 e11.92 ± 0.28 d0.43 ± 0.01 c5.00 ± 0.12 e74.28348.673.21 ± 0.03
SO26.88 ± 0.16 b, f11.54 ± 0.27 c3.84 ± 0.10 d8.21 ± 0.20 f69.53358.843.20 ± 0.01
LA11.73 ± 0.27 d10.35 ± 0.24 c, e0.48 ± 0.01 b, c7.01 ± 0.17 c70.43327.443.15 ± 0.01
MO7.40 ± 0.18 b,21.34 ± 0.52 g0.90 ± 0.02 a12.82 ± 0.32 a57.54323.622.24 ± 0.03
HP6.19 ± 0.14 f13.69 ± 0.33 a1.21 ± 0.03 e3.57 ± 0.09 g75.34367.013.20 ± 0.01
CO8.09 ± 0.19 e19.25 ± 0.46 h1.08 ± 0.03 a8.97 ± 0.22 h62.61337.162.42 ± 0.02
Results are expressed as the mean value of three determinations ± standard deviation (SD). The mean differences between samples were compared using a t-test; data sharing different superscripts (a–h) in the same row show statistically significant differences (p < 0.05).
Table 3. Macro- and microelement content of medicinal plants.
SampleZn (ppm)Fe (ppm)Mn (ppm)K (ppm)Ca (ppm)Mg (ppm)
MP22.21 ± 0.96 a416.77 ± 3.35 a46.10 ± 1.18 a5286.30 ± 27.07 a4256.71 ± 14.27 a381.14 ± 3.65 a
TS17.35 ± 0.81 b489.00 ± 3.64 b27.56 ± 1.07 b3400.10 ± 13.11 b4423.89 ± 13.77 b357.61 ± 3.46 b
SO124.32 ± 0.94 c271.85 ± 1.89 c26.53 ± 0.85 b7215.30 ± 19.44 c6115.06 ± 16.03 c462.88 ± 3.37 c
AM11.33 ± 0.65 d220.22 ± 1.38 d23.23 ± 0.79 c3459.00 ± 16.48 b4067.74 ± 14.86 d364.52 ± 3.92 b
OV17.47 ± 0.74 b286.80 ± 1.75 e22.28 ± 0.87 c3492.77 ± 17.54 b2748.35 ± 9.79 e361.54 ± 3.64 b
EP19.52 ± 0.87 e160.62 ± 1.00 f17.21 ± 0.77 d4825.90 ± 19.65 d4708.79 ± 15.83 f382.42 ± 3.82 a
HO14.25 ± 0.85 f198.53 ± 1.10 g23.22 ± 0.17 c8468.50 ± 20.00 e5664.99 ± 16.08 g536.67 ± 3.56 d
SO233.10 ± 1.17 g320.66 ± 2.15 h26.04 ± 0.97 b5013.20 ± 19.98 e5371.23 ± 16.40 h454.79 ± 3.47 e
LA35.07 ± 1.27 g298.25 ± 1.79 i22.26 ± 0.82 c9045.20 ± 21.96 f7575.43 ± 19.18 i605.26 ± 4.44 f
MO28.35 ± 1.14 h360.77 ± 2.42 j23.59 ± 0.81 c6029.80 ± 20.22 g5500.01 ± 16.58 j428.21 ± 3.58 g
HP22.40 ± 0.93 a173.92 ± 1.21 k24.25 ± 0.89 c6083.30 ± 17.47 g1501.18 ± 10.17 k385.71 ± 3.14 a
CO26.03 ± 1.00 c209.86 ± 2.00 l33.60 ± 1.32 e6585.87 ± 20.54 h3687.16 ± 12.66 l428.21 ± 3.55 g
Results are expressed as the mean value of three determinations ± standard deviation (SD). The mean differences between samples were compared using a t-test; data sharing different superscripts (a–l) in the same row show statistically significant differences (p < 0.05).
Table 4. Individual polyphenols (mg/g) detected using LC/MS.
CompoundRtm/zMPTSSO1AMOVEPHOSO2LAMOHPCO
Gallic acid5.1751690.4 ± 0.02 a0.08 ± 0.001 b0.07 ± 0.002 b0.56 ± 0.02 c0.27 ± 0.01 d0.27 ± 0.01 d0.29 ± 0.01 d0.37 ± 0.01 a0.38 ± 0.01 a1.58 ± 0.05 e1.50 ± 0.05 e2.17 ± 0.12 f
Protocatechuic acid11.112153ndnd0.05 ± 0.002 a0.08 ± 0.002 b0.05 ± 0.002 a0.14 ± 0.002 c0.12 ± 0.02 c0.05 ± 0.002 a0.06 ± 0.002 a, b0.07 ± 0.003 b0.18 ± 0.005 d0.23 ± 0.01 e
Epicatechin22.2052890.22 ± 0.005 a0.53 ± 0.02 b0.30 ± 0.01 c0.18 ± 0.04 d0.39 ± 0.02 e, f0.38 ± 0.004 e, g0.41 ± 0.04 e, f0.40 ± 0.02 f0.39 ± 0.01 e, f0.35 ± 0.01 g0.30 ± 0.01 c0.18 ± 0.04 d
Rosmarinic acid29.289359nd8.91 ± 0.28 a4.50 ± 0.17 b5.66 ± 0.15 c6.17 ± 0.17 d6.40 ± 0.19 d, e9.16 ± 0.28 a6.53 ± 0.18 e3.39 ± 0.16 f4.51 ± 0.17 b7.81 ± 0.20 g5.63 ± 0.20 c
Quercetin31.6503010.07 ± 0.002 a0.06 ± 0.001 a, b0.06 ± 0.002 a, b0.07 ± 0.002 andnd0.05 ± 0.001 b0.06 ± 0.002 a, b0.06 ± 0.002 a, b0.07 ± 0.002 a0.19 ± 0.005 c0.37 ± 0.01 d
Kaempferol34.5352850.05 ± 0.001 a0.14 ± 0.003 b0.09 ± 0.003 c, dnd0.11 ± 0.002 cnd0.07 ± 0.002 a, dndnd0.42 ± 0.02 e0.05 ± 0.002 a, d0.67 ± 0.03 e
Data sharing different superscripts (a–g) show statistically significant differences (p < 0.05), nd-not detectable.
Table 5. The MIC values (mg/mL) for plant extracts against tested strains.
Plant Extract/StrainsS. pyogenesS. aureusS. flexneriP. aeruginosaE. coliS. typhimuriumH. influenzaeC. albicansC. parapsilopsis
MP151515-1515151515
TS451515151515151515
SO1151515601515151515
AM151515151515151515
OV-1515601515151515
EP151515301515151515
HO451515151515151515
SO2601515601515151515
LA153030601515151515
MO-1515301515151515
HP603030-3015151530
CO151530-1515151515
Disclaimer/Publisher’s Note: The statements, opinions and data contained in all publications are solely those of the individual author(s) and contributor(s) and not of MDPI and/or the editor(s). MDPI and/or the editor(s) disclaim responsibility for any injury to people or property resulting from any ideas, methods, instructions or products referred to in the content.