Article

The Evolution Characteristics and Driving Mechanism of Urban Construction Land in Hong Kong since 1972

1
College of Architecture, Nanjing Tech University, Nanjing 211816, China
2
College of Ecology Technology and Engineering, Shanghai Institute of Technology, Shanghai 201418, China
*
Author to whom correspondence should be addressed.
These authors contributed equally to this work.
Appl. Sci. 2023, 13(4), 2565; https://doi.org/10.3390/app13042565
Submission received: 23 December 2022 / Revised: 12 February 2023 / Accepted: 14 February 2023 / Published: 16 February 2023

Abstract

:
As an important spatial carrier of Hong Kong’s economic development, construction land provides a critical site for Hong Kong’s economic and social activities. The development of construction land directly affects the sustainable development of the city. Therefore, analysing the spatial and temporal evolution and driving mechanism of construction land in Hong Kong is of great significance in promoting sustainable urban development. This study aimed to evaluate the evolutionary characteristics and driving mechanism of construction land of Hong Kong in the period 1972–2020. Here, we extract construction land data from 1972 based on the historical map of Hong Kong. Then, we apply ArcGIS Pro and Fragstats software to calculate the rate of land expansion, land intensity, change in the centre of gravity, and landscape pattern index of construction land in Hong Kong from 1972–2020. Analysis shows the following: (1) The expansion of construction land in Hong Kong generally showed the characteristics of “rapid at first and then slowing down”, with 2010 as the peak of the 1970–2020 timeframe. (2) The sources of construction land transfer mainly came from cultivated land, sea areas, and forest land, which were mainly distributed in the New Territories. (3) The centre of gravity of construction land in Hong Kong showed the spatial characteristics of “slowly shifting to the northwest” during the study period, indicating that Hong Kong’s polycentric urban structure has been continuously strengthened. (4) The Spiltting index showed a tortuous upward trend, and the index of Mean Euclidean nearest neighbour distance showed a steady downward trend, which indicated that the landscape connectivity of city construction land steadily increased while the degree of fragmentation gradually increased. (5) The driving factors behind the expansion of Hong Kong construction land comes from population, economic, and traffic factors; the support factors come from location and policy factors; the elasticity factors mainly come from reclamation projects; the resistance factors mainly come from the restrictions of environmental protection departments, NGOs, and relevant laws on land reclamation.

1. Introduction

The expansion of construction land can directly reflect the process of urbanisation, and the study of construction land expansion can help administrators to better grasp the stage of urban development and provide a scientific basis for urban sustainable development [1,2,3]. Spatially, the expansion of construction land is the expansion of the built-up area, which essentially presents the change of urban structure caused by the flow of urban elements [4]. The intersection of remote sensing, geography, urban planning, and other disciplines has led to the continuous refinement of construction land research. Scholars at the domestic and international levels have proposed quantification methods from multiple perspectives, such as spatial morphology [5,6], spatial centre of gravity [7,8], landscape patterns [9], etc. A wide range of research has been carried out, from the national scale [10,11] to the scale of urban clusters [12,13,14,15] to individual cities, with considerable results. Changes in construction land have led to changes in urban landscape patterns; thus, the introduction of landscape pattern indices is important in revealing the process and impact of urban development [16]. In recent years, scholars have studied the evolutionary characteristics of construction land expansion on a longer time scale based on historical documents such as early maps and topographic maps [17], achieving outstanding results. Urban development planning or regional development planning by urban policymakers can guide the future development of a city and provide concrete guidance for action in urban construction to a large degree. In other words, it has direct influence on the development of the construction land. However, most of the existing research on construction land is limited to quantitative analysis of the characteristics of change or the scale of change [18,19]; few scholars have discussed the driving mechanisms behind the evolution, and the analysis of the development history and target planning of cities is not sufficiently thorough. Moreover, the existing research does not provide a robust analysis of the history of the city’s development and planning of the urban development. This has led to a lack of understanding of the deeper logic of construction land evolution, which leads to difficult for policy makers in promoting a healthy urban development.
As a first-tier city in the world and one of the important cities in the Guangdong–Hong Kong–Macao Greater Bay Area, Hong Kong has important strategic value in the country and even globally. It has been 180 years since Hong Kong began its urbanisation process in 1842, and it has formed a relatively independent urban development system and decision-making mechanism for city construction. The characteristics and driving mechanism of the various stages of its urban construction land development are of great research value. Most of the existing studies focus on the history of Hong Kong’s urban planning development [20,21], urban planning system [22,23], land use policy [24,25,26,27], and microscopic space [28,29]; there are few empirical studies on the spatial and temporal evolution characteristics and driving factors of Hong Kong’s construction land.
In this research, we select Hong Kong as the study area and extend the study time period to 48 years by extracting construction land data from the 1972 historical map of Hong Kong on top of the CAS land use dataset (1980–2020). We then use a variety of indices to quantify the evolution of Hong Kong’s construction land over the past half century and provide an in-depth analysis of the mechanisms driving the evolutionary characteristics of Hong Kong’s construction land. Our research deconstructs the abstract mechanism driving urban construction land and interprets the internal logic of the evolution of urban construction land through urban development policies and regional development plans in different periods. We aim to help urban constructors to grasp the stages of Hong Kong’s urban development and to make scientific and rational decisions for Hong Kong’s sustainable development.

2. Study Area and Data

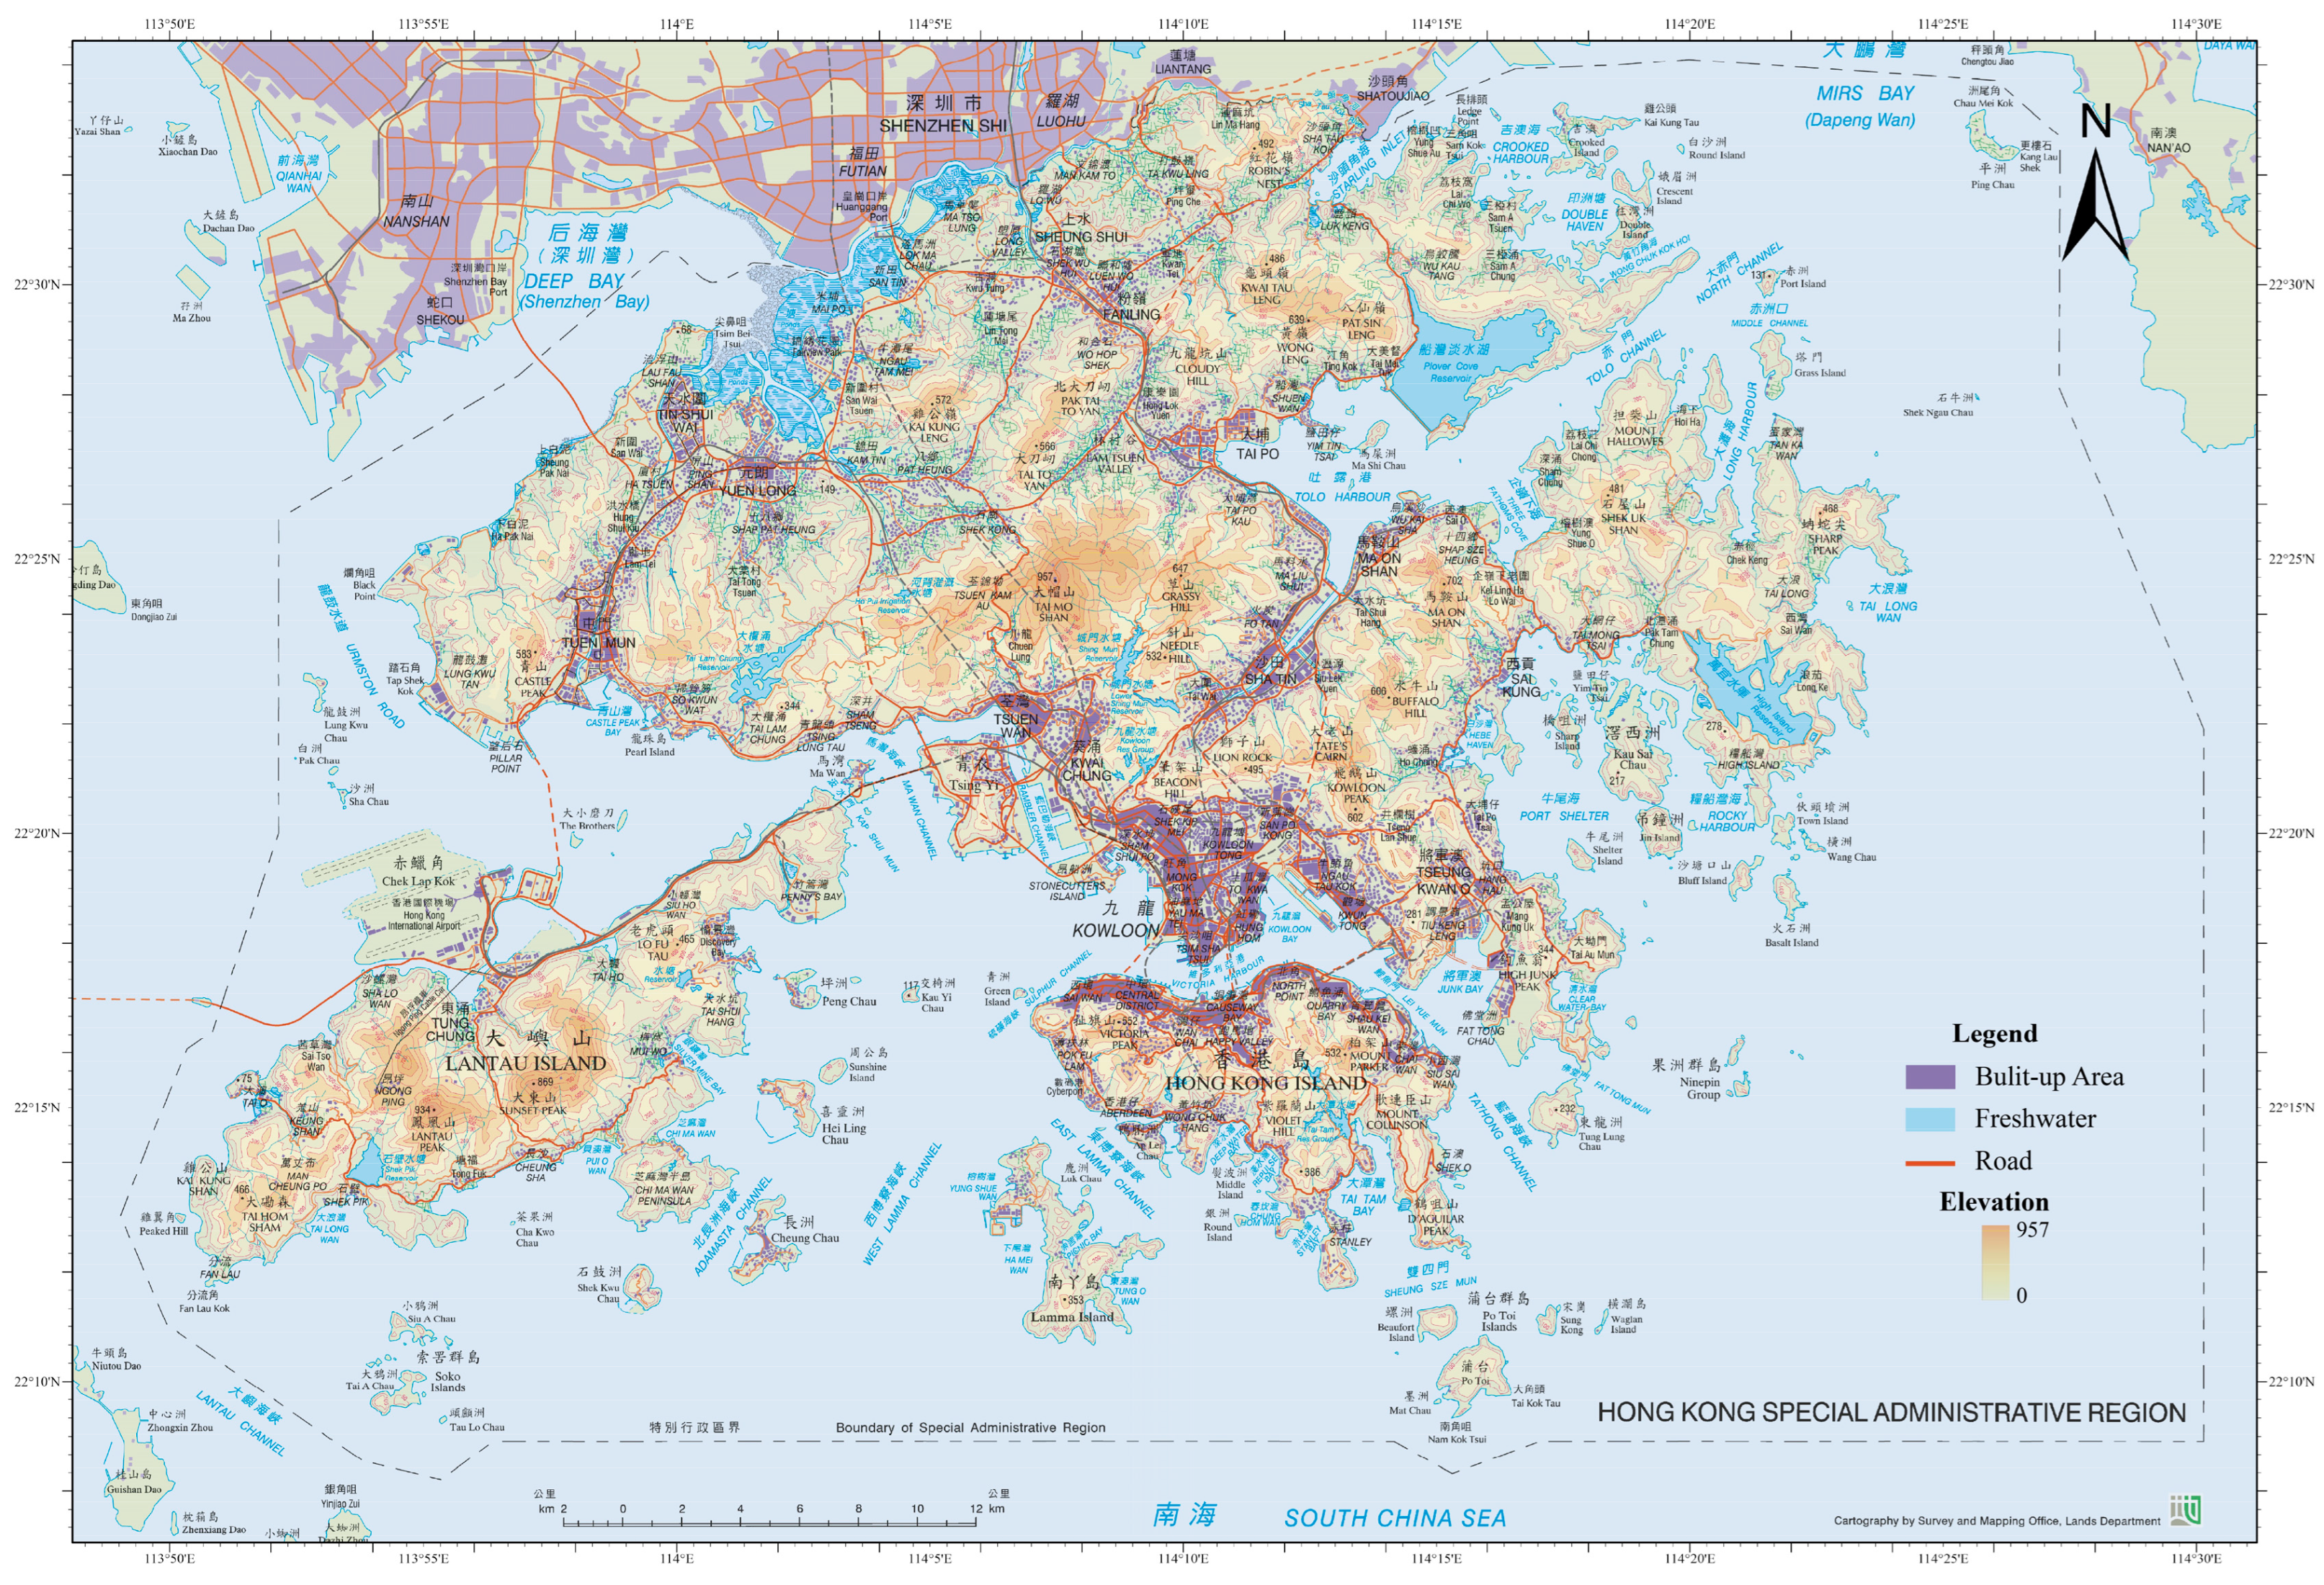
2.1. Overview of the Study Area

Hong Kong, also known as the “Hong Kong Special Administrative Region”, is located on the northern coast of the South China Sea, east of Pearl River Estuary, adjacent to Guangdong Province, separated from Macau and Zhuhai by the Pearl River to the west, and along the Shenzhen River to the north. Located at the centre of the countries along the western Pacific coast, Hong Kong is also a major shipping centre in the Pacific and Indian Oceans and thus has global strategic value. Spatially, Hong Kong includes Hong Kong Island, Kowloon, the New Territories, and the 262 surrounding islands (Figure 1).

2.2. Data Sources and Process

Hong Kong’s urbanisation process began in 1842 with the opening of the city port, and initially urban development was concentrated on Hong Kong Island and Kowloon. As the population continued to grow and the living environment in residential areas deteriorated, the development of new towns became urgent. In 1960, the British Hong Kong Government began to plan for the development of new towns, and construction work began in 1970. In the same year, the Ten-Year Housing Programme was proposed, aiming to build low-cost housing for 1.8 million people in the new towns between 1973 and 1983, which gave a strong impetus to the rapid expansion of land for construction in Hong Kong and marked the beginning of the large-scale development of new towns. Therefore, research sets 1972 as the initial year of the study, with the aim of exploring the characteristics and driving mechanism of the evolution of construction land across Hong Kong since the launch of the Hong Kong New Town Programme. Therefore, nine periods of data were selected between 1972, 1980, 1990, 1995, 2000, 2005, 2010, 2010, 2015 and 2020, with a total time span of 48 years, which can better reflect the characteristics and changes in the distribution of construction land since the launch of the New Town Programme.
The Geological Map of Hong Kong, Kowloon, and the New Territories (1:50,000) 1972 (hereinafter referred to as the Geological Map), the data of the National Land Use Types of the Chinese Academy of Sciences (hereinafter referred to as the CAS data), and the statistical yearbooks of Hong Kong for various historical years were used as the data for this research. The Geological Map is based on the thematic geological data of the whole territory of Hong Kong, with data on urban roads, railways, construction areas, etc., which can better reflect the development of the city at that time and be used for quantitative empirical research; thus, this historical map was selected as a history data source, and we extracted construction land data by manual visual interpretation. The CAS data were decoded and interpreted using Landsat imagery data, and the field validation showed that the classification accuracy of urban construction land reached 98.26%, which meets the research needs of this paper [30,31]. Vector data such as Hong Kong administrative divisions were obtained from the 1:1 million public version of the Basic Geographic Information Dataset released by the China National Geographic Information Centre (https://www.webmap.cn/main.do?method=index (accessed on 12 February 2023) in 2021. Statistics such as GDP and population data from 1972 to 2021 were obtained from the statistical yearbooks released by the Hong Kong Government for various years (Table 1).
We used ArcGIS to calculate the area, rate of change in construction land, intensity of construction land expansion, and the centre of gravity at each study time. The land use conversion matrix was used to analyse the data of adjacent years; Fragstats 4.2 was used to calculate the changes in the landscape pattern index of urban construction land in each time period to explore the characteristics and driving mechanism of urban expansion in Hong Kong over the past half-century.

3. Methodology

3.1. Rate and Intensity of Expansion

Through the expansion area of urban building construction ( Δ S ), the rate of expansion ( v ) and intensity of expansion ( K ) indicators are used to quantify the change in urban construction land in Hong Kong, calculated as follows.
Δ S = S b S a
v = S b S a Δ T
K = S b S a S a × Δ T × 100 %
where S a and S b are the area of construction land in the adjacent period. Δ T is the time interval. The intensity of expansion is the annual averaging of the expansion area and standardisation of the expansion rate, which is effective in eliminating the influence of the initial state of the urban size on city expansion [32].

3.2. Land Use Conversion Matrix

The land use transfer matrix is an application of Markov models on land use change and can quantitatively describe the state change in the city system [33]. Using ArcGIS software, land use data from adjacent years are overlain to obtain conversion data reflecting the conversion of each land use type to the other, obtaining the land use conversion matrix to reflect the quantitative changes in the conversion of each land use type. The mathematical principle of the conversion matrix is as follows.
C i j = [ C 11 C 12 C 16 C 21 C 22 C 26 C 61 C 62 C 66 ]
where C i j is the first year of the adjacent year of i land use type to the end of the adjacent year j land use type.

3.3. Standard Deviation Elliptic Model

The standard deviation ellipse model (SDE) can accurately reveal the overall characteristics of the spatial distribution of geographic elements. It is based on the spatial location and spatial structure of the research object, quantifying the spatial distribution of geographic elements in terms of centre of gravity, transfer direction, and other characteristics, and can reveal the spatial distribution and spatial and temporal evolution of the construction land’s centre of gravity [34,35]. The SDE model was first proposed by Lefever to reveal the spatial distribution characteristics of geographical elements [36,37,38,39] and is now widely used in sociology, urban planning, ecology, and other fields [40,41,42]. The parameters of the standard deviation ellipse mainly include the centre of gravity of the ellipse, the long and short axes of the standard deviation ellipse, and so on. The centre of gravity of the standard deviation ellipse is chosen to represent the centre of gravity of urban construction land, and the centre of gravity of the standard deviation ellipse ( X ¯ w , Y ¯ w ) is as follows.
X ¯ w = i = 1 n w i x i i = 1 n w i , Y ¯ w = i = 1 n w i y i i = 1 n w i
where ( x i , y i ) denotes the spatial location of the study object, and w i denotes the corresponding weights.

3.4. Landscape Pattern Index

The landscape pattern indices of the construction land were calculated in Fragstats software for each year, and six landscape pattern indices, TA (Total Landscape Area), NP (Number of Patches), PD (Patch Density), LPI (Largest Patch Index), SPILT (Spiltting Index), and ENN-MN (Mean Euclidean Nearest Neighbour Distance), were selected to analyse the characteristics of the patch types of the construction land [43] (Table 2).

4. Results

4.1. Rate of Expansion: Rapid, Then Slowing Down

The expansion of construction land in Hong Kong showed the characteristics of “rapid at first and then slowing down” during the study period. The construction land area increased from 118.2 km2 to 236.3 km2, about twice the original area (Figure 2). The growth period was mainly from 1972 to 2010, when the growth rate of construction land remained at 1.94 km2·a−1 and above; a slowdown characteristic since 2010 was observed, when the rate of construction land remained at 0.17–0.26 km2·a−1 (Figure 3). The expansion intensity of construction land showed an irregular lower characteristic, from 3.22% to 0.07% (Figure 4).
In order to meet the housing needs brought by the large population of Hong Kong between 1972 and 1980, the British Hong Kong government introduced the “Ten-Year Housing Construction Plan”, aiming to build low-rent housing that could accommodate 1.8 million people before 1983. The large-scale construction activities led to the construction land in Hong Kong increasing by 30.4 km2, at a rate of 3.81 km2·a−1 and an expansion intensity of 3.22%. Sha Tin, Tuen Mun, Yuen Long, and other second-generation new towns began developing rapidly.
The construction land in Hong Kong increased by 27.8 km2, at a rate of 2.78 km2·a−1, from 1980 to 1990, with an expansion intensity of 1.87%. The construction activities in Tuen Mun and Yuen Long districts was further develop during this period, and the degree of connectivity continued to increase; in addition, reclamation activities were an important factor in the expansion of construction land in Hong Kong (Table 3).
The growth trend of construction land continued from 1990 to 1997, with an area of 208 km2, a growth rate of about 3.3 km2·a−1, and an expansion intensity of 2.48% (1990–1995). This was due to the announcement of the Hong Kong Airport Core Programme (also known as the “Rose Garden Project”) by the British Hong Kong Government in 1989, which enabled several major reclamation projects to be carried out, including the reclamation of 1248 hectares for the Chek Lap Kok Airport and 334 hectares for the West Kowloon area. These two projects’ reclaimed area accounted for 79% of the total reclamation area in Hong Kong between 1980 and 1999; the reclamation projects significantly increased the area of land available for construction in Hong Kong. With several projects under the Programme being completed, such as the Chek Lap Kok Airport, the North Lantau Expressway, the Tsing Ma Bridge, and other important facilities, population and economic clusters have contributed to the development and prosperity of the third generation of new towns, represented by Tung Chung, comprising an integral part of Hong Kong’s polycentric urban structure. The construction land area increased to 234.1 km2 from 1997 to 2010, the growth rate remained between 1.94–3.12 km2·a−1, and the expansion intensity was 1.22% (average value of 2000–2005 and 2005–2010). The growth area was mainly concentrated in Yuan Long, Tuen Mun, the North District, and other new towns. During this period, the new towns sprawled and connected to form regional new town clusters, gradually developing into the secondary city development axis of Hong Kong [44]. The “Protection of the Harbour Ordinance” was passed by the Legislative Council in 1997, and a large number of proposed reclamation projects could not be implemented. Some of the reclamation projects that have been carried out have used considerable construction land for high-density city expansion under harsh reclamation conditions, such as the 290 hectares of reclamation for the Penny’s Bay project (two phases combined) and the 127 hectares of reclamation for the Container Terminal No. 9 project.
The rate of change in construction land in Hong Kong slowed down and remained between 0.17–0.26 km2·a−1 from 2010 to 2020, with the intensity of expansion decreasing to 0.09% (average value of 2010–2015 and 2015–2020). Growth in construction land was mainly concentrated in the expansion of the third aircraft runway in the north of the Hong Kong Airport (estimated 650 ha of reclamation [45]) and the reclamation of the artificial island of the Hong Kong–Zhuhai-Macao Bridge Hong Kong Boundary Crossing Facilities (about 158 ha). The expansion of construction land in Hong Kong entered an extremely slow period under the constraints of the “ Protection of the Harbour Ordinance “ and the gradually emerging movement of ecological and environmental protection.

4.2. Analysis of the Land Conversion Matrix

With Hong Kong original construction land unchanged between 1980 and 1990, a total of 27.48 km2 was transferred from the four types of cultivated land, sea area, water area, and forest land, and the construction land increased to 176.42 km2. Among them, the area of cultivated land converted to construction land was the largest (13.27 km2), followed by sea area (7.2 km2) and water area (3.95 km2); the area of forest land converted to construction land was the least (3.06 km2) (Table 4). From the spatial perspective, conversion areas were mainly concentrated in Tuen Mun and Yuen Long districts, with a few reclamation projects in the coastal areas of Sham Shui Po and Tai Po.
The area of construction land maintained a rapid increasing trend from 1990 to 2000, with a total of 32.94 km2 transferred from land types such as cultivated land, forest land, sea area, and other land types, among which sea area transferred the largest area, followed by forest land and cultivated land (Table 5). Spatially, the transfer of sea area to construction land (17.48 km2) was mainly due to the large-scale reclamation project of the Hong Kong Airport and the West Kowloon Reclamation Project, while the transfer of forest land and cultivated land to construction land was mainly concentrated in Yuen Long District. In addition, a small amount of construction land was transferred out, mainly from construction land to forest land and cultivated land, which was mainly distributed in the southwest of Tuen Mun District.
The construction land increased to 234.14 km2 from 2000 to 2010; cultivated land (21.14 km2), forest land (18.16 km2), and sea area (14.82 km2) were the most transferred areas, followed by grassland and water area (Table 6). Spatially, the conversion of cultivated land to construction land was mainly concentrated in the entire Yuen Long District, with a small amount distributed in the North District, and the conversion of forest land to construction land was mainly concentrated in the west of the North District. The conversion of sea areas to construction land was mainly concentrated in the northern part of Hong Kong Island, which was due to the long-established Central Reclamation Project. In this decade, the area transferred from construction land was 24.14 km2; the greatest area was converted to grass and forest, followed by cultivated land and water area.
The growth rate of construction land slowed down and the area increased to 236.32 km2 until 2020, with the largest area of forest land converted to construction land (7.86 km2), followed by cultivated land and sea area (Table 7). Spatially, the conversion of forest land to construction land was mainly located at the junction of Kwun Tong and Sai Kung districts, with a small amount scattered throughout Hong Kong; the conversion of cultivated land to construction land was also scattered throughout Hong Kong. In addition, the conversion of cultivated land to construction land was also scattered in various districts of Hong Kong. The main reason for the conversion of sea areas to construction land was the reclamation project of the Hong Kong Port artificial island of the Hong Kong–Zhuhai-Macao Bridge on the east side of the new airport. In this decade, a total of 9.65 km2 of construction land was transferred out, mainly cultivated land, forest land, and water area, and the transferred land types were relatively scattered.

4.3. Construction Centre of Gravity: Slowly Shifting to the Northwest

The centre of gravity of Hong Kong construction land showed the characteristics of “slowly shifting to the northwest” in the past half-century (Figure 5). Hong Kong began its urban development process in 1842, 130 years before the initial study year of 1972. Due to the rapid regional development of Yuen Long and Tuen Mun, the construction centre shifted to the northwest from 1972 to 1980. With the development of various new towns, the construction land of new towns represented by Shatian and Tai Po underwent large-scale expansion, and the whole construction centre of gravity shifted to the northeast from 1980 to 1990. According to the “Port and Airport Development Strategy Research”, the Hong Kong British government launched the regional development strategy “Metropolis Plan” (also known as “Back to the Port”) from 1990 to 1995, which redistributed the population to the urban areas around the port and led to large-scale land reclamation in areas such as Kowloon. In a short period of time, the centre of gravity of construction land was pulled to the southeast to a certain degree. With the completion of the new airport, the core project known as the “Rose Garden Project” promoted by the British Hong Kong government from 1995 to 2000, represented the last Hong Kong airport, located in Tung Chung. With the rapid development of new towns, the focus of construction gradually shifted to the northeast. With the connectivity of construction land in Tuen Mun, Yuen Long, and the North District increasing from 2000 to 2010, regional integration gradually improved, creating an integrated construction area occupying the north of Hong Kong; the construction centre of gravity continued to move toward the Yuen Long District. As the urban construction land was exhausted and reclamation projects became limited, the development of construction land in Hong Kong slowed greatly, and it slowly migrated to the northwest as a result of inertia between 2010 and 2020.

4.4. Analysis of the Consturction Land Landscape Pattern

By calculating the landscape pattern index of Hong Kong’s construction land in each year, we sought to reflect the evolution of Hong Kong’s construction land pattern over the past half-century (Table 8).

4.4.1. Analysis of Patch Size, Number, and Density

The TA of construction land continued to increase during the study period, and the NP gradually increased, indicating the continuous expansion of the urban construction landscape. From 1972 to 2020, PD showed a floating downward trend, i.e., the number of patches per unit area gradually decreased, which indicates that the regional construction land was constantly linking and merging into large patches. This phenomenon is particularly obvious in Yuen Long and Tuen Mun districts, where the spreading expansion between municipalities constantly links small regional patches, significantly increasing the area of regional construction land. The reason for the slight increase of PD from 1995 to 2000 is that the number of construction land patches increased to a large extent due to multiple reclamation projects.
LPI showed a downward trend from 1972 to 2020. In general, this is because the growth rate of the total area of construction land patches was slightly greater than the growth rate of the largest patch area during the development and prosperity of Hong Kong’s three generations of new towns.
During 1995–2000, there was a small increase in LPI. During this period, the construction agglomeration areas (63.59 km2) in Tuen Mun, Yuen Long, and North District were integrated by roads, replacing the previous construction agglomeration areas, with Kowloon City as the core (58.23 km2) and the largest construction land patch. This also marks the conclusion of the gradual northward shift of Hong Kong’s urban centre of gravity obtained from the analysis above.

4.4.2. Spatial Characterisation

The SPILT and ENN_MN were calculated to show the degree of landscape fragmentation and landscape connectivity of the construction land. SPILT shows a zigzagging upward trend during the study period, which indicates the gradual fragmentation of the spatial distribution of construction land in Hong Kong and also confirms the urban development stage of sprawl saturation, where the expansion of construction land is gradually finer and more fragmented. The ENN_MN index shows a steady decreasing trend over the study period, which represents the increasing connectivity between construction land in Hong Kong. This is due to the rapid development of roads in Hong Kong over the past half-century and the steady increase in landscape connectivity as the “empty spaces” between earlier building sites are “filled” with urban expansion.

4.5. Analysis of Driving Mechanism of Construction Land Change

Drawing on existing studies, the mechanism of urban construction land expansion can be categorised as thrust, support, elasticity, and resistance [46]. Thrust is the main factor driving the expansion of construction land and mainly includes demographic, economic, and transportation factors.
It can be seen from the changes in construction land, economy, and population in Hong Kong over the past years (Figure 6 and Figure 7) that construction land is positively correlated with economic and population factors and grows with the growth of economic, population, and transportation factors. The driving mechanism is that the increase in population brings about an increase in demand for basic services such as housing and education, thus promoting the construction of urban infrastructure and related works; the urban construction area shows the spatial characteristics of regional sprawl or infill.
As regional development reaches saturation, cities begin to seek other areas suitable for construction. With the continuous improvement of policy attention and transportation accessibility, satellite cities in the traditional sense (Tuen Mun, Yuen Long) began to form and began a new round of expansion. During this period, the multi-centre aggregation of population and economy made Hong Kong’s polycentric urban structure gradually more refined.
Supporting forces are the factors that provide convenient conditions for urban expansion, including the natural environment and policy factors. Hong Kong is strategically important as a shipping hub for countries around the world. Victoria Harbour gradually developed as a wide natural harbour with deep water to become one of the extremely important trading ports in Asia since 1842.Policy factors have also been an important factor in supporting the expansion of land for construction in Hong Kong. The urban development of Hong Kong during the study period was largely consistent with or slightly delayed by the policy direction, from the development and growth of new towns brought about by the Ten Year Housing Plan at the beginning of the study period, to the Port and Airport Development Strategy Study, the Metroplan, and many other policy documents, all of which led to the gradual establishment of Hong Kong’s urban development direction and urban spatial structure from the planning level.
Elasticity refers to the driving forces for urban expansion in different areas of the city. Elasticity is reflected in the development of construction land in Hong Kong, and its representative phenomena are the reclamation projects in various coastal areas of Hong Kong. As a city with high-density development, reclamation projects have provided a large amount of valuable construction land. They have effectively alleviated the tense human–land conflict in Hong Kong, affecting the urbanization process and urban spatial structure of Hong Kong, and playing an important role in Hong Kong’s construction land.
Resistance refers to factors that hinder urban expansion, including environment protection, cultural heritage protection, etc. Hong Kong has country parks and ecological green spaces accounting for about 73.3% of the entire territory. The awareness of ecological protection is relatively higher than that of inland China. The “Country Parks Ordinance” enacted in 1976 clearly prohibits any form of commercial development of country parks and continues to enforced in Hong Kong. The Hong Kong British Government established the Environmental Protection Department in 1981 to address environmental problems such as waste, sewage, and noise and light pollution in Hong Kong. To preserve the style of Victoria Harbour, the government was required to stop reclamation projects. The “Harbour Protection Association” was established in 1995. It aimed to protect and preserve the style of Victoria Harbour and asked the government to stop reclamation projects. The “Protection of the Harbour Ordinance” was passed in 1997, and a large number of ongoing reclamation projects in areas such as Tsuen Wan Bay, Kowloon Kok, and Qingzhou could not be carried out as scheduled [18]. Restricted by the abovementioned obstacles, the expansion rate of construction land in Hong Kong is currently extremely low, and expansion is relatively difficult.

5. Discussion

Based on the time frame of the CAS 1980–2020 dataset, this study innovatively extracts valid construction land data by using the 1972 historical map of Hong Kong, broadening the time frame of the study and exploring the evolution of construction land in Hong Kong from a longer time series. Through various quantitative indicators, reasonable analysis is discussed in terms of changes in the quantity of construction land, conversion of land types, changes in the spatial centre of gravity, and evolution of landscape patterns, which helps policymakers to grasp the earlier urban development and construction land situation. In terms of analytical depth, different from existing studies [47,48,49], this study deconstructs the driving mechanism of land for urban construction, combined with urban development policies and regional development plans at different stages of development in Hong Kong, visualising the abstract land use driving mechanism through concepts such as thrust, support, elasticity, and resistance. This will help us understand the driving mechanism of construction land in Hong Kong more deeply and provide policy makers with theoretical references for urban construction, which has certain theoretical and practical value. In general, the research fills a gap in the study of the construction land evolution in Hong Kong and provides a scientific basis for government departments to better achieve the planning objectives of Hong Kong: 2030+ and promote the sustainable development of Hong Kong. However, there are several shortcomings in this paper: as the research time frame could be extended, and the accuracy of data could be improved. Further thorough research will be carried out in the future to address the above issues.

6. Conclusions

The expansion rate of construction land in Hong Kong generally showed the characteristics of “rapid at first and then slowing down” from 1972 to 2020. The expansion stage was mainly from 1972 to 2010, with an area increased by 118.1 km2 and the increase rate remaining at 1.94 km2·a−1 and above; after 2010, the growth rate slowed down, and the rate remained at 0.17–0.26 km2·a−1.
In general, the sources of construction land transfer are mainly the three major land categories of agricultural land, marine land, and forest land. Due to the time frame of the study, the transferred construction land is mainly distributed spatially in the New Territories, i.e., Tuen Mun District, Yuen Long District, North District, and the Islands District.
The center of gravity of Hong Kong’s construction land showed a spatial characteristic of “slowly shifting to the northwest” during the study period, which is closely related to the polycentric urban structure shaped by the policies of the British Hong Kong government and the Hong Kong SAR government of China.
The TA and NP of Hong Kong’s construction land show a gradual growth trend during the study period, PD and LPI show a floating downward trend, SPILT shows a zigzag upward trend, and ENN_MN shows a steady declining trend, which indicates that the landscape connectivity of Hong Kong’s construction sites is steadily increasing with the gradual increase of fragmentation.
The thrust of the expansion of Hong Kong construction land comes mainly from demographic, economic, and transportation factors; the support comes mainly from the unique geographical location and the government’s policy guidance support; the elasticity comes mainly from reclamation projects; the resistance comes mainly from the environmental protection department, NGOs, and the restrictions of reclamation-related laws.

Author Contributions

Conceptualization, J.W. and Y.W.; methodology, Y.W.; software, Y.W.; validation, Y.W., J.W. and A.G.; formal analysis, Y.W.; investigation, J.W.; resources, A.G.; data curation, A.G.; writing—original draft preparation, Y.W.; writing—review and editing, J.W.; supervision, A.G.; project administration, A.G.; funding acquisition, J.W. and A.G. All authors have read and agreed to the published version of the manuscript.

Funding

This research was funded by the National Natural Science Foundation of China, grant numbers 51978329 and 51778364.

Institutional Review Board Statement

Not applicable.

Informed Consent Statement

Not applicable.

Data Availability Statement

The data presented in this study are available on request from the corresponding authors.

Conflicts of Interest

The authors declare no conflict of interest.

References

  1. Liu, T.; Cao, G. Progress in research on urban land expansion and its driving forces. Prog. Geogr. 2010, 29, 927–934. [Google Scholar]
  2. Yan, M.; Huang, J. A review of urban spatial expansion studies at home and abroad. Prog. Geogr. 2013, 32, 1039–1050. [Google Scholar]
  3. Liu, T.; Liu, H.; Qi, Y. Construction land expansion and cultivated land protection in urbanizing China: Insights from national land surveys, 1996–2006. Habitat Int. 2015, 46, 13–22. [Google Scholar] [CrossRef]
  4. Sun, P.; Xiu, C. Progress of research on urban spatial expansion in China. Areal Res. Dev. 2014, 33, 46–52. [Google Scholar]
  5. Li, L.; An, Y.; Deng, Z. Remote sensing dynamic monitoring and driving forces of built-up areas in Guiyang City 1973–2010. Mt. Res. 2014, 32, 30–37. [Google Scholar]
  6. Qian, J.; Peng, Y.; Luo, C.; Wu, C.; Du, Q. Urban land expansion and sustainable land use policy in Shenzhen: A case study of China’s rapid urbanization. Sustainability 2015, 8, 16. [Google Scholar] [CrossRef] [Green Version]
  7. Wei, L.; Zhang, Y.; LI, Q.; Song, J. A study of ecological spatial differentiation of China’s land based on standard deviation ellipses. Ecol. Econ. 2020, 36, 176–181. [Google Scholar]
  8. Li, Z.; Jiang, W.; Wang, W.; Lei, X.; Deng, Y. Exploring spatial-temporal change and gravity center movement of construction land in the Chang-Zhu-Tan urban agglomeration. J. Geogr. Sci. 2019, 29, 1363–1380. [Google Scholar] [CrossRef] [Green Version]
  9. Liu, X.; Li, X.; Chen, Y.M.; Qin, Y.; Li, S. Landscape sprawl index and its application in urban sprawl analysis. Acta Geogr. Sin. 2009, 64, 1430–1438. [Google Scholar]
  10. An, Q.; Li, X.; Lu, K. Spatial pattern and efficiency analysis of urban built-up area expansion in China (1990–2009). Econ. Geogr. 2012, 32, 37–45. [Google Scholar]
  11. Li, Z.; Luan, W.; Zhang, Z.; Su, M. Relationship between urban construction land expansion and population/economic growth in Liaoning Province, China. Land Use Policy 2020, 99, 105022. [Google Scholar] [CrossRef]
  12. Hu, P.; Li, F.; Hu, D.; Sun, X.; Liu, Y. Spatial and temporal characteristics of urban expansion in the Pearl River Delta urban agglomeration from 1980–2015. Acta Ecol. Sin. 2021, 41, 7063–7072. [Google Scholar]
  13. Zheng, L.; Deng, C.; Wang, Y. Analysis of spatial and temporal changes of urban expansion in the Central Plains urban agglomeration based on multi-source lighting data. J. Hunan Univ. Nat. Sci. 2021, 51, 401–411. [Google Scholar]
  14. Huang, T.; Luo, J.; Gao, Z.; Huang, F. Evolution of urban spatial pattern in Guangdong-Hong Kong-Macao Greater Bay Area based on DMSP-OLS and Liaojia-1 night-light remote sensing images. Bull. Surv. Mapp. 2021, 12, 10–15. [Google Scholar]
  15. Ye, Y.; Zhang, H.; Liu, K.; Wu, Q. Research on the influence of site factors on the expansion of construction land in the Pearl River Delta, China: By using GIS and remote sensing. Int. J. Appl. Earth Obs. 2013, 21, 366–373. [Google Scholar] [CrossRef]
  16. Pham, H.M.; Yamaguchi, Y. Urban growth and change analysis using remote sensing and spatial metrics from 1975 to 2003 for Hanoi, Vietnam. Int. J. Remote Sens. 2011, 32, 1901–1915. [Google Scholar] [CrossRef]
  17. Lu, H.; Wang, R.; Fan, J. Analysis of the spatial and temporal evolution of urban construction land expansion in Hangzhou. J. ZJ Univ. (Nat. Sci.) 2022, 49, 104–111. [Google Scholar]
  18. Cai, W.; Fangyuan, T. Spatiotemporal characteristics and driving forces of construction land expansion in Yangtze River economic belt, China. PLoS ONE 2020, 15, e0227299. [Google Scholar]
  19. Zhao, X.; Zhang, Z.; Wang, X.; Zuo, L.; Liu, B.; Yi, L.; Xu, J.; Wen, Q. Analysis of Chinese cultivated land′ s spatial-temporal changes and causes in recent 30 years. Trans. Chin. Soc. Agric. Eng. 2014, 30, 1–11. [Google Scholar]
  20. Li, B.; Zou, H. Abercrombie and post-war urban planning in Hong Kong. Urban Plan. Forum 2012, 1, 108–113. [Google Scholar]
  21. Shi, S. Urban Planning and Development of Hong Kong. Shanghai Urban Plan. Rev. 2012, 4, 113–120. [Google Scholar]
  22. Pan, G. Urban Planning under the Market Economy of Hong Kong. City Plan. Rev. 1994, 18, 9–12. [Google Scholar]
  23. Ling, X. Compact City: An Analysis of Hong Kong’s High-Density Urban Space Development Strategy. Planners 2014, 30, 100–105. [Google Scholar]
  24. Qin, P.; Chen, J. Comparative study on intensive use of land between Hong Kong and Shenzhen. Geogr. Res. 2011, 30, 1129–1136. [Google Scholar]
  25. Liang, J.; Chen, J.; Tong, D.; Li, X. Planning control over rural land transformation in Hong Kong: A remote sensing analysis of spatio-temporal land use change patterns. Land Use Policy 2022, 119, 106–159. [Google Scholar] [CrossRef]
  26. Ye, J. Hong Kong’s Economic Structural Transformation and Land Use Planning. Acta Geogr. Sin. 1997, S1, 39–51. [Google Scholar]
  27. Zheng, J.; Liu, H. Integrated development of rail transport and land resources in Hong Kong. China Railw. Sci. 2002, 5, 3–7. [Google Scholar]
  28. Zhang, L.; Cui, M.; Qing, A. Evaluation of the Accessibility of High-Density Urban Open Space from a Human-Centered Perspective—A Case Study of Hong Kong. Landscape Archit. 2021, 28, 34–39. [Google Scholar]
  29. Tan, B. Hong Kong Slow Traffic System and Pedestrian Environment Planning. Landscape Archit. 2011, 1, 78–81. [Google Scholar]
  30. Liu, J.; Kuang, W.; Zhang, Z.; Xu, X.; Qin, Y. Basic characteristics and spatial patterns of land use change in China since the late 1980s. Acta Geogr. Sin. 2014, 69, 3–14. [Google Scholar]
  31. Liu, J.; Zhang, Z.; Xu, X.; Kuang, W.; Zhou, W. Spatial patterns and driving forces of land use change in China at the beginning of the 21st century. Acta Geogr. Sin. 2009, 64, 1411–1420. [Google Scholar]
  32. Zhu, H.; Li, X. A discussion on the regional land-use change index model approach. Acta Geogr. Sin. 2003, 5, 643–650. [Google Scholar]
  33. Liu, J.; Buheaosier. A study on the spatial and temporal characteristics of modern processes of land use change in China based on satellite remote sensing data. Quat. Sci. 2000, 3, 229–239. [Google Scholar]
  34. Fischer, M.M.; Getis, A. Handbook of Applied Spatial Analysis: Software Tools, Methods and Applications; Springer: Berlin, Germany, 2010. [Google Scholar]
  35. Wong, D. Several fundamentals in implementing spatial statistics in GIS: Using centrographic measures as examples. Geogr. Inform. Sci. 1999, 5, 163–173. [Google Scholar]
  36. Lefever, D. Measuring geographic concentration by means of the standard deviational ellipse. Am. J. Sociol. 1926, 32, 88–94. [Google Scholar] [CrossRef]
  37. Zhao, Z. Research progress on overall statistics of geographic spatial distribution. Prog. Geogr. 2009, 1, 1–8. [Google Scholar]
  38. Warntz, W.; Neft, D. Contributions to a statistical methodology for areal distribution. J. Geogr. Syst. 2011, 13, 127–145. [Google Scholar] [CrossRef]
  39. Robert, S. The standard deviational ellipse: An updated tool for spatial description. Geogr. Ann. B 1971, 53, 28–39. [Google Scholar]
  40. Marlies, V.; Carolien, B.; Davy, J.; Koen, V.; Geert, W. Measuring dissimilarity of geographically dispersed space-time paths. Transport 2011, 38, 65–79. [Google Scholar]
  41. O′Loughlin, J.; Witmer, F. The localized geographies of violence in the North Caucasus of Russia, 1999–2007. Ann. Assoc. Am. Geogr. 2010, 101, 178–201. [Google Scholar] [CrossRef]
  42. Yue, T.; Fan, D.; Liu, J. Changes of major terrestrial ecosystems in China since 1960. Glob. Planet Chang. 2005, 48, 287–302. [Google Scholar] [CrossRef]
  43. Wu, J.G. Landscape Ecology: Patterns, Processes, Scales and Hierarchies; Higher Education Press: Beijing, China, 2007; pp. 107–115. [Google Scholar]
  44. He, P.R. Cheng Zhuan Li Xin: A History of Urban Planning Development in Hong Kong (1841–2015); Zhonghua Book Company: Hong Kong, China, 2016. [Google Scholar]
  45. Airport Authority of Hong Kong. Hong Kong International Airport Master Plan 2030. Available online: https://www.legco.gov.hk/yr10-11/english/panels/edev/papers/edev0719cb1-2985-1-e.pdf (accessed on 3 December 2022).
  46. Geng, T.; Mao, Y.; Li, J.; Chen, H. Spatial and temporal characteristics and driving mechanisms of Xi’an’s urban expansion. Econ. Geogr. 2019, 39, 62–70. [Google Scholar]
  47. Meng, L.; Si, W. The Driving Mechanism of Urban Land Expansion from 2005 to 2018, The Case of Yangzhou, China. Int. J. Environ. Res. Public Health 2022, 19, 15821. [Google Scholar] [CrossRef] [PubMed]
  48. Zhou, G.; Zhang, J.; Li, C.; Liu, Y. Spatial Pattern of Functional Urban Land Conversion and Expansion under Rapid Urbanization: A Case Study of Changchun, China. Land 2022, 11, 119. [Google Scholar] [CrossRef]
  49. Lu, S. Characteristics and Driving Mechanism of Urban Space Expansion in Urumqi. Geomat. Inf. Sci. Wuhan Univ. 2022, 47, 1025–1034. [Google Scholar]
Figure 1. Schematic diagram of the study area (original image source: Survey and Mapping Office, Lands Department of the Hong Kong Special Administrative Region).
Applsci 13 02565 g001
Figure 2. Line chart of changes in the area of construction land in Hong Kong.
Applsci 13 02565 g002
Figure 3. Line chart of the rate of change in the area of construction land in Hong Kong.
Applsci 13 02565 g003
Figure 4. Line chart of expansion intensity of construction land in Hong Kong.
Applsci 13 02565 g004
Figure 5. Evolution map of the centre of gravity of construction land in Hong Kong from 1972 to 2020.
Applsci 13 02565 g005
Figure 6. Line chart of Hong Kong’s GDP, 1966–2020 (Source: World Bank, IMF).
Applsci 13 02565 g006
Figure 7. Line chart of Hong Kong Population Size, 1966–2020 (Source: Hong Kong Annual Digest of Statistics).
Applsci 13 02565 g007
Table 1. List of data parameters.
DataYear(s)Scale and Spatial ResolutionSources
Geological map of Hong Kong, Kowloon, and the New Territories19721:50,000Hong Kong Government
China national remote sensing monitoring data of the land-use/land-cover (LULC)1980, 1990, 1995, 2000, 2005, 2010, 2015, 202030 mChinese Academy of Sciences Resource and Environmental Science and Data Centre
Vector data of Hong Kong’s administrative divisions, etc.2021China National Centre for Basic Geographic Information
Hong Kong Statistical Yearbook1972–2021Hong Kong Government
Table 2. List of landscape pattern indices selected of this study.
Index NameAbbreviationUnitEcological Meaning
Total landscape areaTAhm2TA indicates the total area of patches or landscape.
Number of patchesNP#NP indicates the total number of patches or landscape.
Patch densityPD#/100 hm2PD indicates the number of a given patch type per unit area.
Largest patch indexLPI%The LPI is a direct reflection of the dominant type of landscape and a direct reflection of changes in the intensity and frequency of human activity disturbing land use and ecological change in the landscape.
Spiltting indexSPILT--SPILT indicates the degree of fragmentation of patches in the area; the higher the SPILT, the higher the degree of landscape fragmentation.
Mean Euclidean nearest neighbour distanceENN-MNmENN_MN indicates the connectivity of the landscape; the smaller the ENN_MN value, the greater the connectivity of the landscape.
Table 3. Statistical table of reclamation projects in Hong Kong, 1980–1990 (incomplete statistics).
Reclamation ProjectYearRegionArea (ha)
Siu Chai Wan Reclamation Project1980Eastern District4
Sai Wan Ho Reclamation Project1980Eastern District1
Mui Wo Development Plan1980Islands District11.8
Tamar East Dock Works1981Wanchai District1.5
1981Kwun Tong District0.6
1982Eastern District6.1
Western Reclamation Mission1983Central and Western District6
Mass Transit Railway Island Line Project1983Eastern District6.1
North East Coast Reclamation on Hong Kong Island1984Eastern District22
Ap Lei Chau Reclamation Project1985Southern District3
Tai Po Industrial Estate Reclamation Project1985Tai Po District48.5
19852.3
Northshore Reclamation at Stonecutters Island1985Kwai Tsing District8.8
Chai Wan Reclamation1985Eastern District5
Cheung Sha Wan Reclamation Project1985Sham Shui Po District16.5
Quarry Bay Reclamation1986Eastern District18.5
Steelline Bay Development Plan1989Southern District20
Table 4. Land Use Transformation Matrix, 1980–1990 (km2).
Land Use TypeCultivated LandForest LandGrasslandWater AreaConstruction LandUnused LandSea Area
Cultivated land66.7630.00180013.2700
Forest land0.0036642.260.001803.0600
Grassland00.0054166.770000
Water area00042.863.9500
Construction land0000148.4200
Unused land000000.10260
Sea area00.005400.88927.20022.73
Table 5. Land use conversion matrix, 1990–2000 (km2).
Land Use TypeCultivated LandForest LandGrasslandWater AreaConstruction LandUnused LandSea Area
Cultivated land62.330.0054006.4400
Forest land0.0045637.68007.75100
Grassland02.98163.790000
Water area00.05042.421.2700
Construction land0.00451.359900175.0600
Unused land000000.100
Sea area000017.48015.25
Table 6. Land use conversion matrix, 2000–2010 (km2).
Land Use TypeCultivated LandForest LandGrasslandWater AreaConstruction LandUnused LandSea Area
Cultivated land39.912.640.191.303221.1400
Forest land2.38610.847.222.6118.1600
Grassland0.2715.16146.200.10621.2800
Water area1.062.280.0837.930.8800
Construction land3.198.389.483.09183.8600
Unused land00.00630.0045000.090
Sea area00.0315008.8200
Table 7. Land use conversion matrix, 2010–2020 (km2).
Land Use TypeCultivated LandForest LandGrasslandWater AreaConstruction LandUnused LandSea Area
Cultivated land42.531.430.140.142.3100.01
Forest land1.44615.576.651.107.860.00360.04
Grassland0.115.72147.150.040.390.00450
Water area0.161.070.0843.670.4000
Construction land3.233.512.200.71224.3600.13
Unused land00.00180000.100
Sea area00001.5700
Table 8. List of Landscape Pattern Indices of construction Land in Hong Kong in the Study Years.
YearTANPPDLPISPLITENN_MN
197211,8201210.9937.328.62806.32
198014,8641360.9134.397.14716.68
199017,6411480.8431.627.25579.18
199519,8321520.5930.205.82528.34
200019,2831580.8232.986.97516.67
200521,8531630.7529.208.2508.21
201023,4141470.6327.1810.08500.93
201523,5451460.6227.009.76499.40
202023,6321020.4724.4810.64521.40
Disclaimer/Publisher’s Note: The statements, opinions and data contained in all publications are solely those of the individual author(s) and contributor(s) and not of MDPI and/or the editor(s). MDPI and/or the editor(s) disclaim responsibility for any injury to people or property resulting from any ideas, methods, instructions or products referred to in the content.

