Article

Thermal-Hydraulic-Mechanical Coupling Simulation of CO2 Enhanced Coalbed Methane Recovery with Regards to Low-Rank but Relatively Shallow Coal Seams

1
Faculty of Infrastructure Engineering, Dalian University of Technology, Dalian 116024, China
2
State Key Laboratory of Geomechanics and Geotechnical Engineering, Institute of Rock and Soil Mechanics, Chinese Academy of Sciences, Wuhan 430071, China
3
Key Laboratory of Deep Earth Science and Engineering, Sichuan University, Chengdu 610017, China
*
Authors to whom correspondence should be addressed.
Appl. Sci. 2023, 13(4), 2592; https://doi.org/10.3390/app13042592
Submission received: 15 January 2023 / Revised: 13 February 2023 / Accepted: 14 February 2023 / Published: 17 February 2023
(This article belongs to the Special Issue Geothermal System: Recent Advances and Future Perspectives)

Abstract

:
CO 2 injection technology into coal seams to enhance CH 4 recovery (CO 2 -ECBM), therefore presenting the dual benefit of greenhouse gas emission reduction and clean fossil energy development. In order to gaze into the features of CO 2 injection’s influence on reservoir pressure and permeability, the Thermal-Hydraulic-Mechanical coupling mechanism of CO 2 injection into the coal seam is considered for investigation. The competitive adsorption, diffusion, and seepage flowing of CO 2 and CH 4 as well as the dynamic evolution of fracture porosity of coal seams are considered. Fluid physical parameters are obtained by the fitting equation using MATLAB to call EOS software Refprop. Based on the Canadian CO 2 -ECBM project CSEMP, the numerical simulation targeting shallow low-rank coal is carried out, and the finite element method is used in the software COMSOL Multiphysics. Firstly, the direct recovery (CBM) and CO 2 -ECBM are compared, and it is confirmed that the injection of CO 2 has a significant improvement effect on methane production. Secondly, the influence of injection pressure and temperature is discussed. Increasing the injection pressure can increase the pressure difference in the reservoir in a short time, so as to improve the CH 4 production and CO 2 storage. However, the increase in gas injection pressure will also lead to the rapid attenuation of near-well reservoir permeability, resulting in the weakening of injection capacity. Also, when the injection temperature increases, the CO 2 concentration is relatively reduced, and the replacement effect on CH 4 is weakened, resulting in a slight decrease in CBM production and CO 2 storage.

1. Introduction

Since the industrial revolution, human activity has resulted in upraising the concentrations of greenhouse gases, causing an anthropogenic influence on global warming and climate change. If no reduction measures are taken, the global atmospheric temperature will rise by more than 1.5 °C and 2 °C by 2030 and 2050, respectively, according to the global average annual rate of anthropogenic CO 2 emissions from 2011 to 2020 (38.9 billion tons CO 2 /year) [1]. Environmental repercussions of global climate change brought on by rising human-caused emissions of heat-trapping greenhouse gases are already ubiquitous, such as accelerated sea level rise, sea ice loss, melting glaciers and ice sheets, more intense heat waves, and plant and animal geographic ranges shifts. Human-caused global climate change is irreversible and will worsen in the coming decades [2]. There is almost a universal agreement that the world cannot sit back and wait for definitive answers on this issue, and that preventive and mitigating measures must be implemented concurrently. CO 2 is recognized as by far the most significant greenhouse gas due to its relative abundance when compared to the other greenhouse gases, accounting for around 64% of the heightened “greenhouse effect”. Therefore, reducing CO 2 emissions to the atmosphere is a significant challenge in mitigating anthropogenic effects on climate change.
Currently, heavy energy-consuming sectors are moving to developing nations [3], which results in the rising phase of CO 2 emissions in developing countries. The CO 2 emission reduction at the expense of reducing the amount of industrial activity harms economic development, generating two competing demands to keep both economic growth and substantial CO 2 emission reduction for developing countries, especially for China, the major developing country in the world [4]. Carbon Capture, Utilization and Storage (CCUS), as one pathway to carbon neutrality goals, can meet these two competing needs. Nowadays, more than 100 countries have proposed corresponding carbon neutrality programs. According to the prediction of existing research, fossil energy will still play an important role by 2050, and Carbon Capture, Utilization, and Storage (CCUS) is the only technical choice to achieve large-scale zero-emission utilization of fossil energy [5].
CO 2 enhanced coalbed methane recovery (CO 2 -ECBM) is an important technical approach of CCUS, which has the dual benefits of greenhouse gas emission reduction and clean fossil energy recovery [6]. Within the coal matrix, the adsorption capacity of CO 2 is higher than that of CH 4 so that CO 2 can replace most of the originally adsorbed CH 4 . Thus, the latter is desorbed and swept out. Simultaneously, along the run-through cleats and cracks in coal, CO 2 injection can maintain reservoir energy by improved pressure gradient so that the partial pressure of CH 4 is relatively compensated. CO 2 storage mechanism and storage capacity, and the effect of increasing production of CH 4 are the key technical problems of CO 2 -ECBM [7].
At present, CO 2 -ECBM technology is not very mature, and it is still in the pilot test or experimental mining stage in the world, and has not achieved large-scale commercial mining appraisal. Table 1 illustrates the existing CO 2 -ECBM field experiments and their details. It can be seen from Table 1 that the permeability of coal seams in the United States, Canada and other countries are better, which is one to two orders of magnitude higher than that of Chinese coal. In addition, due to the good adsorption of high-rank coal, most of the experiments are based on middle and high-rank coal seams, and there are few experiments on shallow low-rank coal. Among them, the CSEMP (CO 2 Storage and Enhanced Methane Production) project on which this study is based may be a relatively rare shallow low-rank coal CO 2 injection test project. From the Langmuir adsorption curve, we have known that the CO 2 adsorption capacity of low-rank coal is very small when the pressure is low, and when the pressure increases, the adsorption capacity increases slowly, but the adsorption capacity of high-rank coal is very large when the pressure is low, and the adsorption capacity increases greatly with the increase of pressure. However, it is worth mentioning that the CO 2 /CH 4 adsorption ratio of low-rank coal is much larger than that of high-rank coal, which highlights the superiority of CO 2 replacement of CH 4 in low-rank coal.
The gas migration in the CO 2 -ECBM process is a very complex process, including the competitive adsorption, diffusion, seepage, coal deformation and temperature exchange of coalbed methane and injected CO 2 gas. Based on the laboratory scale, previous scholars have carried out many studies on the adsorption characteristics of CO 2 and CH 4 , the mechanism of gas flow in coal as well as the replacement efficiency and utilization rate of CO 2 by coal. Barbara Dutka [8] carried out an experimental research into the sorption properties of coal briquettes under the various states of stress, proved that the existence of a relation between the stress state, sorption capacity and volumetric deformation of coal. Sun et al. [9] carried out an experimental study on the displacement of methane by CO 2 using eight bituminous and anthracite coals, to evaluate the displacement efficiency and utilization ratio of CO 2 . Zheng et al. [10] explored the characterizations of methane desorption and CO 2 displacement under different CO 2 injection pressures or different experimental temperatures using the self-designed NMR-based CO 2 displace methane equipment. Xu et al. [11] proposed a new multi-scale dynamic diffusion-percolation model to compare the old and new model analysis, as well as carefully studying the mechanism of gas flow in coal. Chen et al. [12] studied the the influence of coal water content and gas injection pressure on CH 4 replacement rate and CO 2 injection ratio based on the adsorption characteristics of coal seam gas injection.
In addition to conducting physical experiments, many scholars have conducted in-depth research on CO 2 -ECBM using numerical simulation. V. Vishal et al. [25] carried out research work to understand the technical feasibility of CO 2 driven enhanced CBM recovery in Indian coals using a commercial reservoir simulator, COMET. Hema J. Siriwardane et al. [26] performed a historical fit to the Pump Canyon ECBM field test in the United States using PSU-COALCOMP, where the anisotropy of the reservoir was considered in the model, and the study showed that a more accurate set of parameters could be determined using numerical simulations. The gas migration in the CO 2 -ECBM is a process of multi-phase fluid and multi-physical field coupling.
In recent years, scholars have also done some work on CO 2 -ECBM multi-physics coupling. The effect of the numerical case is different based on the difference in coal reservoir structure and physical properties. Wu et al. [27] established a gas-solid coupling model to study the migration of binary gases in coal reservoirs, and clarified the distribution of coalbed methane concentration in CO 2 -ECBM, but did not consider gas diffusion and competitive adsorption of binary gases. Wang et al. [28] carried out large-scale laboratory tests and deduced the seepage diffusion control equation, but did not consider the deformation of coal. Fang et al. [29,30] established the coupling equations of the diffusion–adsorption–seepage–heat transfer fields of gas. The displacement processes under different pressures and temperatures are simulated by COMSOL. Subsequently, the stress field model and seepage field model were derived, and the numerical simulation of permeability evolution was carried out in COMSOL software. Hemant Kumar et al. [31] established a coupled finite element (FE) model of binary gas flow, diffusion, competitive sorption and permeability change to explore the effect of CO 2 injection on net recovery, permeability evolution and injectivity in uniform and homogeneously permeable reservoir. Wang et al. [32] built a dual porosity/permeability model through accurately expressing the volumetric strain of matrix and fracture which aims to reveal the reservoir permeability evolution during the process of CO 2 -enhanced coalbed methane (CO 2 -ECBM) recovery. Bai et al. [33] established a fluid-solid coupling model considering gas-water phases and Klinkenberg effect of CO 2 injection into coal seam for enhancement of gas drainage, parameters of gas pressure, gas content and gas extraction rate after coal seam CO 2 injection were analyzed by using COMSOL software and applied in engineering test. Erlei Su et al. [34] established an improved fully coupled gas migration model for CBM extraction. The permeability rebound and recovery times as well as rebound values are proposed to accurately quantify permeability evolution during CBM extraction. Also, the evolution of coal seam permeability under different CO 2 injection method is discussed. Most of the above scholars only consider a single or several physical fields in their research. In addition, many scholars [29,32,35] have studied the Thermal-Hydraulic-Mechanical coupling of CO 2 -ECBM, but most of these studies are based on deep unminable coal seams. At present, there are few numerical simulation studies on the Thermal-Hydraulic-Mechanical multi-physical coupling of shallow low-rank coal. The buried depth of the deep unminable coal seam is large. Under geological conditions of high temperature and high pressure, CO 2 is likely to exist in the supercritical state, so the change in its physical parameters may not be obvious. Therefore, previous studies regard fluid physical parameters as constants, which is barely acceptable. However, in the temperature and pressure range of shallow low-rank coal, the physical parameters of CO 2 are prone to mutation. Therefore, it is very inadvisable to regard the physical parameters as constants.
This study is based on the Canadian CSEMP shallow low-rank coal project to carry out CO 2 -ECBM numerical simulation research. The porosity-permeability evolution model is substituted into the fluid migration equation, combined with the reservoir deformation equation, the energy conservation equations and the fluid physical parameter evolution equation. Then, a set of coupled partial differential equations is derived. The COMSOL Multiphysics simulation software is used to solve the finite element method. Firstly, this study compared CBM (directly mining) with CO 2 -ECBM, affirms the advantages of CO 2 -ECBM. The evolution of reservoir pressure, permeability and adsorbed gas content in CO 2 -ECBM and CBM engineering are analyzed. Subsequently, the effects of different injection pressures and temperatures on CO 2 -ECBM were analyzed. The study has certain guiding significance for the preliminary design of the follow-up CO 2 -ECBM project based on shallow low-rank coal.

2. Theory of Modelling

2.1. Fundamental Assumption

The CO 2 -ECBM process in CH 4 -bearing coal is the fully coupled process of the Thermal-Hydraulic-Mechanical fields, which involves the competitive adsorption of CH 4 and CO 2 , the deformation of the coal reservoir, and the heat exchange of the gas and coal skeleton. The following assumptions are required for establishing these fully coupled models: (1) Coal is a homogeneous isotropic body; (2) CH 4 is saturated in the reservoir; (3) The seepage and diffusion of CH 4 and CO 2 conform to Darcy’s law and Fick’s law, respectively; (4) The deformation of the coal reservoir is infinitesimal deformation.

2.2. Governing Model of the Hydraulic Field

The mass conservation equation of CO 2 and CH 4 gas seepage and diffusion in coal seam is [36]:
m g t + · ρ i q + · q d = 0
where, m g is the gas mass in per unit volume of coal, kg/m 3 ; ρ i is the gas density, kg/m 3 ; q is seepage velocity, m/s; i = 1, CH 4 , i = 2, CO 2 .
The seepage of gas in coal seams obeys Darcy’s law:
q = k μ i P i
Gas diffusion in coal seams obeys Fick’s first law:
q d = D i · c i
Thus, the following can be obtained:
m g t · k μ i P i · ρ i · D i c i = Q i
where, D i is the diffusion coefficient, m 2 /s; c i is the diffusion mass concentration of gas, kg/m 3 ; Gas mass per unit volume of coal consists of free gas and adsorbed gas [37]:
m g = m f + m s = φ ρ i + ρ c ρ i a i b i P i 1 + b 1 P 1 + b 2 P 2
where, ρ c is the density of coal, kg/m 3 ; b i is the Langmuir adsorption constant of gas, MPa 1 ; a i is the langmuir volume constant of gas, m 3 /kg.
Thus, available:
φ ρ i + ρ c ρ i a i b i P i 1 + b 1 P 1 + b 2 P 2 t · k μ i P i · ρ i · D i ρ i M i = Q i
where, k is permeability, m 2 ; μ i is the dynamic viscosity coefficient of gas, Pa·s; φ is porosity, zero dimension;

2.3. Governing Model of the Mechanical Field

The deformation of coal is formed under the joint actions of ground stress, gas pressure, gas adsorption/desorption and thermal stress, and the constitutive equation of the mechanical field can be deduced based on the elastic theory of porous media, which is as follows [38]:
ε i j = 1 2 G σ i j 1 6 G 1 9 K σ h h δ i j α 3 K P 1 P 2 δ i j + ε s 3 δ i j + α s Δ T 3 δ i j
where, ε i j is the strain tensor component, m; G is the shear modulus, MPa; σ i j is a component of the stress tensor; σ h h is the normal stress component; δ i j is Kronecker symbol; α is Biot’s coefficient.
Equation (7) is the equilibrium equation characterizing the spatial equilibrium state of coal reservoir, and the strain component and displacement component satisfy Equation (8) [39]
σ i j , j + F i = 0 σ i j = 1 2 u i j + u j i
Based on the above equations, the Navier-Stokes equations which can characterize the stress field of coal reservoir can be derived:
G u i , j j + G 1 2 v u j , j i + α P 1 , i + α P 2 , i K ε s , i + F i = 0
where, v, Poisson ratio; K s is the bulk modulus of coal matrix, MPa; K is the bulk modulus of coal, MPa; ε s is volume strain caused by gas adsorption desorption, ε s = a 1 b 1 P 1 + a 2 b 2 P 2 1 + b 1 P 1 + b 2 P 2 .

2.4. Governing Model of the Thermal Field

According to the law of conservation of energy and Fourier’s law, the energy conservation equations of skeleton and gas can be obtained [40].
t ρ C p e f f + η e f f T · λ e f f T + K α T T ε s t + i = 1 2 q s t i ρ s ρ s i M i ε v t = 0
where, ( ρ C p ) e f f , is the effective heat capacity, J/m 3 ·K, η e f f , is the effective convective heat transfer coefficient, J/m 2 ·s, λ e f f , is the effective thermal conductivity, W/(m·K):
ρ C p eff = ( 1 φ ) ρ s C s + φ M 1 P 1 R T C g 1 + M 2 P 2 R T C g 2
η eff = k μ 1 P 1 ρ g 1 C g 1 k μ 2 P 2 ρ g 2 C g 2
λ eff = ( 1 φ ) λ s + φ λ g 1 + λ g 2
where, C g 1 , C g 2 is the specific heat capacity of CH 4 , CO 2 , J/kg·K; λ g 1 , λ g 2 is the thermal conductivity of CH 4 and CO 2 , W/(m·K).

2.5. Permeability Evolution Equation

Based on gas pressure, temperature and volume change caused by adsorption and desorption of coal matrix, porosity evolution formula can be derived [41,42]:
φ = V p V = 1 1 φ 0 1 + ε v 1 + Δ V s V s 0
where, V p is the pore volume of coal, m 3 ; V is the total volume of coal, m 3 ; φ 0 is the initial porosity of coal seam; δ V s is the volume change of coal skeleton, m 3 ; V s 0 is the initial skeleton volume of coal body, m 3
Δ V s V s 0 = α K s Δ P 1 + Δ P 2 + Δ ε s + α s Δ T
The following can be obtained:
φ = V p V = 1 1 φ 0 1 + ε v 1 α K s Δ P 1 + Δ P 2 + Δ ε s + α s Δ T
A dynamic model of coal seam permeability can be derived by using the cubic theorem between permeability and porosity [43]:
k = k 0 1 φ 0 1 φ 0 φ 0 1 + ε v 1 α K s Δ P 1 + Δ P 2 + Δ ε s + α s Δ T 3

2.6. Physical Parameters

The relevant thermal physical parameters change with temperature and pressure. This study is based on shallow low-rank coal with a buried depth of 450 m, which is relatively shallow. Therefore, the temperature range is 280–310 K and the pressure is 0–10 MPa. Refprop software has been used for physical parameters evaluation (Figure 1 and Figure 2). It can be seen that all the thermal physical parameters change nonlinearly with temperature and pressure. Among them, the physical parameters of CO 2 show a sudden change trend under certain temperatures and pressure. Therefore, it is very unreasonable to regard the thermal physical parameters as constants as previous studies. This paper uses Matlab to call Refprop software, then uses polynomial function fitting in Matlab. It is worth mentioning that the Refprop software is based on the most accurate pure fluid and mixture models at present. It implements three models for the thermodynamic properties of pure fluids: equations of state explicit in Helmholtz energy, the modified Benedict-Webb-Rubin equation of state, and an extended corresponding states (ECS) model [44]. For CO 2 and CH 4 , high accuracy Helmholtz energy equations of state is used.
The relationship between density, specific heat capacity, thermal conductivity, dynamic viscosity and pressure/temperature is fitted as follows. These equations are used for numerical solutions.
For CH 4 : T [ 280 , 310 ] C P [ 0 , 10 ] MPa
ρ 1 = p 00 + p 10 × P 1 + p 01 × T + p 20 × P 1 2 + p 11 × P 1 × T + p 30 × P 1 3 + p 21 × P 1 2 × T
C g 1 = p 00 + p 10 × P 1 + p 01 × T + p 20 × P 1 2 + p 11 × P 1 × T + p 30 × P 1 2 + p 21 × P 1 2 × T
λ g 1 = p 00 + p 10 × P 1 + p 01 × T + p 20 × P 1 2 + p 11 × P 1 × T + p 30 × P 1 3 + p 21 × P 1 2 × T
μ 1 = p 00 + p 10 × P 1 + p 01 × T + p 20 × P 1 2 + p 11 × T × P 1
For CO 2 : T [ 280 , 310 ] C P [ 0 , 10 ] MPa
ρ 2 = p 00 + p 10 × P 2 + p 20 × T + p 20 × P 2 × T
C g 2 = p 00 + p 10 × P 2 + p 01 × T + p 20 × P 2 2 + p 11 × P 2 × T + p 30 × P 2 3 + p 21 × P 2 2 × T
λ g 2 = p 00 + p 10 × P 2 + p 01 × T + p 20 × P 2 2 + p 11 × P 2 × T + p 30 × P 2 3 + p 21 × P 2 2 × T
μ 2 = p 00 + p 10 × P 2 + p 01 × T + p 20 × P 2 2 + p 11 × T × P 2 + p 30 × P 2 3 + p 21 × P 2 2 × T
where, T is temperature, K; P i is pressure, Pa; μ i is the dynamic viscosity, Pa·s; C g i is the specific heat capacity, J/(kg·K); ρ i is the density, kg/m 3 ; λ g i is the thermal conductivity, W/(m·K); i = 1, CH 4 , i = 2, CO 2 . Table 2 and Table 3 list the corresponding coefficients in the equation.

2.7. Cross Coupling of the Thermal-Hydraulic-Mechanical Fields

Cross coupling among CO 2 -ECBM is expressed as:
φ R T P i M i + ρ c ρ i a i b i P i 1 + b 1 P 1 + b 2 P 2 t · k μ i P i · ρ i φ R T · D i P i = Q i G u i , j + G 1 2 v u j , j i α P 1 , i α P 2 , i K ε s , i + F i = 0 t ρ C p e f f + η e f f T · λ e f f T + K α T T ε s t + i = 1 2 q s t i ρ s ρ s i M i ε v t = 0 k = k 0 1 φ 0 1 φ 0 φ 0 1 + ε v 1 α K s Δ P 1 + Δ P 2 + Δ ε s 3
Cross coupling among CBM is expressed as:
φ R T P 1 M 1 + ρ c ρ 1 a 1 b 1 P 1 1 + b 1 P 1 t · k μ 1 P 1 · ρ 1 φ R T · D i P 1 = Q 1 G u i , j j + G 1 2 v u j , j i α P 1 , i K ε s , i + F i = 0 t ρ C p e f f + η e f f T · λ e f f T + K α T T ε s t + i = 1 2 q s t 1 ρ s ρ s 1 M 1 ε v t = 0 k = k 0 1 φ 0 1 φ 0 φ 0 1 + ε v 1 α K s Δ P 1 + Δ P 2 + Δ ε s 3
In summary, a fully coupled temperature-seepage-diffusion-deformation model for CO 2 -ECBM and CBM considering the variation of physical parameters is established in Figure 3. The thermal stress caused by the change of coal seam temperature affects the stress field of the coal seam skeleton. The heat generated by the energy dissipation in the coal seam skeleton has an impact on the coal seam temperature; The temperature change causes the gas pressure change to affect the gas; the thermal convection between the gas and coal seam skeleton affects the temperature of the coal seam. The porosity change caused by coal seam deformation affects gas flow. Gas pressure change causes coal seam deformation.
In this study, based on COMSOL Multiphysics software, the established mathematical model is solved by full physical field coupling of the finite element method.

2.8. Model Validation

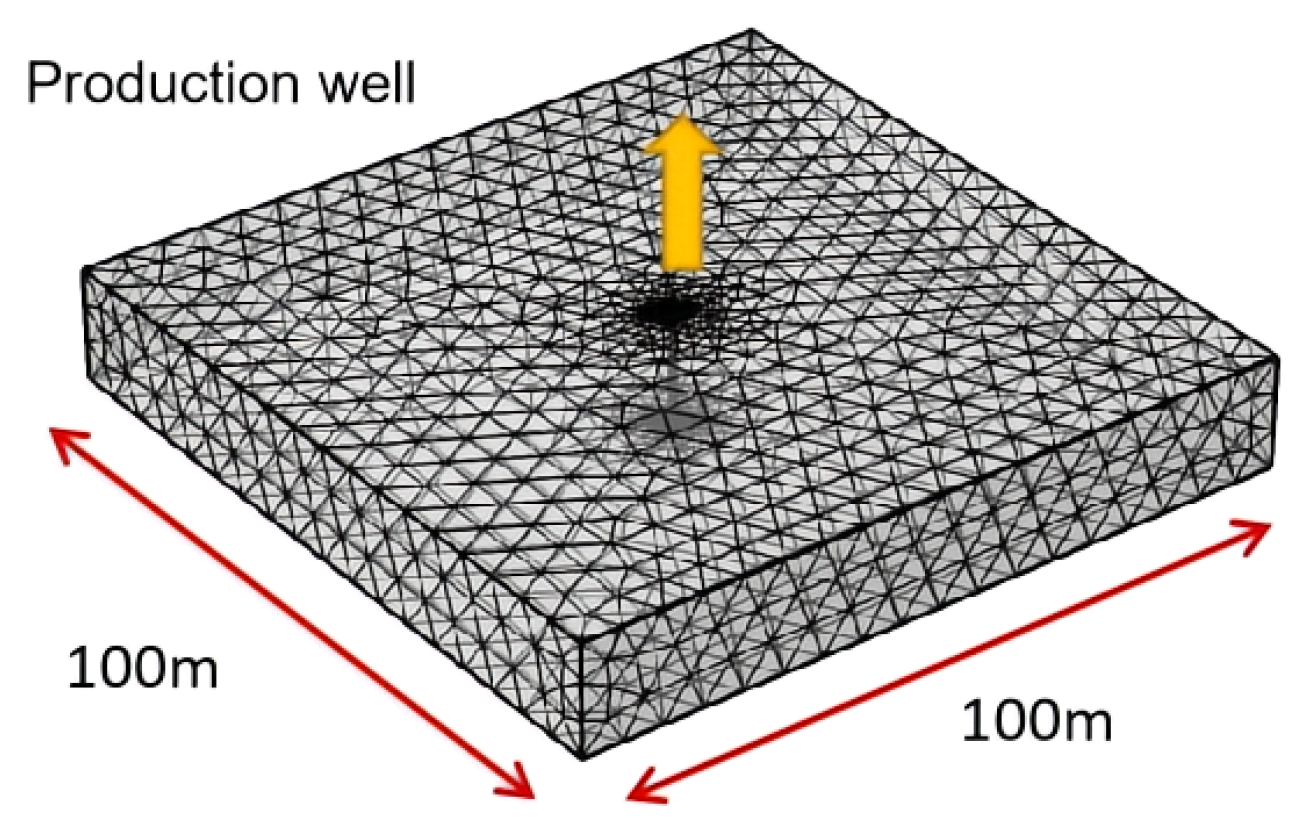
The Canadian CSEMP project [45] is a rare approach CO 2 -ECBM micro-test project for shallow low-rank coal that has undergone multiple productions and multi-component injection processes. The test site is located near Buck Lake in Alder Plain, Canada. The test site consists of Wells 12-28, Well 7-28 and Enerplus Pembina 102/7-28-46-7 W5M (Well Injector). In this paper, based on the two-year initial production of well 12-28, a three-dimensional model is established to simulate the 100*100 m area around well 12-28. The verification model is shown below Figure 4:
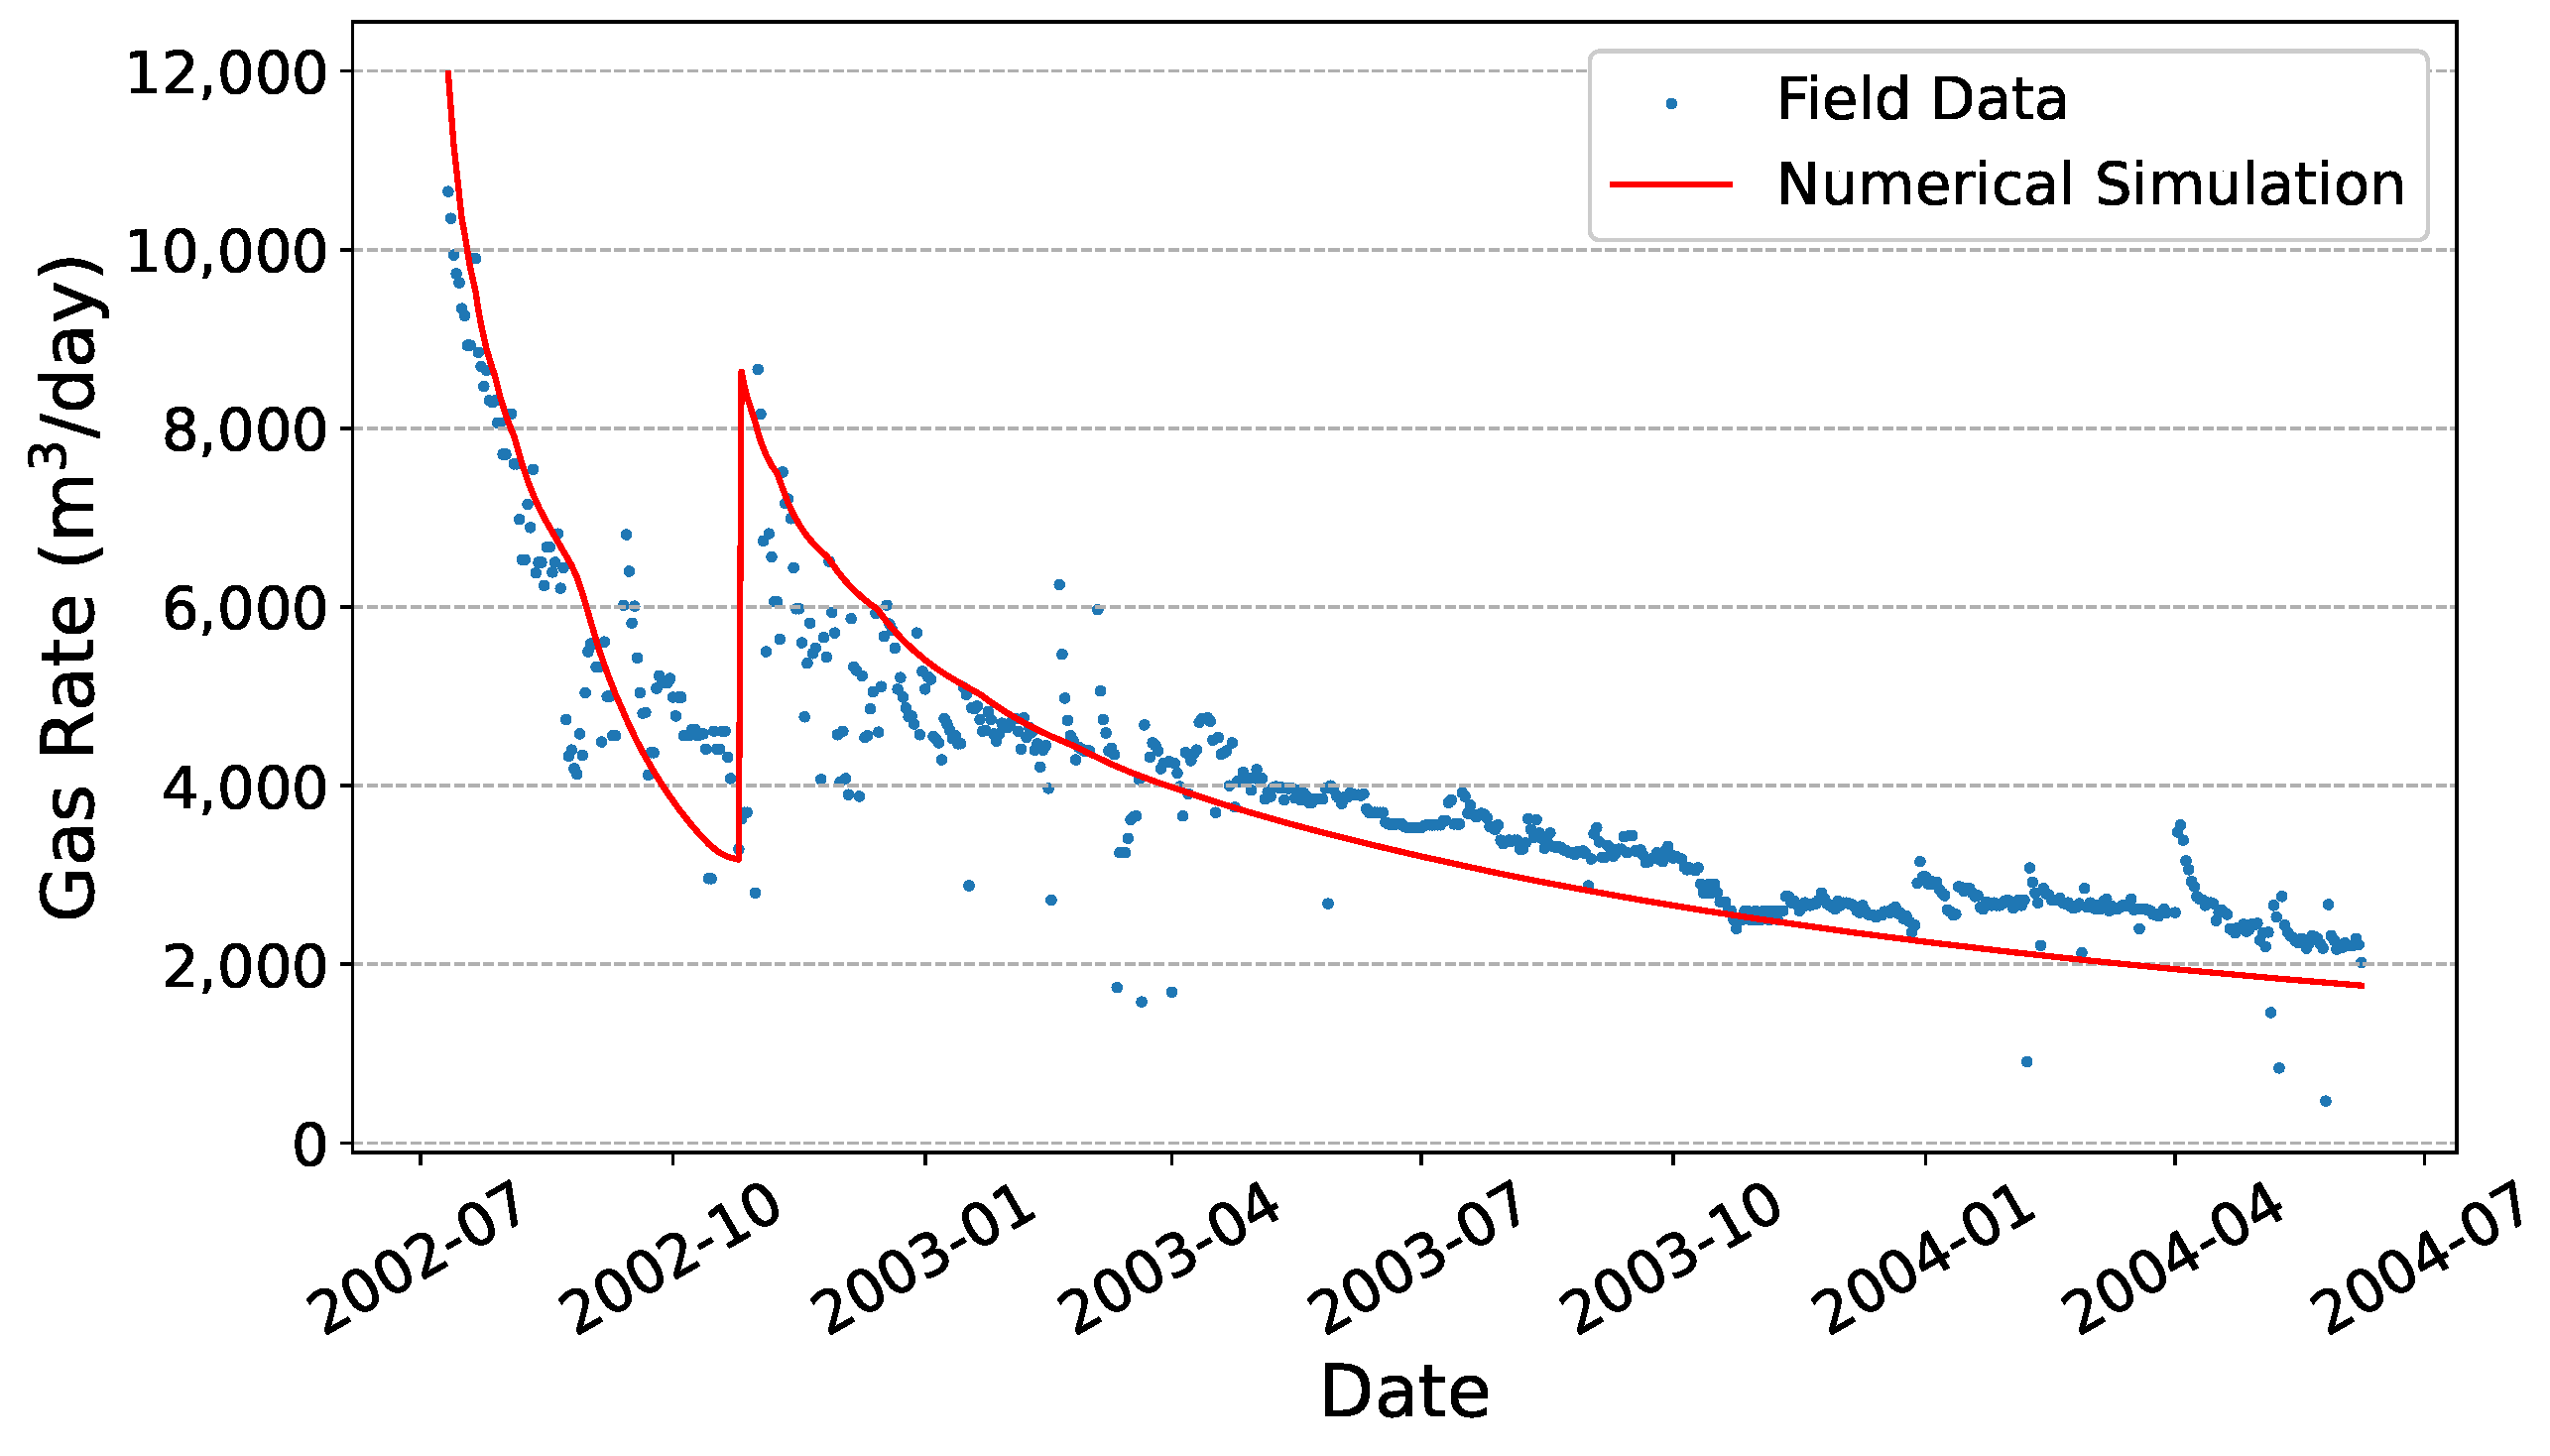
Using the bottom hole pressure to fit the gas injection rate, the following results are obtained in Figure 5. Due to the expansion effect caused by the adsorption and desorption of CO 2 and CH 4 , the permeability gradually decreases, as well as the gas rate of injected CO 2 . The numerical simulation results are basically consistent with the measured data, and acceptable deviations are determined by the simplification of reservoir’s initial anisotropy, and the ignore of CO 2 phase transition. However, the numerical simulation results and field data have the same trend, which can preliminarily illustrate the reliability of the numerical model.

3. Simulation Scheme

3.1. Simulation Program

We set up three simulation programs. Firstly, this study will compare CBM (directly mining) with CO2-ECBM, in order to affirm the advantages of CO2-ECBM. The evolution of reservoir pressure, permeability and adsorbed gas content in CO2-ECBM and CBM engineering will be analyzed. Subsequently, the effects of different injection pressures and temperatures on CO2-ECBM will be analyzed (Table 4).

3.2. Basic Model

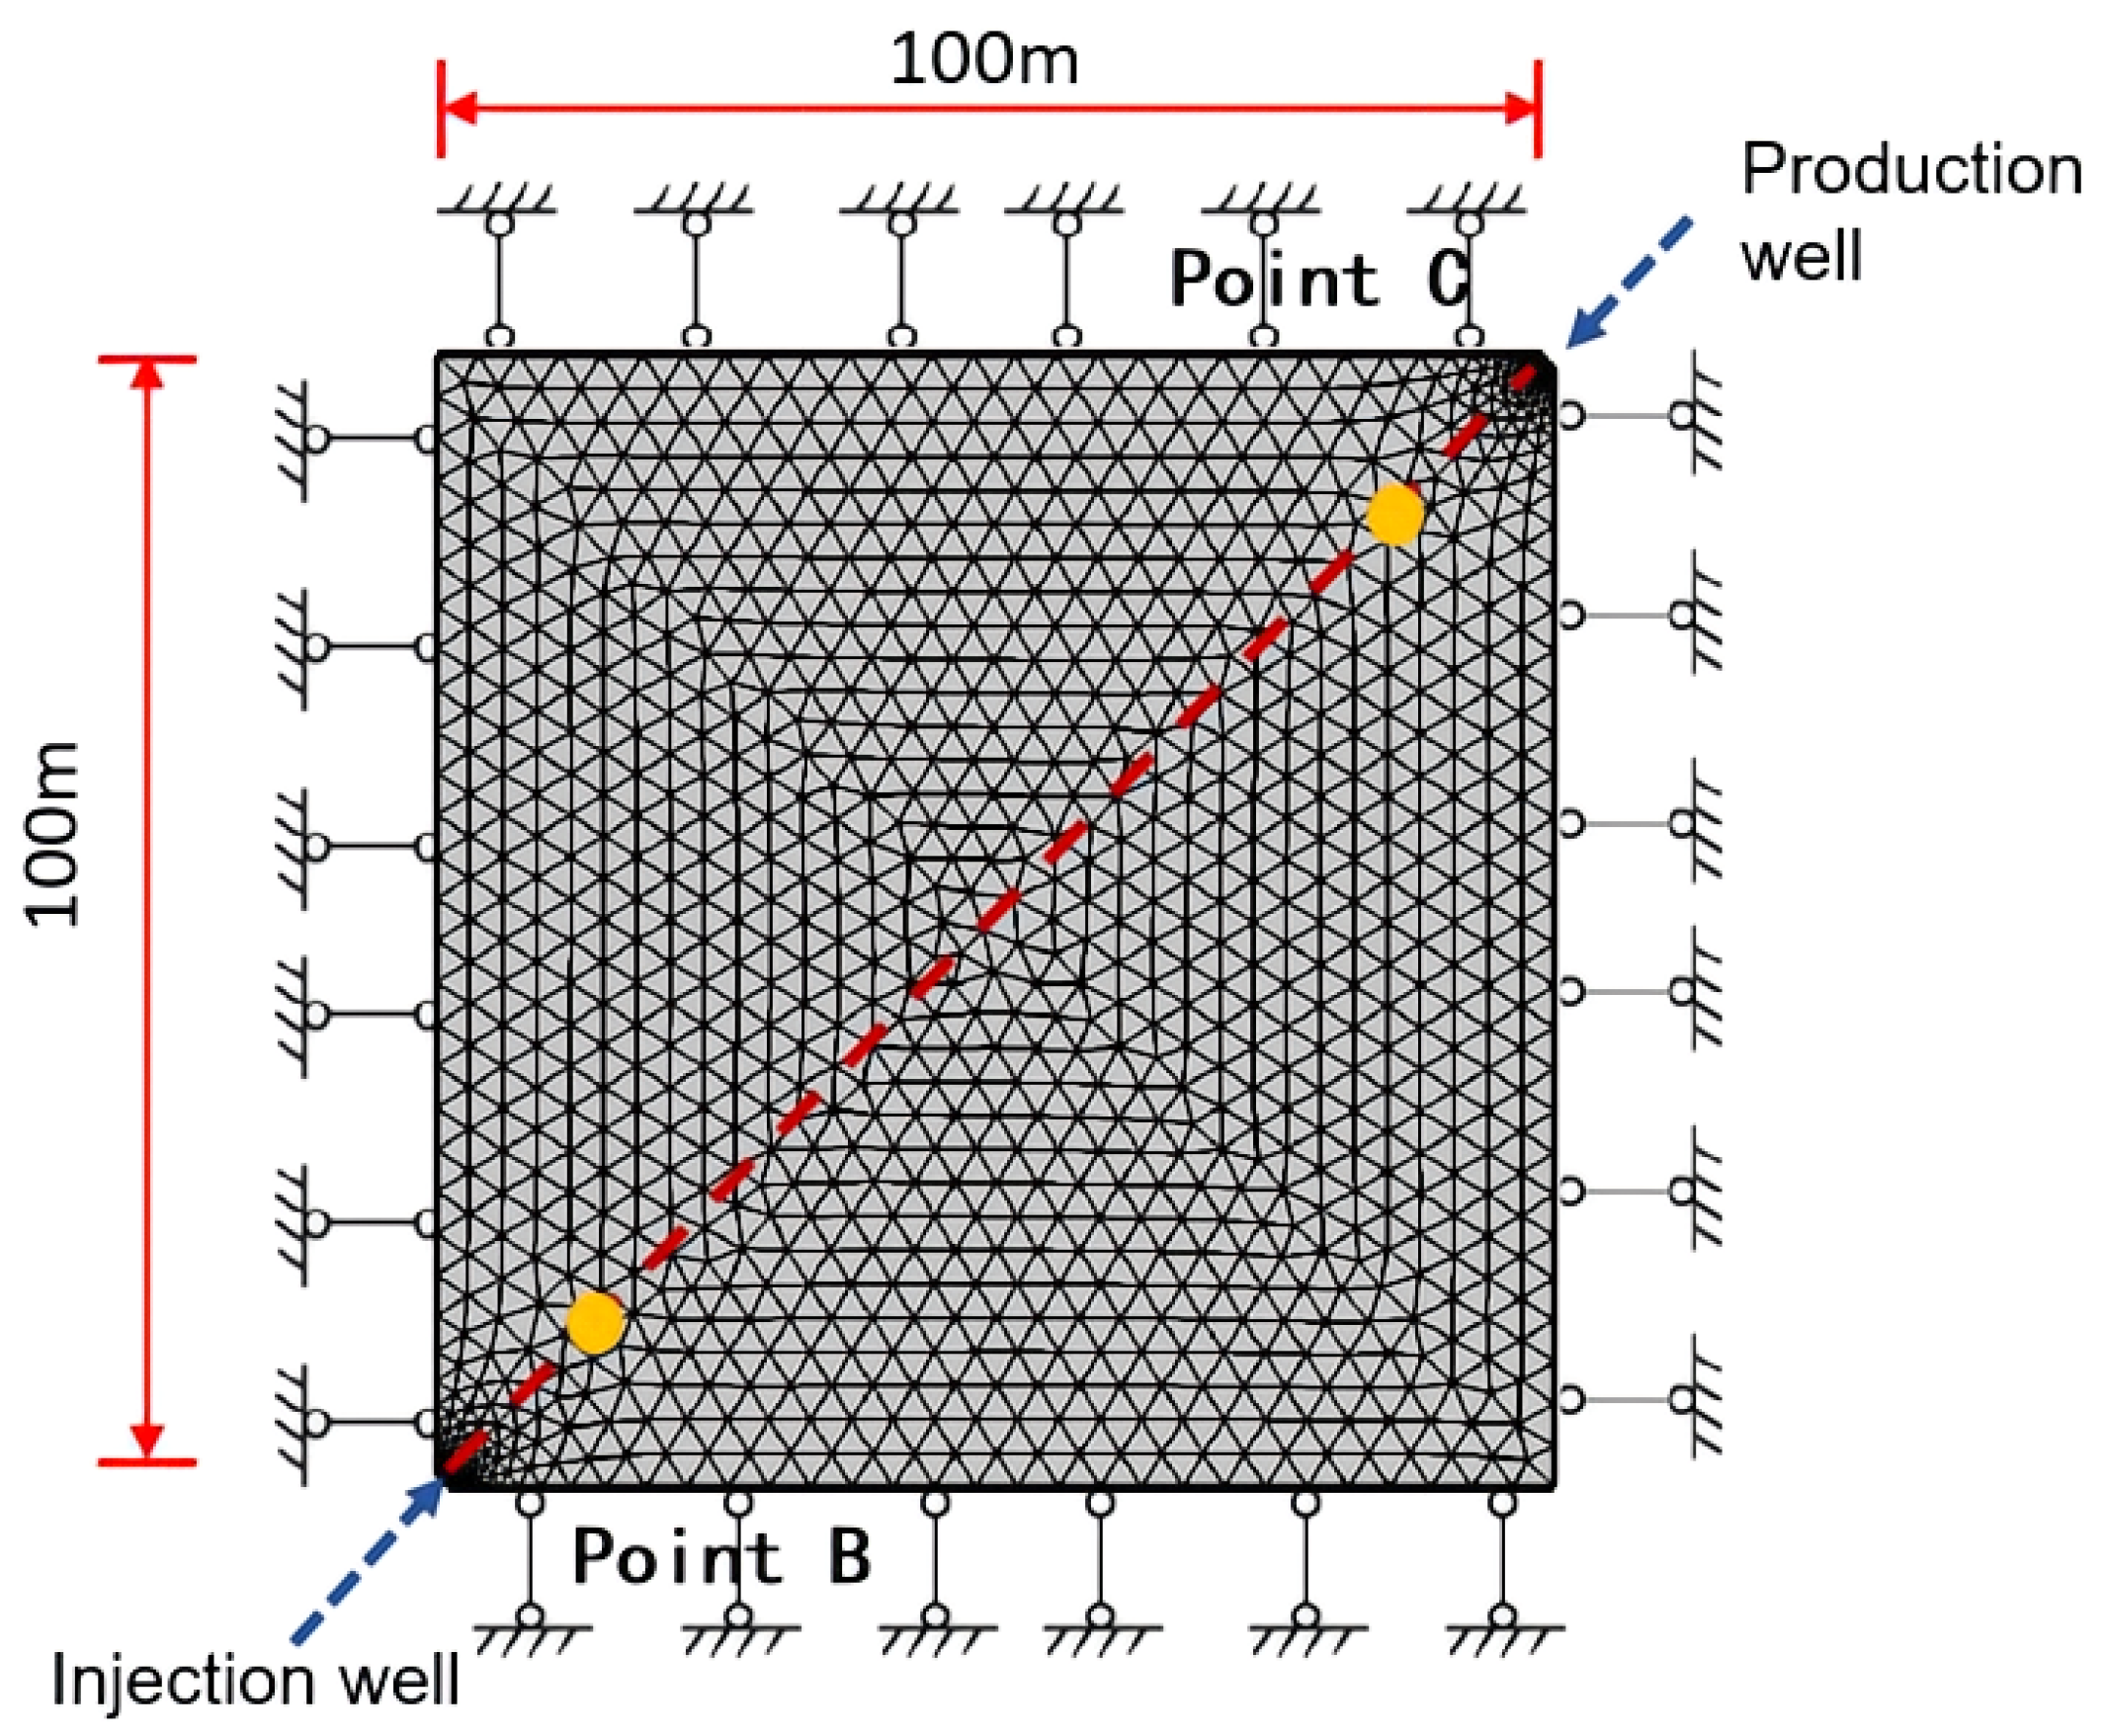
The traditional five-point well pattern layout is used as the research object, and a quarter of the extraction area near the bottom of the well is selected as the simulation area (Figure 6). The actual size is 100 × 100 m. A two-dimensional intercept line is set on the diagonal of the model, and observation points B and C are set near the injection well and the production well. The coordinates of point B and point C are (20 m, 20 m) and (80 m, 80 m) respectively. The initial formation pressure of the coal seam is 1.6 MPa, and the temperature of the coal seam is 289 K. The gas injection boundary condition is constant pressure boundary condition. The production well is connected to the surface, and the bottom hole flowing pressure is 0.1 MPa. Table 5 illustrates the numerical simulation core parameters.

4. Results and Discussions

4.1. Effect of CO 2 Injection on Coalbed Methane Production

4.1.1. Variation of Reservoir Pressure

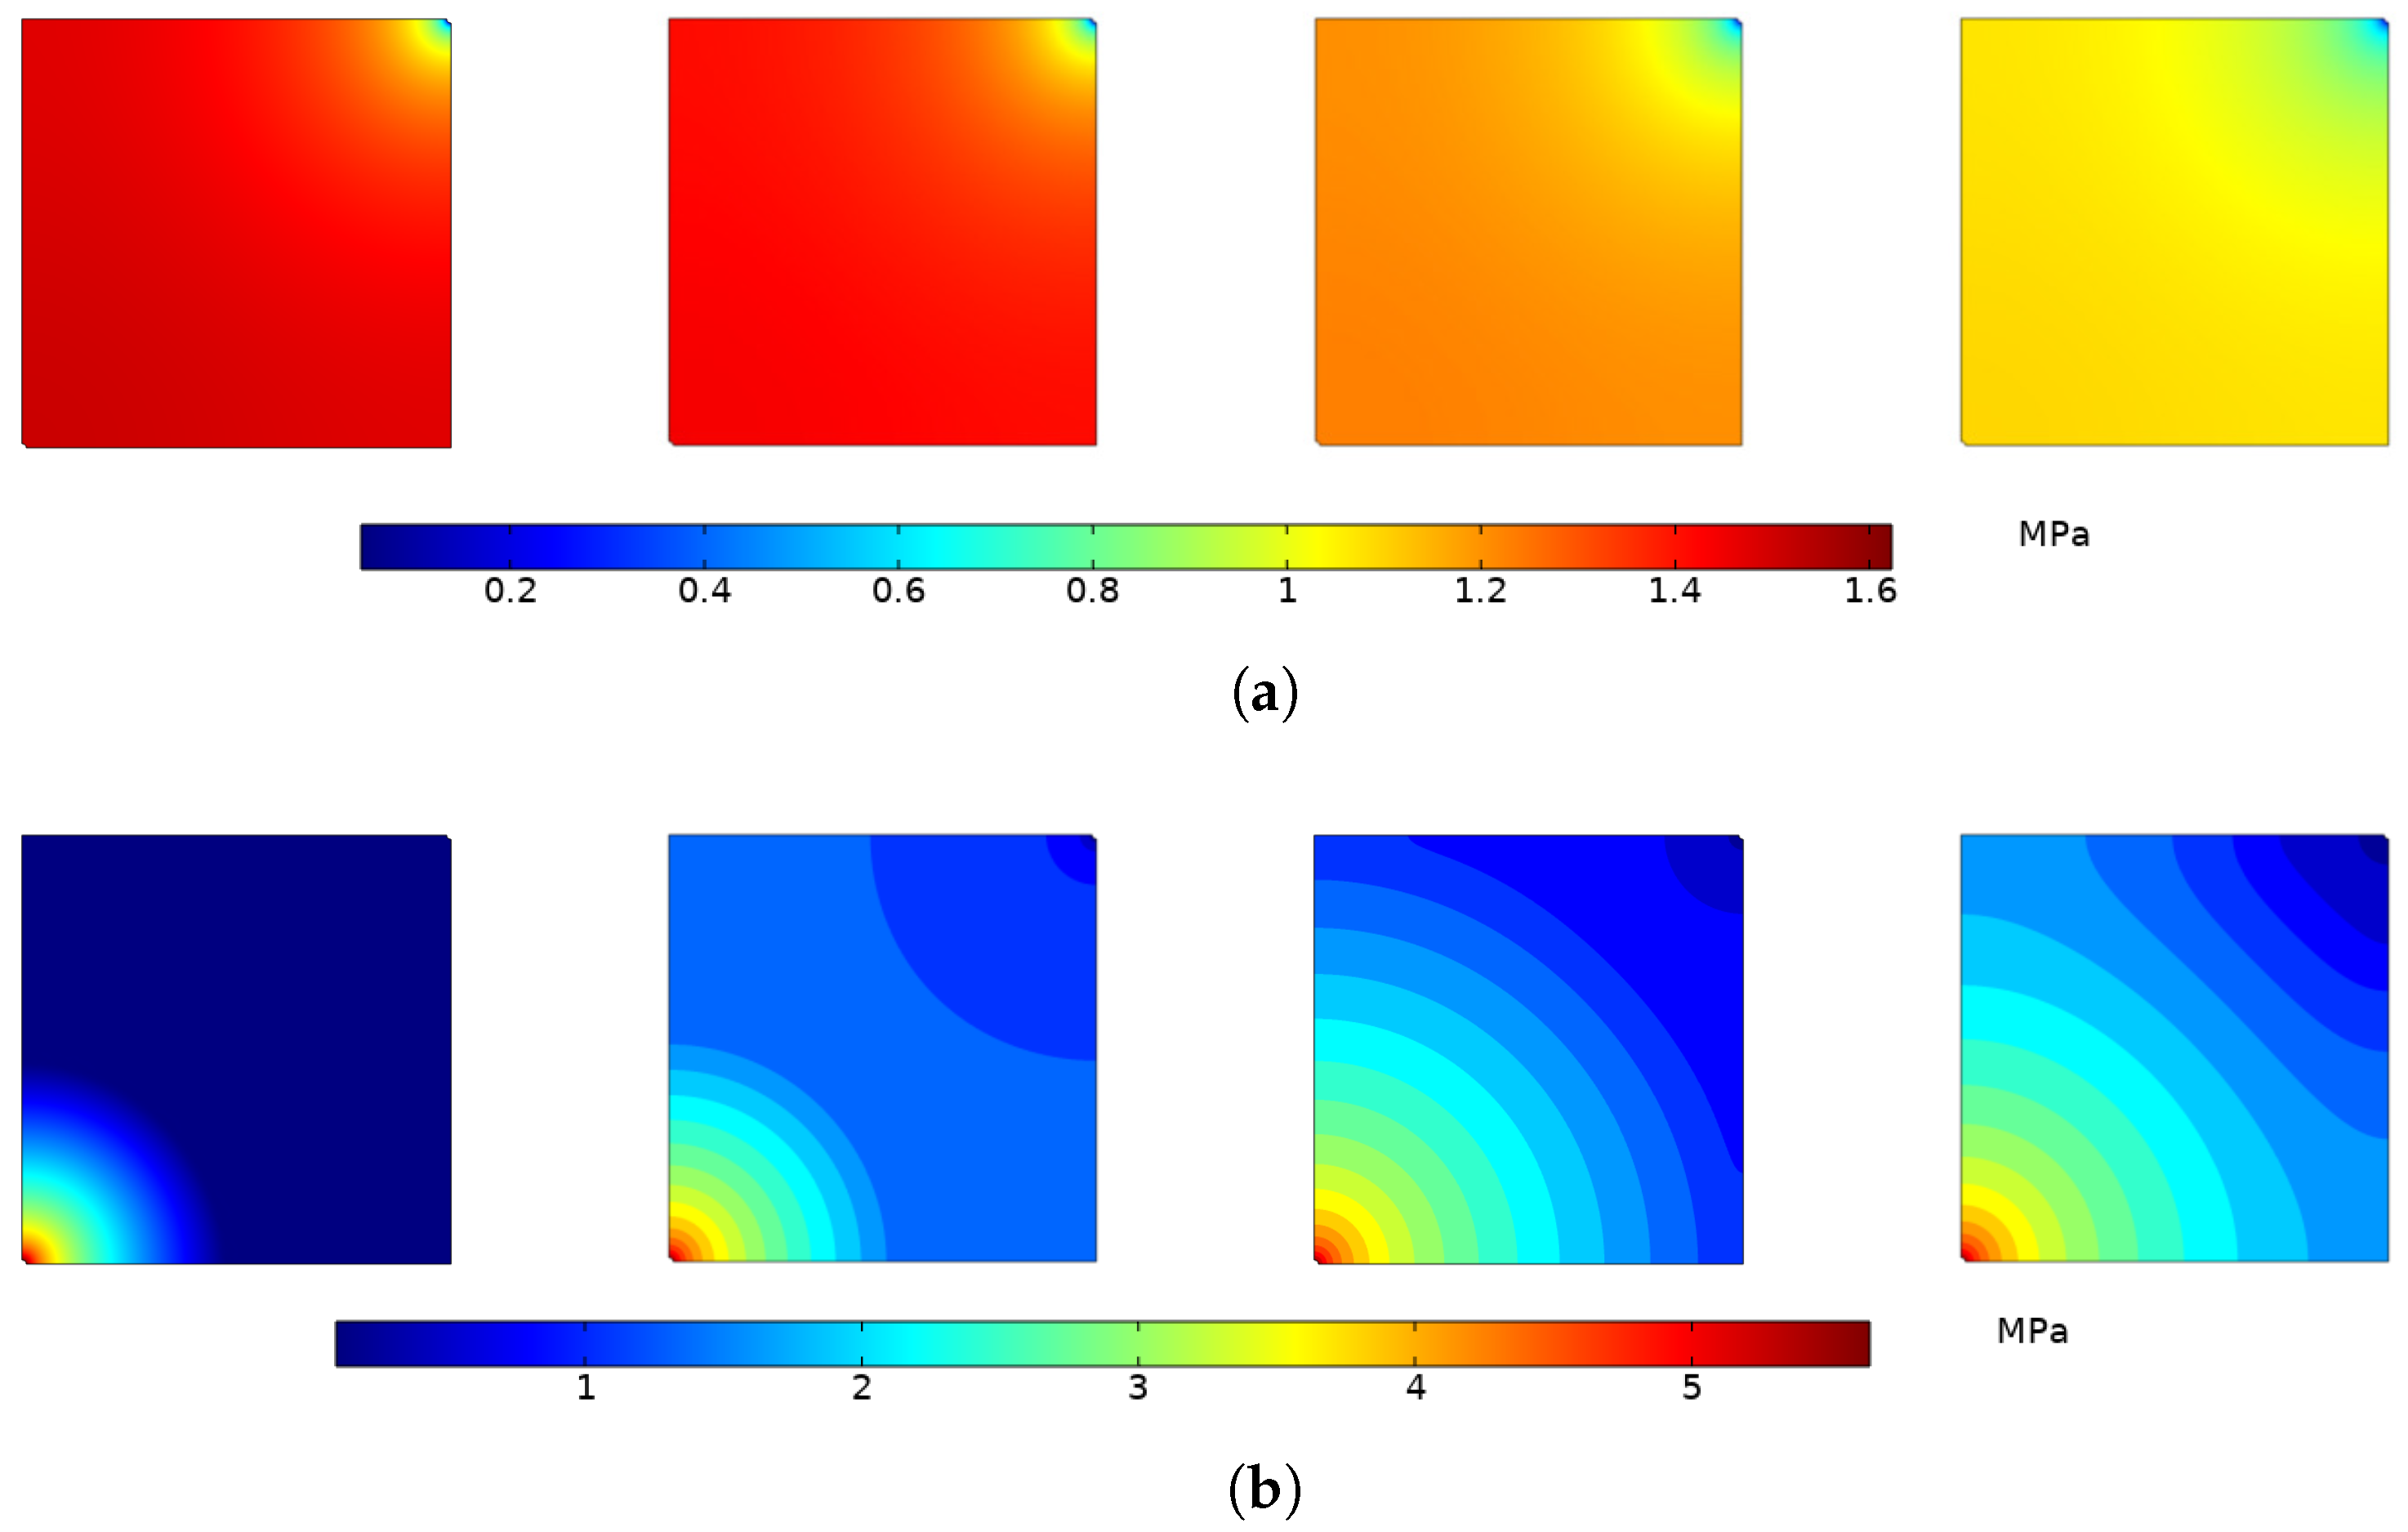
Figure 7 shows the distribution of reservoir pressure. During the CBM process, the reservoir pressure gradually decreases with time (Figure 7a). Affected by the pressure relief of the production well, the reservoir pressure begins to decrease from the production well and gradually diffuses into the reservoir. During the CO 2 -ECBM process (Figure 7b), reservoir pressure gradually increases with time. At the same production time, CO 2 injection has an enhancement effect on reservoir pressure. When CO 2 is injected, the reservoir pressure near the bottom of the well is greater. As the distance from the well increases, the pressure decreases in a step-wise manner, which indicates that CO 2 mainly accumulates at the bottom of the well and near the well.
According to the Langmuir adsorption theory, the pressure gradient in the reservoir will directly affect the adsorption and desorption of gas in the reservoir (Equation (5)). During the CO 2 injection process, a large amount of CO 2 is adsorbed in the near-well reservoir, which will lead to the rapid decrease of reservoir permeability around the bottom of the well. Finally, it will limit the flow capacity of CO 2 and cause a decrease in injection capacity.
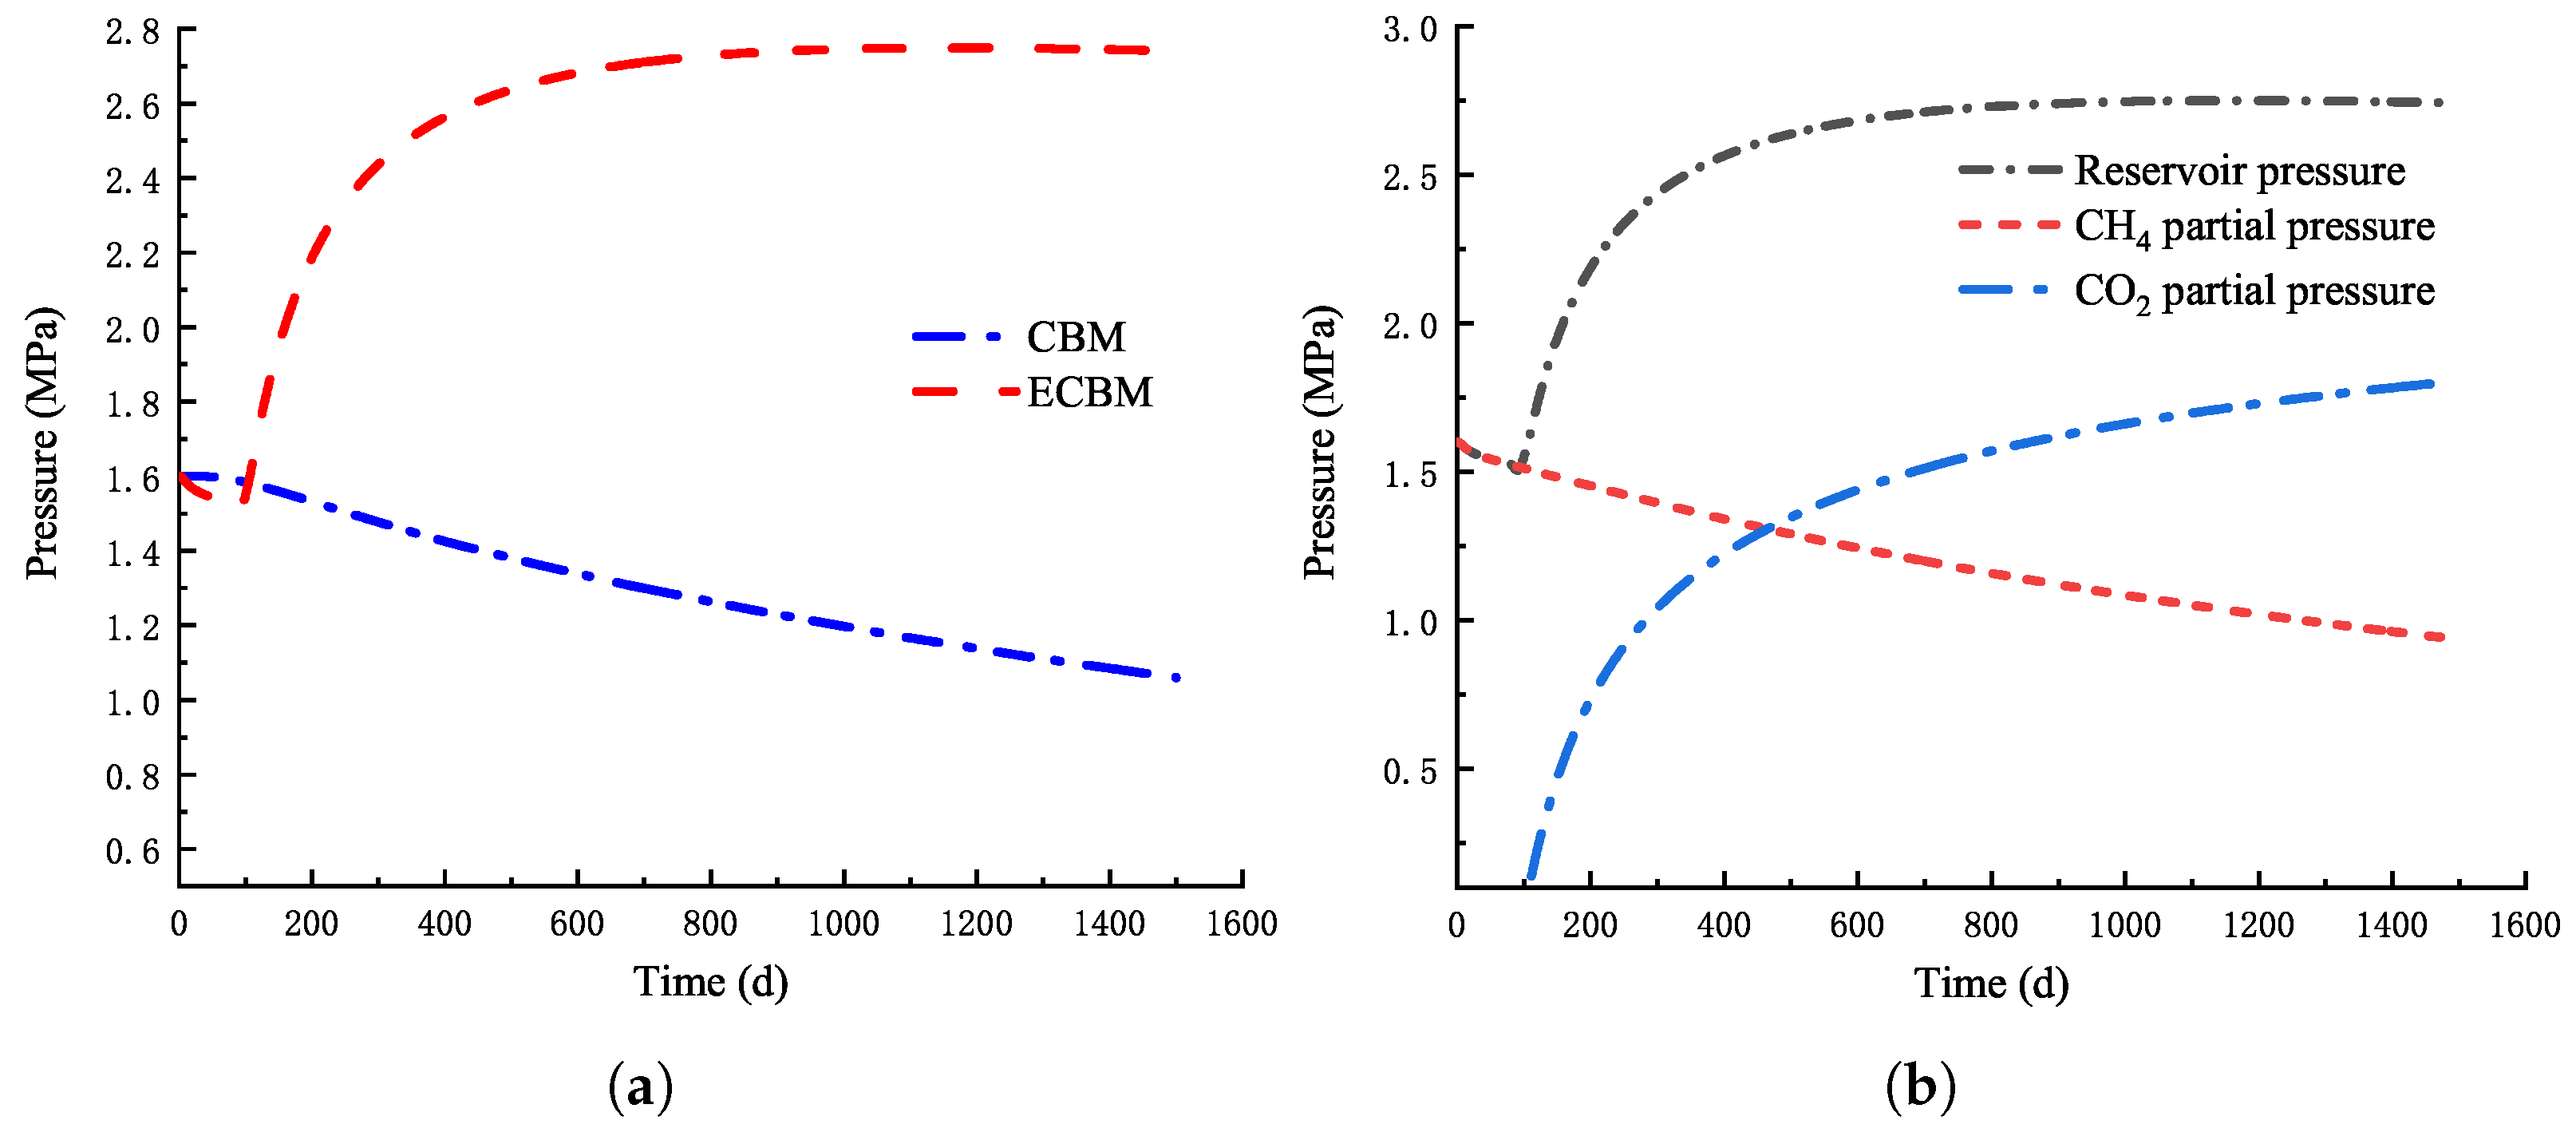
Figure 8 presents the distribution of gas pressure along the diagonal. After 1500 days of production, the gas pressure near the injection well is reduced to 1.06 MPa (Figure 8a). Taking the initial gas pressure as a reference, when the production is 300 days, 500 days, 1000 days, 1500 days, the gas pressure near the injection well is 87%, 81%, 75%, 66% of the initial pressure, respectively. During the CO 2 -ECBM process, the gas pressure gradually decreases from the injection well to the middle of the reservoir and then to the production well, and the gas pressure increases with time (Figure 8b). The pressure differential between the production well and the injection well is greatly increased compared with the direct exploitation. It is because of a higher pressure differential, gas will accelerate its migration to the production well.
Figure 9 illustrates the distribution of gas pressure at reference point B. The reservoir pressure of point B near the injection well decreases with time. The rate of reservoir pressure reduction is relatively slow at the initial stage because point B is far away from the production well. However, as the influence range of the production radius continues to expand, the reservoir pressure of point B continues to decrease at a higher rate (Figure 9a).
During the CO 2 injection process, after an initial decrease, the reservoir pressure increases rapidly and then the increase rate begins to slow down and even slightly decreases (Figure 9b). The injection of CO 2 first increases the pressure of the reservoir near the injection well. With the progress of CO 2 injection, the pressure increase trend continues to spread to the internal part of the reservoir. After a period of time, it will inevitably affect the reservoir pressure at point B, and increase the pressure at this point. With the injection process, the decrease of the reservoir permeability inhibits the injection rate of CO 2 , and the increase of CO 2 pressure will slow down. However, the pressure reduction trend of CH 4 under the influence of the pressure relief of the production well is not be affected. Therefore, the reservoir pressure increases slowly and slightly decreases in the later period.

4.1.2. Variation of CH 4 Concentration

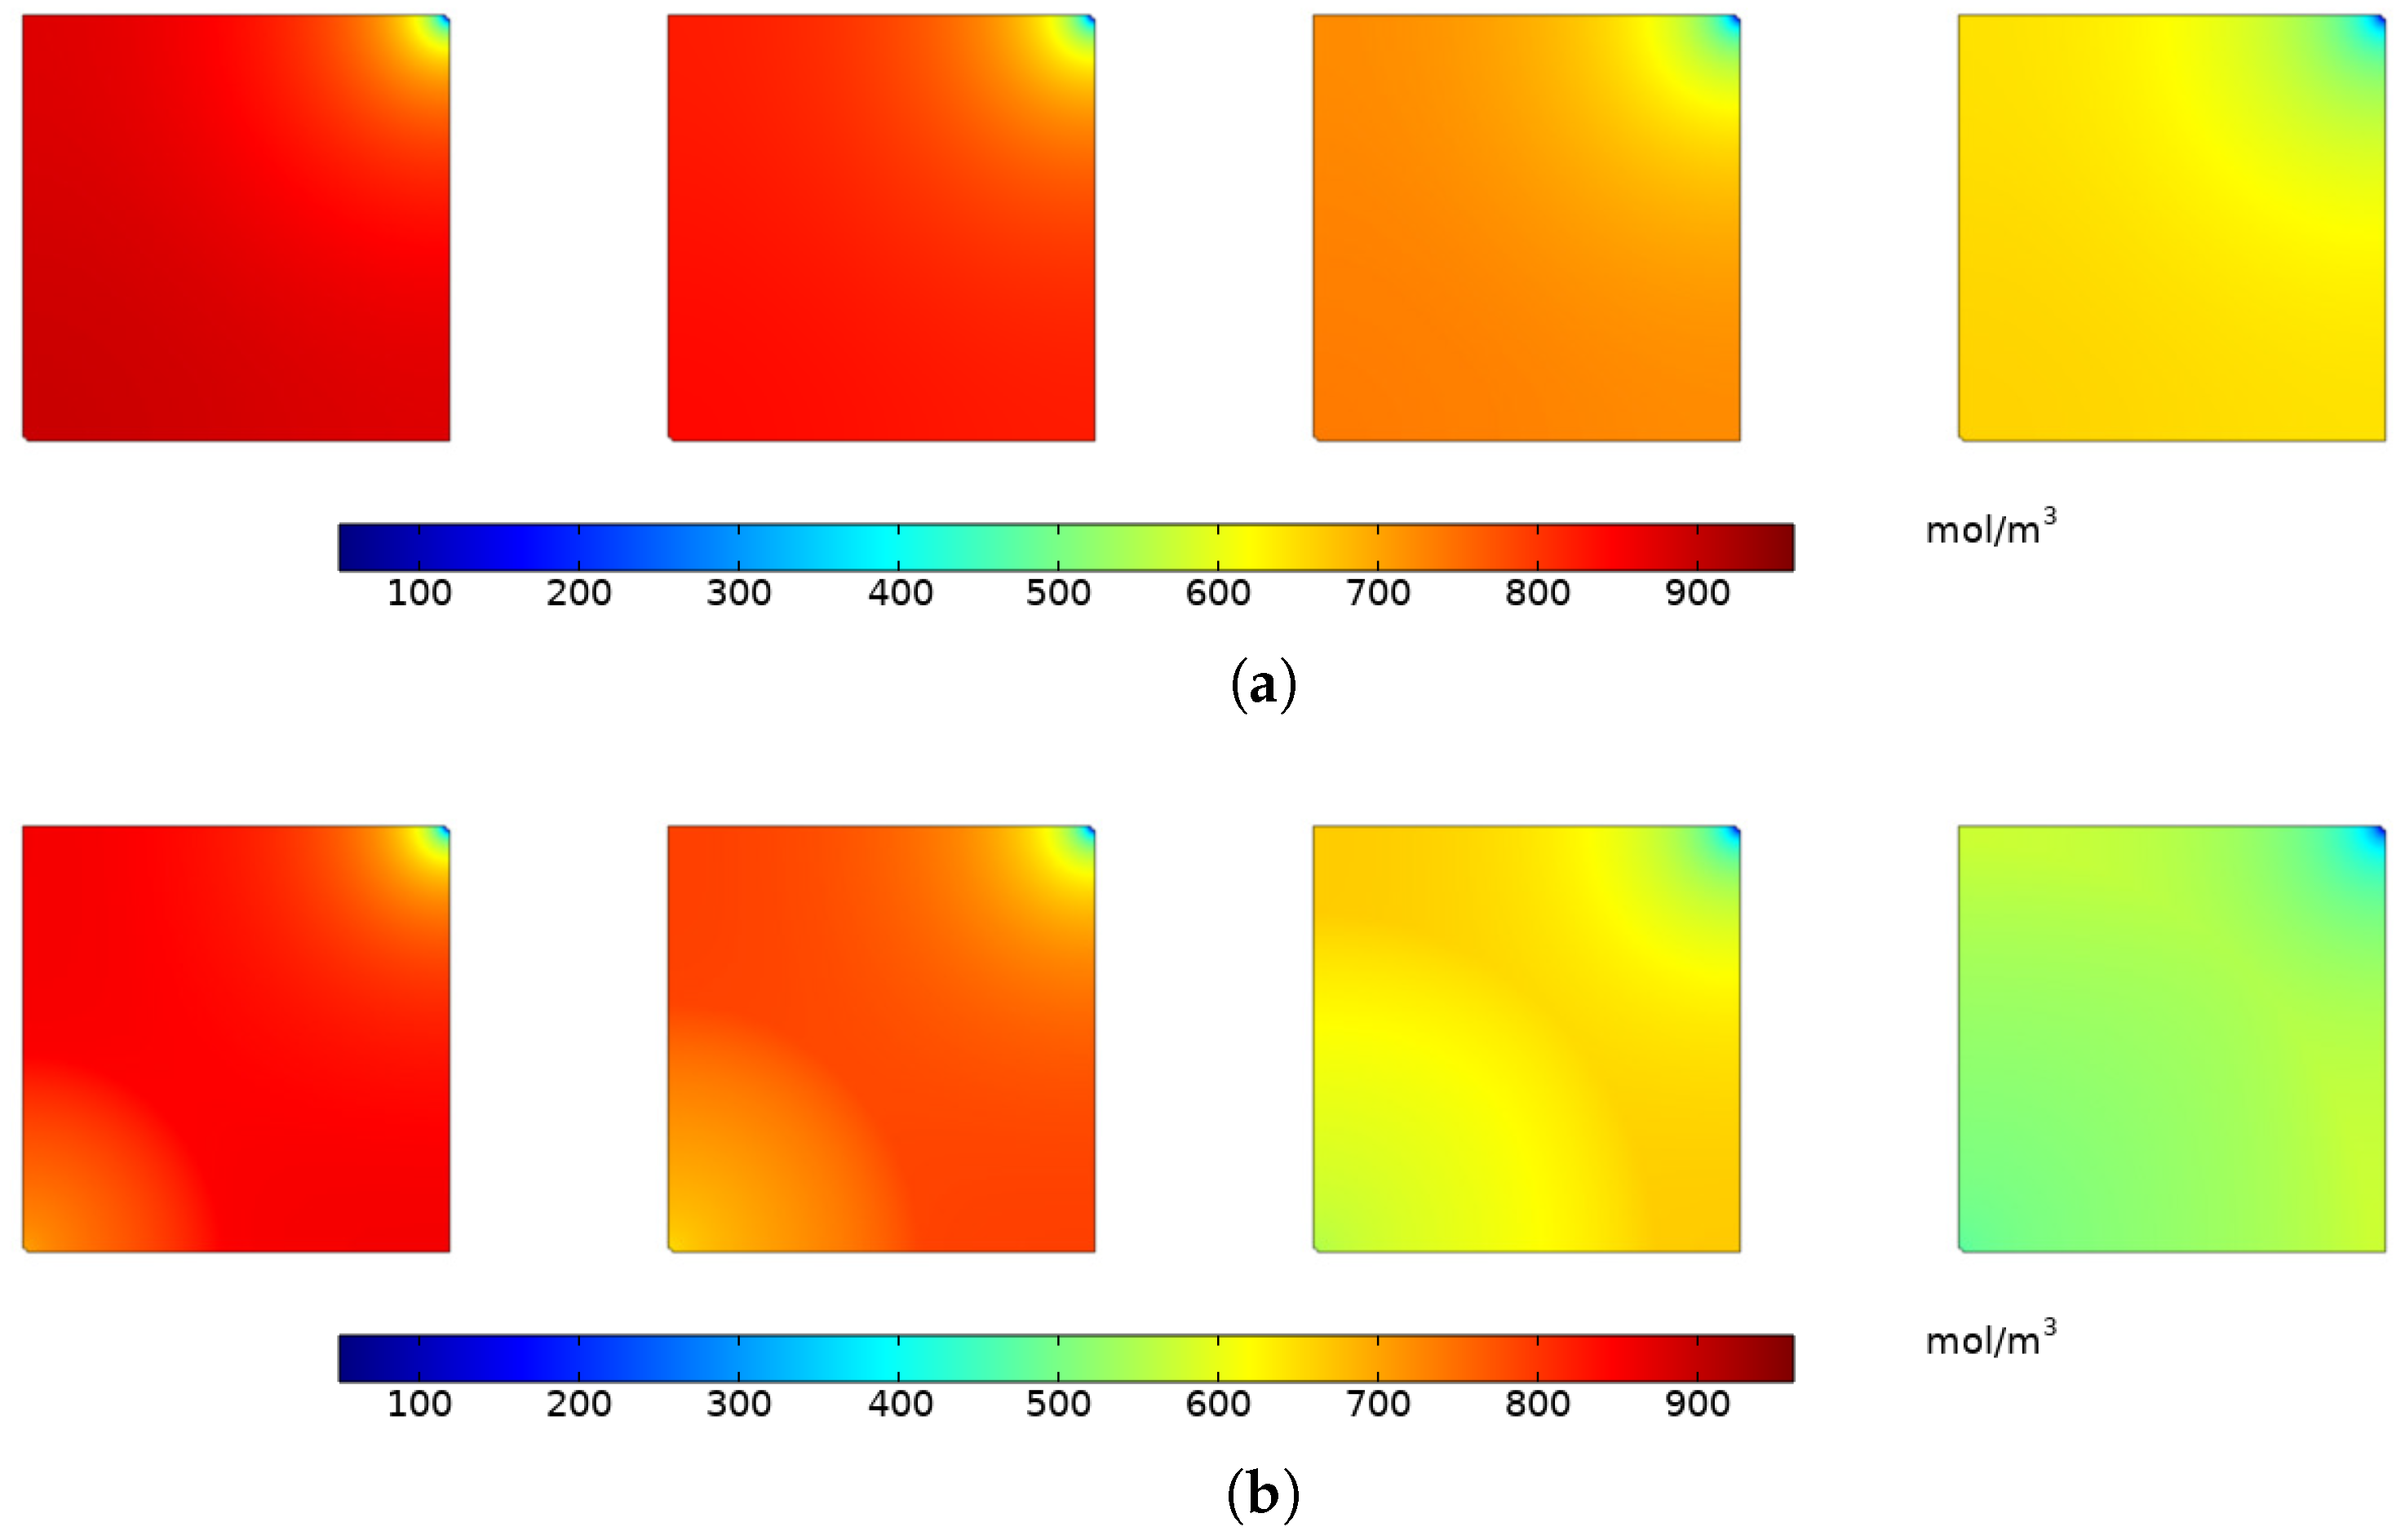
Figure 10 illustrates the distribution of CH 4 concentration. During the direct exploitation (Figure 10a), the CH 4 concentration first changes in the area near the production well and continues to extend into the reservoir. The CH 4 in the reservoir will continuously migrate to the production well because of the pressure differential. However, the pressure differential between the reservoir and the production well is relatively small, the gas migration speed is slow, and the CH 4 concentration changes gradually.
During CO 2 injection mining (Figure 10b), due to the injection of CO 2 , the pressure differential from the injection well to the coal seam, to the production well is higher than that of the direct exploitation. Therefore, at the same time, the change in CH 4 concentration alone with CO 2 injection exploitation is higher than that of direct exploitation. Near the injection well, preferential adsorption of CO 2 to the coal seam after injection forces the desorption of adsorbed CH 4 . The desorbed CH 4 migrates to the production well under the effect of pressure differential, thus the CH 4 concentration near the injection well is also reduced.

4.1.3. Variation of Adsorbed Gas Concentration

The core of the CO 2 -ECBM is to achieve the purpose of stable CO 2 storage through the adsorption of CO 2 by coal matrix. The adsorption competition between CO 2 and CH 4 is one of the core problems in the process of CO 2 storage in the coal seam. Especially in the injection stage, with the injection of CO 2 , the bottom hole and near-well reservoir contain a large pressure range. According to the Langmuir adsorption theory, different pressures determine the adsorption capacity of different gases in the coal seam (Equation (5)).
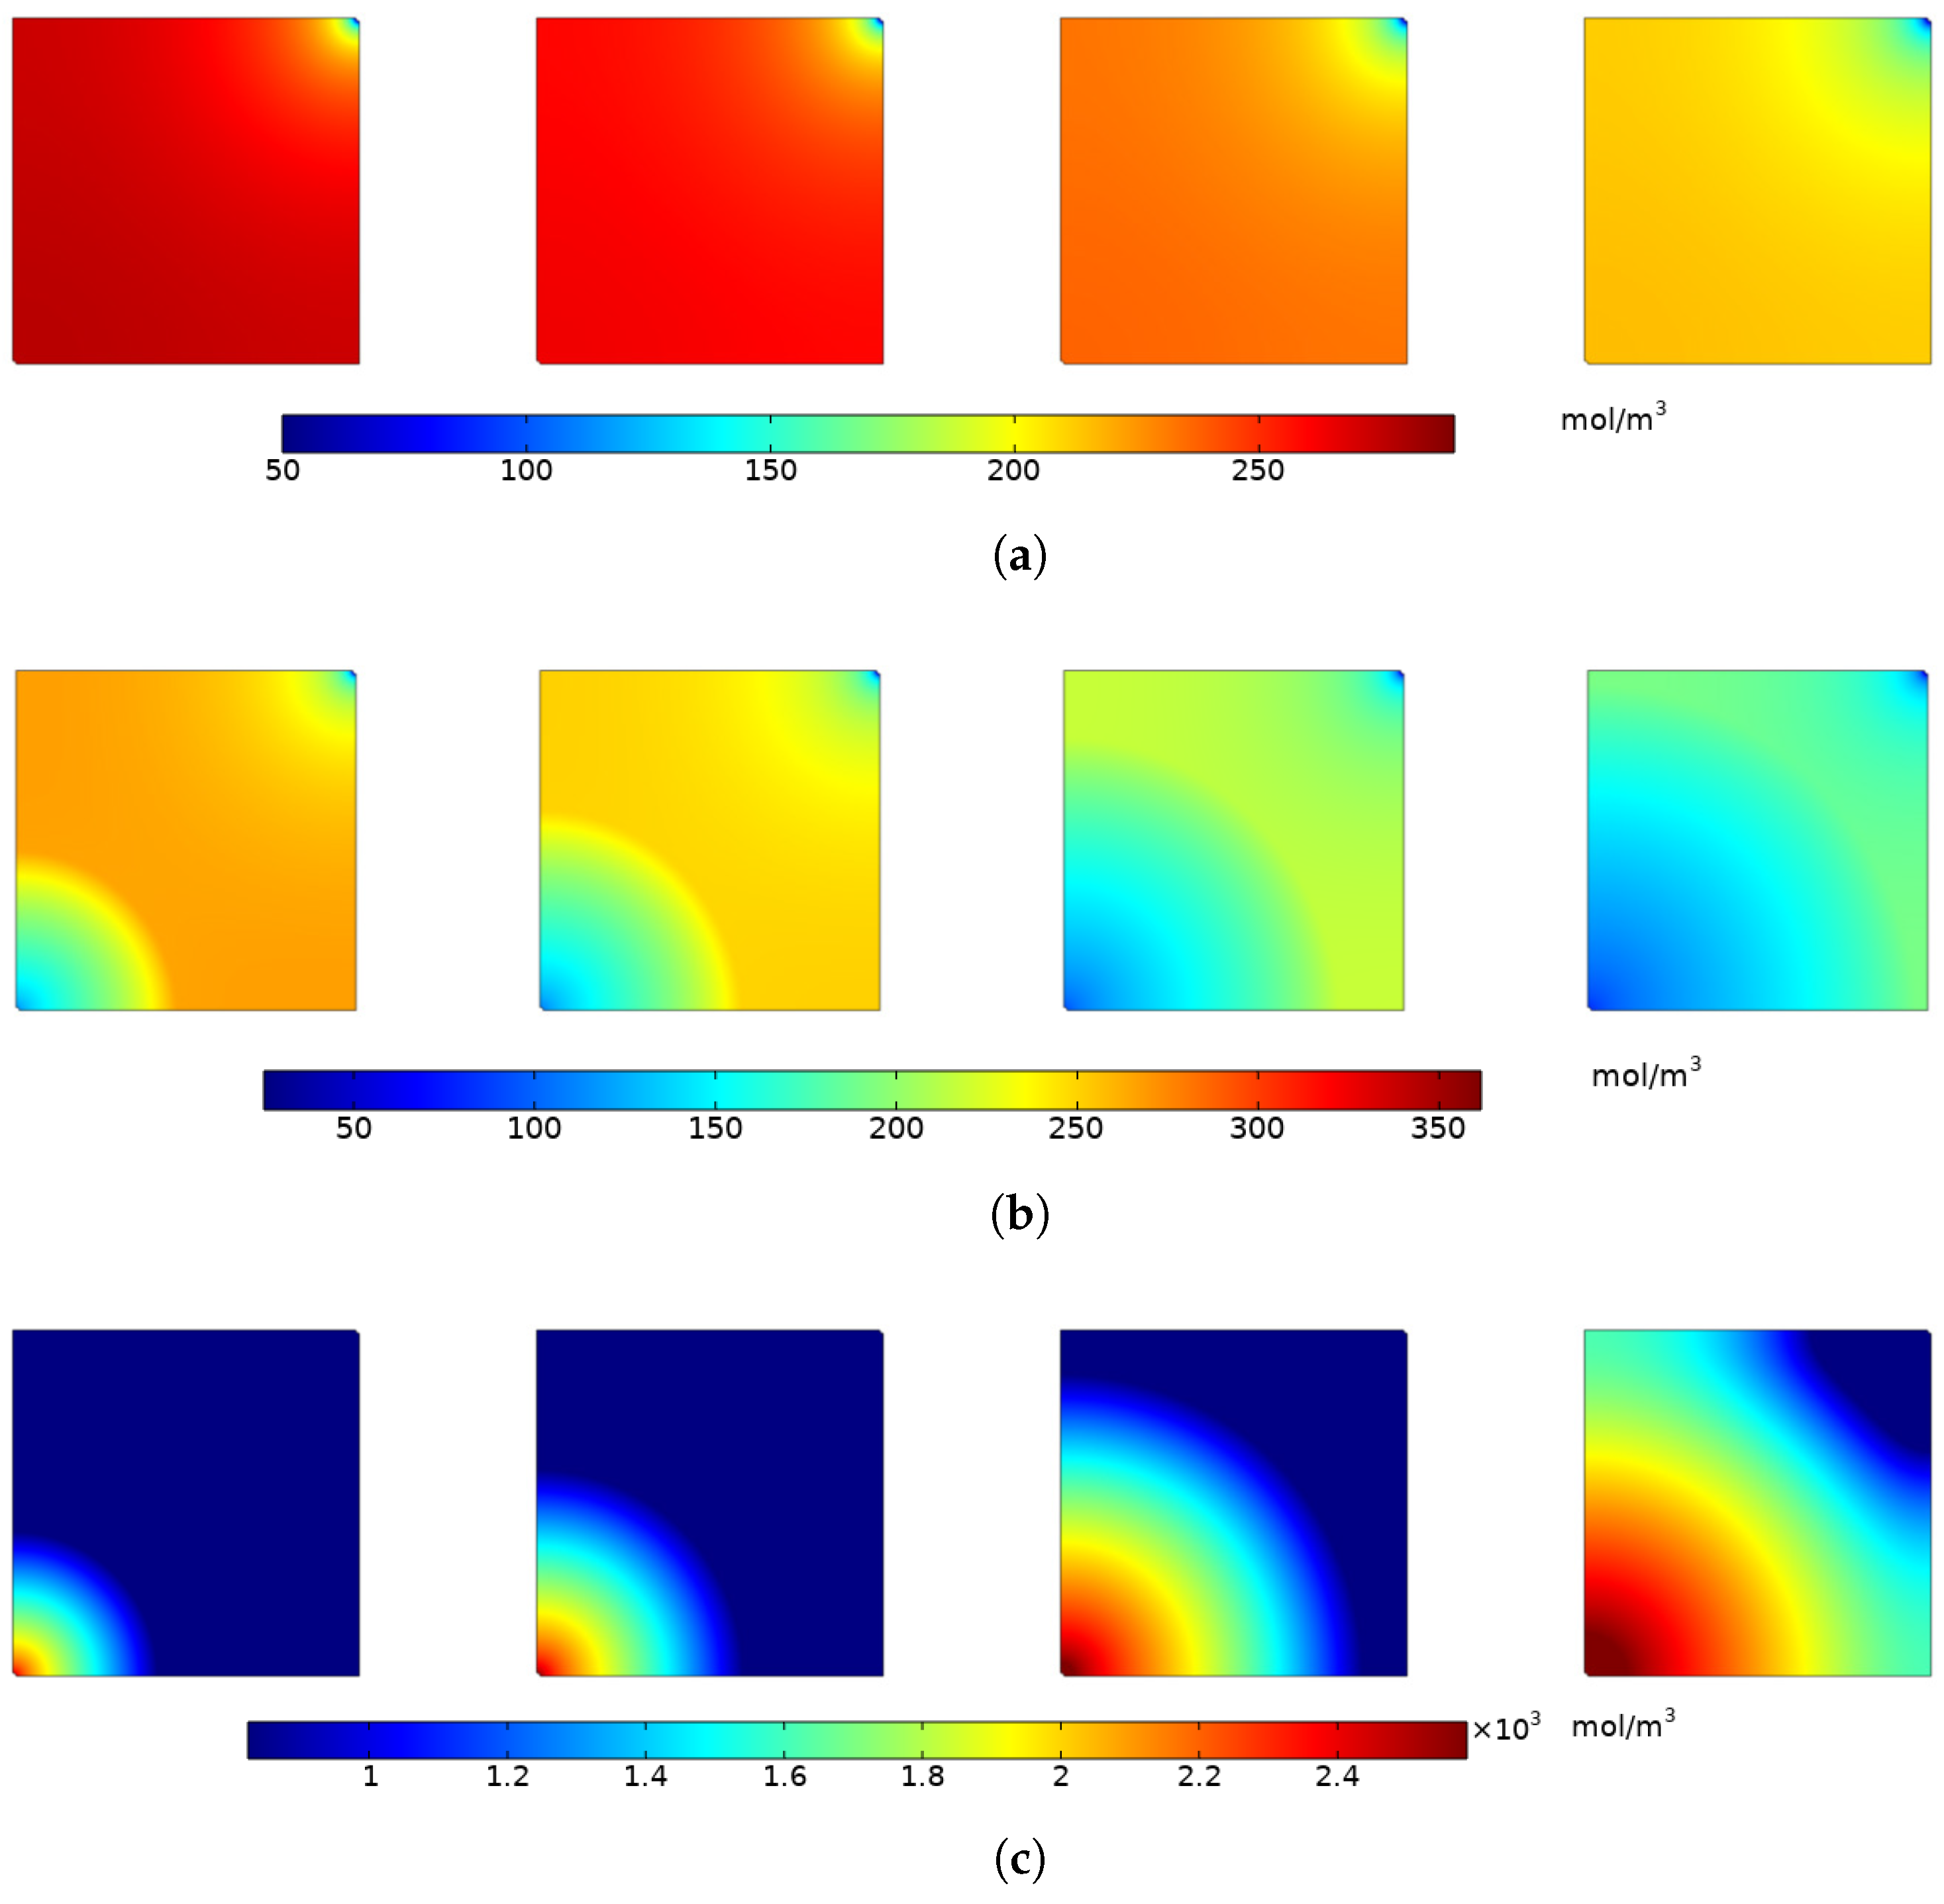
Figure 11 illustrates the distribution of adsorbed CH 4 concentration in direct exploitation and CO 2 injection exploitation, as well as adsorbed CO 2 concentration in CO 2 injection exploitation. During direct exploitation, the adsorbed CH 4 concentration mainly changes near the production well, but the change is small. Affected by the pressure relief of the production well, the free CH 4 is first extracted, then the dynamic equilibrium of the gas in the pore is broken, and part of the adsorbed CH 4 is desorbed Figure 11a. However, the desorption of adsorbed CH 4 is not high during direct exploitation. When CO 2 is injected into the coal seam, it will preferentially adsorb in the coal matrix because the adsorption of CO 2 is greater than that of CH 4 , forcing the latter to desorb. It can be obtained from Figure 11b, With the continuous injection of CO 2 , the concentration of adsorbed CH 4 at the injection well and production well continues to decrease. It can also be seen from Figure 11c that as CO 2 is injected, the concentration of adsorbed CO 2 in the reservoir increased dramatically.
In brief, CH 4 desorption is slow and the amount of desorption is small during direct exploitation, which often leads to a small recovery rate of CH 4 . The CO 2 -ECBM technology has the dual benefits of greenhouse gas emission reduction and clean fossil energy development, and it’s superiority to conventional exploration technologies.

4.1.4. Variation of Reservoir Permeability

The scientific connotation of the effectiveness of CO 2 -ECBM mainly includes the CO 2 storage mechanism and storage capacity, and the increase rate of CH 4 yield, which are also the basic theoretical and technical problems faced by CO 2 -ECBM. The effectiveness of CO 2 -ECBM also becomes the premise and foundation of the safety and economy of CO 2 -ECBM. The injectivity of CO 2 can be characterized by injection pressure, injection rate, cumulative injection volume and other parameters, which are mainly related to the permeability of the coal seam and its dynamic changes. Therefore, it is necessary to study the permeability evolution of the reservoir. With the injection of CO 2 , the permeability of coal seams will decrease, which often affects the injectivity of CO 2 [46].
The evolution of permeability in the CO 2 -ECBM process is a very complex phenomenon, which is determined by the stress effect and the adsorption swelling effect. On the one hand, effective stress increases and permeability decreases because of cleat compression [47]. On the other hand, the matrix expands, the seepage channel is compressed, and the permeability will decrease, along with CO2 adsorption, as CH 4 desorption occurs, matrix shrinkage, seepage channel opens, permeability will increase [46].
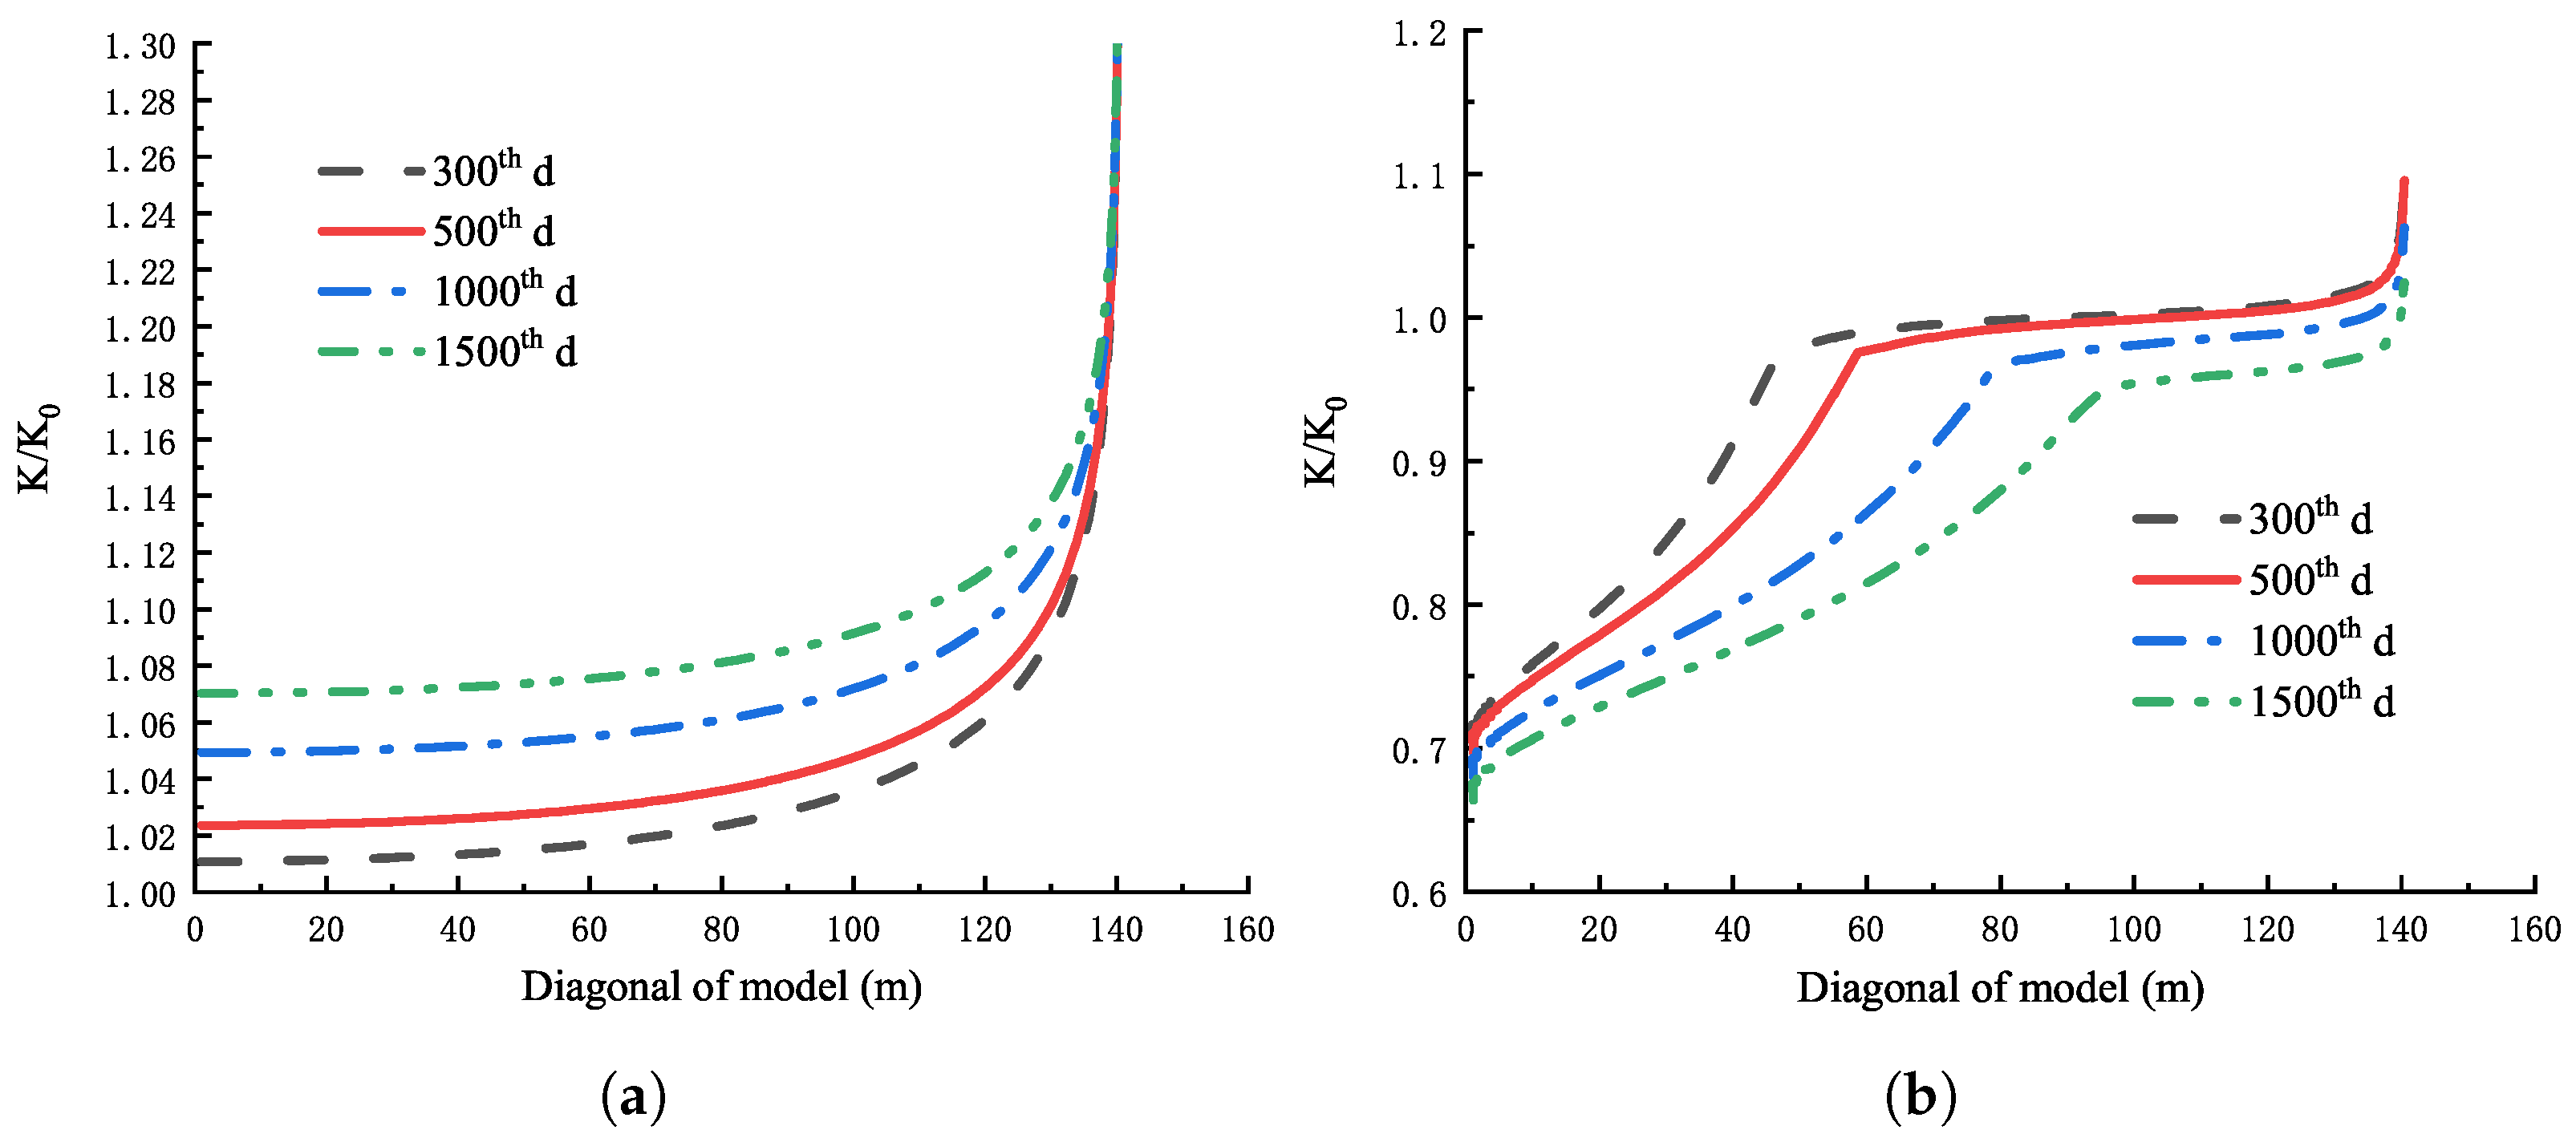
During direct exploitation (Figure 12a), the reservoir permeability increases with time, and the closer to the production well is, the higher the permeability will be. This is because with the production, the pressure near the production well decreases, CH 4 desorbs, the matrix shrinks, then the permeability increases. In addition, the increase of effective stress leads to the decrease of permeability. However, the increase of permeability caused by matrix shrinkage deformation dominates. Therefore, the permeability increases compared with the initial permeability.
In the case of CO 2 injection (Figure 12b), for the area near injection well, the decrease of effective stress will lead to the increase of permeability near the gas injection well, while the matrix expansion caused by competitive adsorption will lead to the decrease of permeability. At this time, the expansion deformation caused by the competitive adsorption of CO 2 and CH 4 dominates, and the permeability near the gas injection well decreases rapidly.
For the area near the production well, when the production time is short, the injected CO 2 does not affect the production well. At this time, the stress effect reduces the permeability, and the matrix shrinkage effect caused by CH 4 desorption leads to the increase of permeability, but the matrix shrinkage effect caused by CH 4 desorption dominates. Therefore, the permeability of the production well is larger than the initial permeability.

4.2. Effect of Different Injection Pressure on CO 2 -ECBM

4.2.1. Variation of Reservoir Pressure

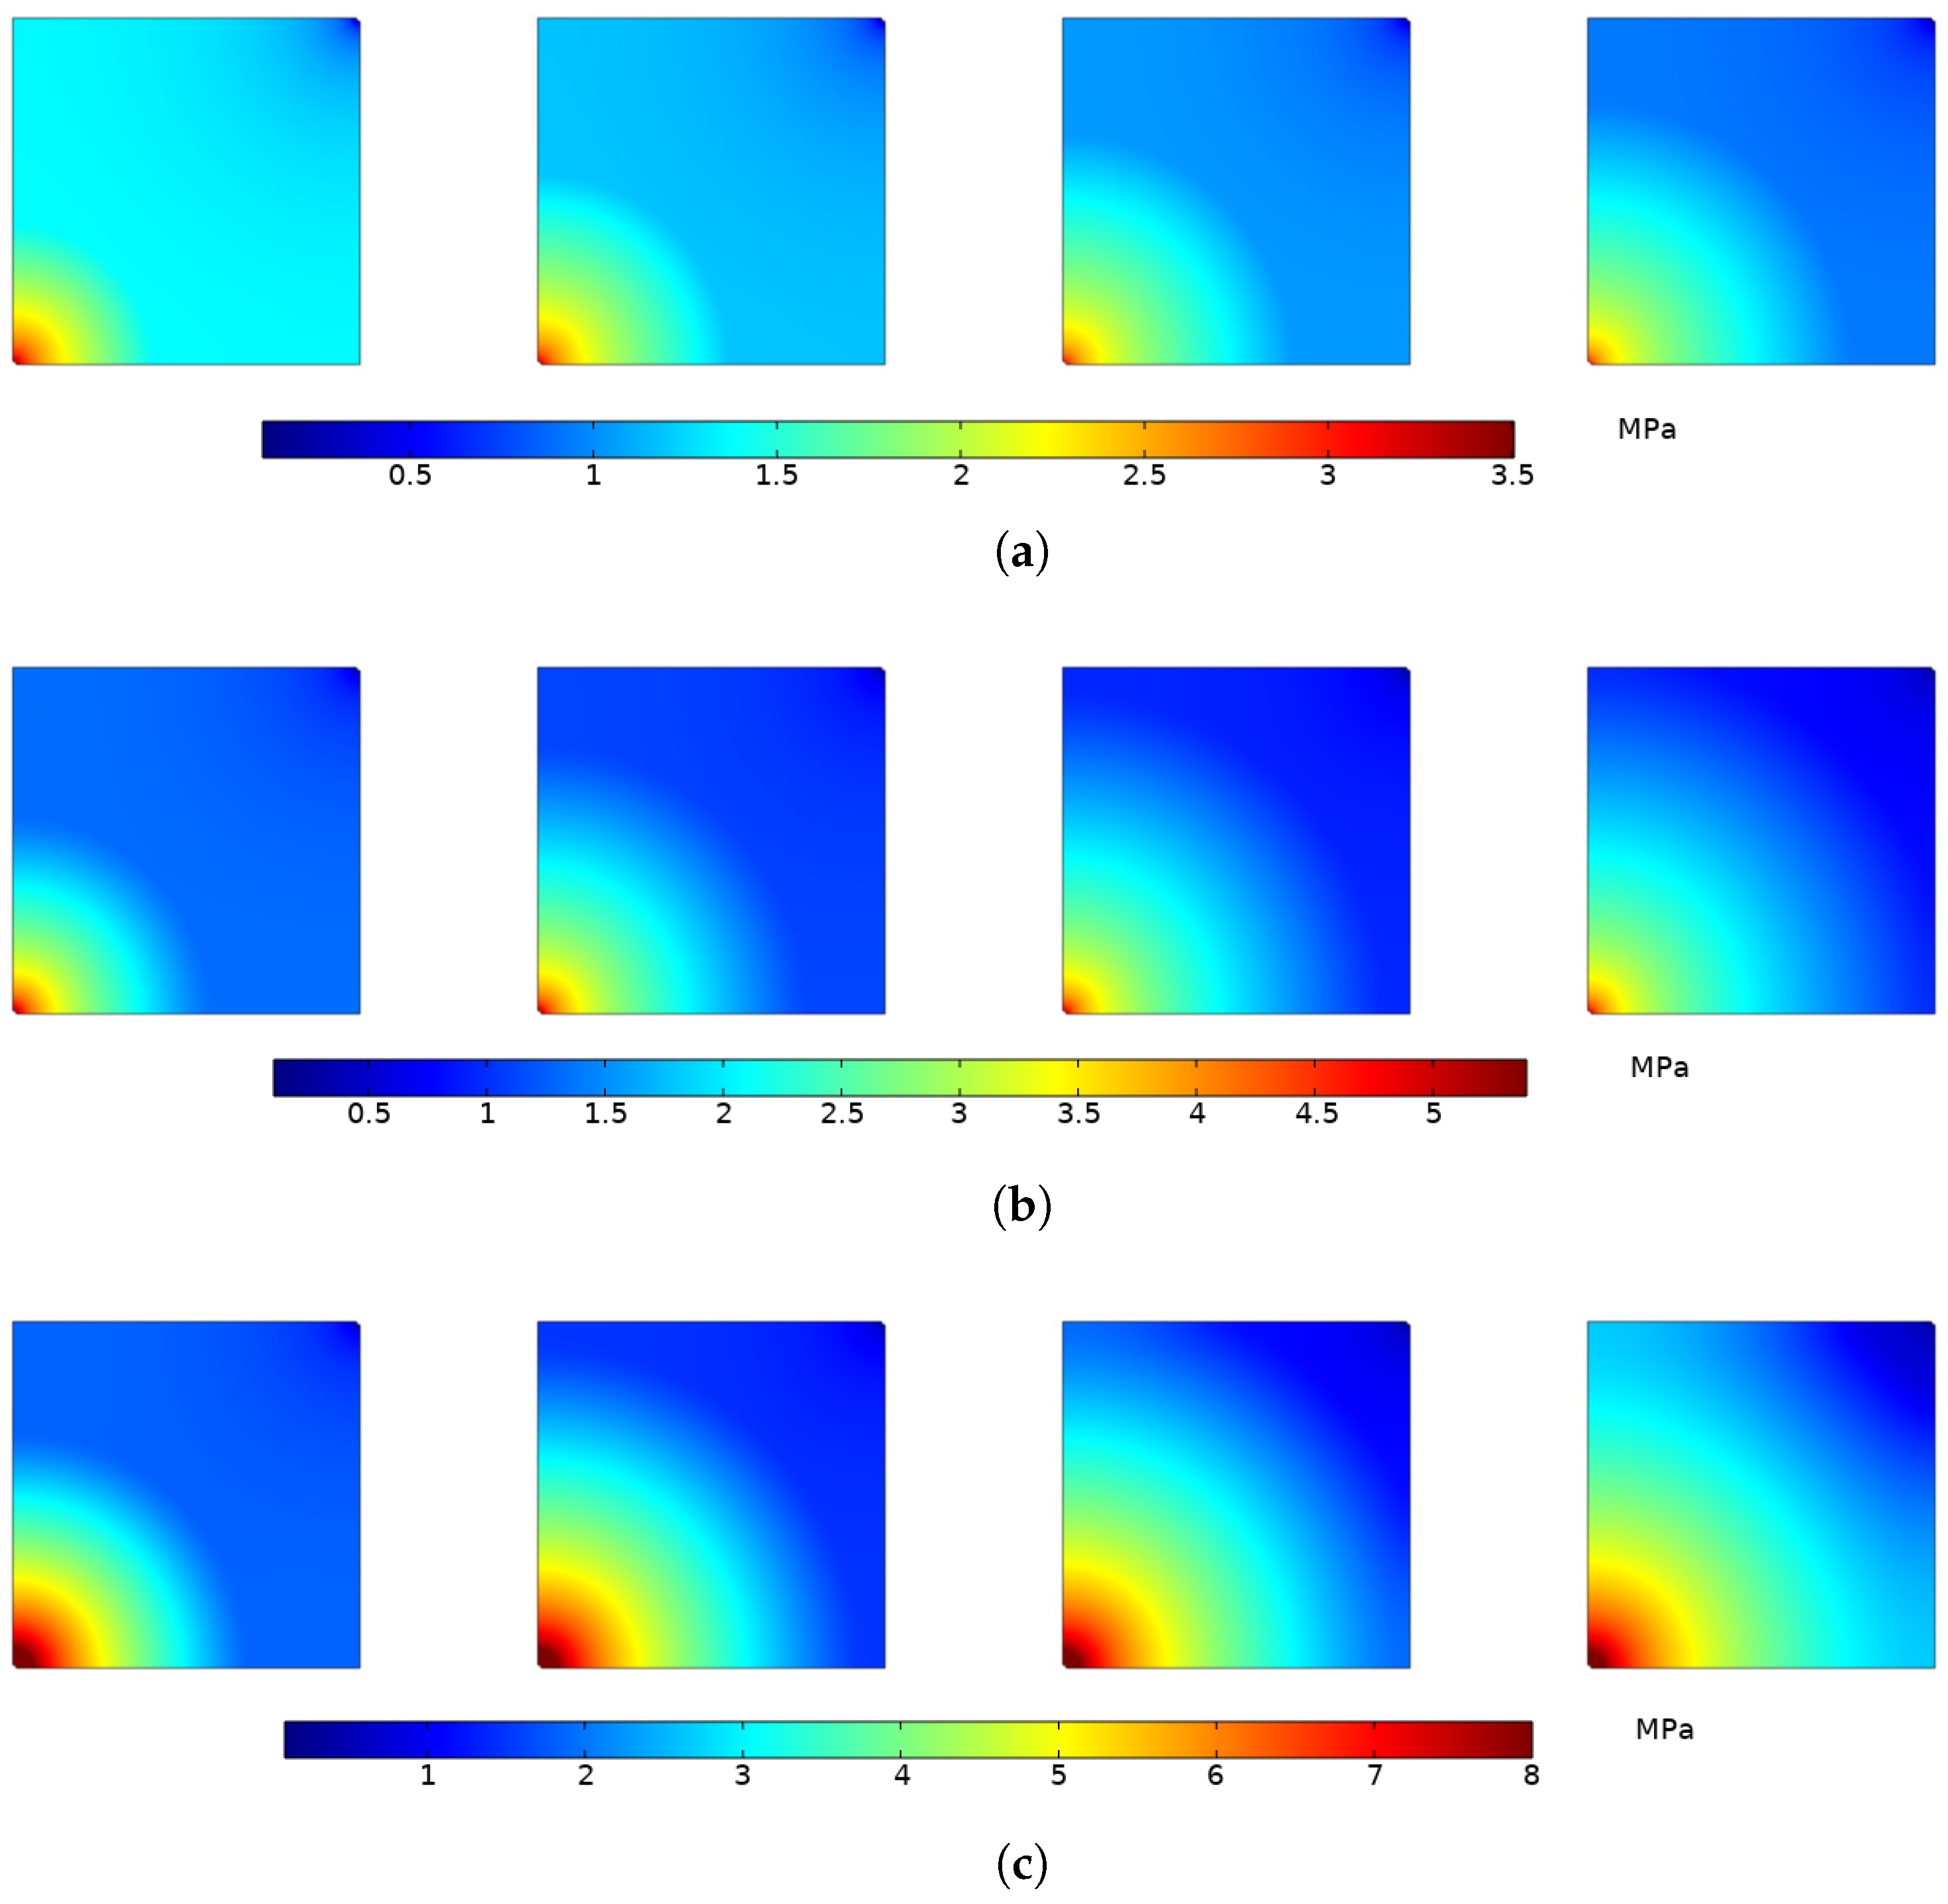
In the process of CO 2 -ECBM, the gas pressure continues to increase with time, and with the increase of injection pressure, the gas pressure in the reservoir changes more obviously (Figure 13). Especially in the early stage of gas injection, increasing the injection pressure can make the gas pressure in the reservoir increase rapidly in a short time, making CH 4 gas easier to produce. The pressure differential and concentration differential are the driving force of the seepage and diffusion of CO 2 and CH 4 in the coal seam. When CO 2 is injected, the reservoir pressure is greatly increased, and the pressure differential is also increased, which promotes the gas to flow and diffuse to the production well faster. This is one of the reasons why CO 2 injection can increase the production of coalbed methane.

4.2.2. Optimal Injection Pressure Selection

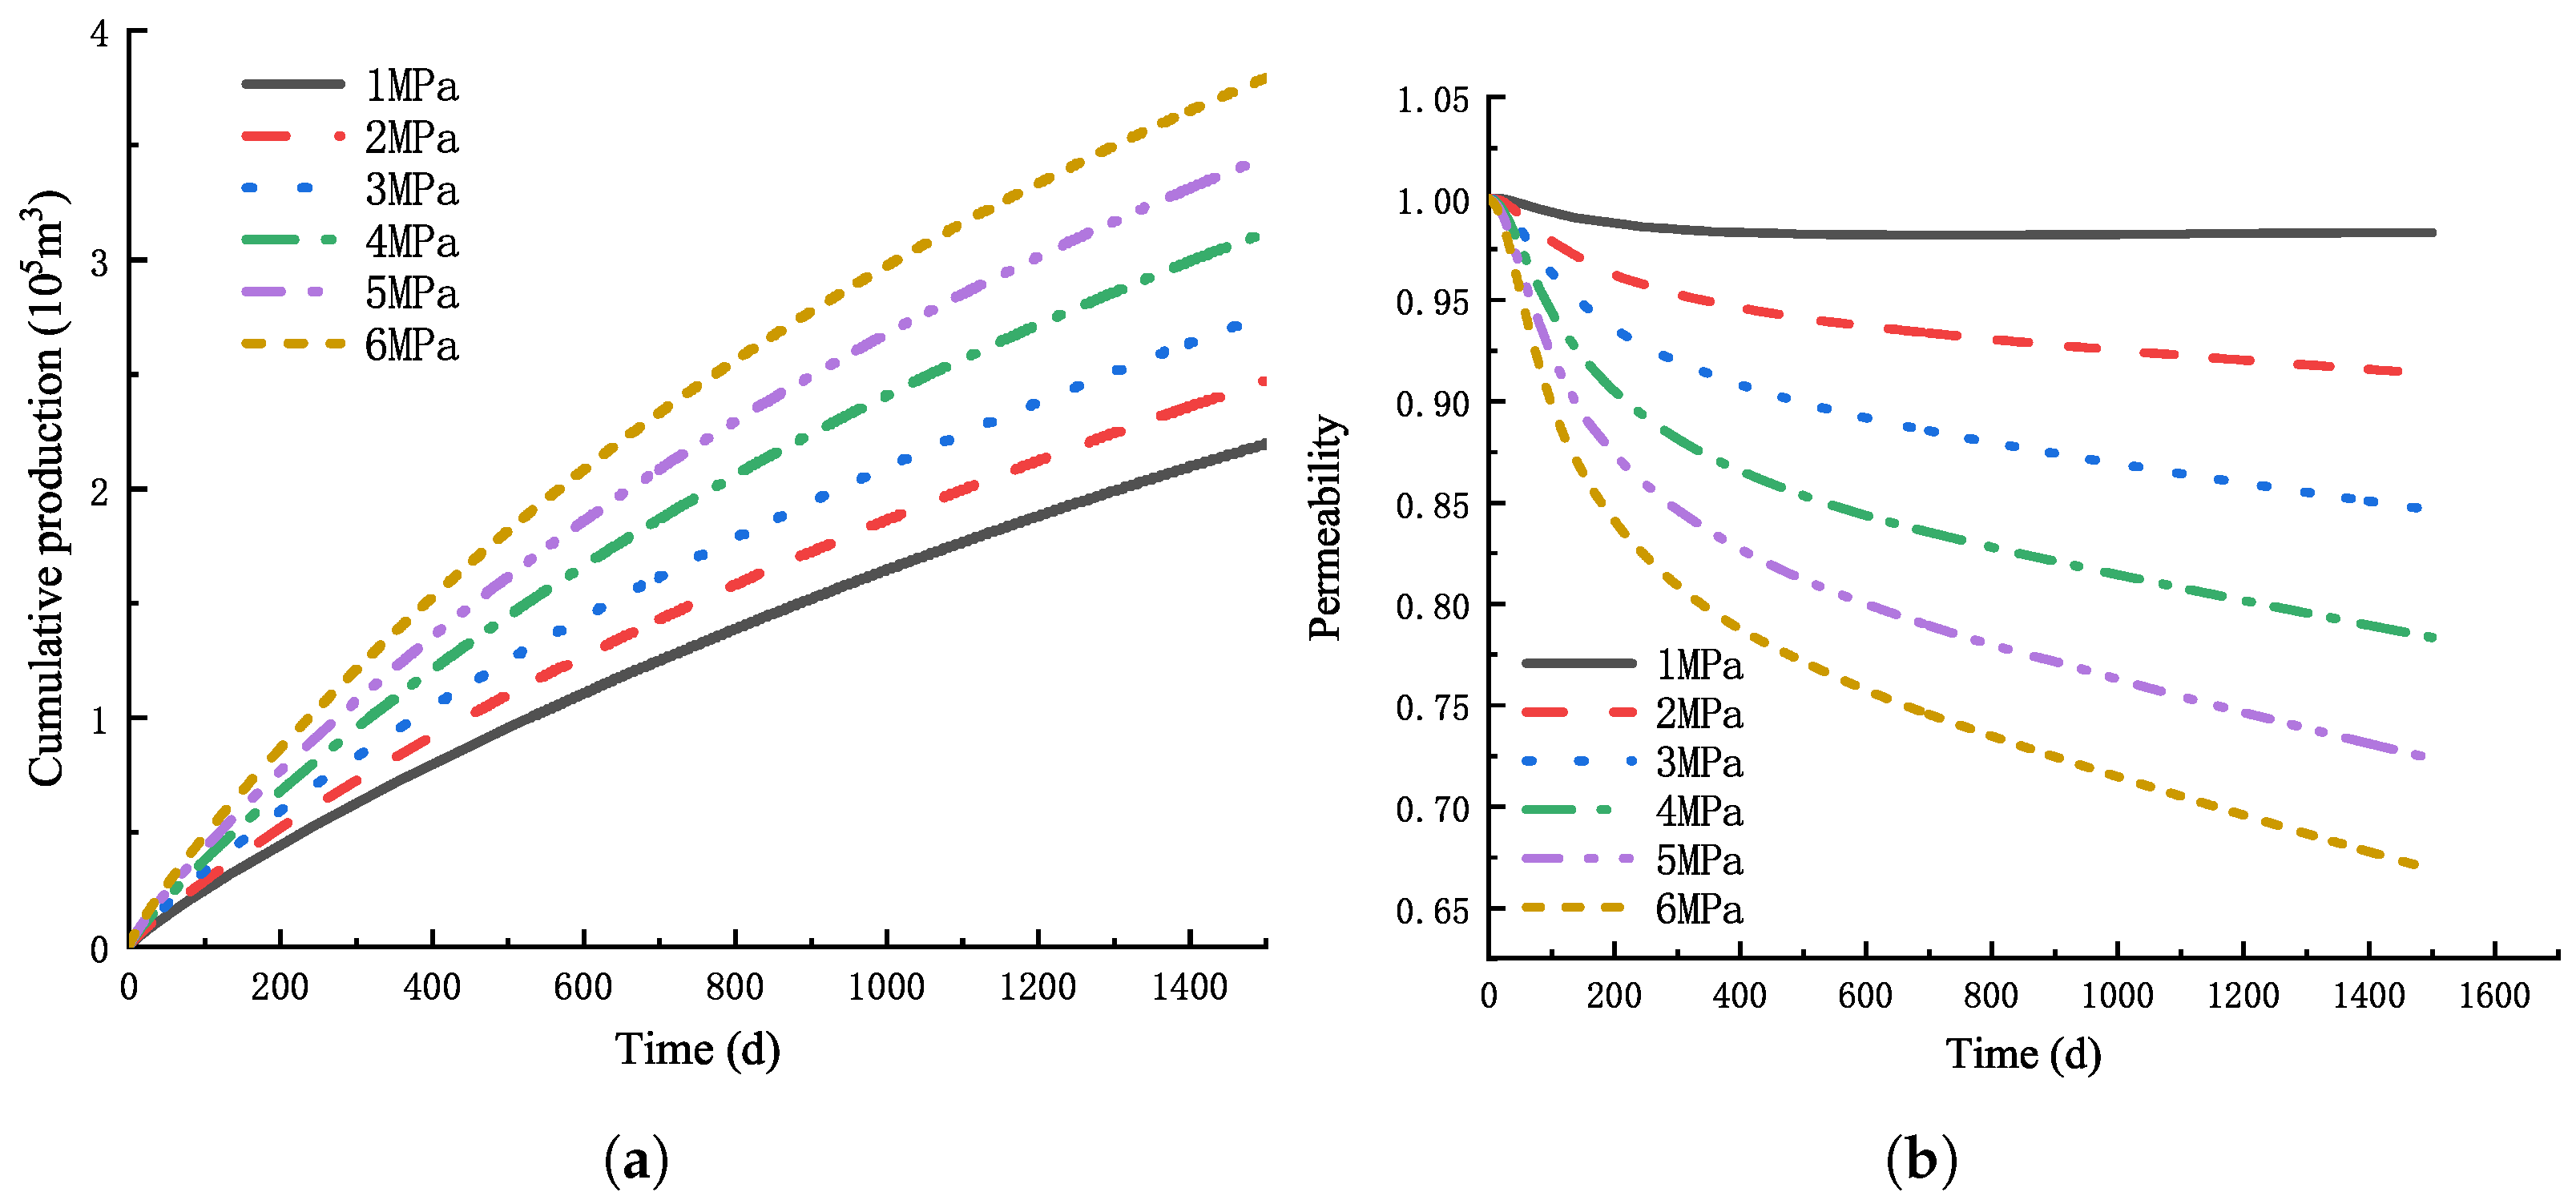
Figure 14a,b illustrate the distribution of cumulative production and point B’s permeability change during CO 2 injection exploitation under the pressure of 1 MPa to 6 MPa. The permeability near the injection well is lower than the initial permeability, and the permeability decreases with the increase of injection pressure at the same production time. This is because the increase of gas injection pressure will lead to the increase of reservoir adsorption amount, which will lead to the decrease of permeability. The decrease of permeability will limit the flow capacity of CO 2 and weaken the injection capacity. In this study, point B near the injection well is taken to analyze the change of reservoir permeability near the well when the injection pressure changes. It can be seen that when the injection pressure increases, the permeability of a point near the injection well decreases rapidly. When the injection pressure is 6 MPa, the reservoir permeability decreases by 0.6 times of the initial permeability. At the same time, as the injection pressure increases, the pressure differential in the reservoir increases, prompting faster gas seepage and diffusion, and CH 4 production will increase. When the injection pressure is 6 MPa, the CH 4 production increases to 3.79 × 10 5 m 3 , which is 75% higher than that when the injection pressure is 1 MPa.
In summary, increasing gas injection pressure can promote CH 4 production and CO 2 storage, but the increase of gas injection pressure will also lead to rapid attenuation of near-well reservoir permeability, resulting in the weakening of injection capacity. We analyzed the change rate of CH 4 production. The peak value of the change rate of CH 4 production was 0.153 at 3 MPa, indicating that the injection pressure continued to increase after the displacement pressure reached 3 MPa, and the recovery degree did not change much. Consequently, we can take 3 MPa as the optimal injection pressure in this case.

4.3. Effect of Different Injection Temperatures on CO 2 -ECBM

4.3.1. Variation of Reservoir Temperature

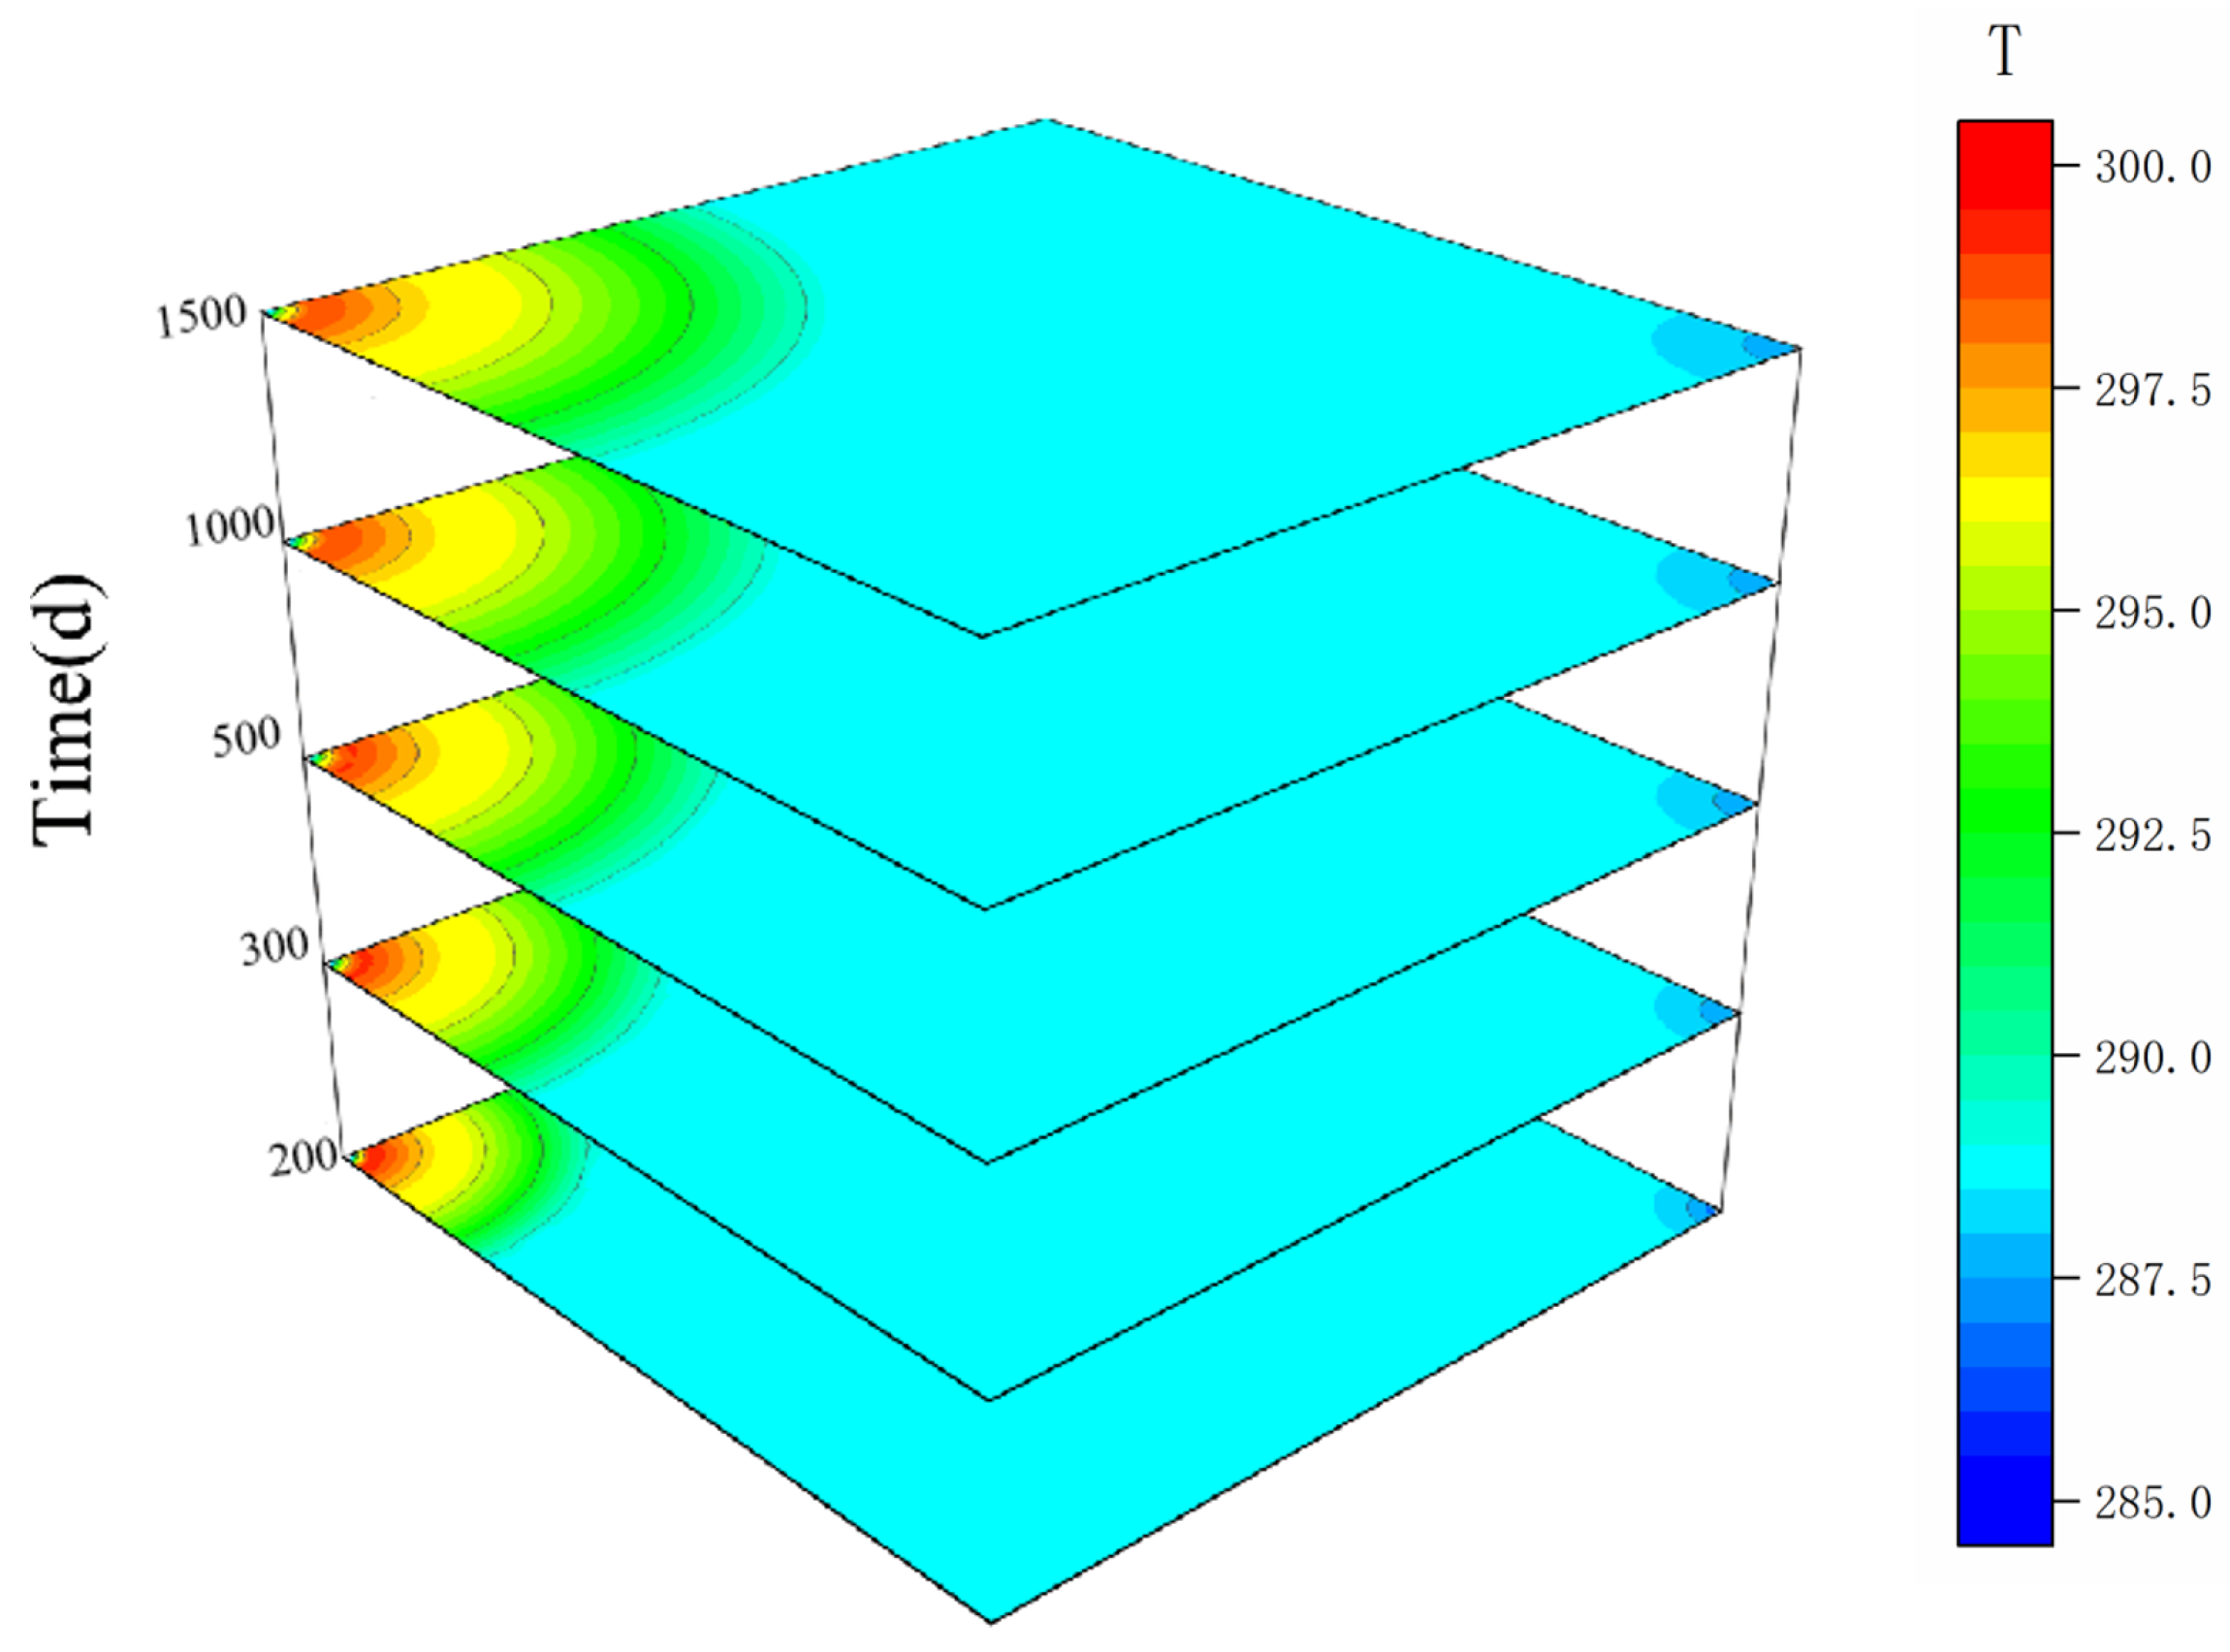
Figure 15 illustrates the reservoir temperature distribution. When the injection temperature is the same as the reservoir temperature, the temperature increases near the injection well due to the adsorption of CO 2 , and the temperature near the production well decreases due to CH 4 desorption. After the gas injection, CO 2 adsorption induced an exothermic effect and the reservoir temperature near the injection well rose sharply [48]. Meanwhile, the range affected by temperature gradually increased due to heat conduction. CH 4 desorption promoted a reduction in reservoir temperature near the production well.
In addition to the thermodynamic effect of Hydraulic-Mechanical interaction and the temperature effect of non-isothermal adsorption, the internal energy change in the reservoir also has the Thermal-Hydraulic coupling of the fluid itself caused by the change of CO 2 phase state, that is, the phenomenon of liquefaction exothermic and gasification endothermic [49]. In thermochemistry, it is the energy absorbed or released by a substance during a change of state (phase change) without a change in temperature that we call the latent heat of phase change. The heat which is required to melt a certain quantity of a solid at the melting point into a liquid at the same temperature is called the latent heat of fusion. The conversion of the liquid into vapour requires an amount of ‘latent heat’ which is generally much greater than the latent heat of fusion of the same substance [50]. In the process of CO 2 vaporization, the distance between molecules increases, the molecular force does negative work, and the molecular potential energy increases; where the molecular potential energy is the energy that molecules have with respect to their relative positions due to the mutual forces that exist between them. This process may release or absorb large amounts of heat, but this phenomenon has not been considered in this and previous studies.

4.3.2. Effect of Temperature on CH 4 Production and CO 2 Storage

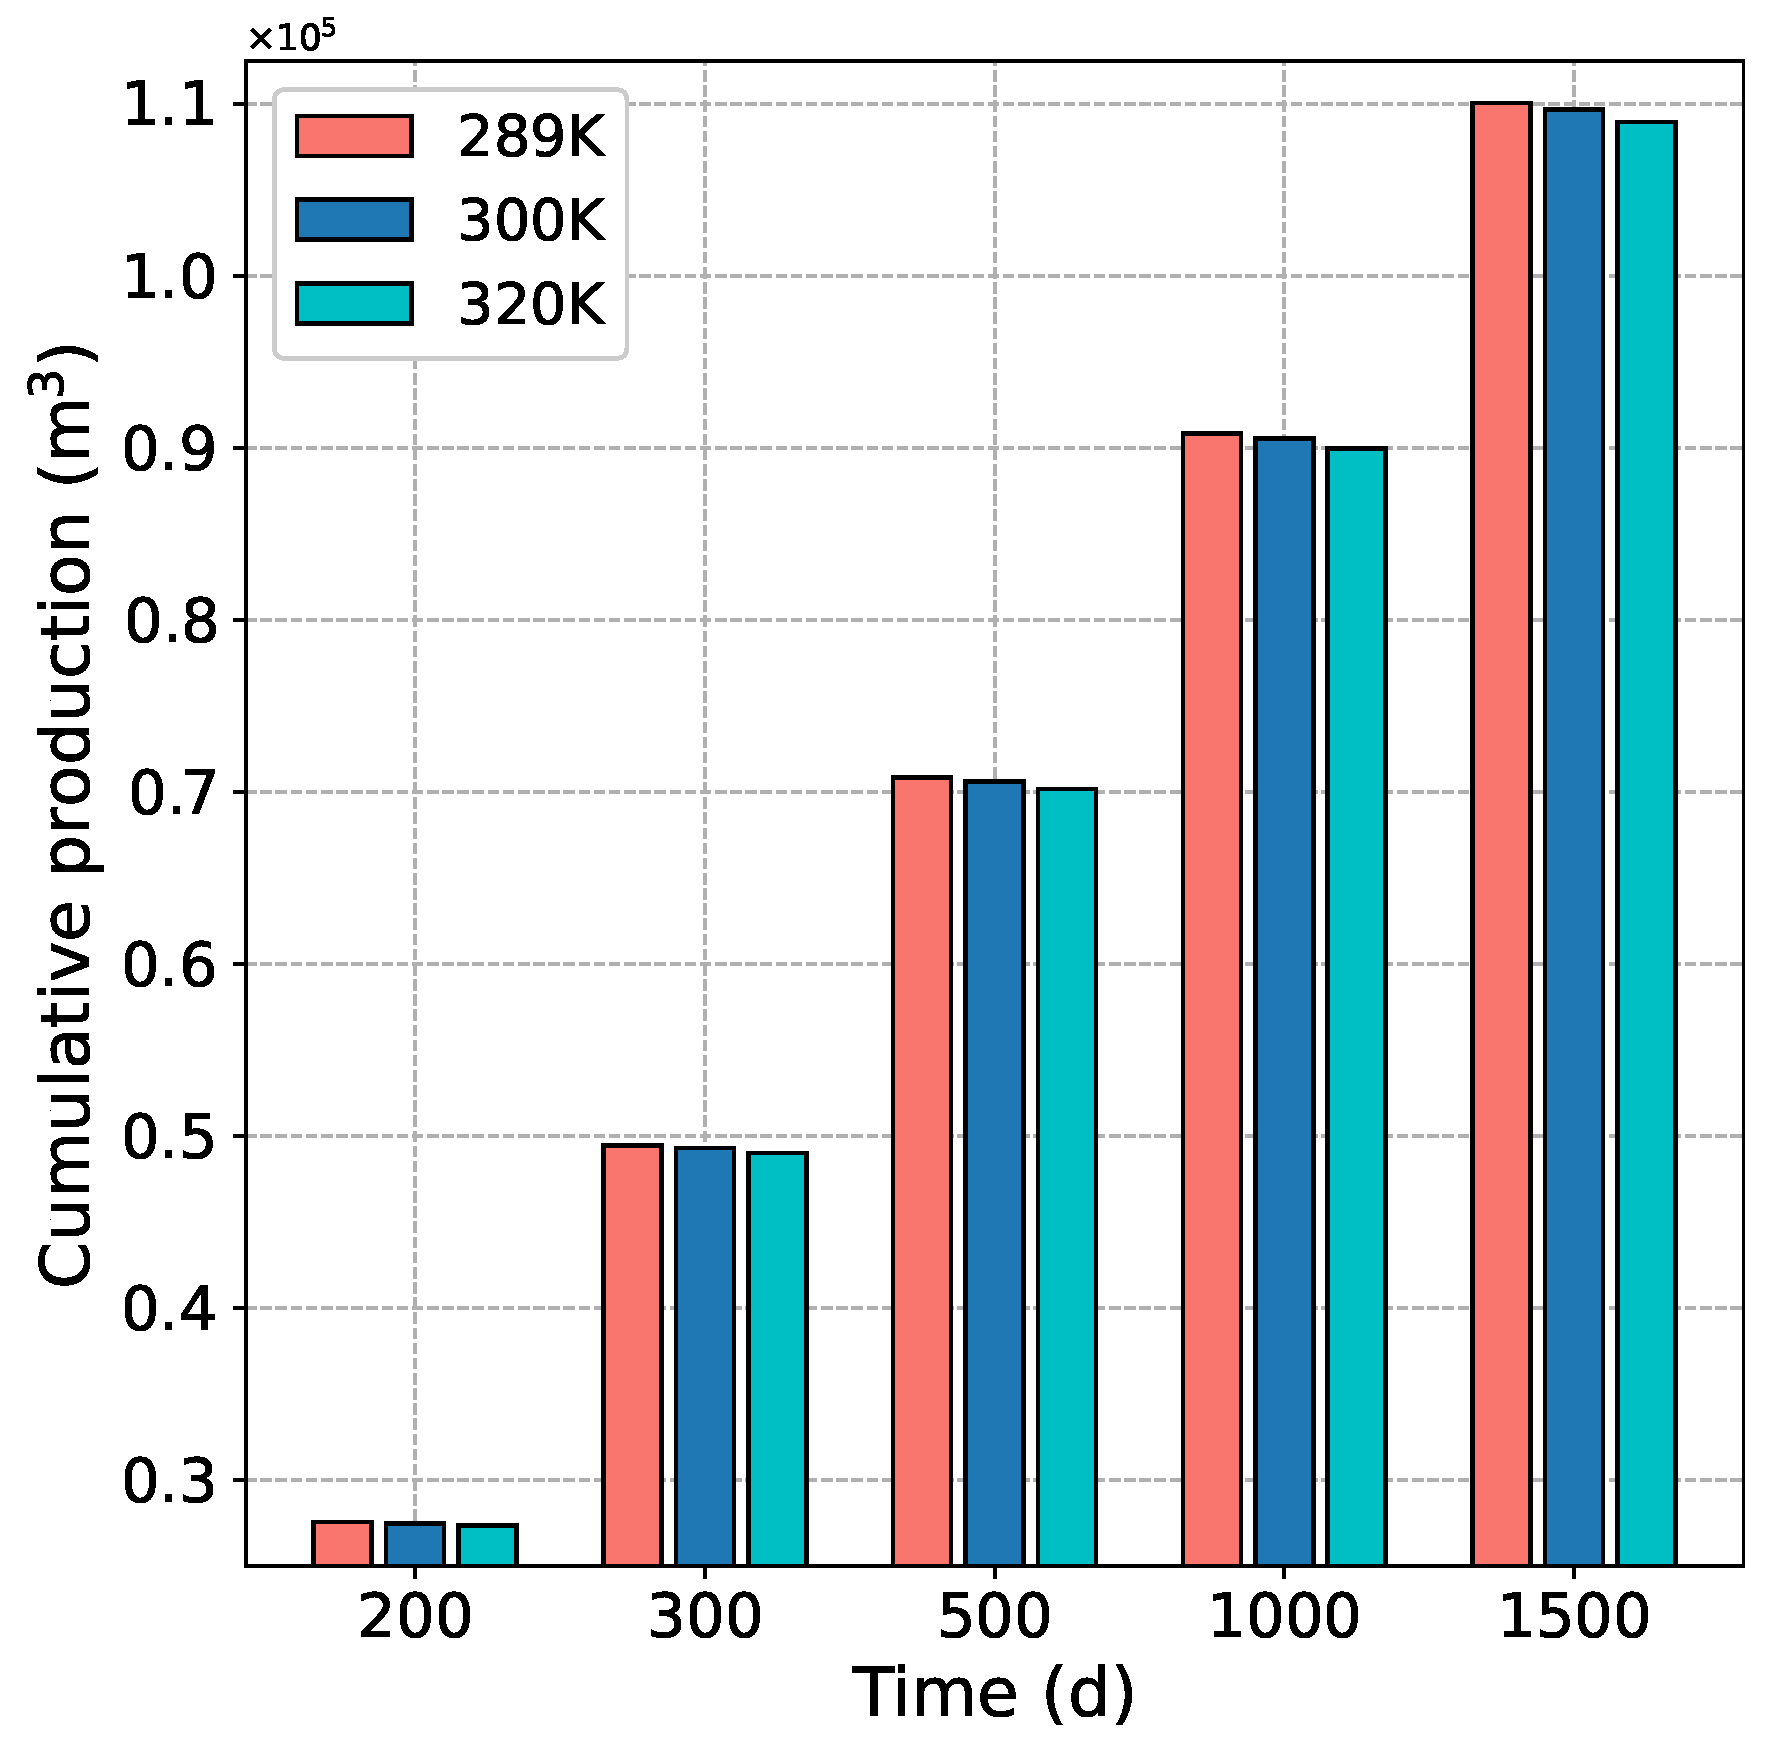
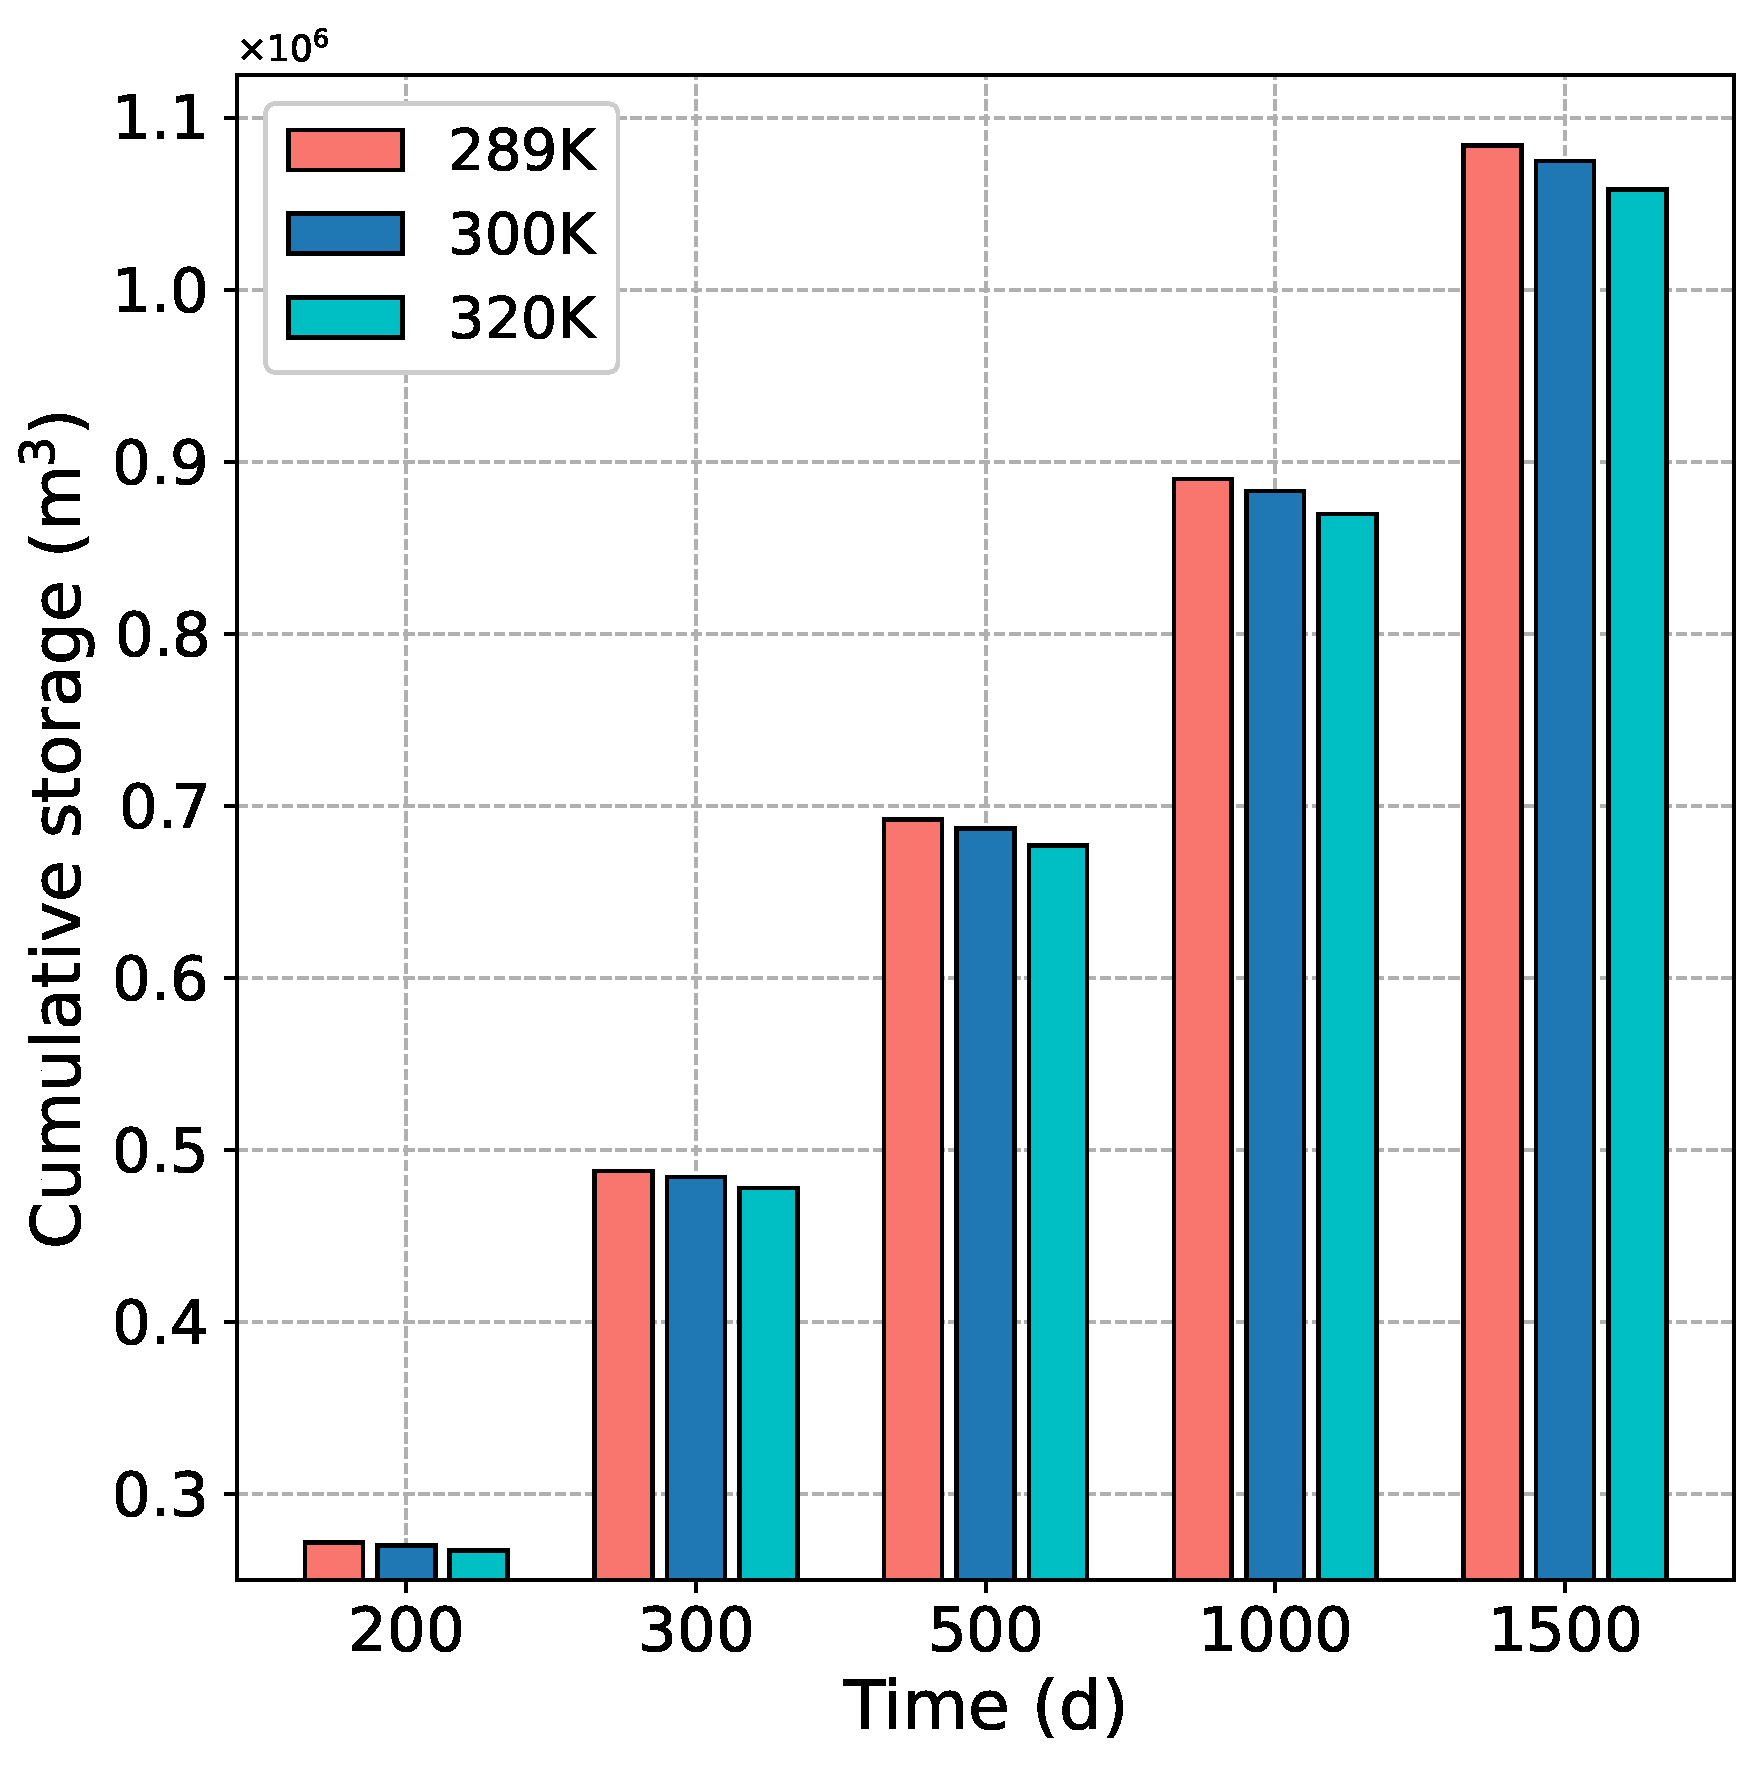
Figure 16 and Figure 17 illustrate the CH 4 cumulative production and CO 2 cumulative storage of three different temperatures. It is clear that increasing the injection temperature will reduce CH 4 production and CO 2 sequestration. Based on the adsorption potential theory, the increase in temperature has a negative impact on the adsorption of CO 2 and CH 4 in the coal seam, that is, the lower the temperature, the higher the amount of CO 2 and CH 4 adsorbed by coal [9]. Meanwhile, with the increase in temperature, the main reason for the decrease in the ability of CO 2 to replace CH 4 is that the change rate of CO 2 potential energy and diffusion capacity is more significant than that of CH 4 , resulting in the decrease of the amount of CO 2 adsorbed by coal seam [10].

5. Conclusions

This paper combines the specific engineering parameters of the CSEMP shallow low-rank coal project and establishes a coupled Thermal-Hydraulic-Mechanical model, which achieves the dynamic evolution of fluid physical parameters and is of great interest as a new guide for the preliminary design of subsequent CO 2 -ECBM projects based on shallow low-rank coal. Based on COMSOL Multi-physics software, the finite element method is used to solve the multi-physical field coupling. The following conclusions are obtained:
  • During direct mining, the reservoir pressure shows a downward trend, and the downward trend gradually slows down and tends to be stable. During CO 2 injection, the reservoir pressure increases with time, increases rapidly at the initial stage and gradually tends to be stable. The injection of CO 2 has a significant enhancement effect on coalbed methane extraction.
  • For direct mining, the increase in permeability caused by matrix shrinkage deformation dominates, and the reservoir permeability gradually increases with time, and the closer to the production well, the greater the permeability. For CO 2 injection, the volumetric strain effect caused by adsorption and desorption is dominant in both production wells and injection wells. The permeability near the injection well decreases rapidly and the permeability near the production well increases.
  • Increasing the gas injection pressure can promote the production of CH 4 and the storage of CO 2 , but the increase of gas injection pressure will also lead to the rapid attenuation of near-well reservoir permeability and the weakening of injection capacity. When the gas injection pressure reaches 3MPa, the injection pressure continues to increase, and the recovery degree does not change much.
  • When the injection temperature increases, the CO 2 concentration is relatively reduced, and the replacement effect of CH 4 is weakened, resulting in a slight decrease in CBM production and CO 2 burial stock.

6. Future Work

For future works, the different data that have been yielded by the several adopted approaches can be integrated into a supervised learning process. This artificial intelligence technique has been extensively used to describe geological assets [51,52,53,54,55]. It shows its strength by combining different correlated factors and seek their contribution towards the investigated phenomena.

Author Contributions

Conceptualization, H.L., Q.M., K.J. and F.H.; Formal analysis, H.L. and Q.M.; Funding acquisition, H.L.; Investigation, H.L. and Q.M.; Methodology, H.L. and Q.M.; Software, Q.M.; Supervision, H.L.; Validation, Q.M.; Visualization, Q.M. and F.H.; Writing—original draft, H.L., Q.M. and K.J.; Writing—review & editing, H.L. All authors have read and agreed to the published version of the manuscript.

Funding

This research received no external funding.

Institutional Review Board Statement

Not applicable.

Informed Consent Statement

Not applicable.

Data Availability Statement

Not applicable.

Acknowledgments

This study is supported by Open Research Fund of State Key Laboratory of Geomechanics and Geotechnical Engineering, Institute of Rock and Soil Mechanics, Chinese Academy of Sciences, Grant NO. SKLGME021021. The authors thank the support from Ministry of Science and Technology of China through High-end Foreign Specialist Introduction Program with project Grant NO. G2021127005L. The authors thank the support from Fundamental Research Funds for the Central Universities with project Grant NO. DUT20GJ204. This study is supported by Key Laboratory of Deep Earth Science and Engineering (Sichuan University), Ministry of Education, Grant NO. DUSEYU202303.

Conflicts of Interest

The authors declare no conflict of interest.

References

  1. Yu, G.; Hao, T.; Zhu, J. Discussion on action strategies of China’s carbon peak and carbon neutrality. Bull. Chin. Acad. Sci. 2022, 37, 423–434. [Google Scholar]
  2. Yao, J.; Han, H.; Yang, Y.; Song, Y.; Li, G. A Review of Recent Progress of Carbon Capture, Utilization, and Storage (CCUS) in China. Appl. Sci. 2023, 13, 1169. [Google Scholar] [CrossRef]
  3. Sarkodie, S.A.; Strezov, V. Effect of foreign direct investments, economic development and energy consumption on greenhouse gas emissions in developing countries. Sci. Total Environ. 2019, 646, 862–871. [Google Scholar] [CrossRef]
  4. Adedoyin, F.F.; Gumede, M.I.; Bekun, F.V.; Etokakpan, M.U.; Balsalobre-Lorente, D. Modelling coal rent, economic growth and CO2 emissions: Does regulatory quality matter in BRICS economies? Sci. Total Environ. 2020, 710, 136284. [Google Scholar] [CrossRef]
  5. Xian, Z. The Application Prospect of CCUS in China under the Target of Carbon Neutrality. China Sustain. Trib. 2020, 12, 22–24. [Google Scholar]
  6. Zhao, X.; Liao, X.; He, L. The evaluation methods for CO2 storage in coal beds, in China. J. Energy Inst. 2016, 89, 389–399. [Google Scholar] [CrossRef]
  7. Shu, S.; Liu, L.; Wang, W. Theory and Evaluation of the Effectiveness of Deep Coalbed CO2 Geological Storage and Enhanced Coalbed Methane Development, 1st ed.; Science Press: Beijing, China, 2020. [Google Scholar]
  8. Dutka, B. CO2 and CH4 sorption properties of granular coal briquettes under in situ states. Fuel 2019, 247, 228–236. [Google Scholar] [CrossRef]
  9. Sun, X.; Yao, Y.; Liu, D. The behavior and efficiency of methane displaced by CO2 in different coals and experimental conditions. J. Nat. Gas Sci. Eng. 2021, 93, 104032. [Google Scholar] [CrossRef]
  10. Sijian, Z.; Shuxun, S.; Yanbin, Y.; Dameng, L.; Shiqi, L. Characterization of CO2 adsorption and displacement of methane in coals: An NMR relaxation method. Coal J. 2022, 47, 3738–3745. [Google Scholar] [CrossRef]
  11. Xu, Y.; Chen, X.; Yu, J. Experimental Study of the Radial Multi-Scale Dynamic Diffusion Model for Gas-Bearing Coal. Min. Miner. Depos. 2022, 16, 80–86. [Google Scholar] [CrossRef]
  12. Chen, L.; Zhao, M.; Li, X.; Liu, Y. Impact research of CH4 replacement with CO2 in hydrous coal under high pressure injection. Min. Miner. Depos. 2022, 16, 121–126. [Google Scholar] [CrossRef]
  13. Michael, G.; Anders, D.E.; Law, B.E. Geochemical Evaluation of Upper Cretaceous Fruitland Formation Coals, San Juan Basin, New Mexico and Colorado. Org. Geochem. 1993, 20, 475–498. [Google Scholar] [CrossRef]
  14. Morse, D.G.; Mastalerz, M.; Drobniak, A.; Rupp, J.A.; Harpalani, S. Variations in Coal Characteristics and Their Possible Implications for CO2 Sequestration: Tanquary Injection Site, Southeastern Illinois, USA. Int. J. Coal Geol. 2010, 84, 25–38. [Google Scholar] [CrossRef]
  15. Eble, C.F.; Greb, S.F. Palynologic, Petrographic and Geochemical Composition of the Vancleve Coal Bed in Its Type Area, Eastern Kentucky Coal Field, Central Appalachian Basin. Int. J. Coal Geol. 2016, 158, 1–12. [Google Scholar] [CrossRef]
  16. Botnen, L.S.; Fisher, D.W.; Dobroskok, A.A.; Bratton, T.R.; Greaves, K.H.; Robert McLendon, T.; Steiner, G.; Sorensen, J.A.; Steadman, E.N.; Harju, J.A. Field Test of CO2 Injection and Storage in Lignite Coal Seam in North Dakota. Energy Procedia 2009, 1, 2013–2019. [Google Scholar] [CrossRef] [Green Version]
  17. Pashin, J.C.; Clark, P.E.; McIntyre-Redden, M.R.; Carroll, R.E.; Esposito, R.A.; Oudinot, A.Y.; Koperna, G.J. SECARB CO2 Injection Test in Mature Coalbed Methane Reservoirs of the Black Warrior Basin, Blue Creek Field, Alabama. Int. J. Coal Geol. 2015, 144–145, 71–87. [Google Scholar] [CrossRef] [Green Version]
  18. He, Q.; Mohaghegh, S.D.; Gholami, V. A Field Study on Simulation of CO2 Injection and ECBM Production and Prediction of CO2 Storage Capacity in Unmineable Coal Seam. J. Pet. Eng. 2013, 2013, 1–8. [Google Scholar] [CrossRef] [Green Version]
  19. Gentzis, T.; Goodarzi, F.; Cheung, F.; Laggoun-Défarge, F. Coalbed Methane Producibility from the Mannville Coals in Alberta, Canada: A Comparison of Two Areas. Int. J. Coal Geol. 2008, 74, 237–249. [Google Scholar] [CrossRef] [Green Version]
  20. Weniger, P.; Franců, J.; Hemza, P.; Krooss, B.M. Investigations on the Methane and Carbon Dioxide Sorption Capacity of Coals from the SW Upper Silesian Coal Basin, Czech Republic. Int. J. Coal Geol. 2012, 93, 23–39. [Google Scholar] [CrossRef]
  21. Fujioka, M.; Yamaguchi, S.; Nako, M. CO2-ECBM Field Tests in the Ishikari Coal Basin of Japan. Int. J. Coal Geol. 2010, 82, 287–298. [Google Scholar] [CrossRef]
  22. Wong, S.; Law, D.; Deng, X.; Robinson, J.; Kadatz, B.; Gunter, W.D.; Jianping, Y.; Sanli, F.; Zhiqiang, F. Enhanced Coalbed Methane and CO2 Storage in Anthracitic Coals—Micro-pilot Test at South Qinshui, Shanxi, China. Int. J. Greenh. Gas Control 2007, 1, 215–222. [Google Scholar] [CrossRef]
  23. Jianping, Y.; Zhang, B.; Wong, S. Test of and Evaluation on Elevation of Coalbed Methane Recovery Ratio by Injecting and Burying CO2 for 3#Coal Seam of North Section of Shizhuang, Qingshui Basin, Shanxi. Strateg. Study CAE 2012, 14, 38–44. [Google Scholar]
  24. Pan, Z.; Connell, L.; Shangzhi, M.; Sander, R.; Camilleri, M.; Down, D.I.; Carras, J.; Lu, M.; Xiaokang, F.; Wenzhong, Z.; et al. CO2 Injectivity in a Multi-lateral Horizontal Well in a Low Permeability Coal Seam: Results from a Field Trial. Energy Procedia 2013, 37, 5834–5841. [Google Scholar] [CrossRef] [Green Version]
  25. Vishal, V.; Singh, L.; Pradhan, S.P.; Singh, T.N.; Ranjith, P. Numerical modeling of Gondwana coal seams in India as coalbed methane reservoirs substituted for carbon dioxide sequestration. Energy 2013, 49, 384–394. [Google Scholar] [CrossRef]
  26. Siriwardane, H.J.; Bowes, B.D.; Bromhal, G.S.; Gondle, R.K.; Wells, A.W.; Strazisar, B.R. Modeling of CBM production, CO2 injection, and tracer movement at a field CO2 sequestration site. Int. J. Coal Geol. 2012, 96, 120–136. [Google Scholar] [CrossRef]
  27. Wu, Y.; Liu, J.; Elsworth, D.; Chen, Z.; Connell, L.; Pan, Z. Dual Poroelastic Response of a Coal Seam to CO2 Injection. Int. J. Greenh. Gas Control 2010, 4, 668–678. [Google Scholar] [CrossRef]
  28. Yongkang, W. Experiment and Numerical Simulation Analysis of Displacing CH4 by CO2 Injection. Master’s Thesis, China University of Mining & Technology, Beijing, China, 2016. [Google Scholar]
  29. Fang, H.H.; Sang, S.X.; Liu, S.Q. Numerical simulation of enhancing coalbed methane recovery by injecting CO2 with heat injection. Pet. Sci. 2019, 16, 32–43. [Google Scholar] [CrossRef] [Green Version]
  30. Fang, H.; Sang, S.; Liu, S. Establishment of dynamic permeability model of coal reservoir and its numerical simulation during the CO2-ECBM process. J. Pet. Sci. Eng. 2019, 179, 885–898. [Google Scholar] [CrossRef]
  31. Kumar, H.; Elsworth, D.; Mathews, J.P.; Liu, J.; Pone, D. Effect of CO2 injection on heterogeneously permeable coalbed reservoirs. Fuel 2014, 135, 509–521. [Google Scholar] [CrossRef]
  32. Wang, G.; Wang, K.; Jiang, Y.; Wang, S. Reservoir permeability evolution during the process of CO2-enhanced coalbed methane recovery. Energies 2018, 11, 2996. [Google Scholar] [CrossRef] [Green Version]
  33. Gang, B.A.I.; Xihua, Z.; Shiping, W.E.I.; Chaojun, F.A.N.; Xueming, L.I. Simulation and Test of Enhancement of Gas Drainage through CO2 Injection into Coal Seam of Low Permeability. Coal Geol. Explor. 2019, 47, 77–84. [Google Scholar]
  34. Su, E.; Liang, Y.; Zou, Q.; Xu, M.; Sasmito, A.P. Numerical analysis of permeability rebound and recovery during coalbed methane extraction: Implications for CO2 injection methods. Process. Saf. Environ. Prot. 2021, 149, 93–104. [Google Scholar] [CrossRef]
  35. Yudong, H.; Saipeng, H.; Jian, H.; Xingbin, L.; Lianfu, H.; Changfeng, F. Numerical Simulation of the Effect of Injected CO2 Temperature and Pressure on CO2-Enhanced Coalbed Methane. Appl. Sci. 2020, 10, 1385. [Google Scholar] [CrossRef] [Green Version]
  36. Zhang, J.; Huang, Y. Some Suggestions on the Construction of an Integrated Gas Supply Security Index in China. Nat. Gas Ind. 2015, 35, 125–128. [Google Scholar] [CrossRef]
  37. Chen, Z.; Liu, J.; Elsworth, D.; Connell, L.D.; Pan, Z. Impact of CO2 Injection and Differential Deformation on CO2 Injectivity under In-Situ Stress Conditions. Int. J. Coal Geol. 2010, 81, 97–108. [Google Scholar] [CrossRef]
  38. Yin, G.; Deng, B.; Li, M.; Zhang, D.; Wang, W.; Li, W.; Shang, D. Impact of Injection Pressure on CO2–Enhanced Coalbed Methane Recovery Considering Mass Transfer between Coal Fracture and Matrix. Fuel 2017, 196, 288–297. [Google Scholar] [CrossRef]
  39. Yin, G.Z.; Li, M.H.; Li, S.Z.; Li, W.P.; Yao, J.W.; Zhang, Q.G. 3D Numerical Simulation of Gas Drainage from Boreholes Based on Solid Gas Coupling Model of Coal Containing Gas. J. China Coal Soc. 2013, 38, 535–541. [Google Scholar]
  40. Fan, Y.; Deng, C.; Zhang, X.; Li, F.; Wang, X.; Qiao, L. Numerical Study of CO2-enhanced Coalbed Methane Recovery. Int. J. Greenh. Gas Control 2018, 76, 12–23. [Google Scholar] [CrossRef]
  41. Tao, Y.; Xu, J.; Cheng, M.; Li, S.; Peng, S. Theoretical Analysis and Experimental Study on Permeability of Gas-Bearing Coal. Yanshilixue Yu Gongcheng Xuebao/Chin. J. Rock Mech. Eng. 2009, 28, 3363–3370. [Google Scholar]
  42. Kong, X.; Wang, E.; Liu, Q.; Li, Z.; Li, D.; Cao, Z.; Niu, Y. Dynamic Permeability and Porosity Evolution of Coal Seam Rich in CBM Based on the Flow-Solid Coupling Theory. J. Nat. Gas Sci. Eng. 2017, 40, 61–71. [Google Scholar] [CrossRef]
  43. Chilingar, G.V. Relationship Between Porosity, Permeability, and Grain-Size Distribution of Sands and Sandstones. In Developments in Sedimentology; Deltaic and Shallow Marine Deposits; van Straaten, L.M.J.U., Ed.; Elsevier: Amsterdam, The Netherlands, 1964; Volume 1, pp. 71–75. [Google Scholar] [CrossRef]
  44. Lemmon, E.W.; Huber, M.L.; McLinden, M.O. NIST reference fluid thermodynamic and transport properties–REFPROP. NIST Stand. Ref. Database 2002, 23, v7. [Google Scholar]
  45. Gou, S.; Li, H.; Li, J.; Zhao, Y. Effective Means to Alleviate the Greenhouse Effect: Case Study of History Match Simulations on a Brief CO2 Injection into Less-Deep Low-Rank Coal Seams. Arab. J. Geosci. 2021, 14, 803. [Google Scholar] [CrossRef]
  46. Niu, Q.; Cao, L.; Sang, S.; Zhou, X.; Wang, W.; Yuan, W.; Ji, Z.; Wang, H.; Nie, Y. Study on the anisotropic permeability in different rank coals under influences of supercritical CO2 adsorption and effective stress and its enlightenment for CO2 enhance coalbed methane recovery. Fuel 2020, 262, 116515. [Google Scholar] [CrossRef]
  47. Palmer, I.; Mansoori, J. How permeability depends on stress and pore pressure in coalbeds: A new model. In Proceedings of the SPE Annual Technical Conference and Exhibition, Denver, CO, USA, 6–9 October 1996. [Google Scholar]
  48. Gao, T.; Zhao, D.; Wang, C.; Feng, Z. Energy variation in coal samples with different particle sizes in the process of adsorption and desorption. J. Pet. Sci. Eng. 2020, 188, 106932. [Google Scholar] [CrossRef]
  49. Perrot, P. A to Z of Thermodynamics; Oxford University Press: Oxford, UK, 1994. [Google Scholar]
  50. Maxwell, J.C. Theory of Heat; Longmans, Green, and Company: Harlow, UK, 1872. [Google Scholar]
  51. Younes, K.; Grasset, L. Comparison of thermochemolysis and classical chemical degradation and extraction methods for the analysis of carbohydrates, lignin and lipids in a peat bog. J. Anal. Appl. Pyrolysis 2018, 134, 61–72. [Google Scholar] [CrossRef]
  52. Younes, K.; Grasset, L. Analysis of molecular proxies of a peat core by thermally assisted hydrolysis and methylation-gas chromatography combined with multivariate analysis. J. Anal. Appl. Pyrolysis 2017, 124, 726–732. [Google Scholar] [CrossRef]
  53. Younes, K.; Laduranty, J.; Descostes, M.; Grasset, L. Molecular biomarkers study of an ombrotrophic peatland impacted by an anthropogenic clay deposit. Org. Geochem. 2017, 105, 20–32. [Google Scholar] [CrossRef]
  54. Younes, K.; Grasset, L. The application of DFRC method for the analysis of carbohydrates in a peat bog: Validation and comparison with conventional chemical and thermochemical degradation techniques. Chem. Geol. 2020, 545, 119644. [Google Scholar] [CrossRef]
  55. Younes, K.; Grasset, L. Carbohydrates as proxies in ombrotrophic peatland: DFRC molecular method coupled with PCA. Chem. Geol. 2022, 606, 120994. [Google Scholar] [CrossRef]
Figure 1. CH 4 (a) density, (b) specific heat capacity, (c) thermal conductivity and (d) dynamic viscosity as a function of pressure/temperature.
Applsci 13 02592 g001
Figure 2. CO 2 (a) density, (b) specific heat capacity, (c) thermal conductivity and (d) dynamic viscosity as a function of pressure/temperature.
Applsci 13 02592 g002
Figure 3. T-H-M coupling relationship.
Applsci 13 02592 g003
Figure 4. Verify Model Meshing Diagram.
Applsci 13 02592 g004
Figure 5. History match of CH 4 production rate during primary CBM recovery.
Applsci 13 02592 g005
Figure 6. Numerical simulation model for C O 2 - E C B M .
Applsci 13 02592 g006
Figure 7. 300 days, 500 days, 1000 days, 1500 days reservoir pressure distribution cloud (a) C B M (b) C O 2 - E C B M .
Applsci 13 02592 g007
Figure 8. Distribution curve of reservoir gas pressure along the model diagonal (a) C B M (b) C O 2 - E C B M .
Applsci 13 02592 g008
Figure 9. Variation curve of reservoir pressure at reference point B. (a) Comparison of C O 2 - E C B M and CBM (b) C O 2 , C H 4 partial pressure and total reservoir pressure of C O 2 - E C B M .
Applsci 13 02592 g009
Figure 10. 300 days, 500 days, 1000 days, 1500 days CH 4 content distribution cloud (a) C B M (b) C O 2 - E C B M .
Applsci 13 02592 g010
Figure 11. 300 days, 500 days, 1000 days, 1500 days (a) Distribution cloud diagram of adsorbed C H 4 in C B M (b) adsorption cloud diagram of adsorbed C H 4 in C O 2 - E C B M (c) adsorption cloud diagram of adsorbed C O 2 in C O 2 - E C B M .
Applsci 13 02592 g011
Figure 12. Distribution curve of reservoir permeability along the model diagonal (a) C B M (b) C O 2 - E C B M .
Applsci 13 02592 g012
Figure 13. 300 days, 500 days, 1000 days, 1500 days Reservoir pressure cloud diagram (a) The injection pressure is 2 MPa (b) The injection pressure is 4 MPa (c) The injection pressure is 6 MPa.
Applsci 13 02592 g013
Figure 14. (a): Cumulative production. (b): Permeability change at point B.
Applsci 13 02592 g014
Figure 15. Reservoir temperature distribution.
Applsci 13 02592 g015
Figure 16. Cumulative production comparison.
Applsci 13 02592 g016
Figure 17. Cumulative CO 2 storage comparison.
Applsci 13 02592 g017
Table 1. Existing CO 2 -ECBM field experiments.
CountryProjectBurial Depth (m)Coal RankPermeability (md)Reference
U.S.AAllison Unit, San Juan Basin945Bituminous coal30–150
Pump Canyon, San Juan Basin918Bituminous coal146–550[13]
Tanquary Farms test site, lllinois Basin274Bituminous coal2–7.0[14]
Virginia Central Appalachian Basin Coal Test427–671Bituminous coal5–20[15]
Lignite Field Validation Test, Williston Basin335Lignite1[16]
Black Warrior Basin Coal Test548 437 237Bituminous coal0.1–0.2 10–16[17]
Marshall County project, Northern Appalachian Basin400–530Bituminous coal1[18]
Buchanan County, Central Appalachian Basin274–671Bituminous coal5–27
CanadaFBV 4A Micro-Pilot Test, Western Canada Sedimentary Basin Bituminous coal3.65[19]
ARC ECBM
CSEMP420Sub-Bituminous coal
PolandRECOPOL, upper Silesian coalbasin, Poland1012–1076Bituminous coal0.4–1.5[20]
JapanYubari field test, Ishikari Coal Basin, Japan890Bituminous coal1[21]
ChinaQinshui Basin ECBM 2004472Anthracite12.0/0.95[22]
Qinshui Basin ECBM 2010923Anthracite0.002–0.8[23]
APP ECBM, Ordos Basin560Bituminous coal0.64[24]
Qinshui Basin multiple wells972Anthracite0.002–0.8
Table 2. The correlation coefficient of the fitted equation for CH 4 .
CH 4 ρ 1 C g 1 λ g 1 μ 1
p 00 −12.081547−0.0066771.501 × 10 06
p 10 2.06 × 10 05 0.00020316.235 × 10 10 −1.858 × 10 14
p 01 0.04082.2820.00013613.206 × 10 08
p 20 1.205 × 10 13 2.65 × 10 11 3.108 × 10 16 9.262 × 10 20
p 11 −4.75 × 10 08 −4.981 × 10 07 4.881 × 10 14 4.895 × 10 16
p 30 -−1.045 × 10 19 1.269 × 10 24 2.735 × 10 28
p 21 -−7.677 × 10 14 −9.47 × 10 19 −2.724 × 10 22
R 2 0.99990.99950.99990.9999
Table 3. The correlation coefficient of the fitted equation for CO 2 .
CO 2 ρ 2 C g 2 λ g 2 μ 2
p 00 −1026781.6−0.006215.872 × 10 07
p 10 0.0002926−0.0009226−4.58 × 10 09 −6.52 × 10 13
p 01 8.730.19697.646 × 10 05 4.808 × 10 08
p 20 5.988 × 10 12 6.334 × 10 10 2.761 × 10 15 4.66 × 10 19
p 11 −1.027 × 10 06 3.455 × 10 06 1.745 × 10 11 2.529 × 10 15
p 30 -9.827 × 10 18 5.218 × 10 23 1.044 × 10 26
p 21 -−2.217 × 10 12 −9.643 × 10 18 −1.573 × 10 21
R 2 0.99930.98670.89250.9994
Table 4. Simulation program.
PlanModelCoupled ModeQuestion
A C B M H-M couplingEffect of C O 2 Injection on C B M Exploitation
C O 2 - E C B M H-M coupling
Binjection pressure: 2 MPaT-H-M couplingEffect of C O 2 Injection Pressure on C O 2 - E C B M
injection pressure: 4 MPa
injection pressure: 6 MPa
Cinjection temperature: 289 KT-H-M couplingThe effect of injection well temperature on C O 2 - E C B M
injection temperature: 300 K
injection temperature: 320 K
Table 5. Numerical simulation core parameters (refer to CSEMP project).
Parameter (Unit)ValueParameter (Unit)Value
Thermal expansion coefficienta (K 1 )2.4 × 10 5 Langmuir volumetric strain constant of CH 4 (-)0.0128
Universal gas constant (J/(K·mol))8.314Langmuir volumetric strain constant of CO 2 (-)0.0237
Initial porosity (-)0.08Langmuir pressure of CH 4 (MPa)3.82
Initial permeability of coalbed (mD)0.5Langmuir pressure of CO 2 (MPa)2.35
Density of coal (kg/m 3 )1785Langmuir volume constant of CH 4 (m 3 /kg)0.01237
Coalbed temperature (K)(289)Langmuir volume constant of CO 2 (m 3 /kg)0.04607
Specific heat capacity of coal (J/(K·kg))1255Hydrodynamic dispersion coefficient of CH 4 (m 2 /s)3.6 × 10 11
Initial coalbed pressure (MPa)1.6Hydrodynamic dispersion coefficient of CO 2 (m 2 /s)5.8 × 10 11
Thermal conductivity of coal (W/(m·K))0.12Bulk modulus of coal (MPa)2500
Poisson’s ratio0.25Bulk modulus of coal skeleton (MPa)8134
Disclaimer/Publisher’s Note: The statements, opinions and data contained in all publications are solely those of the individual author(s) and contributor(s) and not of MDPI and/or the editor(s). MDPI and/or the editor(s) disclaim responsibility for any injury to people or property resulting from any ideas, methods, instructions or products referred to in the content.