Article

Band Gap Analysis for Materials with Cookie-Shaped Auxetic Microstructures, Using Finite Elements

by
Dimitrios Chinis
and
Georgios E. Stavroulakis
*
School of Production Engineering and Management, Technical University of Crete, 73132 Chania, Greece
*
Author to whom correspondence should be addressed.
Appl. Sci. 2023, 13(5), 2774; https://doi.org/10.3390/app13052774
Submission received: 14 December 2022 / Revised: 16 February 2023 / Accepted: 16 February 2023 / Published: 21 February 2023
(This article belongs to the Special Issue Structural Design and Analysis for Constructions and Buildings)

Abstract

:

Featured Application

The production of materials with microstructures becomes feasible in view of additive manufacturing technology. Easily produced cookie-shaped auxetic microstructures are able to block the propagation of waves at specific frequencies, as is demonstrated here with extensive numerical models based on finite elements.

Abstract

Microstructures, including auxetic ones, influence the overall behavior of a material. Particularly during wave propagation, band gaps may appear. This study focuses on the discovery and analysis of the band gaps that occur in a material with auxetic microstructures of the cookie type, which have certain advantages with respect to production and fatigue resistance. Finite element analysis at a representative volume element, using Bloch theory, and verification with a plate made of microstructures at various assemblages has been used.

1. Introduction

Artificial structures and materials that exhibit better characteristics and mechanical properties than conventional, natural materials, are characterized as metamaterials. Thanks to the rapid development of additive manufacturing methodologies, the concept of metamaterials has expanded into a category of materials that focus on the internal shape of the structure. Materials of this category show an excellent performance in applications related to sound and vibration absorption, thermal insulation, electromagnetic applications, and wireless communications. The classical concept of mixtures, utilized in the design of composites, cannot be expanded to cover microstructures, especially in the study of wave propagation and band gaps.
Auxetic materials are the materials that belong in this category. The main characteristic of this type of materials is that they contract or expand, transversely, in the direction of the applied load, i.e., they have a negative Poisson ratio. In addition to the other interesting properties of auxetics that can be found, among others, in [1,2,3,4], they exhibit band gap properties [5,6,7,8,9,10,11]. In particular, star-shaped [10] and chiral [7,11] auxetics have been investigated with respect to the band gap properties. In the present study, following recent investigations [12], the existence of band gap regions inside a cookie-shaped auxetic structure has been studied with finite elements in order to examine whether it can be used as an insulator. Cookie-shaped microstructures that can be constructed easily and have a better performance with respect to the stress concentration and fatigue, compared with other auxetic microstructures, have been used.
For this study, first a representative volume element of the microstructure is examined by using finite elements and Bloch theory. After the identification of the band gaps, a grid of elements was constructed, imitating the continuum with the repetitive microstructures, and then force was applied at several different frequencies, in order to identify in which of them there is inconsistency for wave propagation. Numerical experiments have been performed using the finite elements analysis using COMSOL Multiphysics.
Although most of the literature reports that auxetic materials have superior properties when compared with conventional materials. and several patents have been issued, further investigation of auxetic properties suitable for real-life mechanical applications is needed. This study has been inspired by recent investigations of auxetics of similar complexity [13] in order to promote future research and application work.
The theoretical background is summarized in the next section. The numerical experiments for representative volume element and whole structure with various microstructures are presented in the last section.

2. State of the Art and Purpose of the Study

Classical composite materials are usually designed by using the rule of mixture, where the actual microstructure of inclusions within a matrix does not play a role. The response in dynamic excitation is much more complicated and, in general, cannot be described in a similar way. Classical composites are known to have band gap properties. Waves of certain frequencies are blocked and cannot be transmitted through the composite medium. Phononic band gaps in periodic cellular materials have been considered in various publications [14].
Furthermore, even in statics, some effects of composite materials cannot be captured by the simple method of mixtures. This is the case with auxetic materials, as the negative Poisson ratio cannot be discovered by using the rule of mixtures on two classical constituents with a positive Poisson ratio.
Various microstructures have been proposed for the explanation of auxetic behavior and subsequently for the optimal design of auxetics, these include, star-shaped [2,6,10,15,16,17] and chiral [7,11,18,19] hybrids, such as star-chiral [20], perforated continua [21], chiral [22,23] and mechanisms. Cookie-shaped microstructures have been proposed to explain the auxetic effect and have certain advantages [12]. They are easier to construct and they do not have sharp corners with stress concentrations and possible fatigue effects.
Further information on auxetics can be found in [1,2,3,4,21,22].
Similarly, continua with microstructures exhibit band gap properties. A band gap analysis of star-shaped honeycombs with varied Poisson’s ratios is studied in [15], which can be used as a seminal work for the optimal design with respect to the band gaps. Other auxetic microstructures have also been investigated with respect to band gap formation, see [7,12,16,22].
For the systematic study of wave propagation in composites, the works of Brillouin and Kittel [24,25] can be used. On a representative volume element (unit cell), all directions of wave propagation and all frequencies of interest must be considered. Wave propagation is defined by the conditions based on the Floquet theorem [26]. The propagation of the wave in two-dimensional periodic lattices is described in detail in [26]. The lattices are designed within a desired band by using the Floquet-Bloch principles in order to study the propagation of the wave in three regular honeycomb lattices. The results indicate the efficiency of the proposed method and provide the dispersion curves for the different 2-D topologies of the studied unit cells. The interaction of the microstructure and band gap formation is not straightforward. Classical or topology optimization can be used for the optimal design [27,28,29,30,31]. Further proposals to influence the band gap behavior have been published, based on contact [32] or nonlinear effects or prestressing [33]. The investigation of auxetics with strong circular inclusions in the present paper was inspired by these investigations.

3. Materials and Methods

In order to simulate the wave propagation in a two-dimensional periodic geometry, this study was based on the Bloch theorem. The representation of a structure in a two-dimensional space can be achieved with the reproduction of a unit cell along the length of three independent mesh vectors that control periodicity, denoted by α1, α2, α3. By utilizing finite element discretization, the discretized equations of the motion for the displacements of the unit cell have the following form:
M q ¨ + K q = F
Here, M and K denote the mass and stiffness matrices of the unit cell, q and q ¨ represent the displacement and the acceleration vector of nodes in the mesh, and F represents the forces applied to the nodes.
Periodicity conditions are added in the system of Equation (1) and subsequent systems by considering the additional kinematic constraints that prescribe equal displacements between the opposite boundaries of the periodic unit cell. These constraints can be realized with the help of Lagrange multipliers or other tools available in commercial finite element packages under the description of ‘multipoint constraints’.
Bloch analysis starts by assuming a harmonic excitation and subsequently solving for the amplitude of vibration q that, as a result, turns q ¨ into −ω2q; thus, Equation (1) takes the following form:
ω 2 M + K q = F
Replacing the displacements for the unit cell n 1 a 1 + n 2 a 2 with q n 1 , n 2 the requirement is to find a solution that has the following property:
q n 1 , n 2 = e k , n 1 a 1 + n 2 a 2 q 0 ,
where k , n 1 a 1 + n 2 a 2 describes the general form of the transmission constant. Most of the published studies utilize Equation (1) for cases with eigenvalues. With ω, we represent the eigenvalue for the transmission frequency, and it is a function on M, K, and the wave vector k. The given relations are valid for two-dimensional models and can be extended to three-dimensional ones in an obvious way.

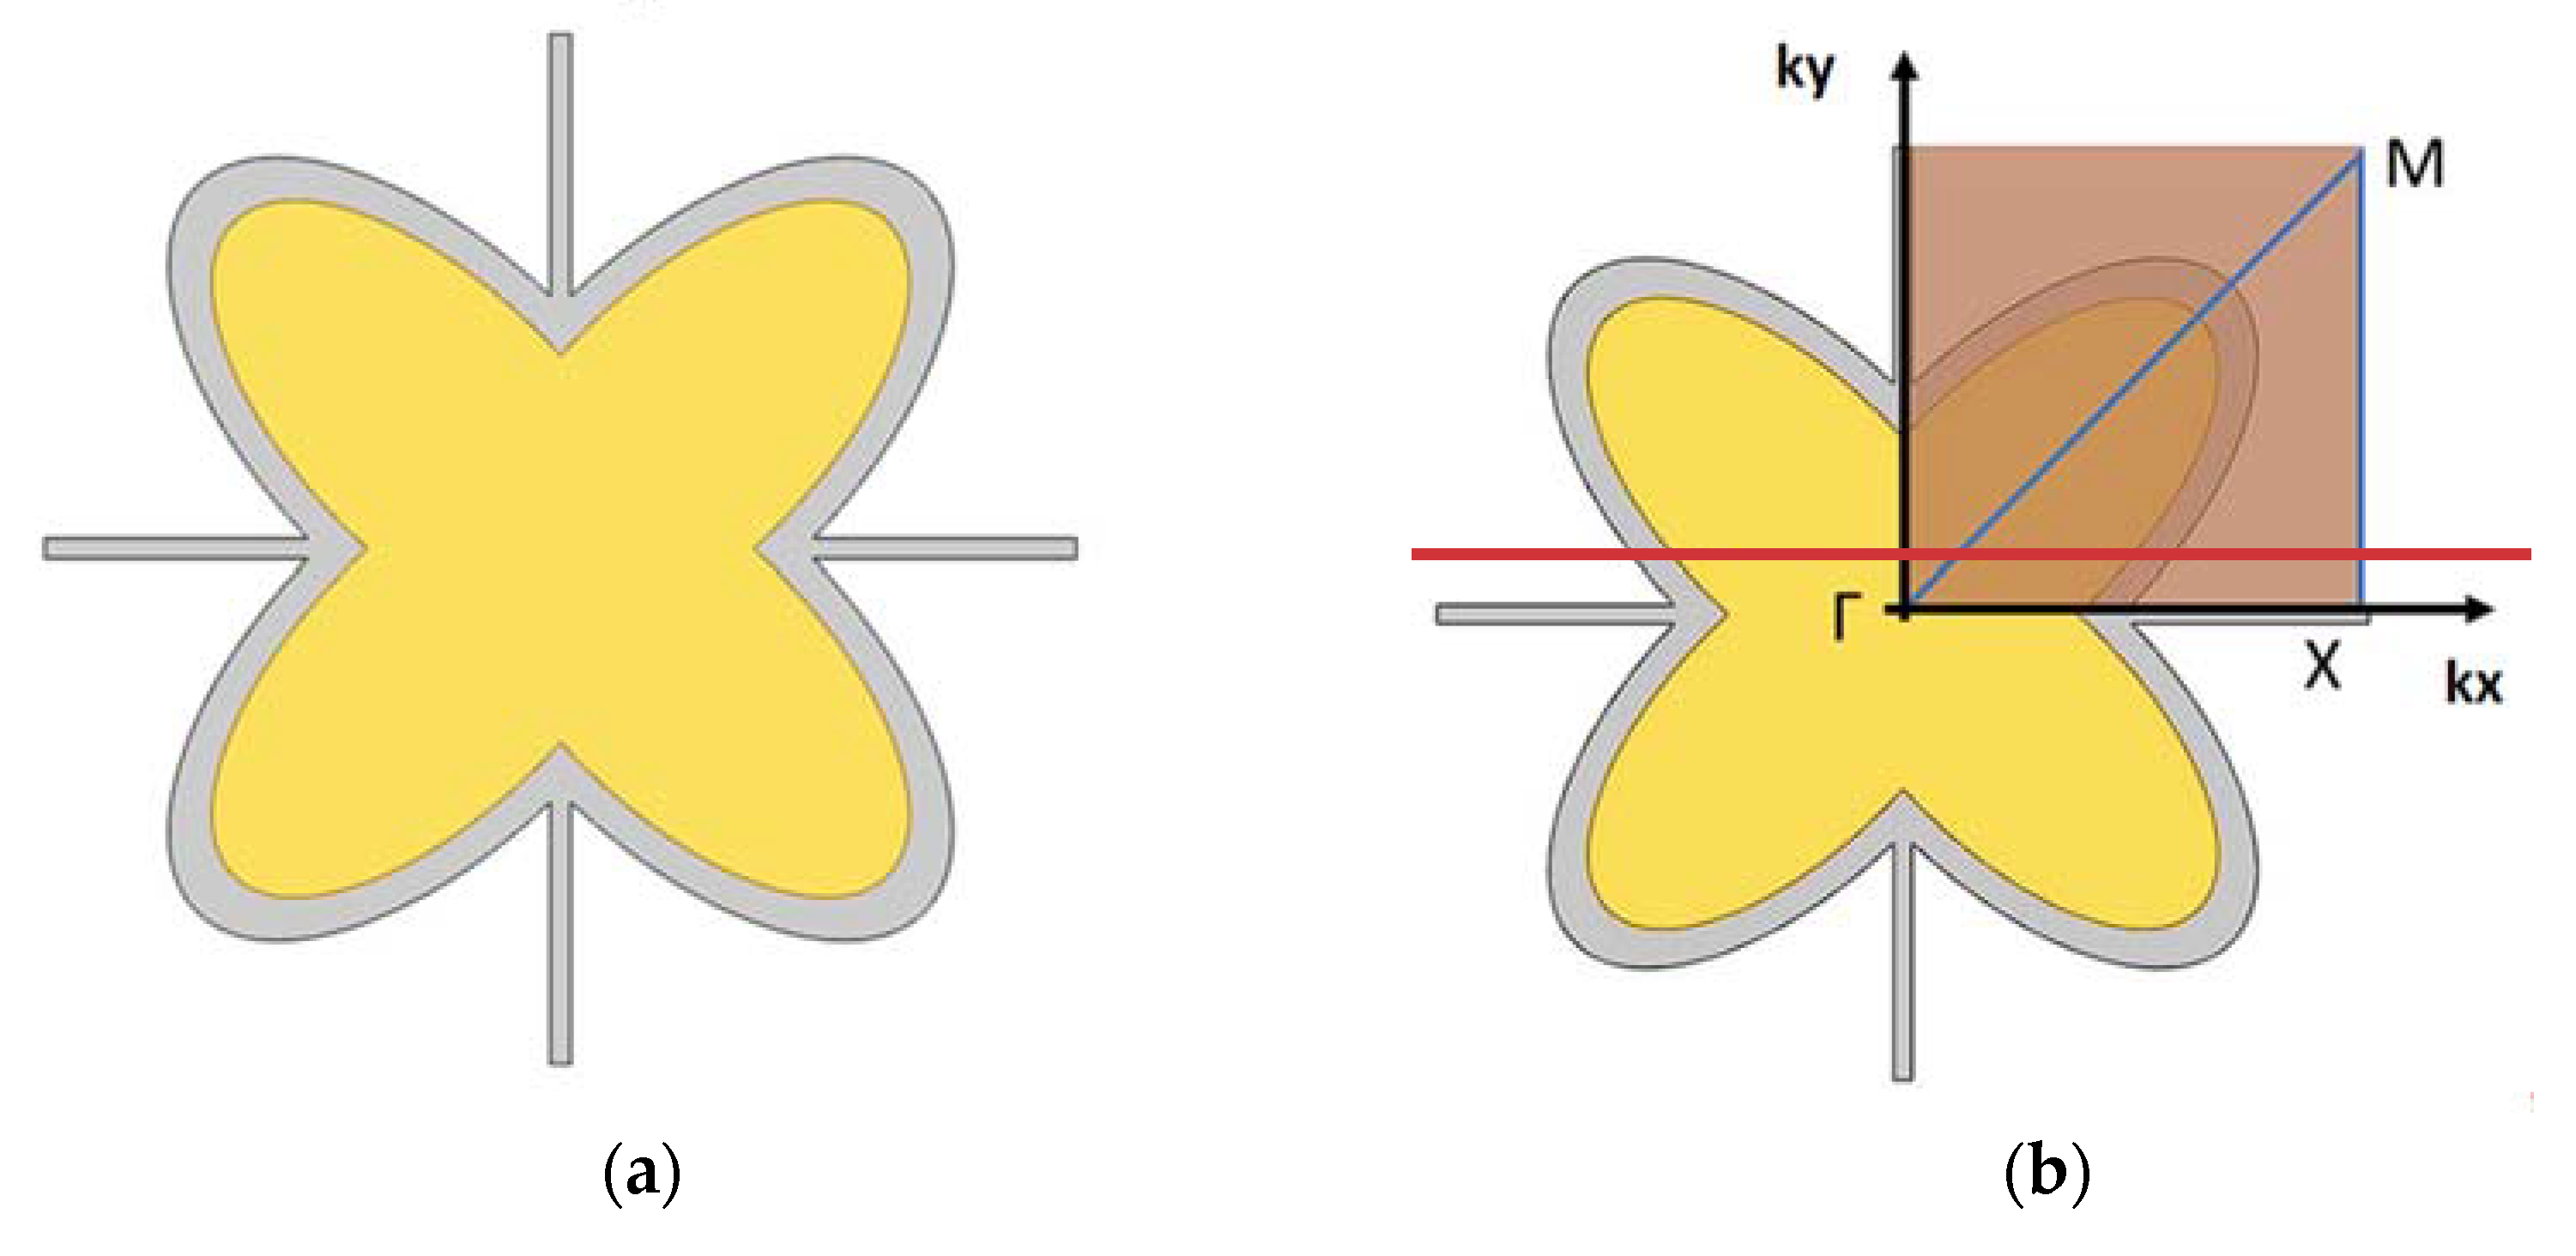
3.1. Irreducible Brillouin Zone and Periodic Structures

When one studies the response of a periodic structure, in order to avoid the high calculation cost, there is a need for certain methods to simplify the model.
A very good practice is that one studies only one element of the structure, instead of studying the continuum with all repeating microstructures. Figure 1a shows one unit from the structure, the so-called representative volume element, or unit cell, that is used in this study.
It is possible to use the minimum required segment of the representative volume element in order to reduce the computational cost. This minimum segment of the shape is called the Irreducible Brillouin Zone (IBZ), see Figure 1b, and it is named p4. The coordinates for each of the points Γ, Μ, Χ that appear in Figure 1b, provided that Γ is in the center of the axes [0,0], are given in Table 1.
In order to benefit from the IBZ simplification methodology, the calculations for the frequency diagrams that are considered in this research, variable k that represents the wave that scans the IBZ area, takes values between 0 and 3. These values represent the path from points Γ-Χ-Μ-Γ and all the in between points on that triangle.

3.2. Applying Blovh Theorem on the Model

To study a wave that propagates on a plane, the displacement q(ri) of the mesh elements is defined by the following equation:
q r j = q j e i ω t k r j
where qi denotes the wave width, ω is the frequency, and k the wave vector. According to the Bloch theorem, there are two parameters, n1 and n2, that can be used for the recognition of each cell, so that the displacement can be found by only one combination of n1 and n2:
q = q r j e k r r j = q r j e k 1 n 1 + k 2 n 2
with k 1 = k e 1 = δ 1 + i ε 1 , k 2 = k e 2 = δ 2 + i ε 2 , where δ1, δ2 is the damping constant and ε1, ε2 the phase constant.
For the degrees of freedom q of a rectangular segment with edges Lx, Ly:
q = q 1 T q 2 T q 3 T q 4 T
With qi we represent the nodal degrees of freedom, see Figure 2.
As a wave propagation can be described as a Bloch wave, the relation between the periodic displacements q at the edges of the periodic element is:
q 2 = λ x q 1 ,   q 3 = λ y q 1 ,   q 4 = λ x λ y q 1   with   λ x = e i μ x ,   λ y = e i μ y
where constants μ x = κ x L x ,   μ y = κ y L y , describe the wave propagation.
The nodal degrees of freedom can then be written as:
q = Λ R q 1 ,   with   Λ R = I λ x I   λ y I   λ x λ y I
Replacing q with q = Λ R q 1 in the equation ω 2 M + i ω C + K q = f and multiplying with Λ L = I λ x 1 I   λ x 1 I   λ x λ y 1 I we have:
ω 2 Μ ¯ μ x , μ y + i ω C ¯ μ x , μ y + K ¯ μ x , μ y q = f
with Μ ¯ = Λ L M Λ R ,   C ¯ = Λ L C Λ R ,   K ¯ = Λ L K Λ R we represent the damping and stiffness matrixes
Then, the eigenvalue problem becomes:
D ¯ ω , λ x , λ y = 0
where D ¯ is the reduced matrix of the dynamic stiffness.

3.3. Setting Up the Numerical Experiment

Structures that guide waves are common in the study of metamaterials. A method to determine the dispersion curves of a periodic waveguide is to use a Periodic Condition to prescribe that the displacements on two different sets of boundaries with the same geometry are related, as in a structure with periodicity. The so-called Floquet boundary conditions, which are available in some software packages, such as COMSOL used in this work, are technically realized by means of multi-point constraints. The source of the wave and its destination are applied to the edges of the unit cell, one to the left and right edges and one to the top and bottom edges.
The eigensolver analysis is set as a parametric sweep, using the parameter k. The values of this parameter range between 0 and 3. Group 0–1 defines a wave number that scans the Γ–X edge, 1–2 the X–M edge, and 2–3 the M–Γ edge of the IBZ triangle. We solve for the lowest frequencies and then we plot the wave propagation frequencies at each value of k. Every finite element mesh for the RVE uses an average of 9500 triangular finite elements of plane elasticity type. The number of degrees of freedom is approximately 25,000.
The properties of the materials that were used in the numerical experiment are given in Table 2.
It should be mentioned that Material1 is used for the outer-part of the “cookie-shaped” structure (Figure 1) and Material2 for the inner-part.
For the simulations that followed, the initial characteristics of the geometry are the following:
  • Dimensions of the outer ellipse: 200 × 100 (mm)
  • Dimensions of the inner ellipse: 170 × 80 (mm)
  • Dimensions of the cross: 150 × 150 (mm)
  • Thickness for each of the cross rods: 6 (mm)
  • Number of eigen frequencies: 8
  • Periodic condition parameter value range: k 0–3 with step 0.08
The variations that followed involved different values for the size of the inner ellipse, the thickness of the cross surrounding the geometry, as well as the presence or absence of a circular inclusion within the auxetic microstructure. The latter inclusion, in cases of contact activation, will modify the microstructure and eventually influence the behavior.

4. Results

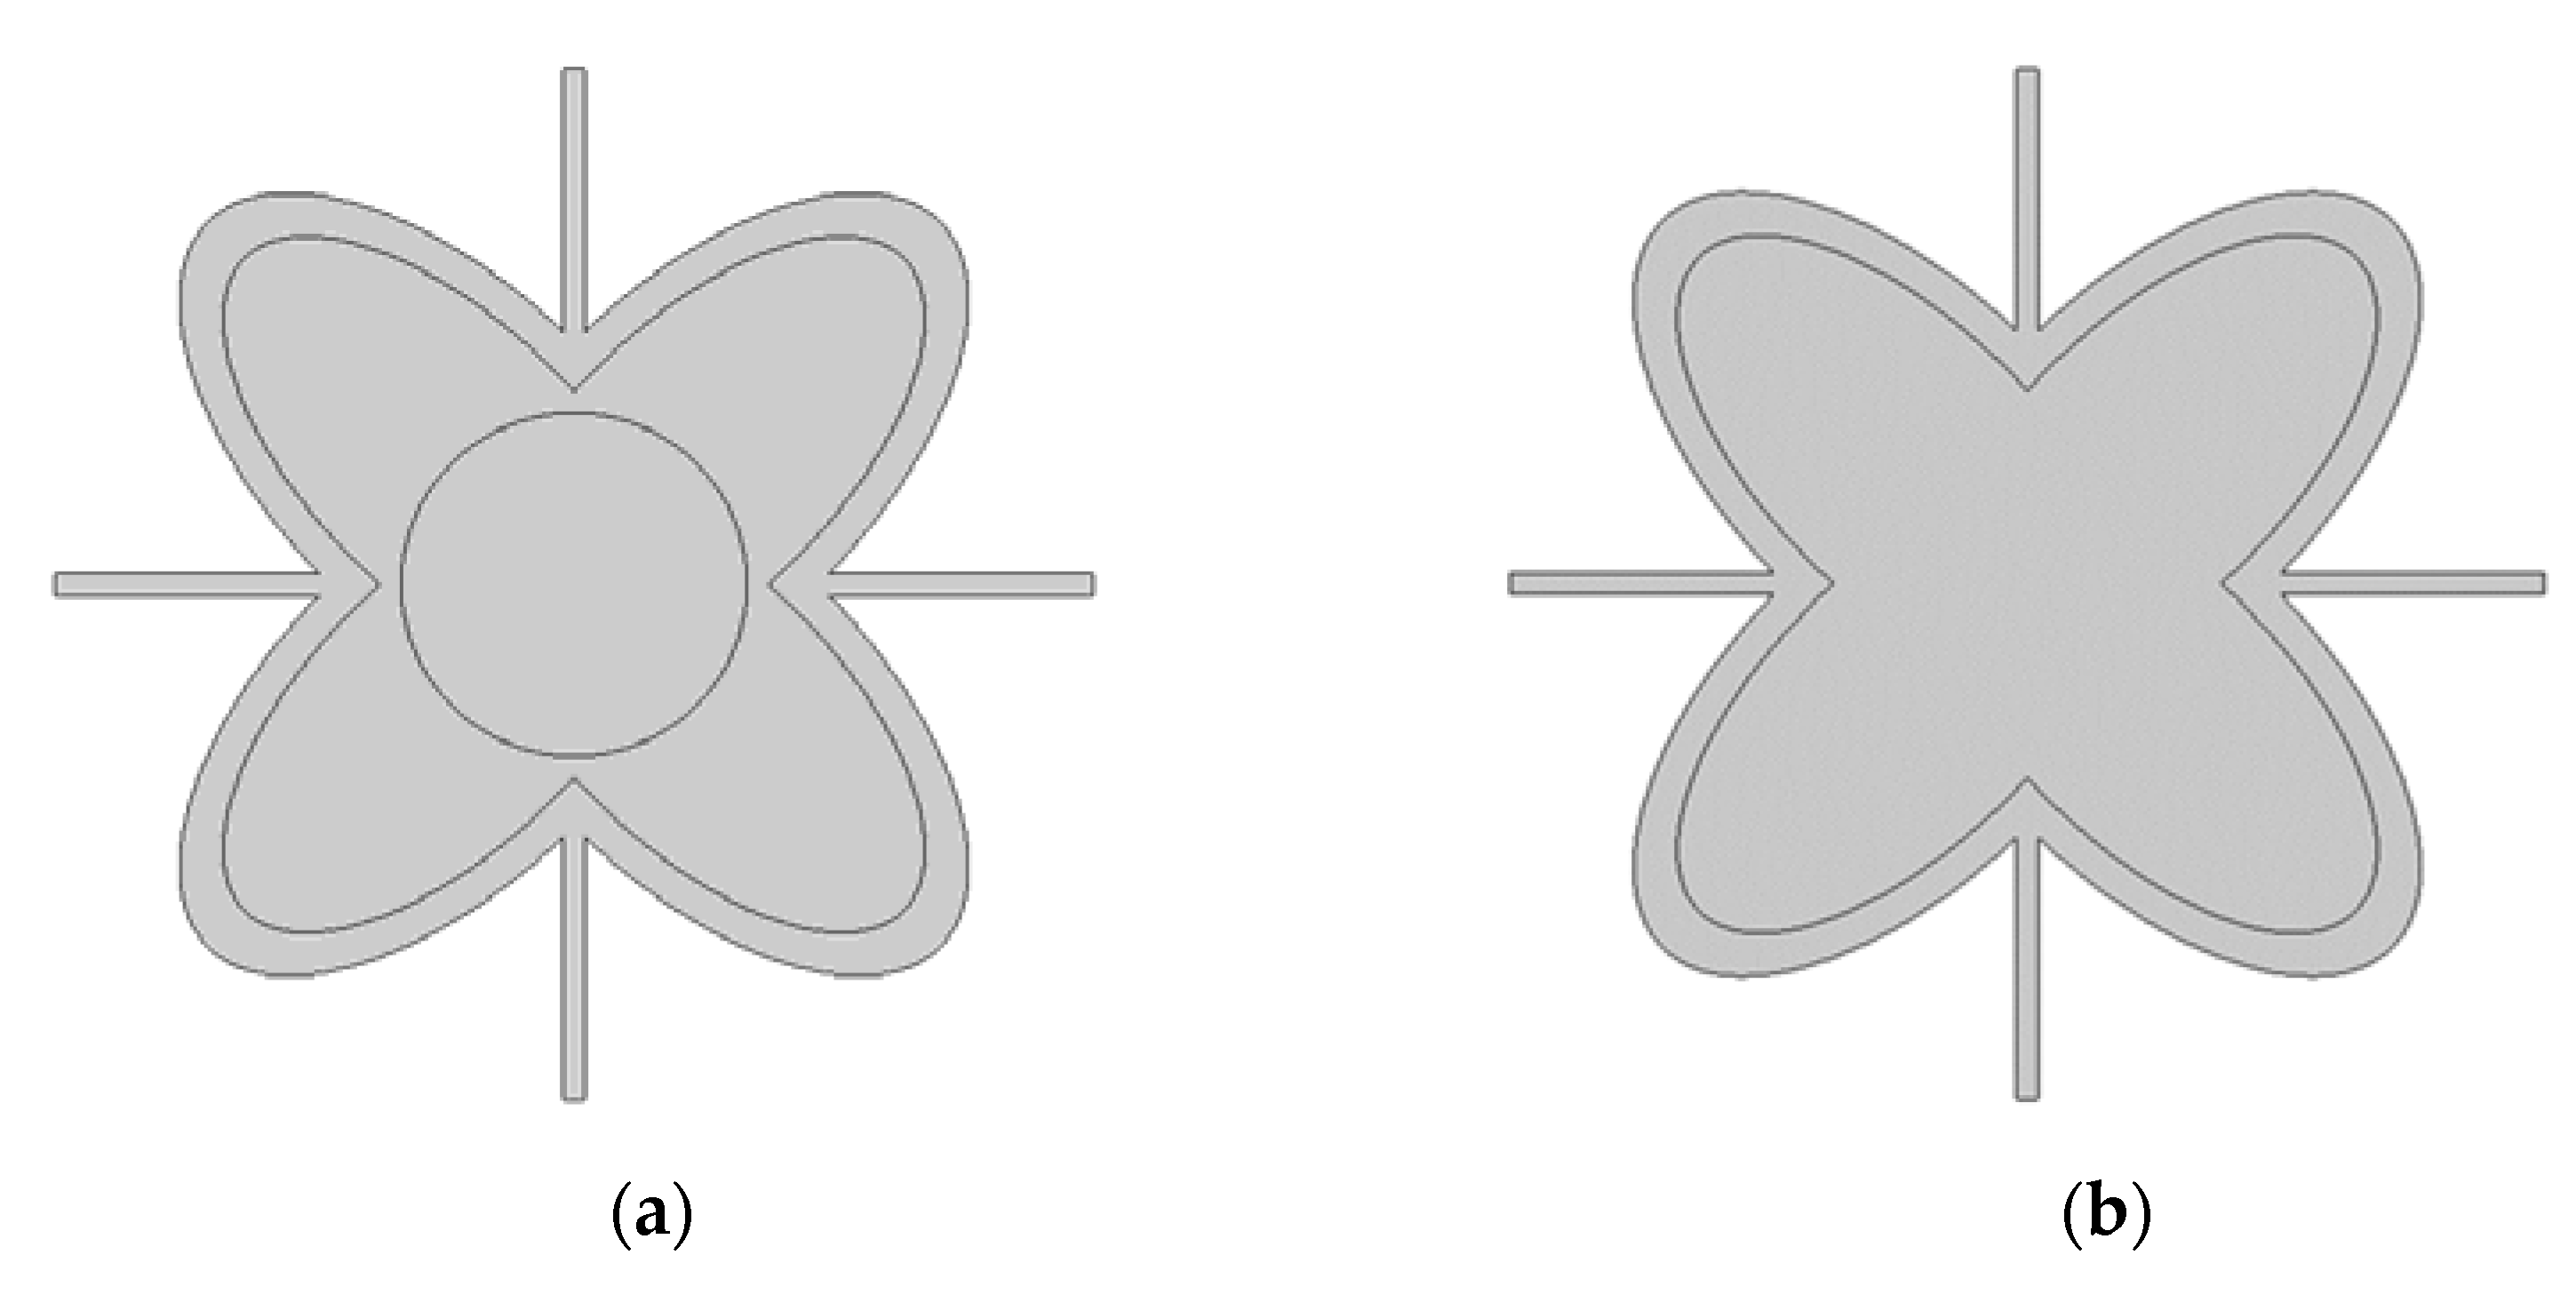
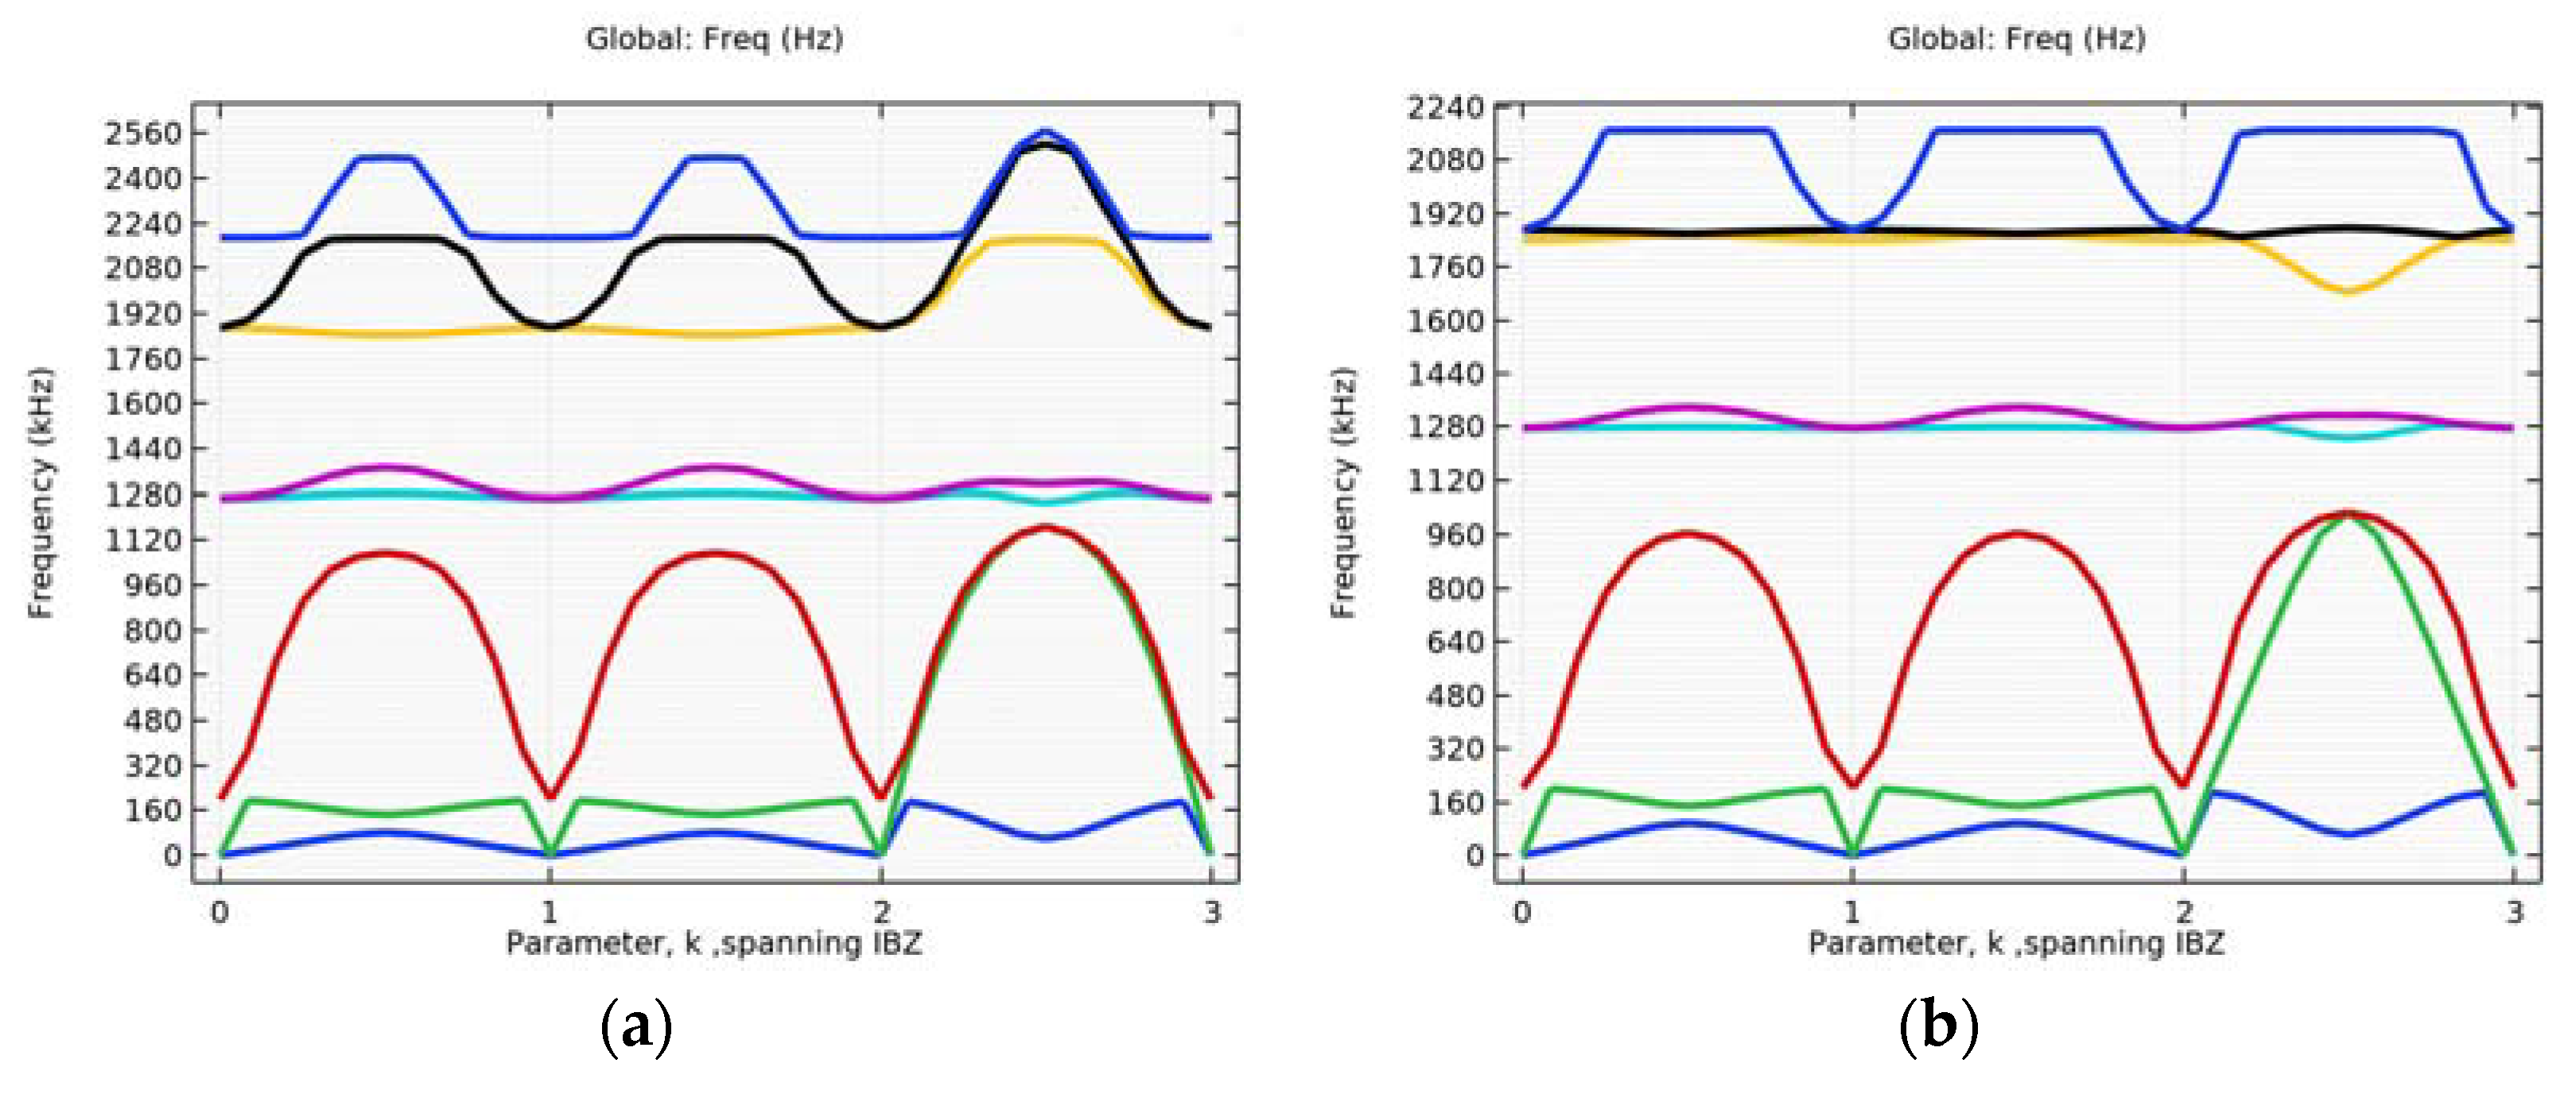
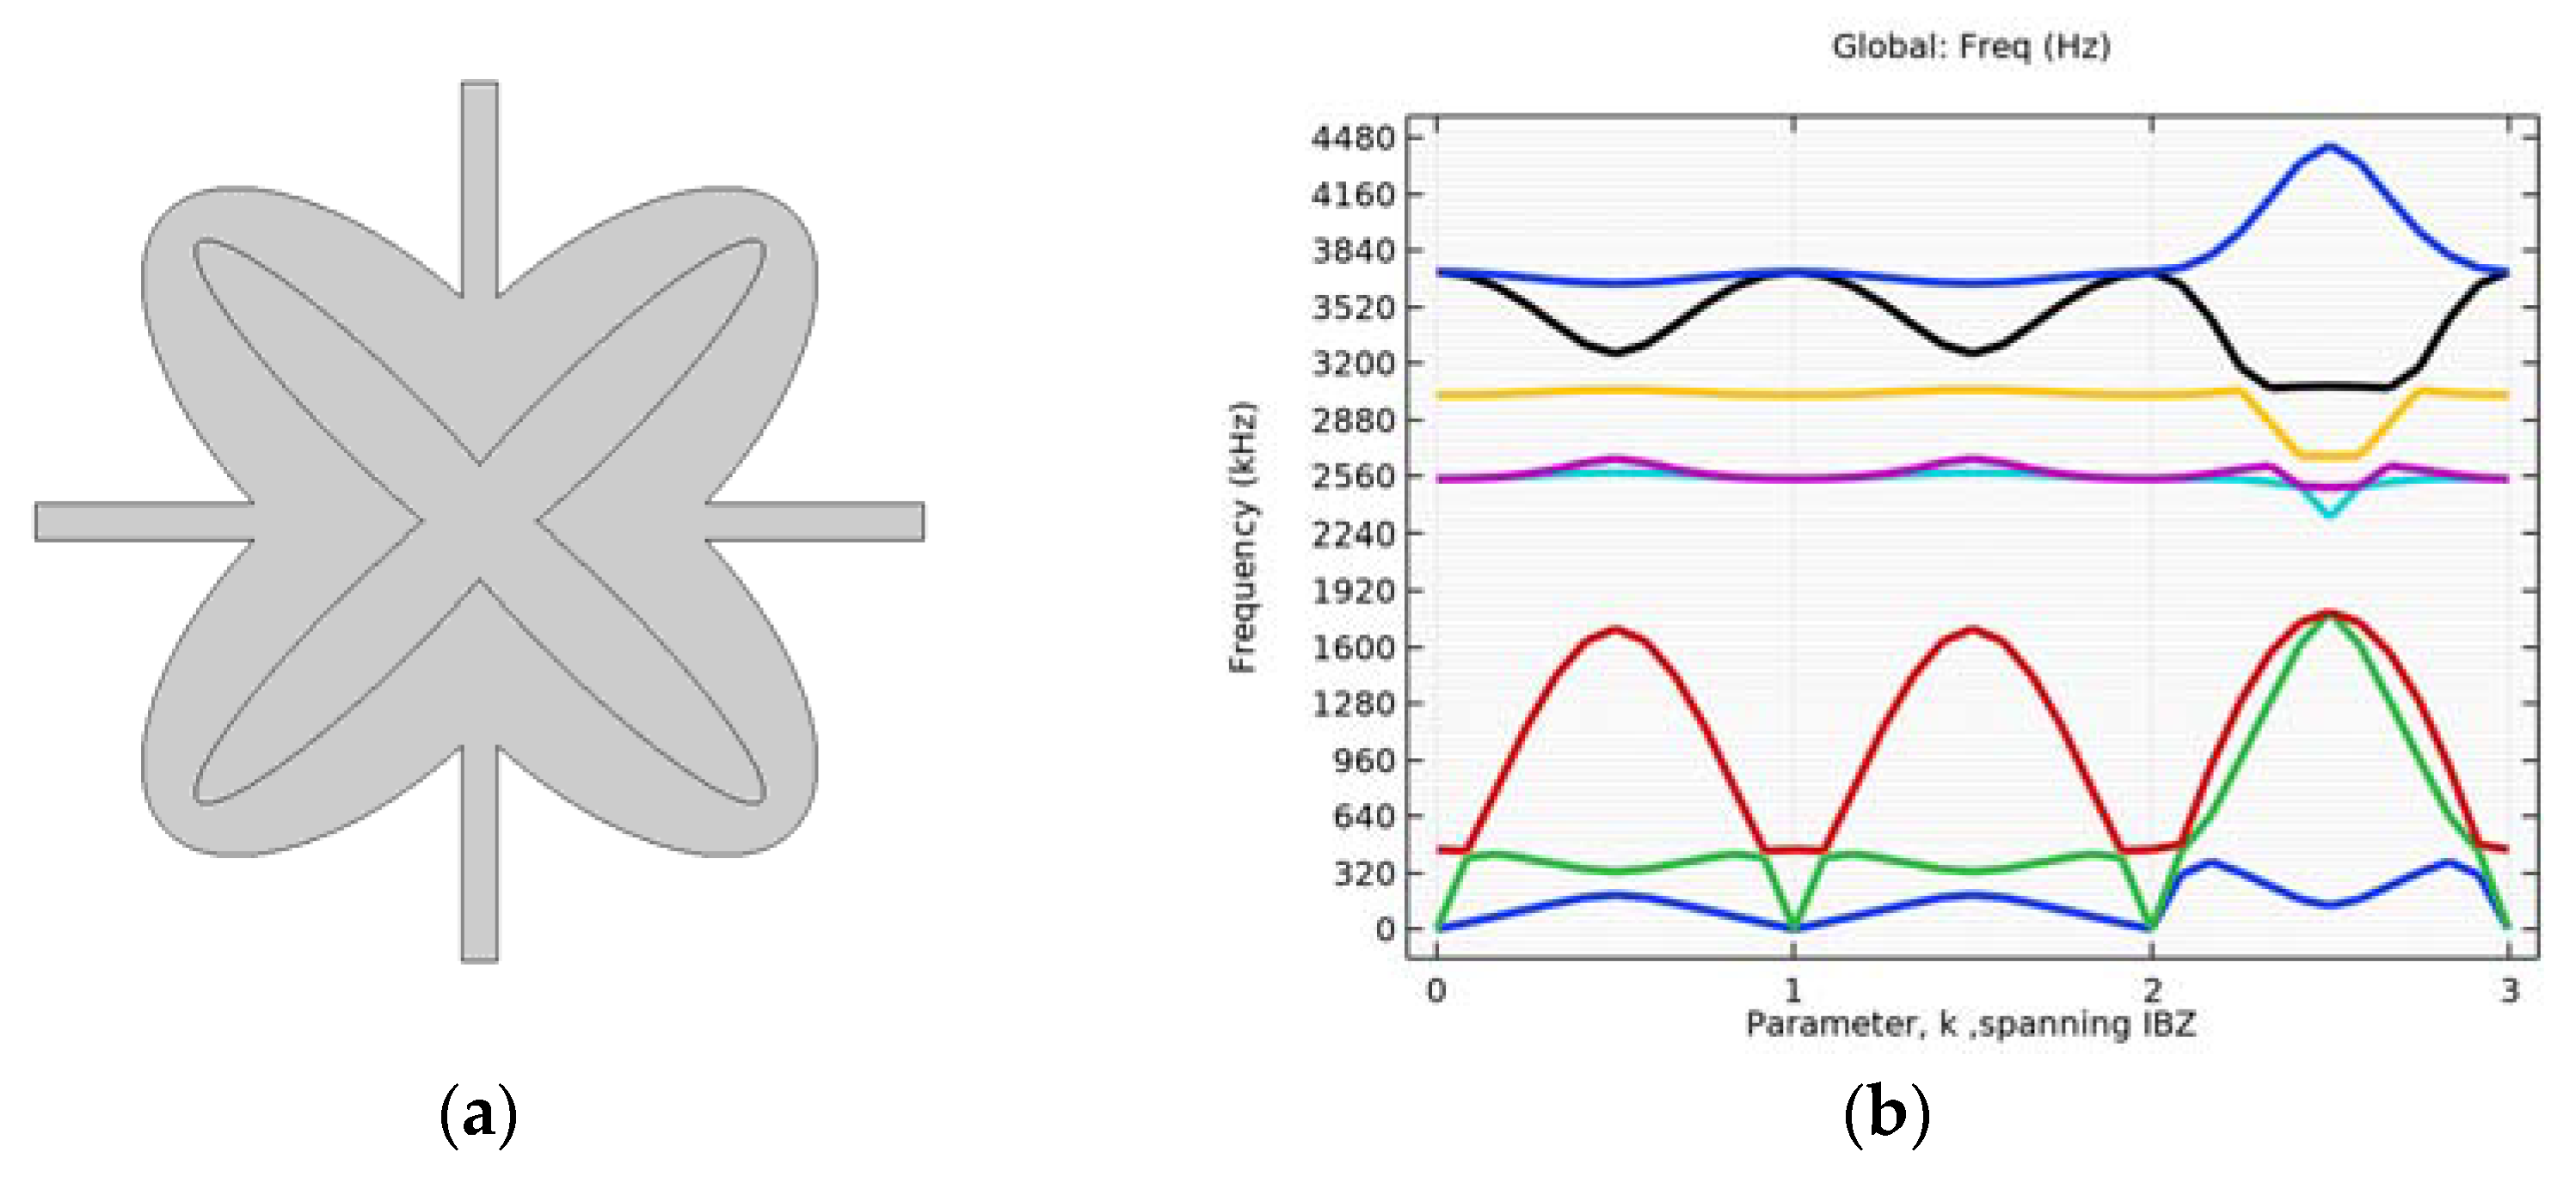
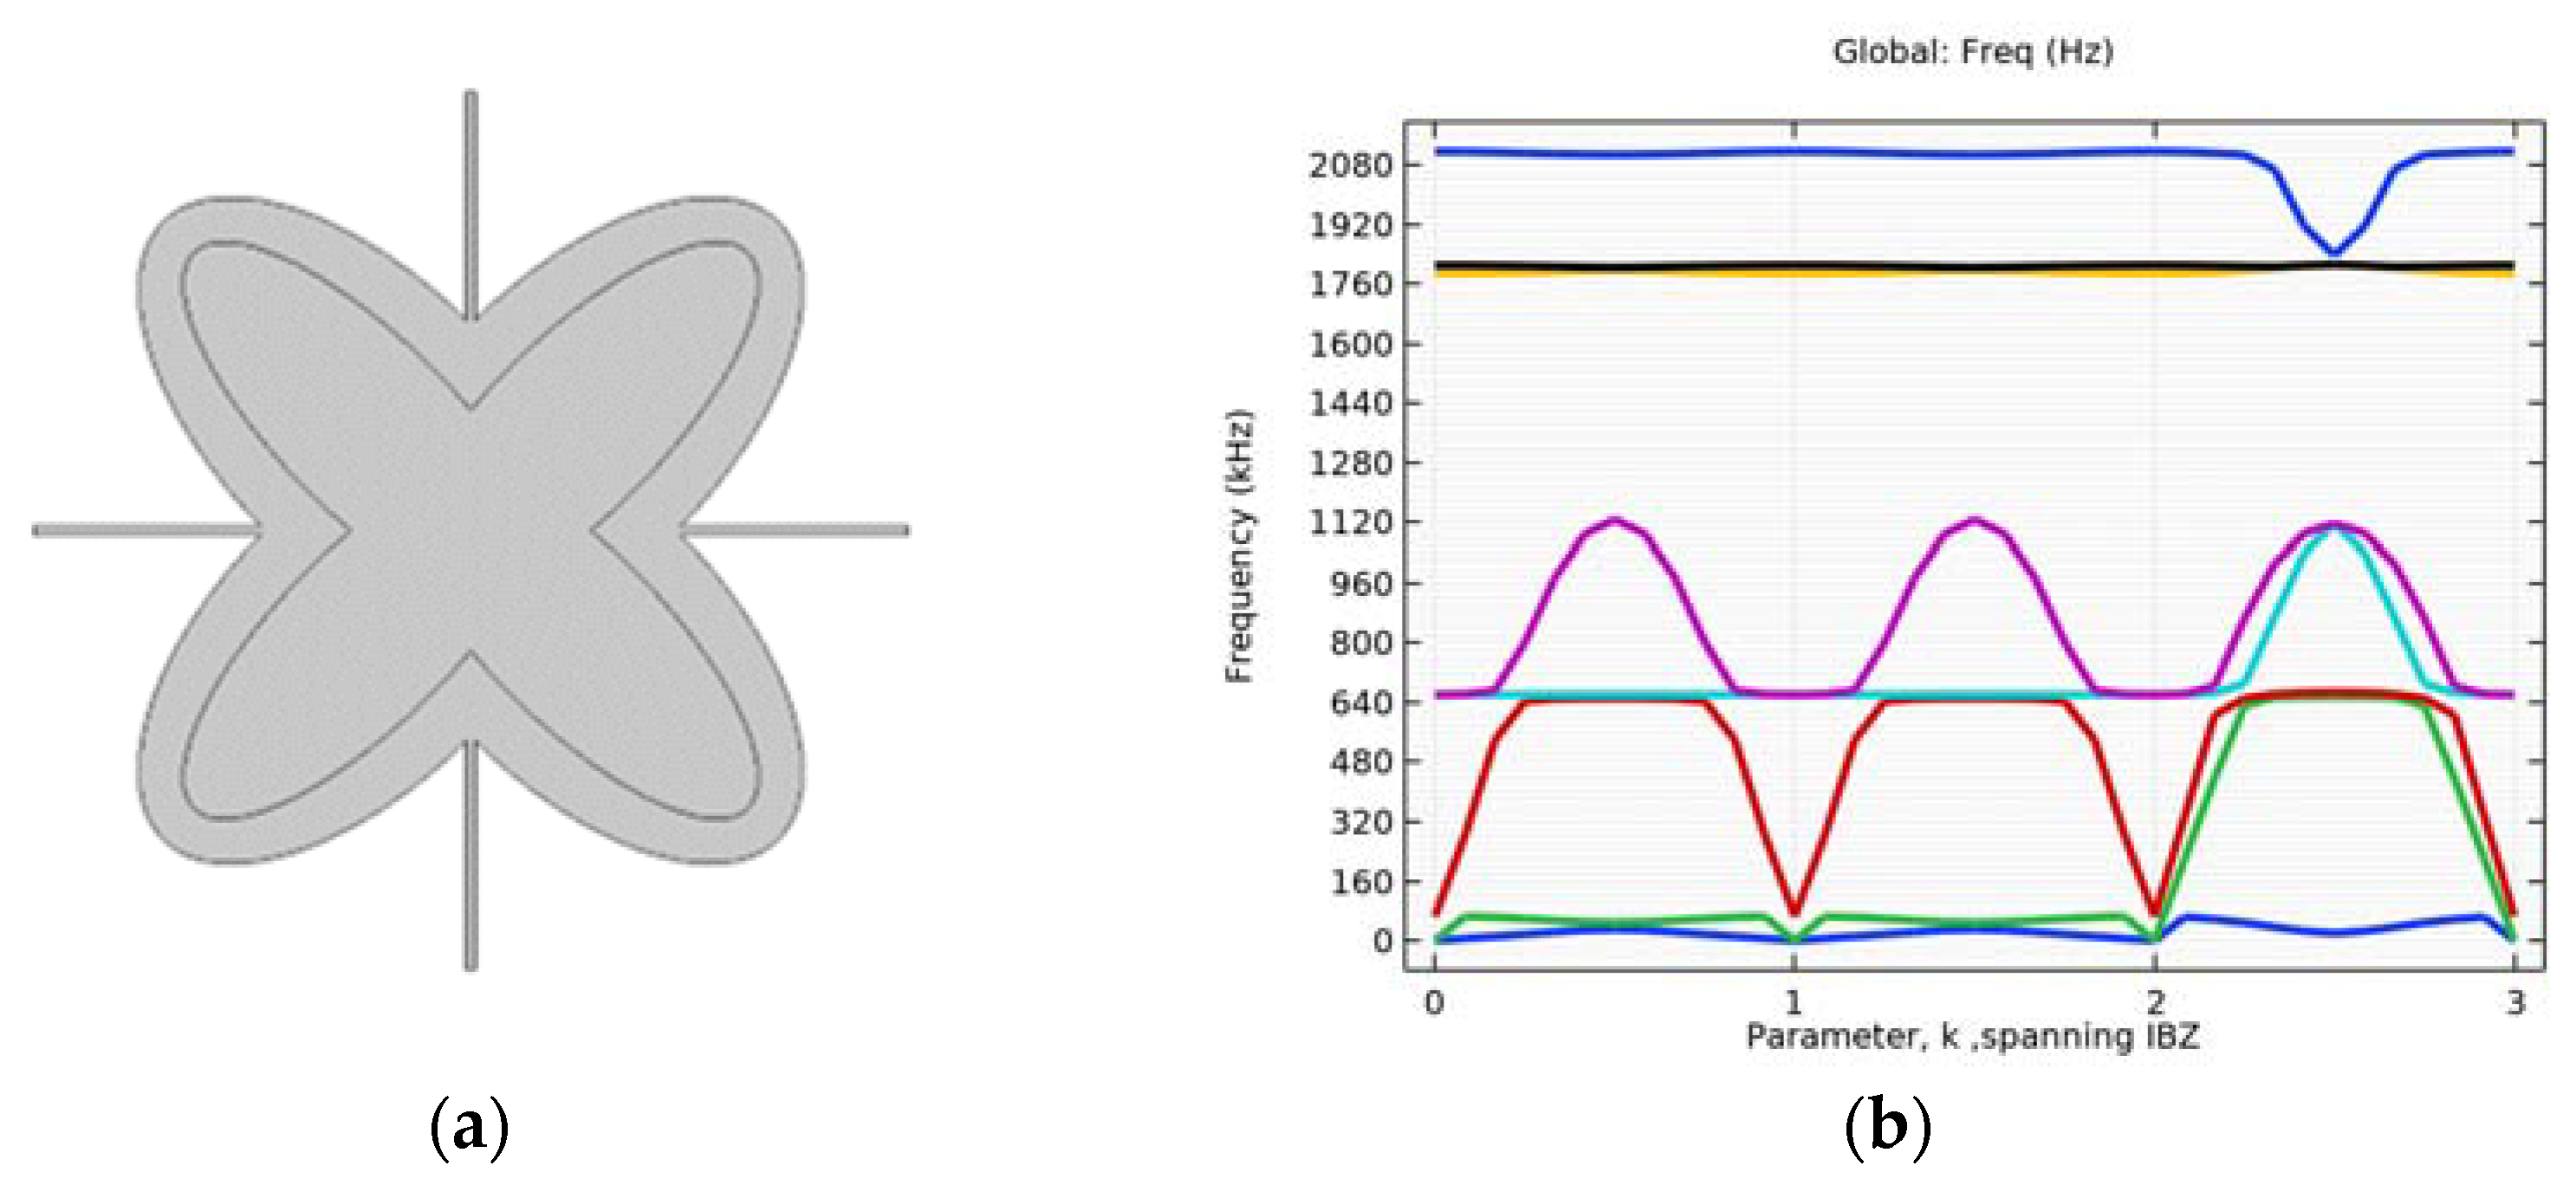
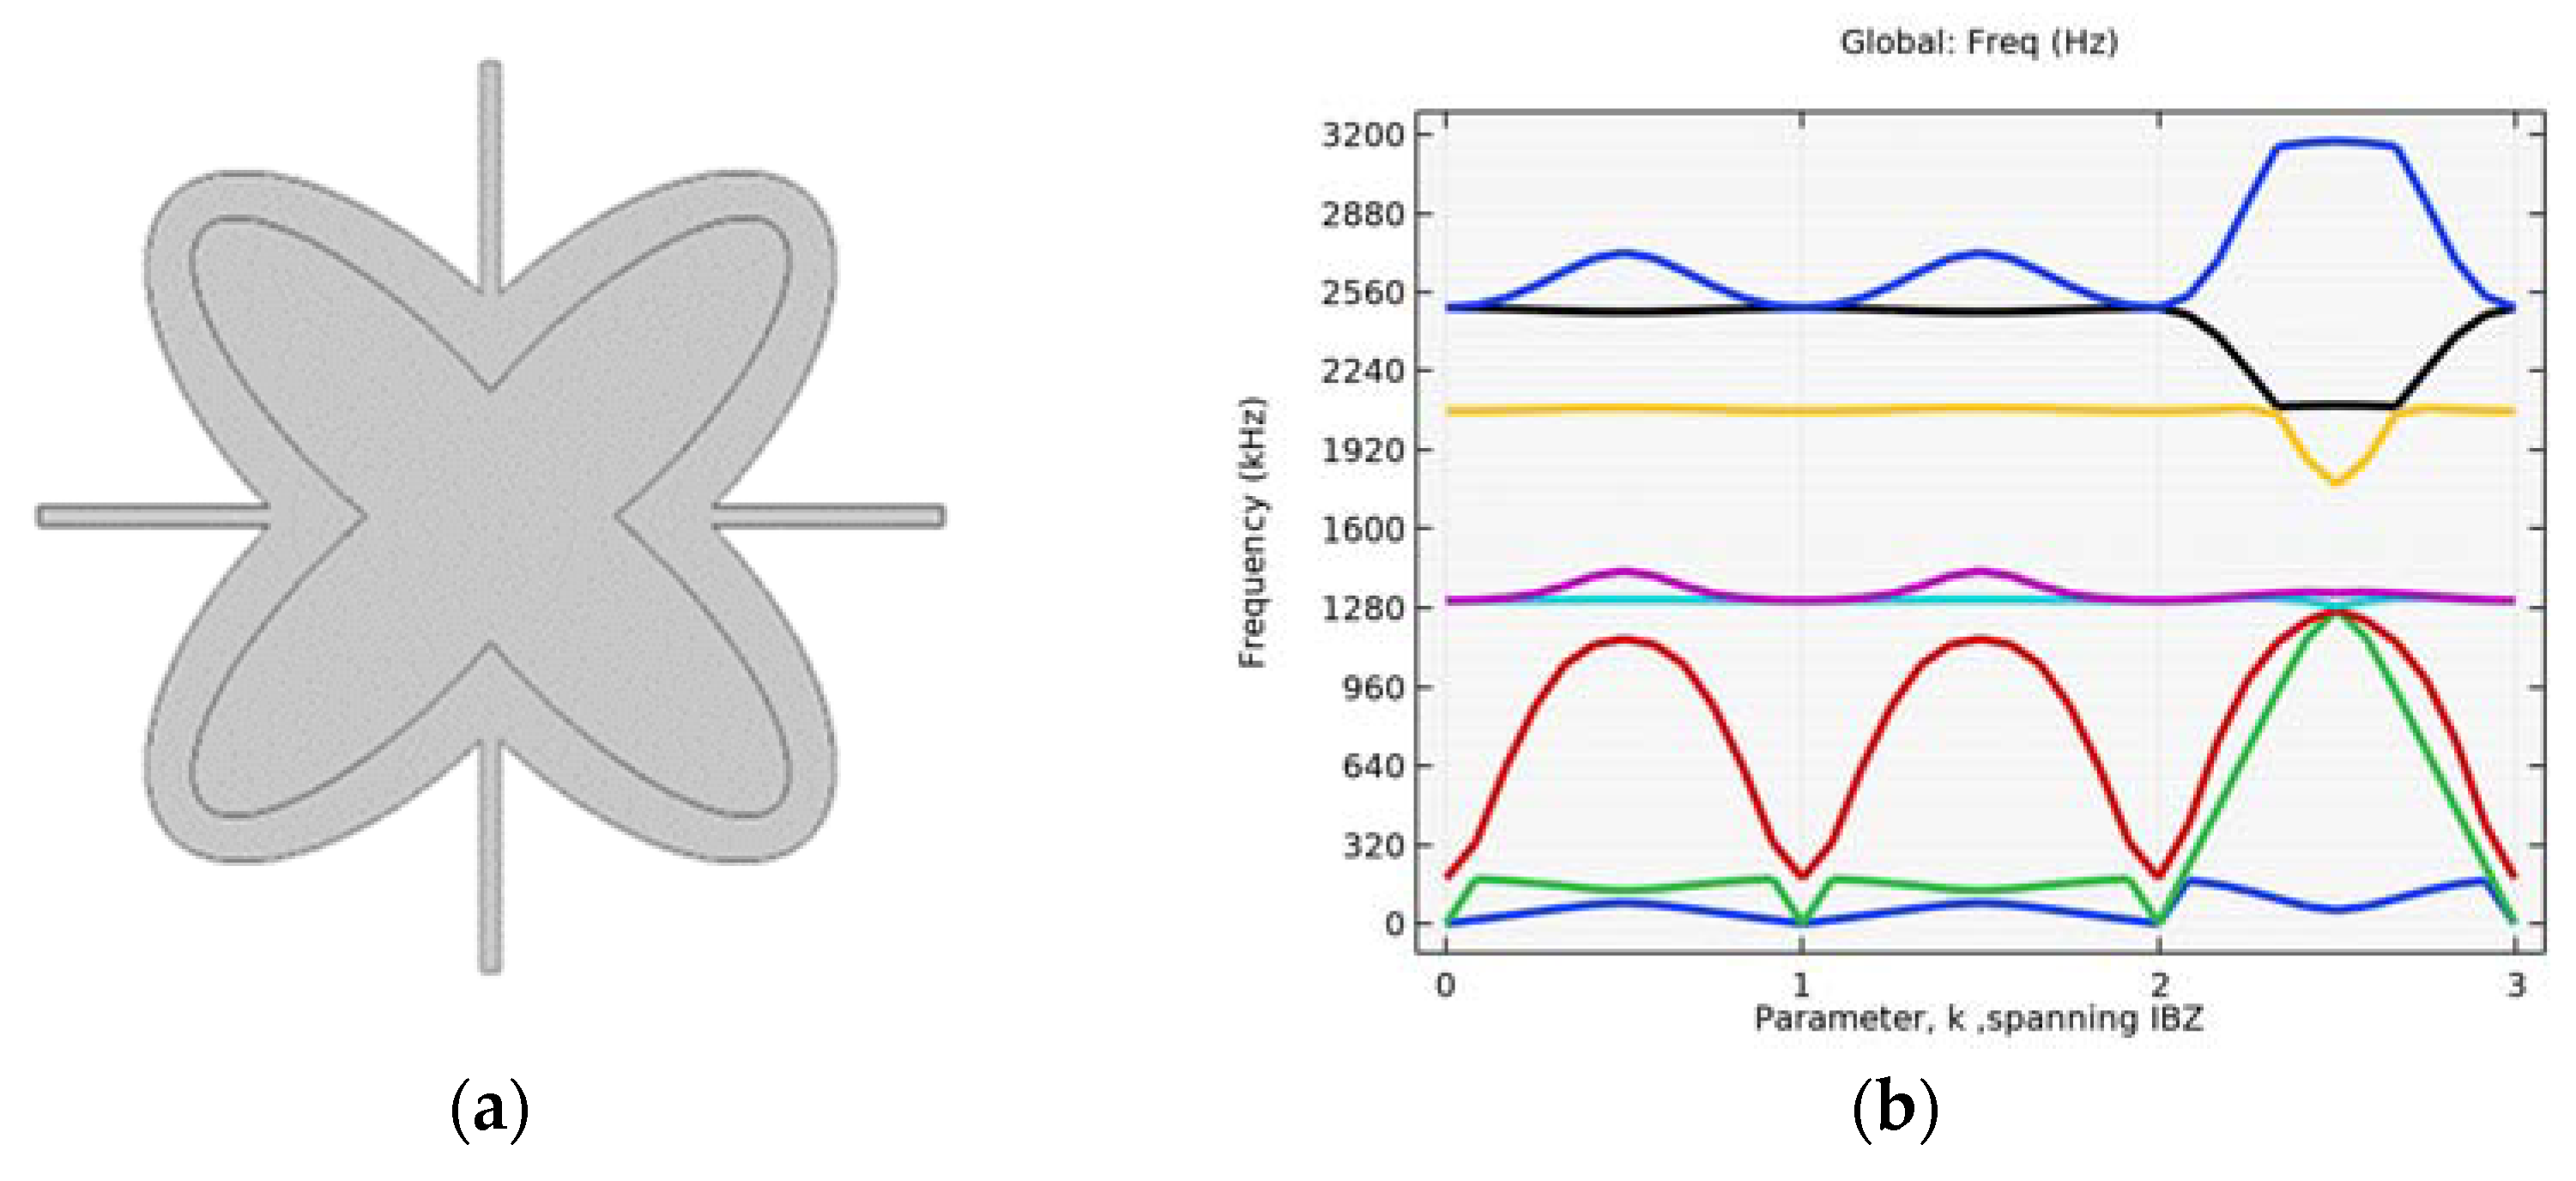
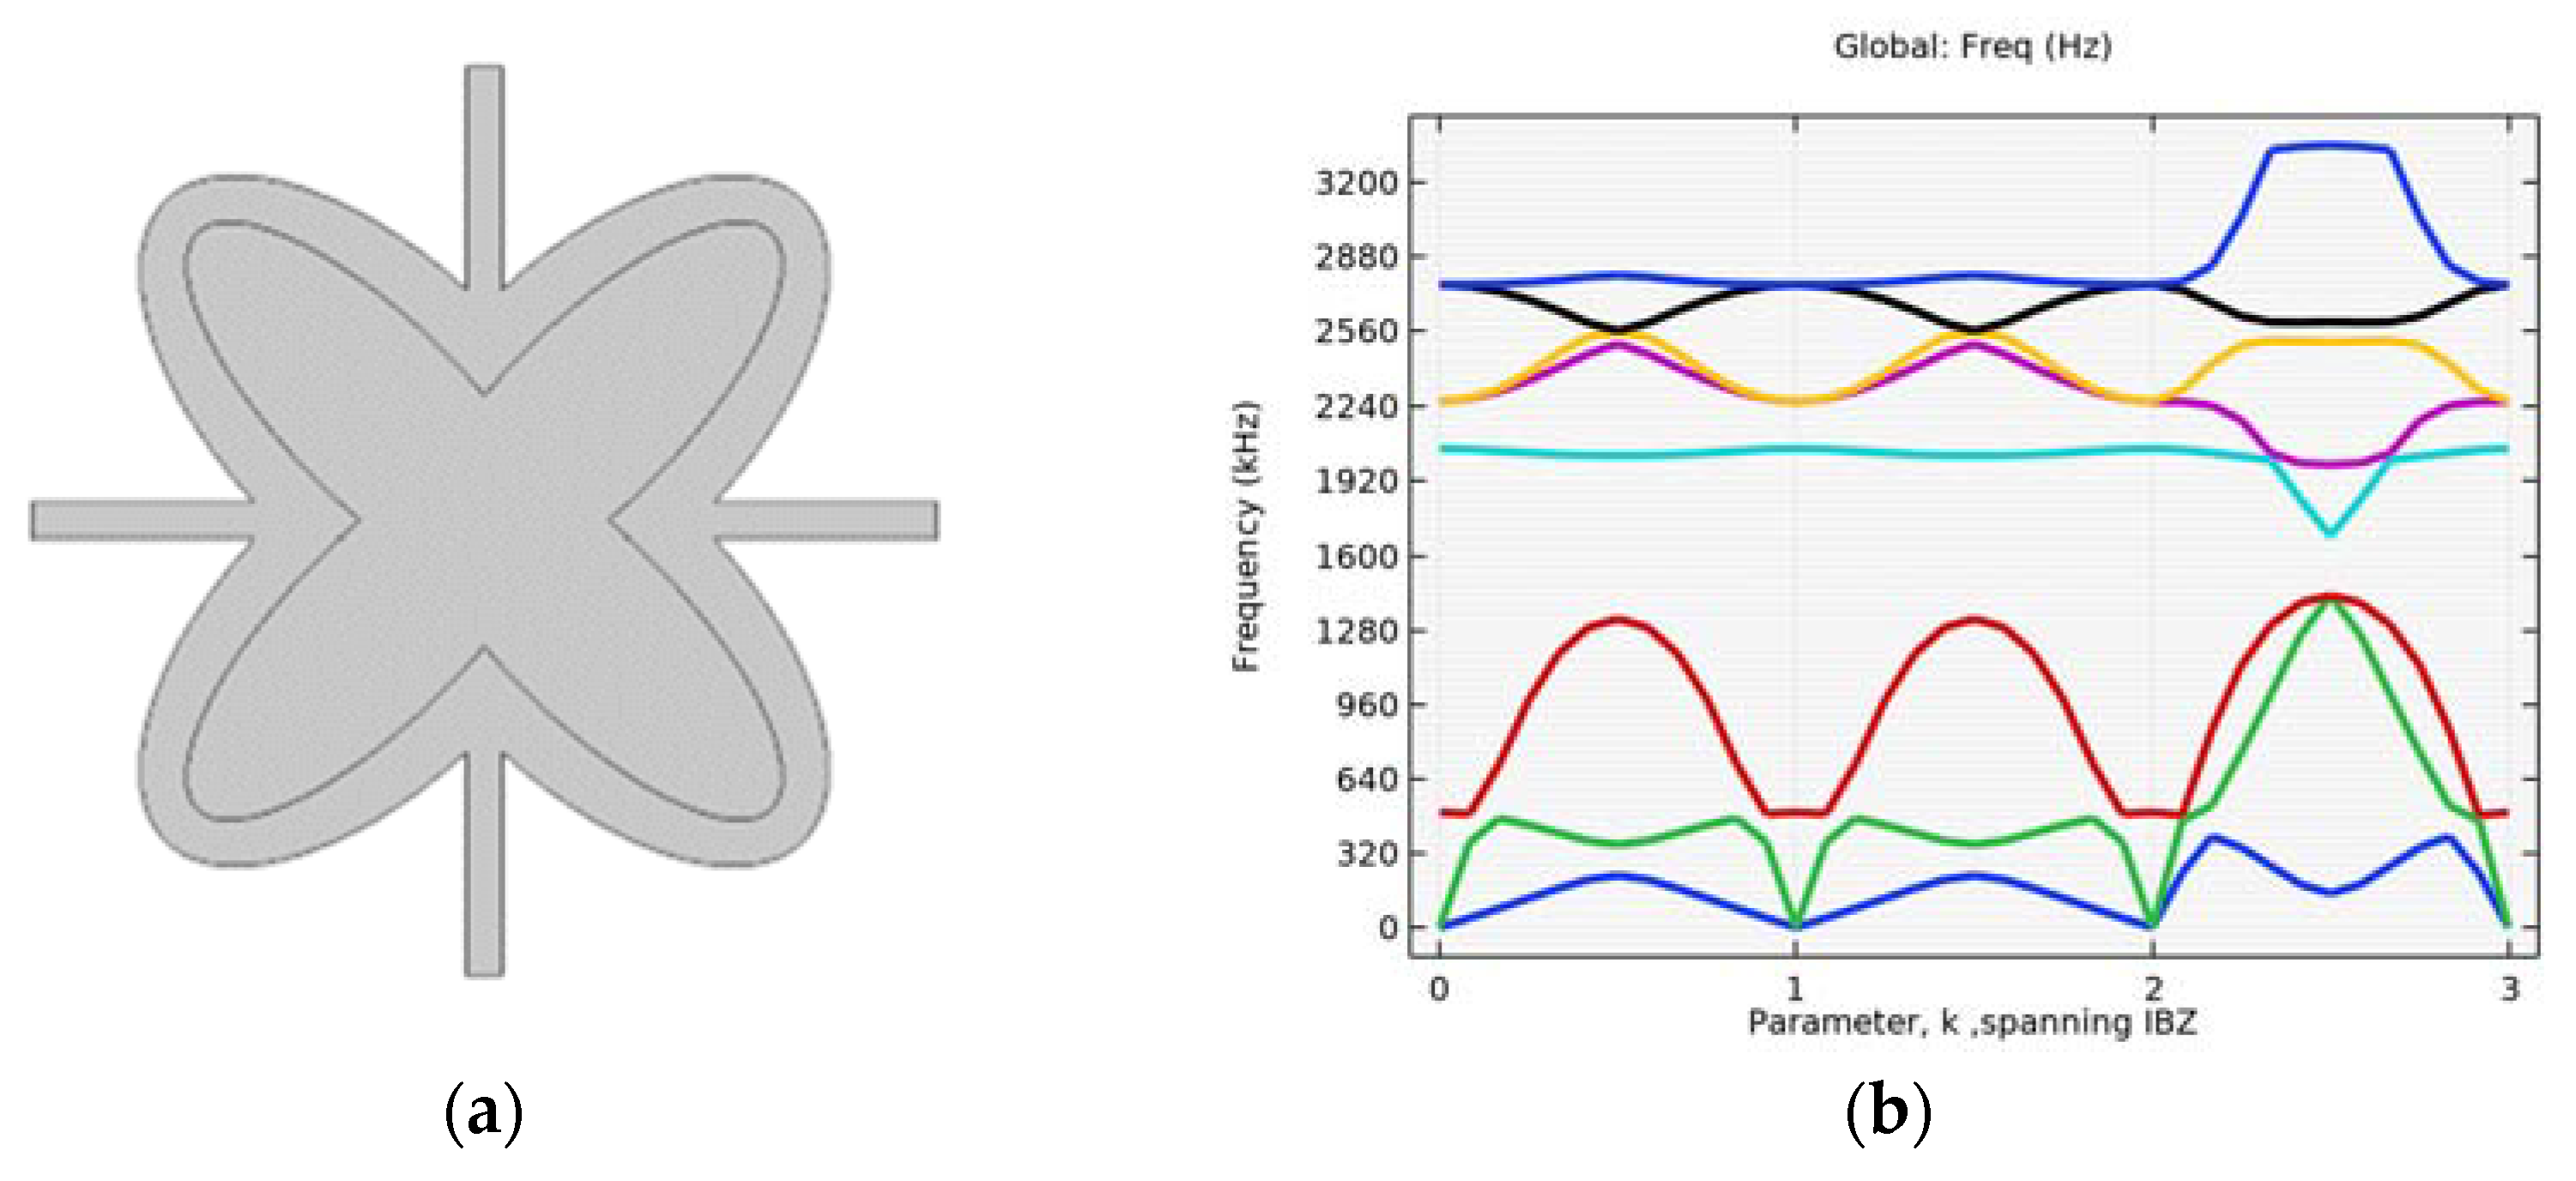
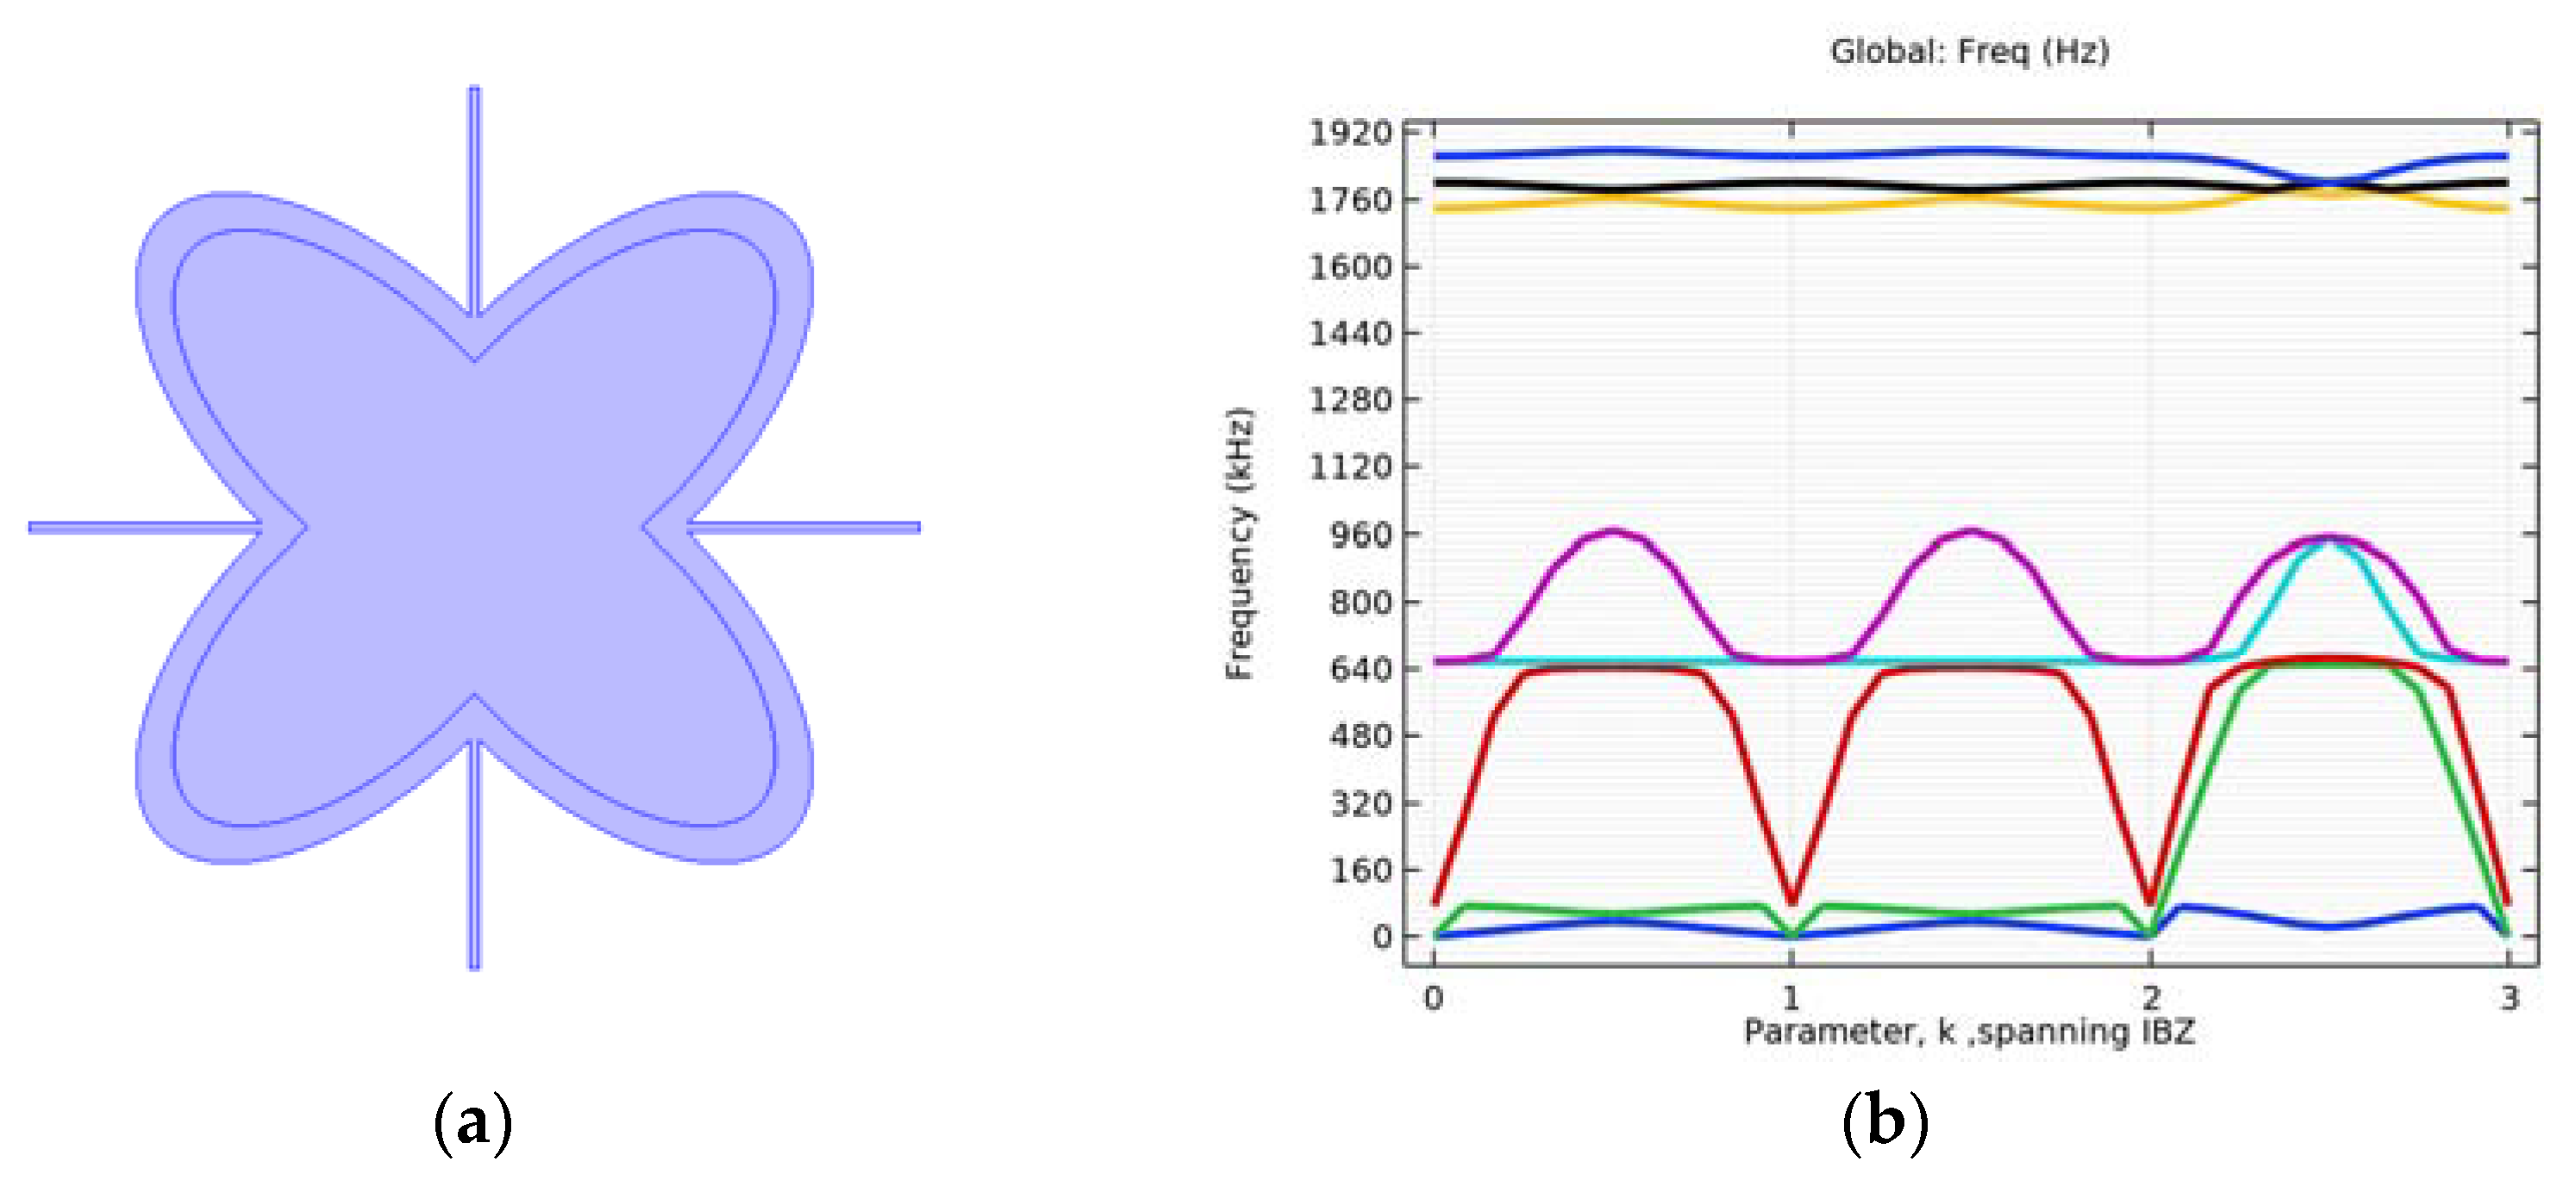
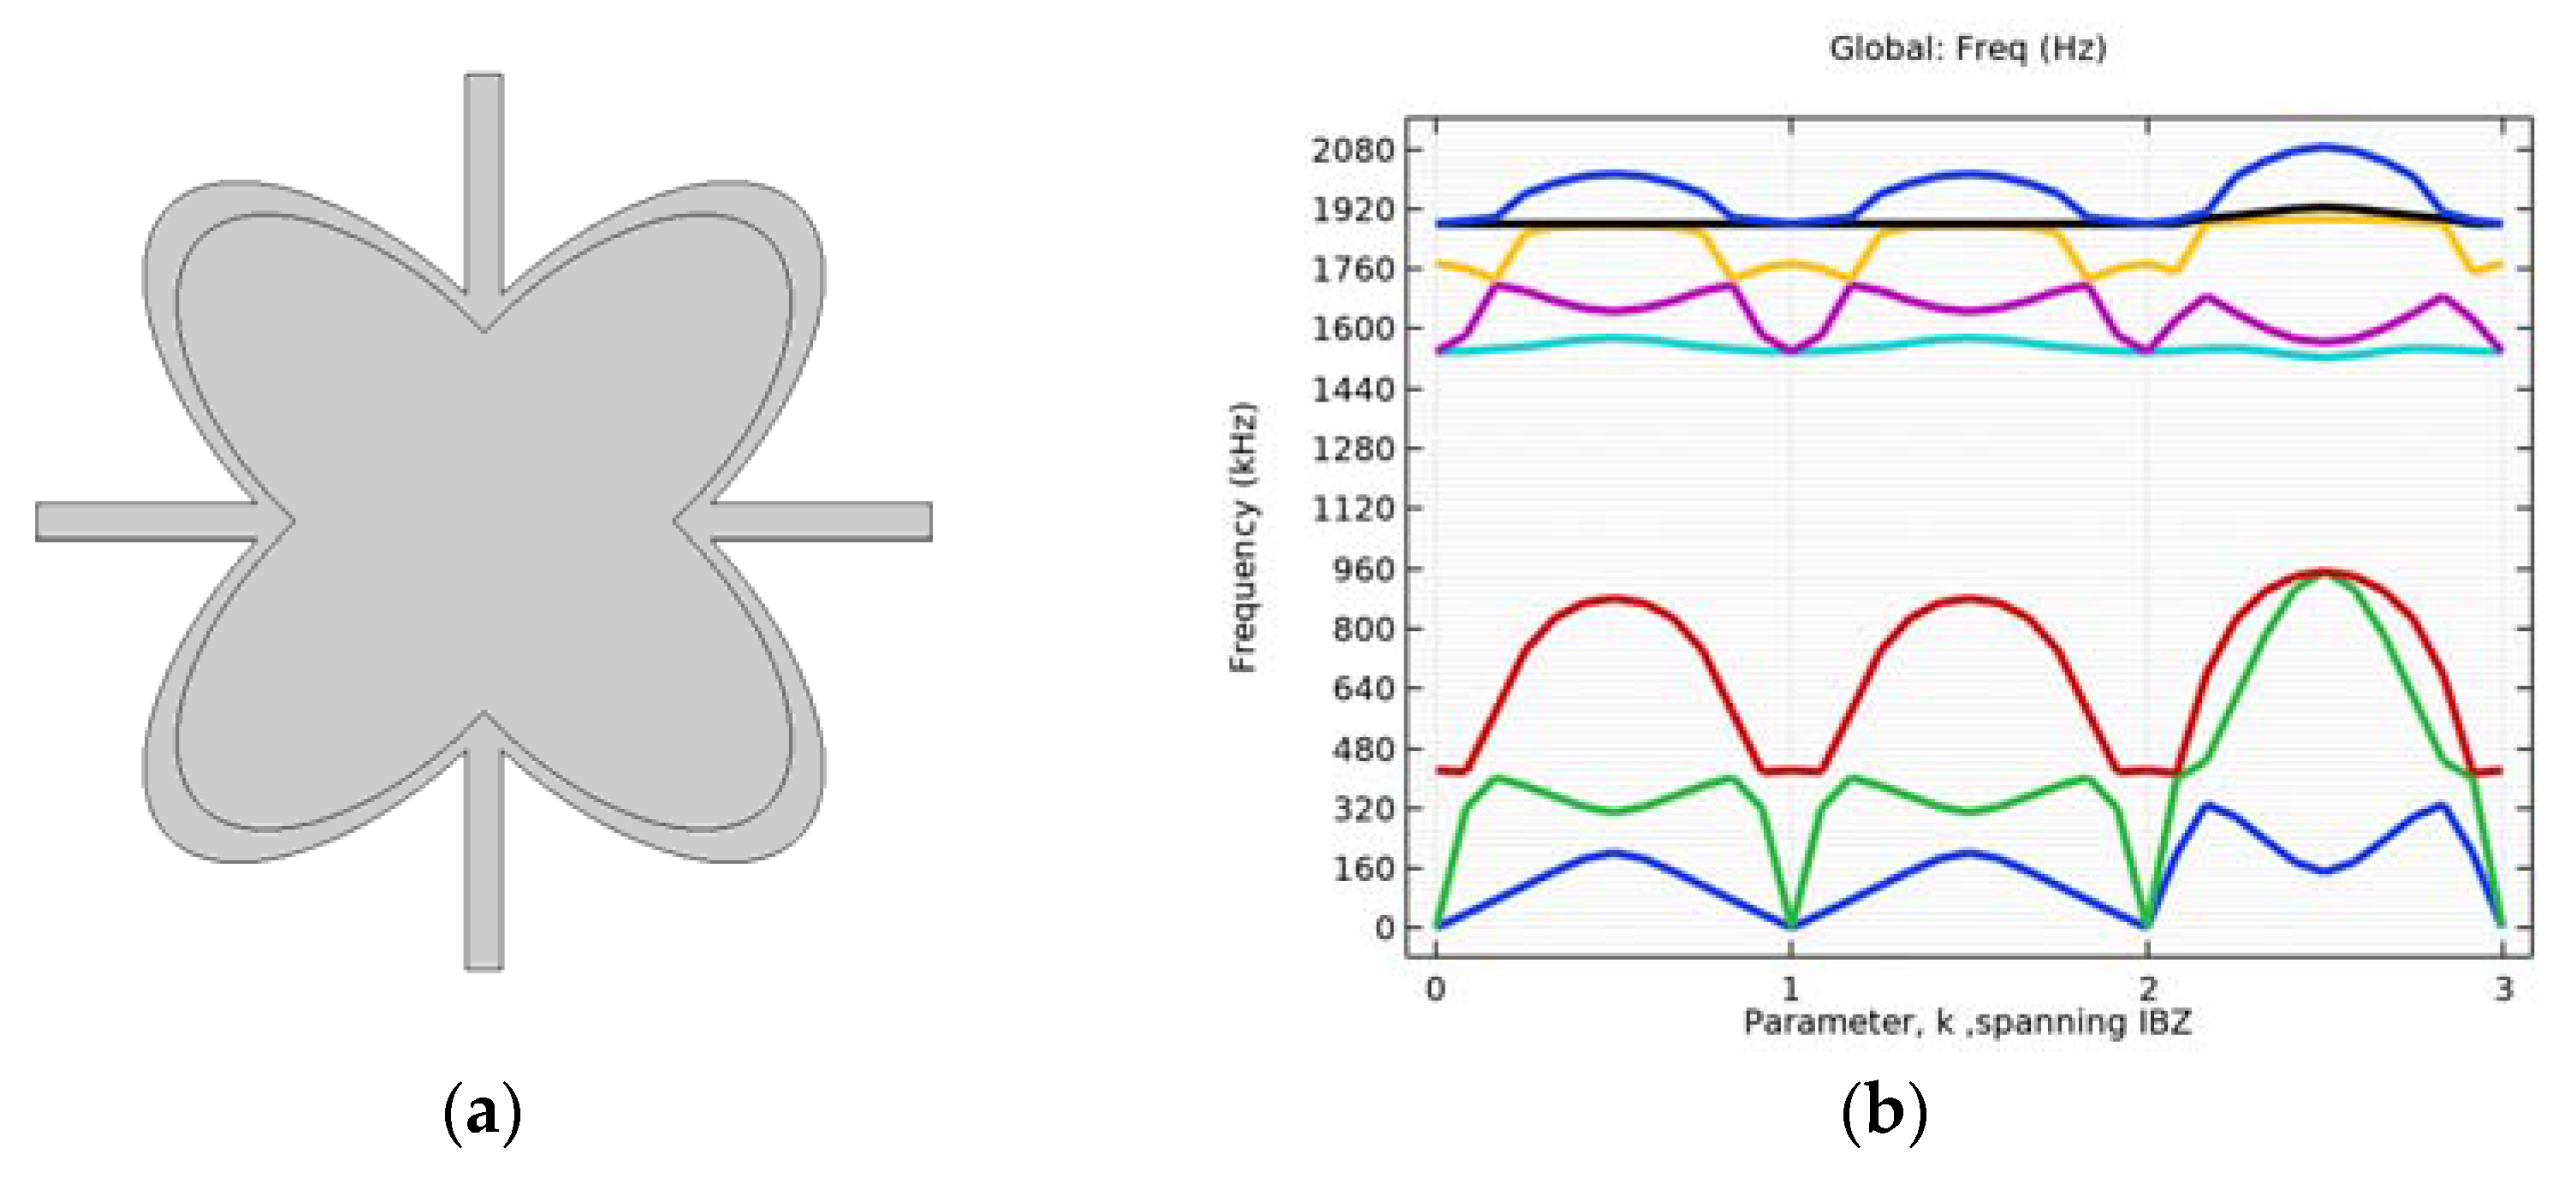
4.1. Simulation of Initial Structure with and without Circular Inclusion

The first step was to search for the presence of bandgaps in the geometry with and without the circular inclusion, see Figure 3. The circular area inside the structure has a radius of 50 mm and consists of the same material with the outer part of the geometry.
The response for various directions and frequencies, indicating band gaps and including the first eight eigenfrequencies, are shown in Figure 4a,b.
The bandgaps that are formed from the geometry with the inner circle, Figure 4a, are two. The first band gap is between the third and fourth eigenfrequencies (1160–1250 Hz) and the second is between the fifth and sixth eigenfrequencies (1370–1840 Hz). Similarly, there are two band gaps located on the diagram of Figure 4b, one between the third and fourth eigenfrequencies (1020–1240 Hz) and the second is between the fifth and sixth eigenfrequencies (1340–1680 Hz).

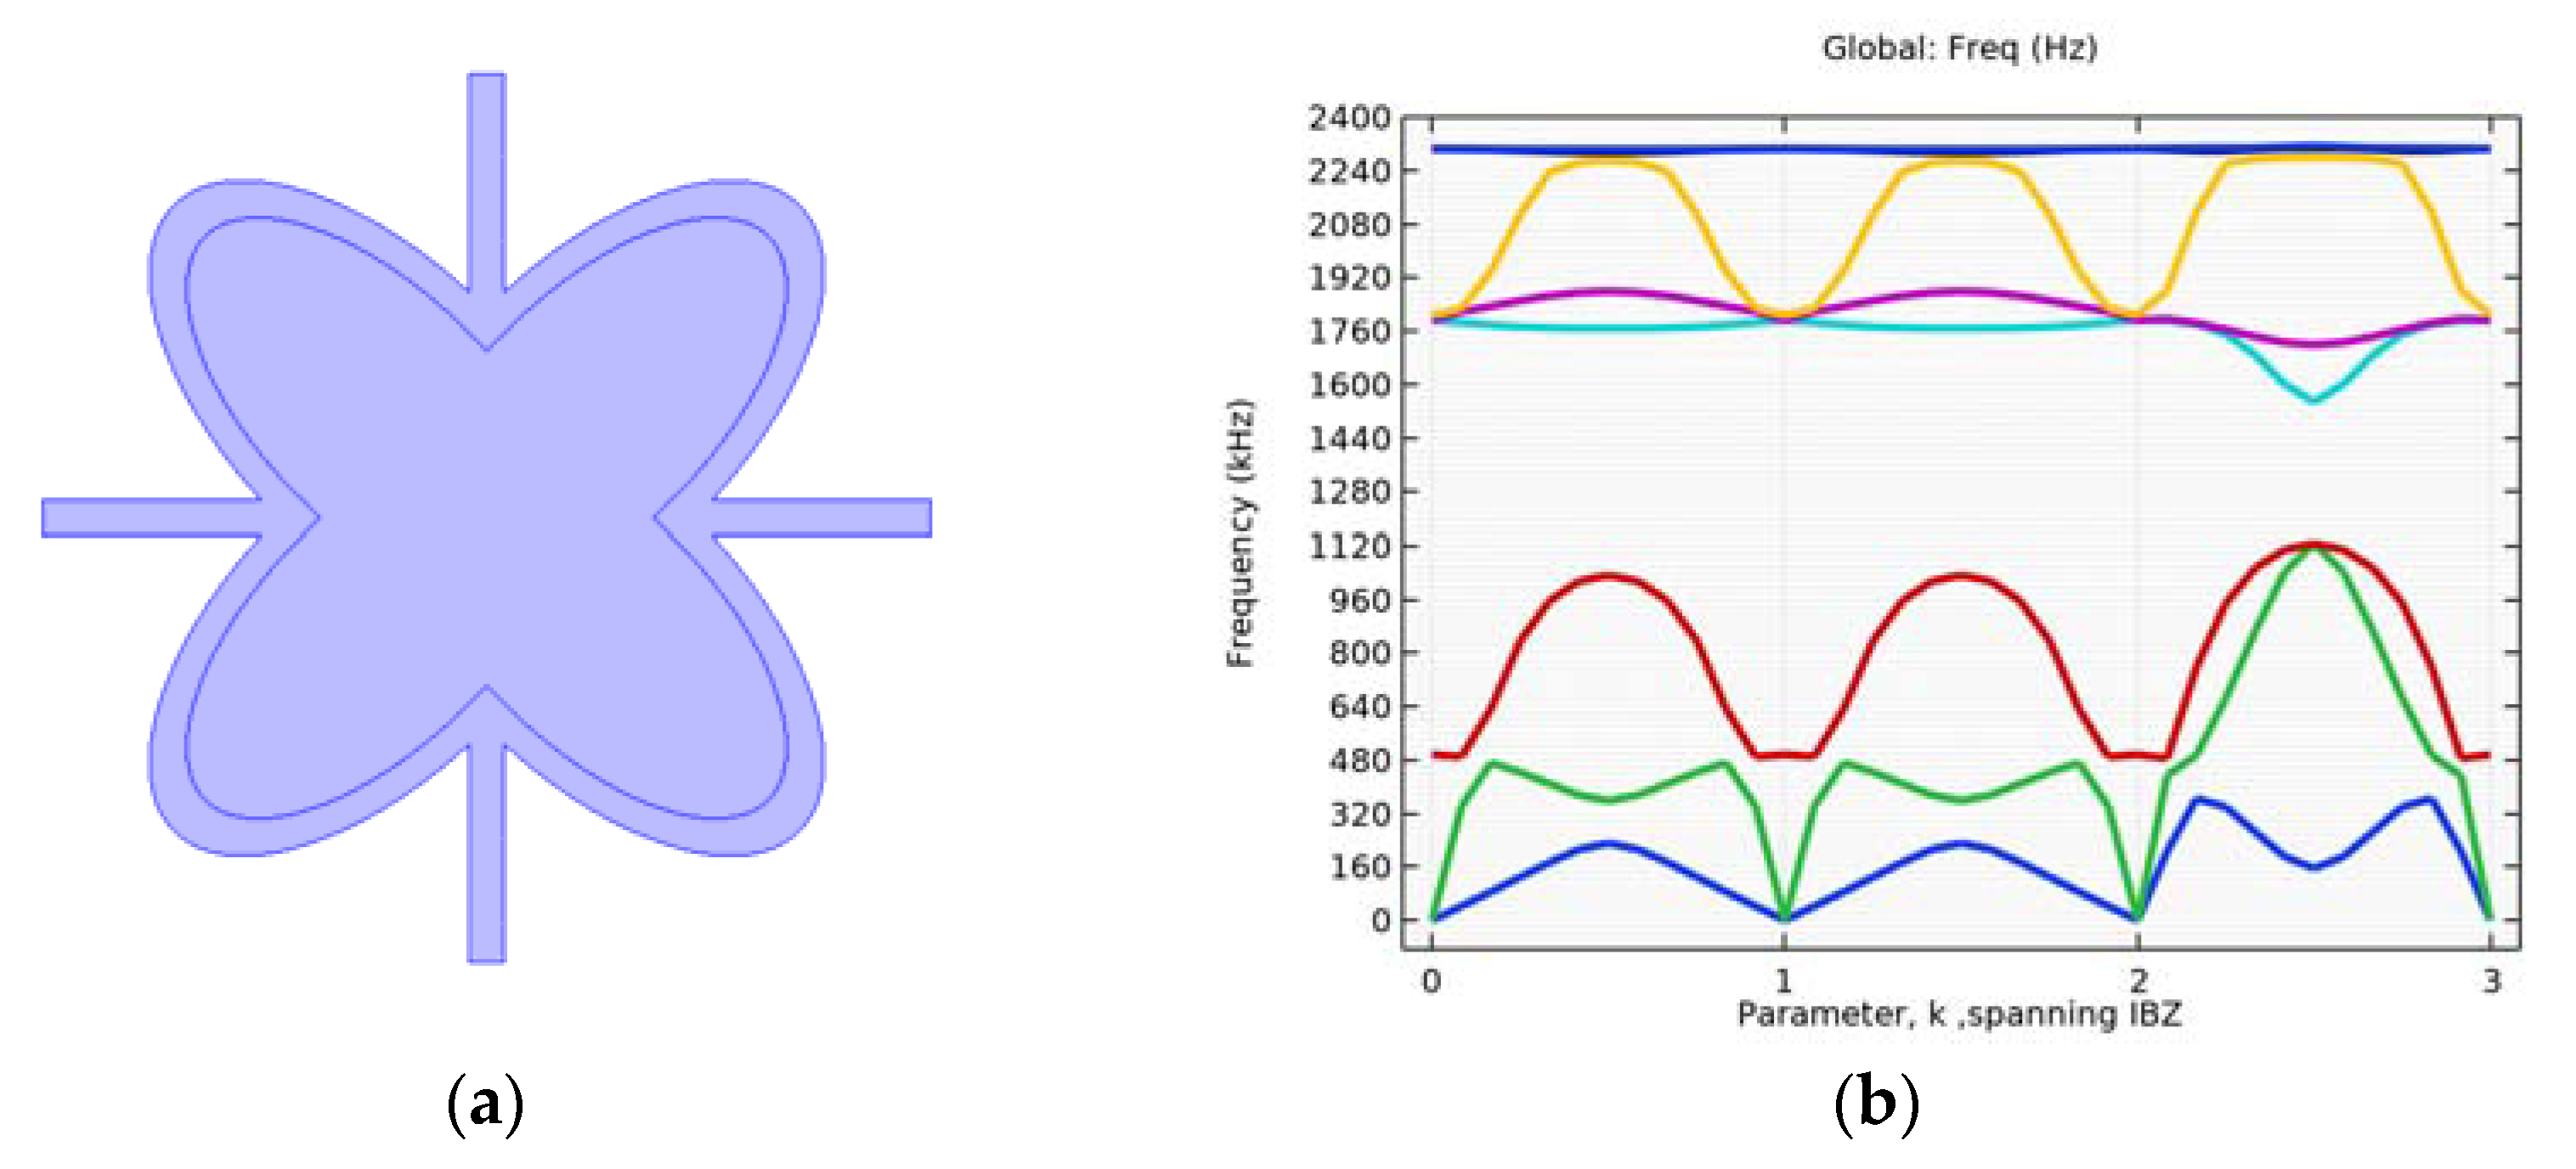
4.2. Simulation with Different Alterations of the Inner Ellipse Size

A parametric investigation with changes in the size of the inner ellipses, as well as the thickness of the outer four cross rods that surround the geometry, has been performed.
In particular, the dimensions (mm) of the inner ellipse are the following: 170 × 30, 170 × 60, 170 × 80, 170 × 90. The thickness of the surrounding rods takes the values 3, 6 and 12 mm.
In Table 3, Table 4, Table 5 and Table 6, the results concerning the different frequency ranges are presented together, for which we notice that there is a consistency with the existence of some bandgaps between the fifth and sixth eigenfrequencies.
Then, investigating the combined performance of the elements that we examined individually and constructing different variations of the grids, we notice that the range of frequencies for which the propagation of a wave is interrupted is located between the values that vary between 1150–2000 Hz.

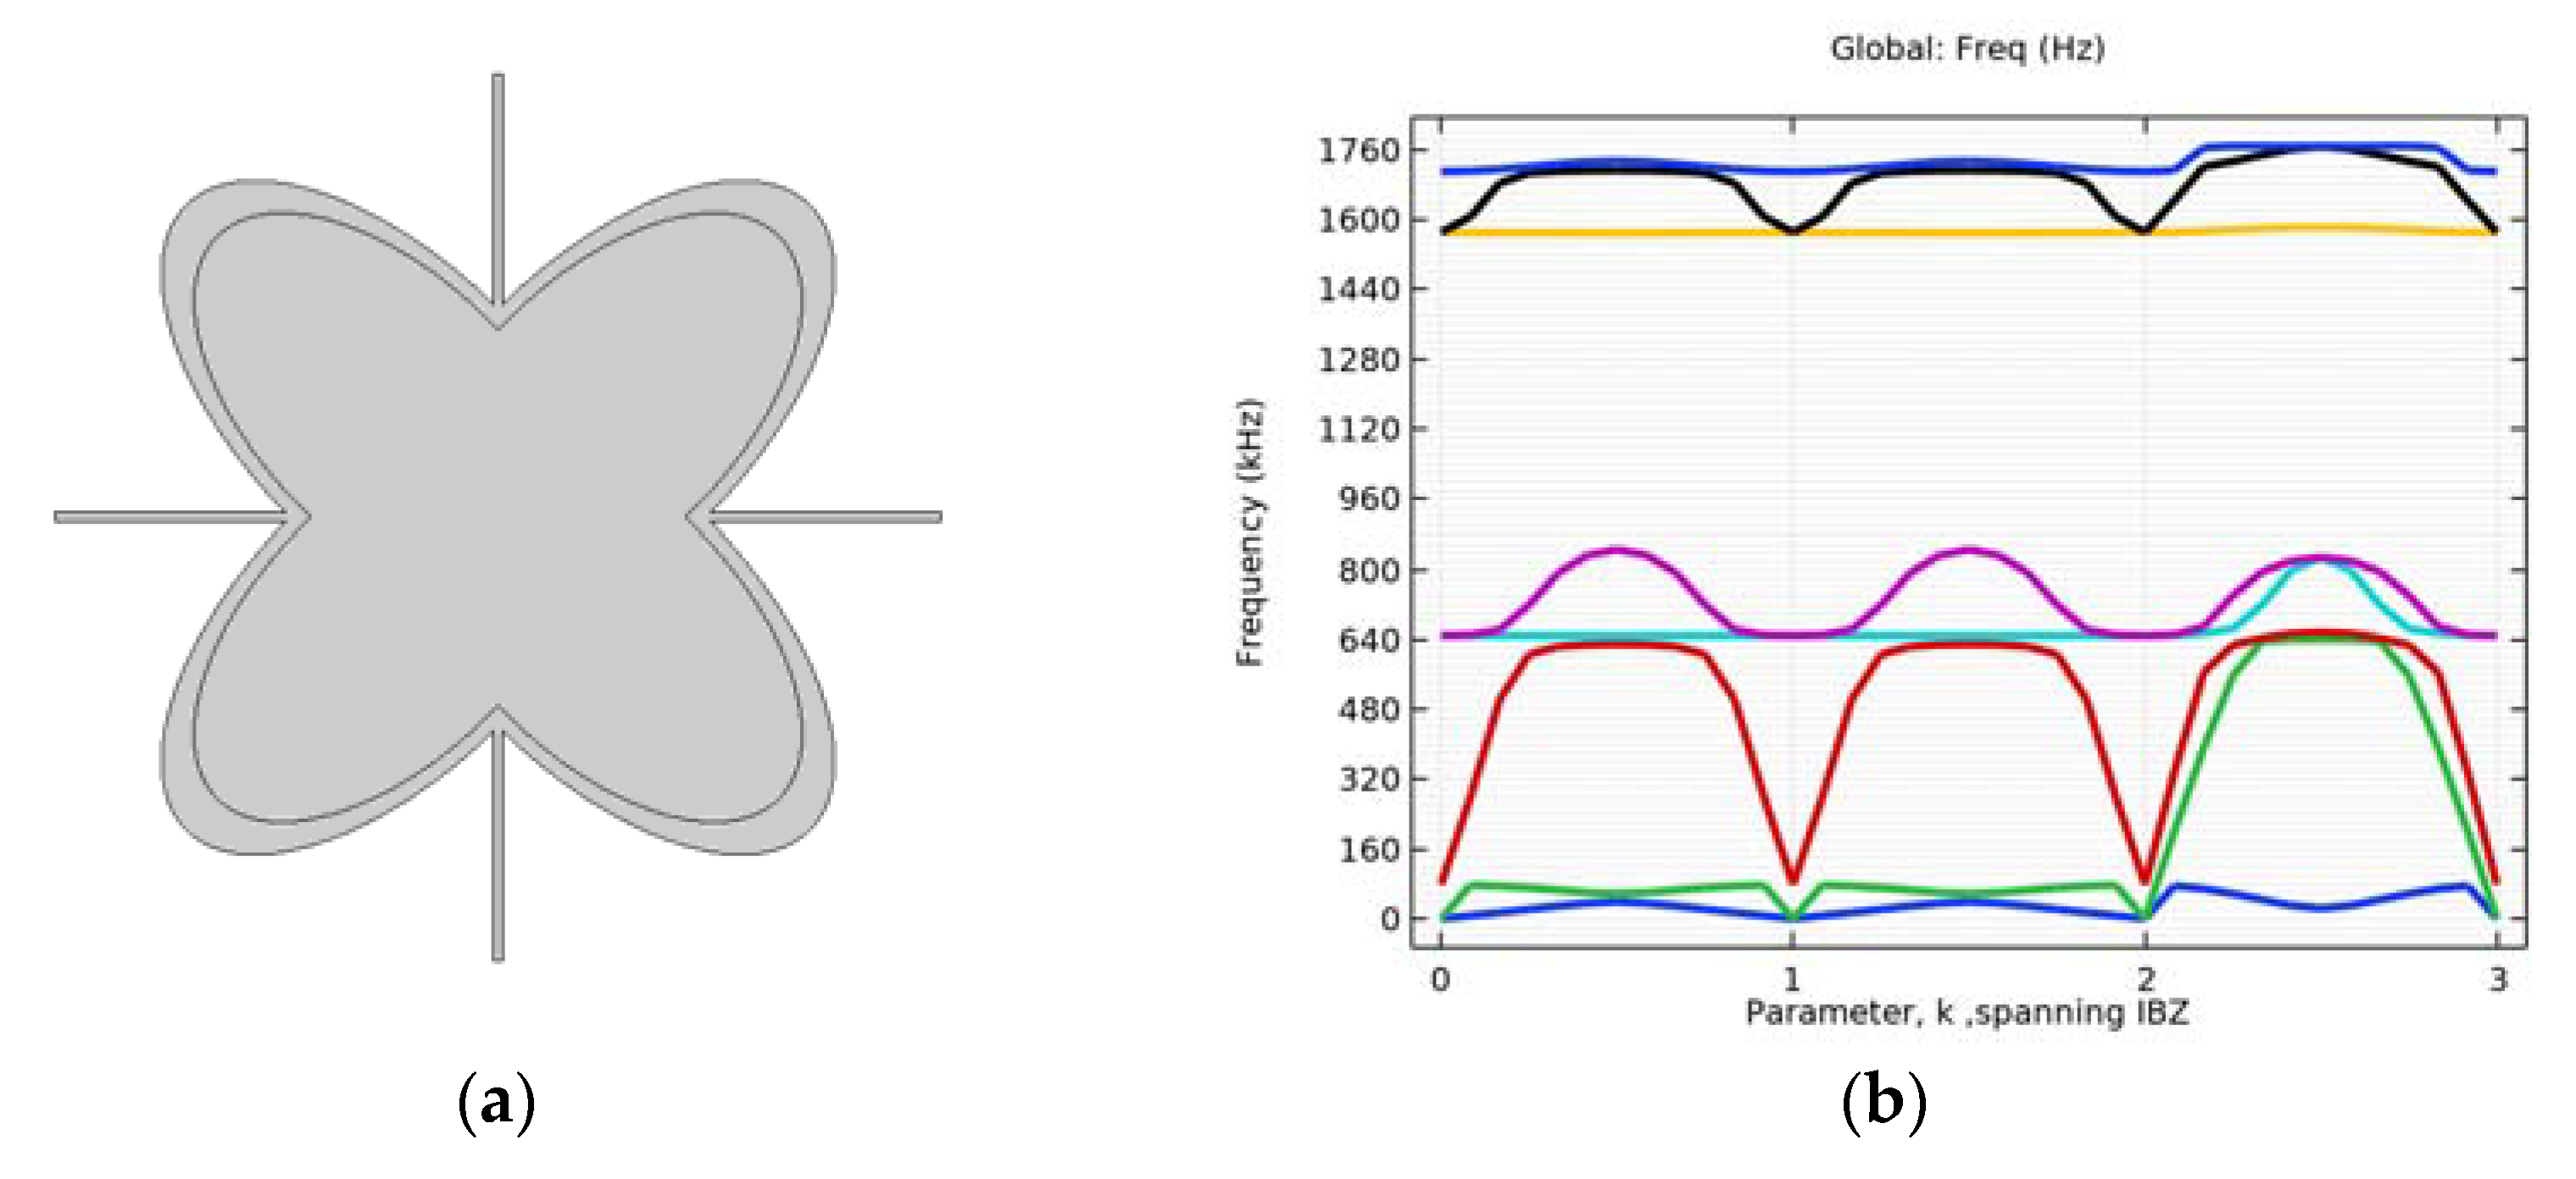
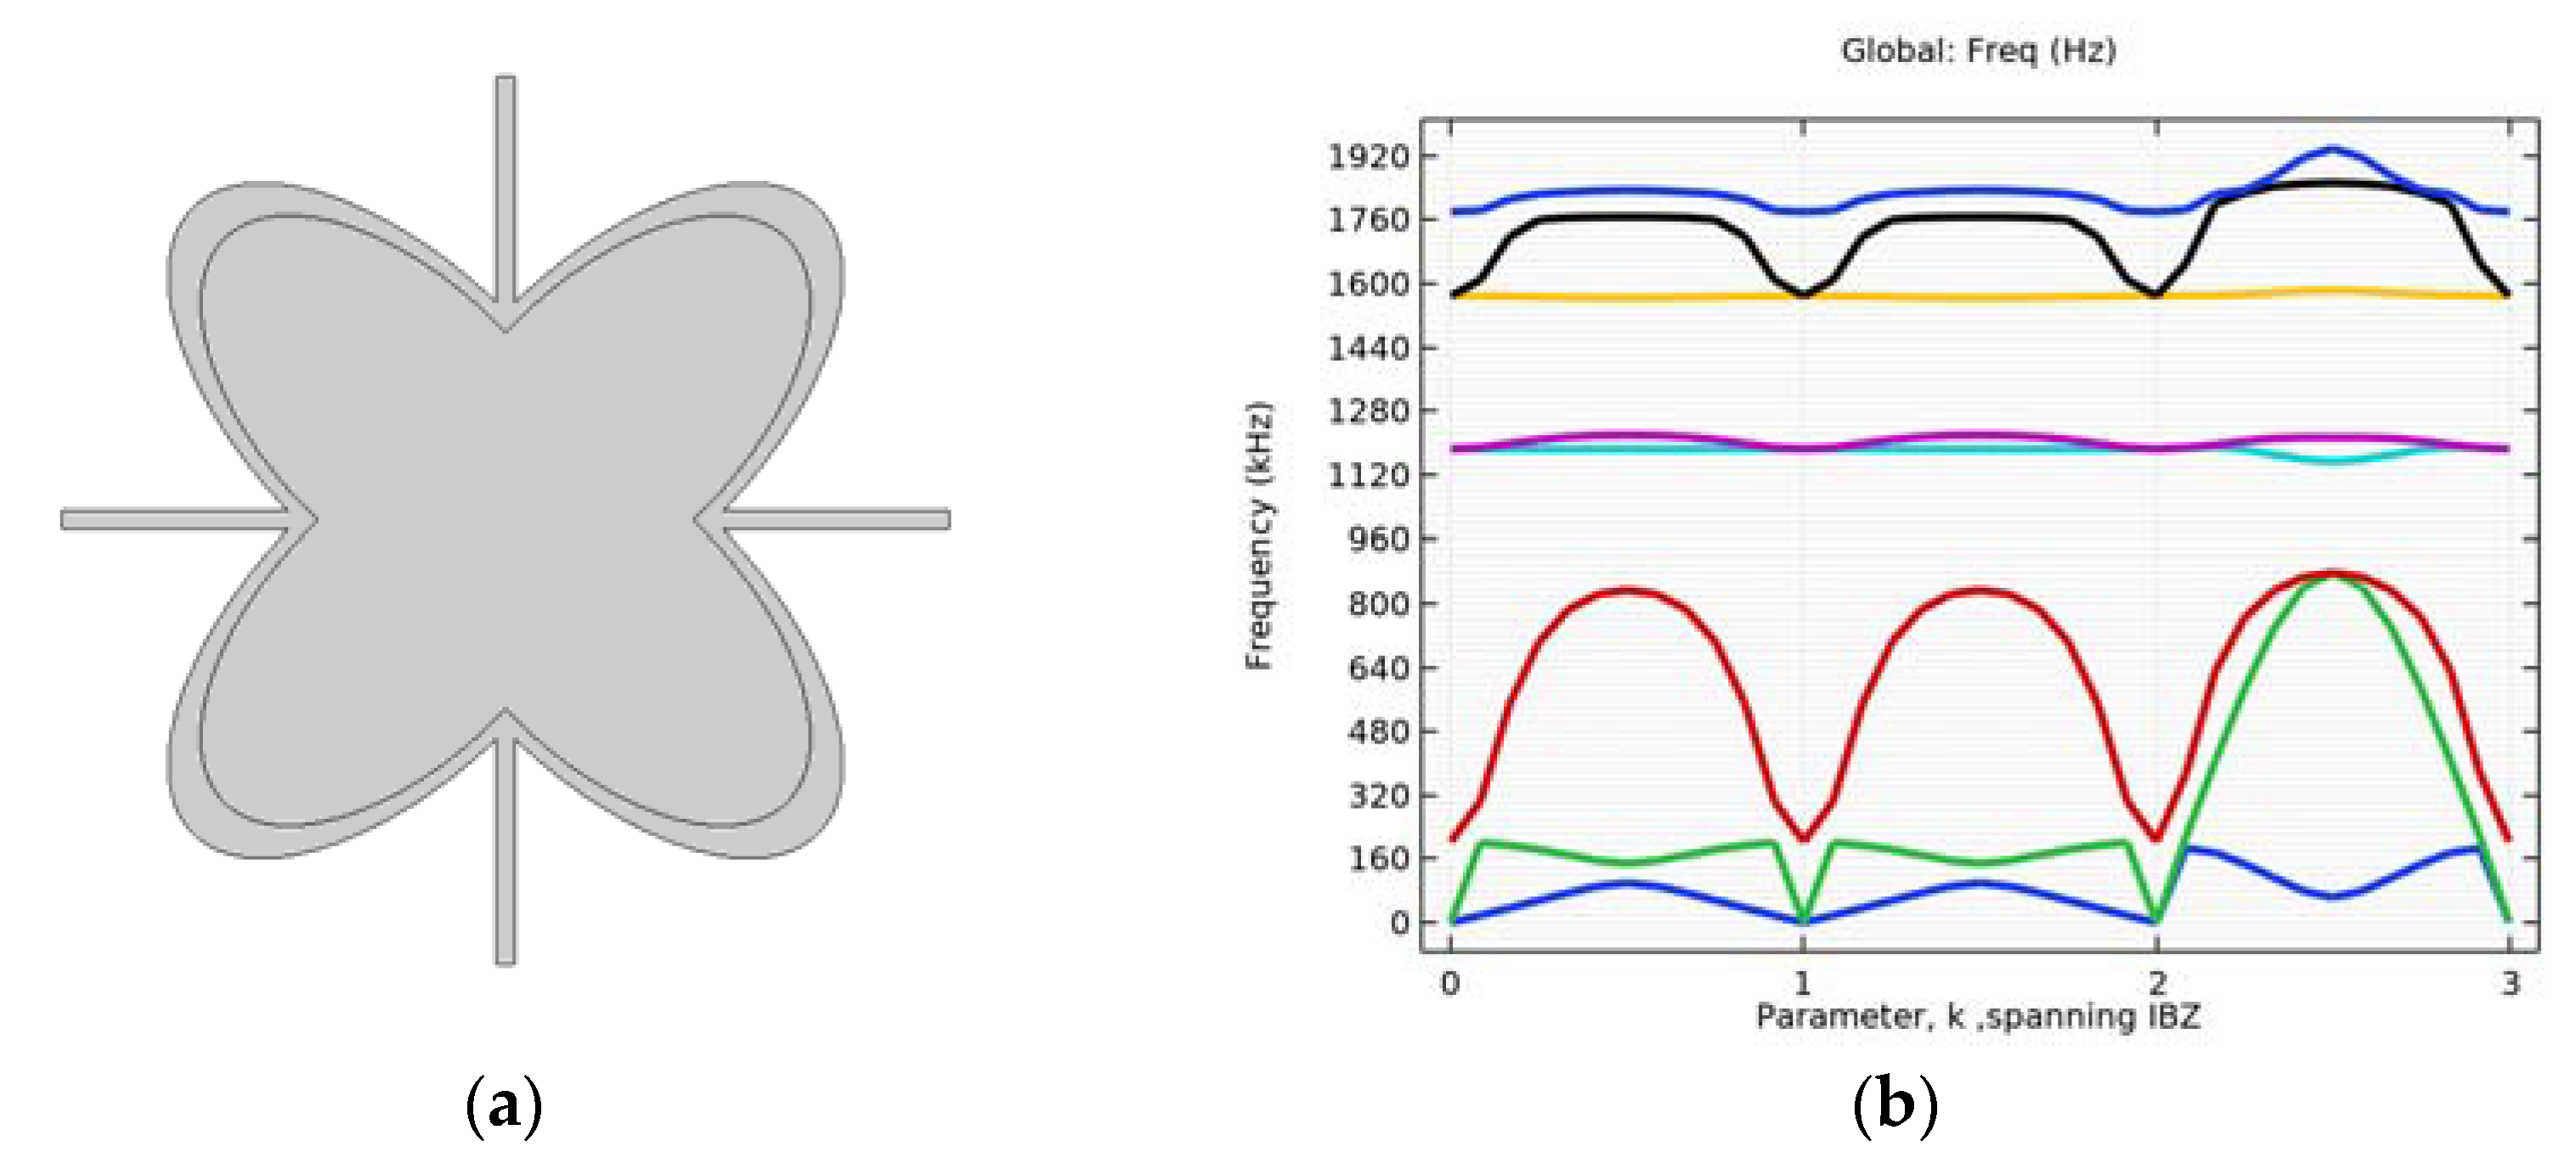
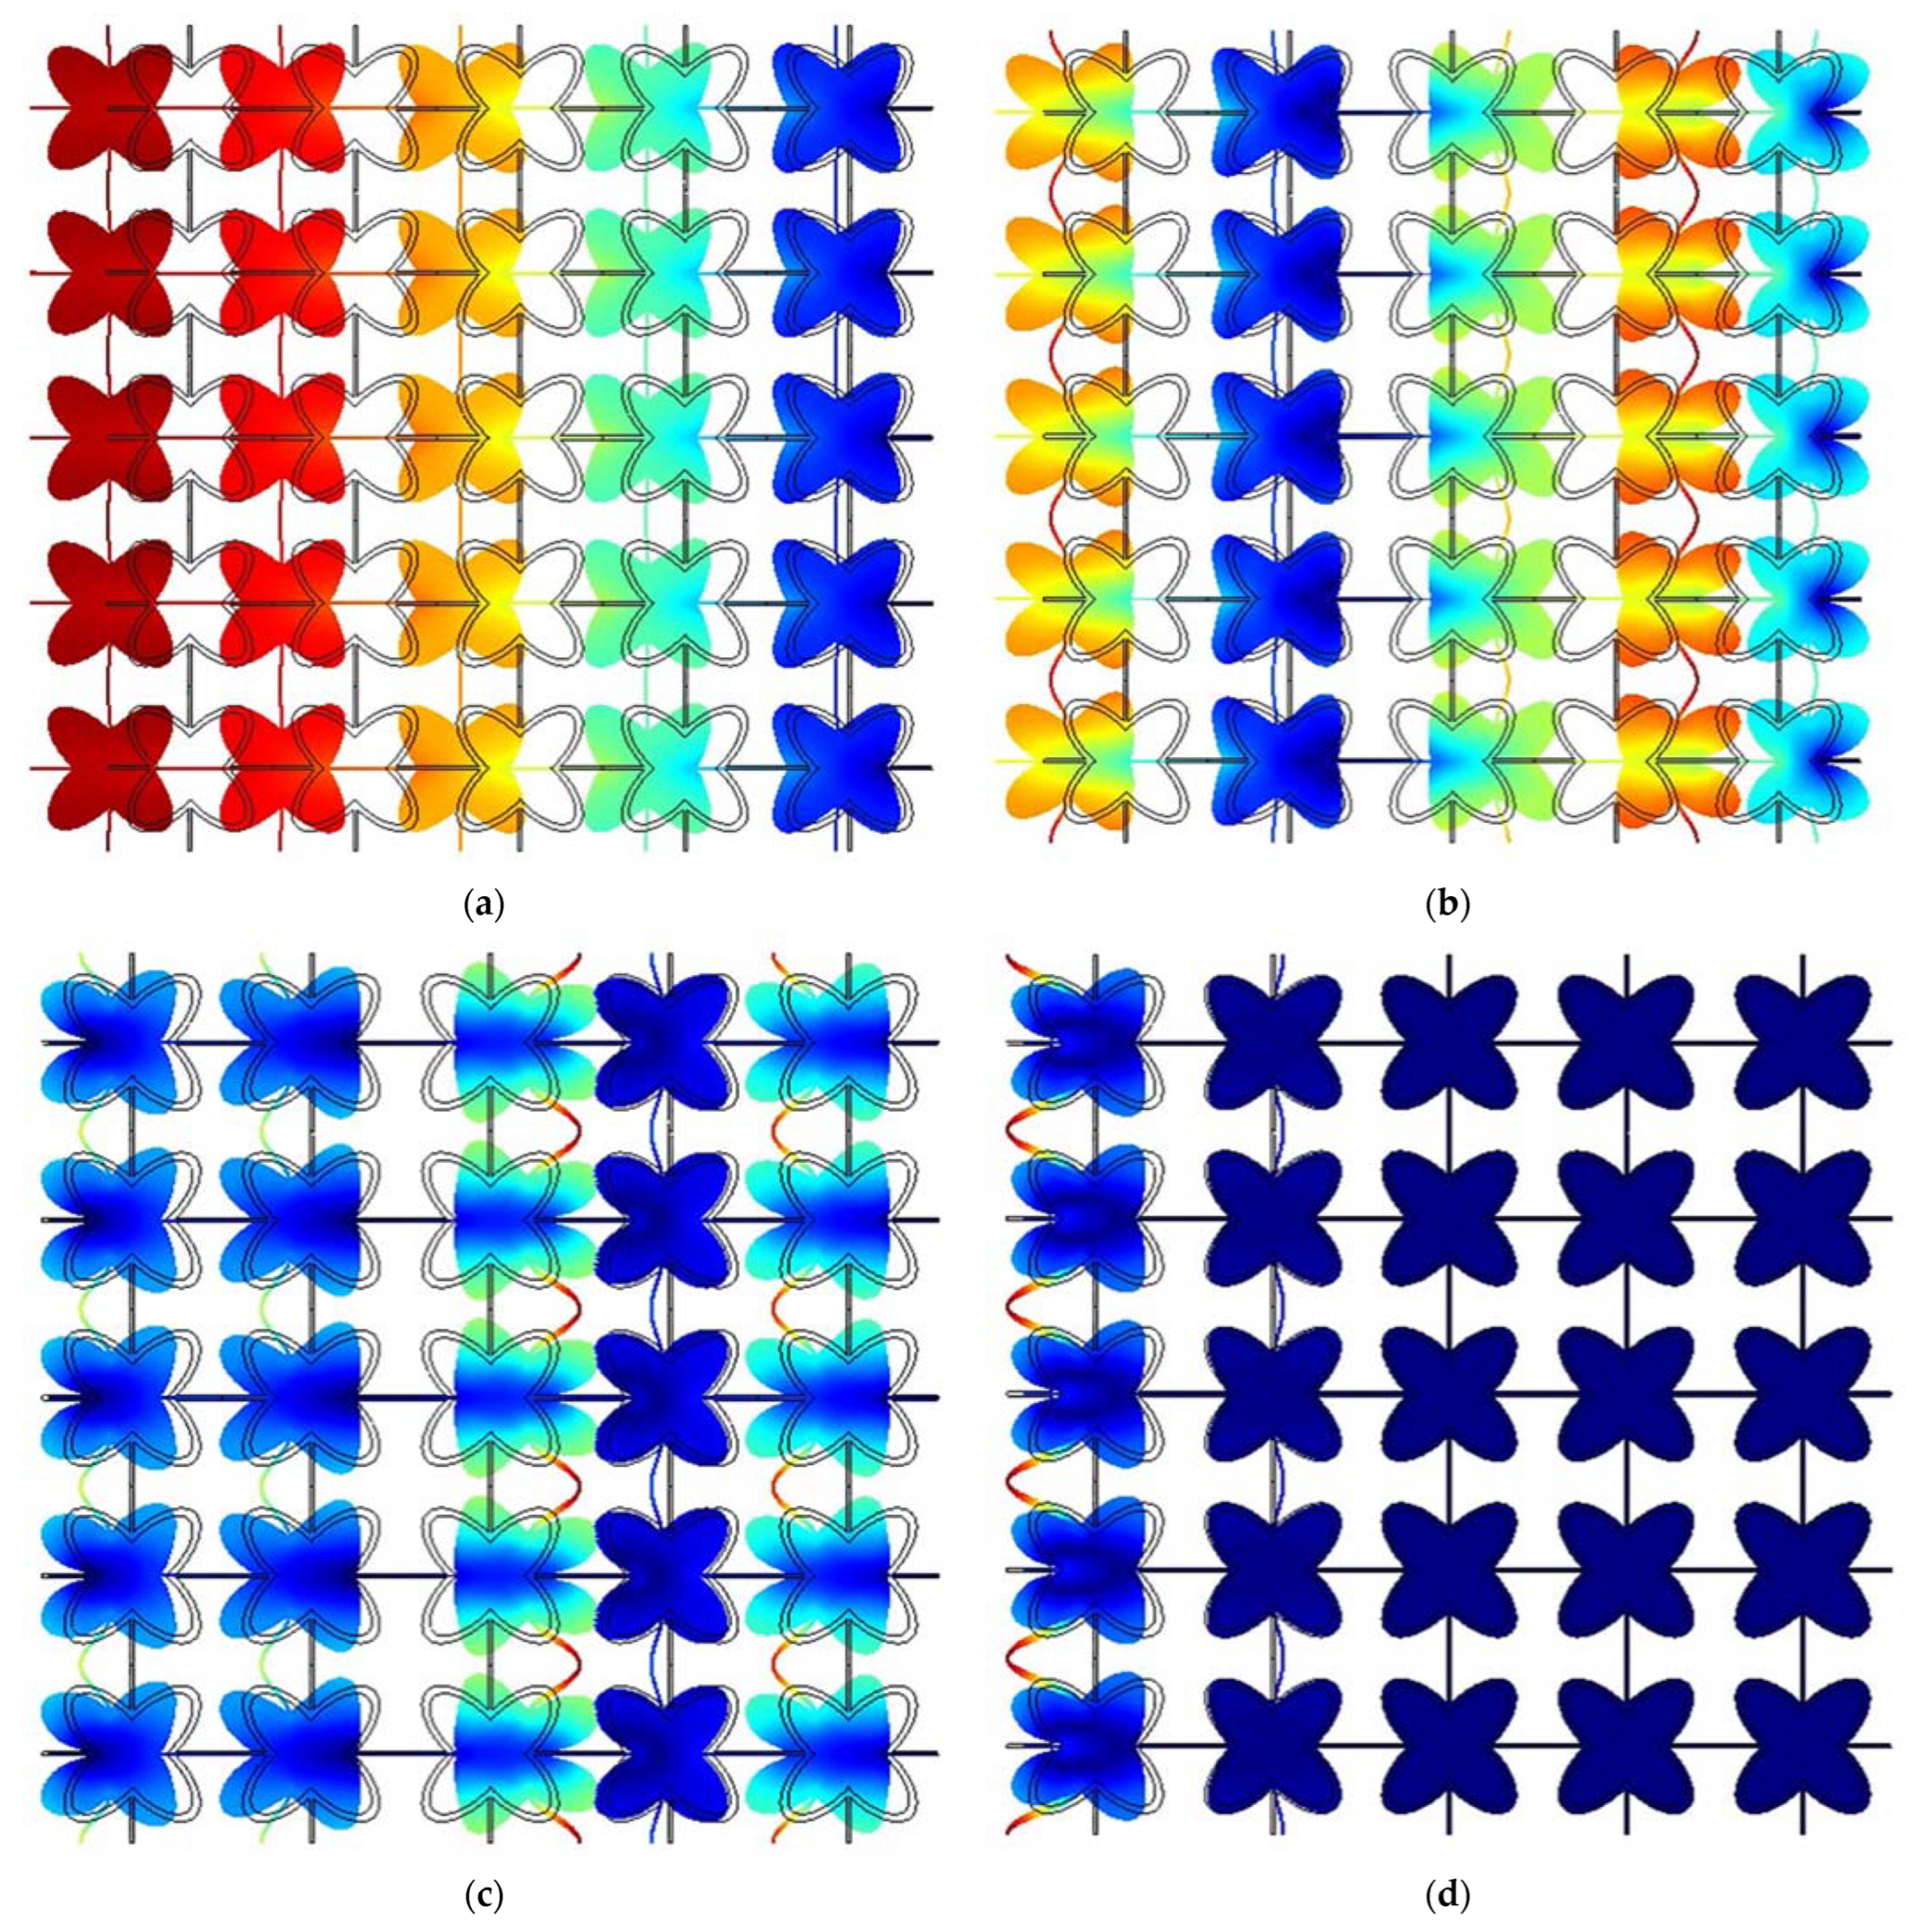
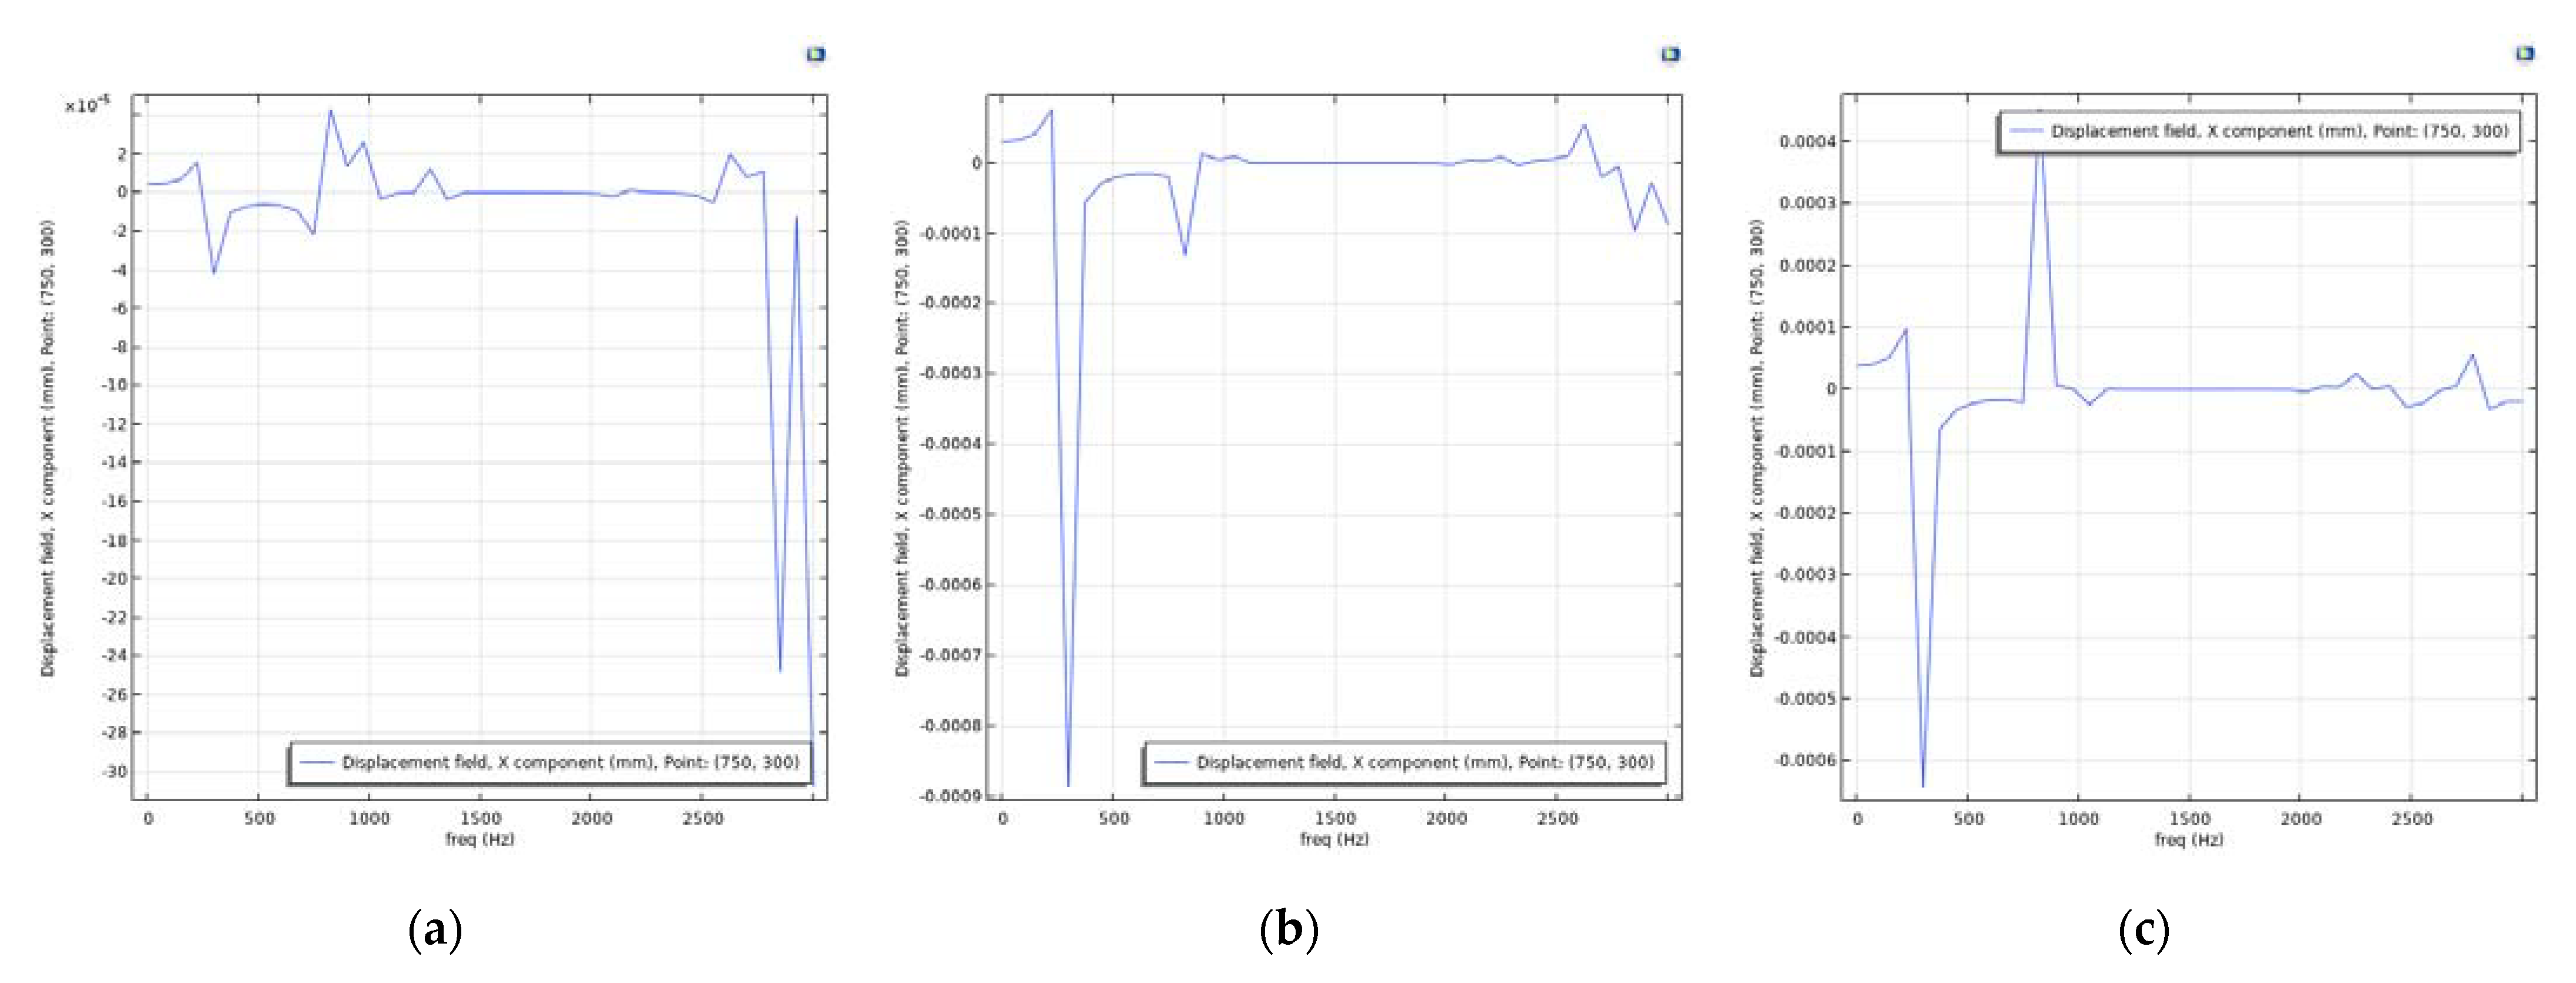
4.3. Verification on a Continuum with Microstructure

The study continued with the construction of a two-dimensional continuum, including microstructures. In particular, five rows and five columns with the following characteristics have been considered (Figure 16):
  • Dimensions of outer ellipse: 200 × 100 (mm)
  • Dimensions of inner ellipse: 170 × 80 (mm)
  • Rod thickness: 6 (mm)
In order to study the behavior of the mesh, a boundary load of 10 MPa has been applied on the five sides of each protruding bar in the left part of the mesh. The displacement results are collected for a point at the center of the grid, which will move as long as the applied force produces a wave capable of penetrating the grid. The frequency response of the grid is in accordance with the band gap analysis of the unit cell,.
Figure 17 shows how the grid geometry is affected for different frequencies of boundary load application. The grid was tested at frequencies between 0 Hz–2000 Hz, with a step of 25.

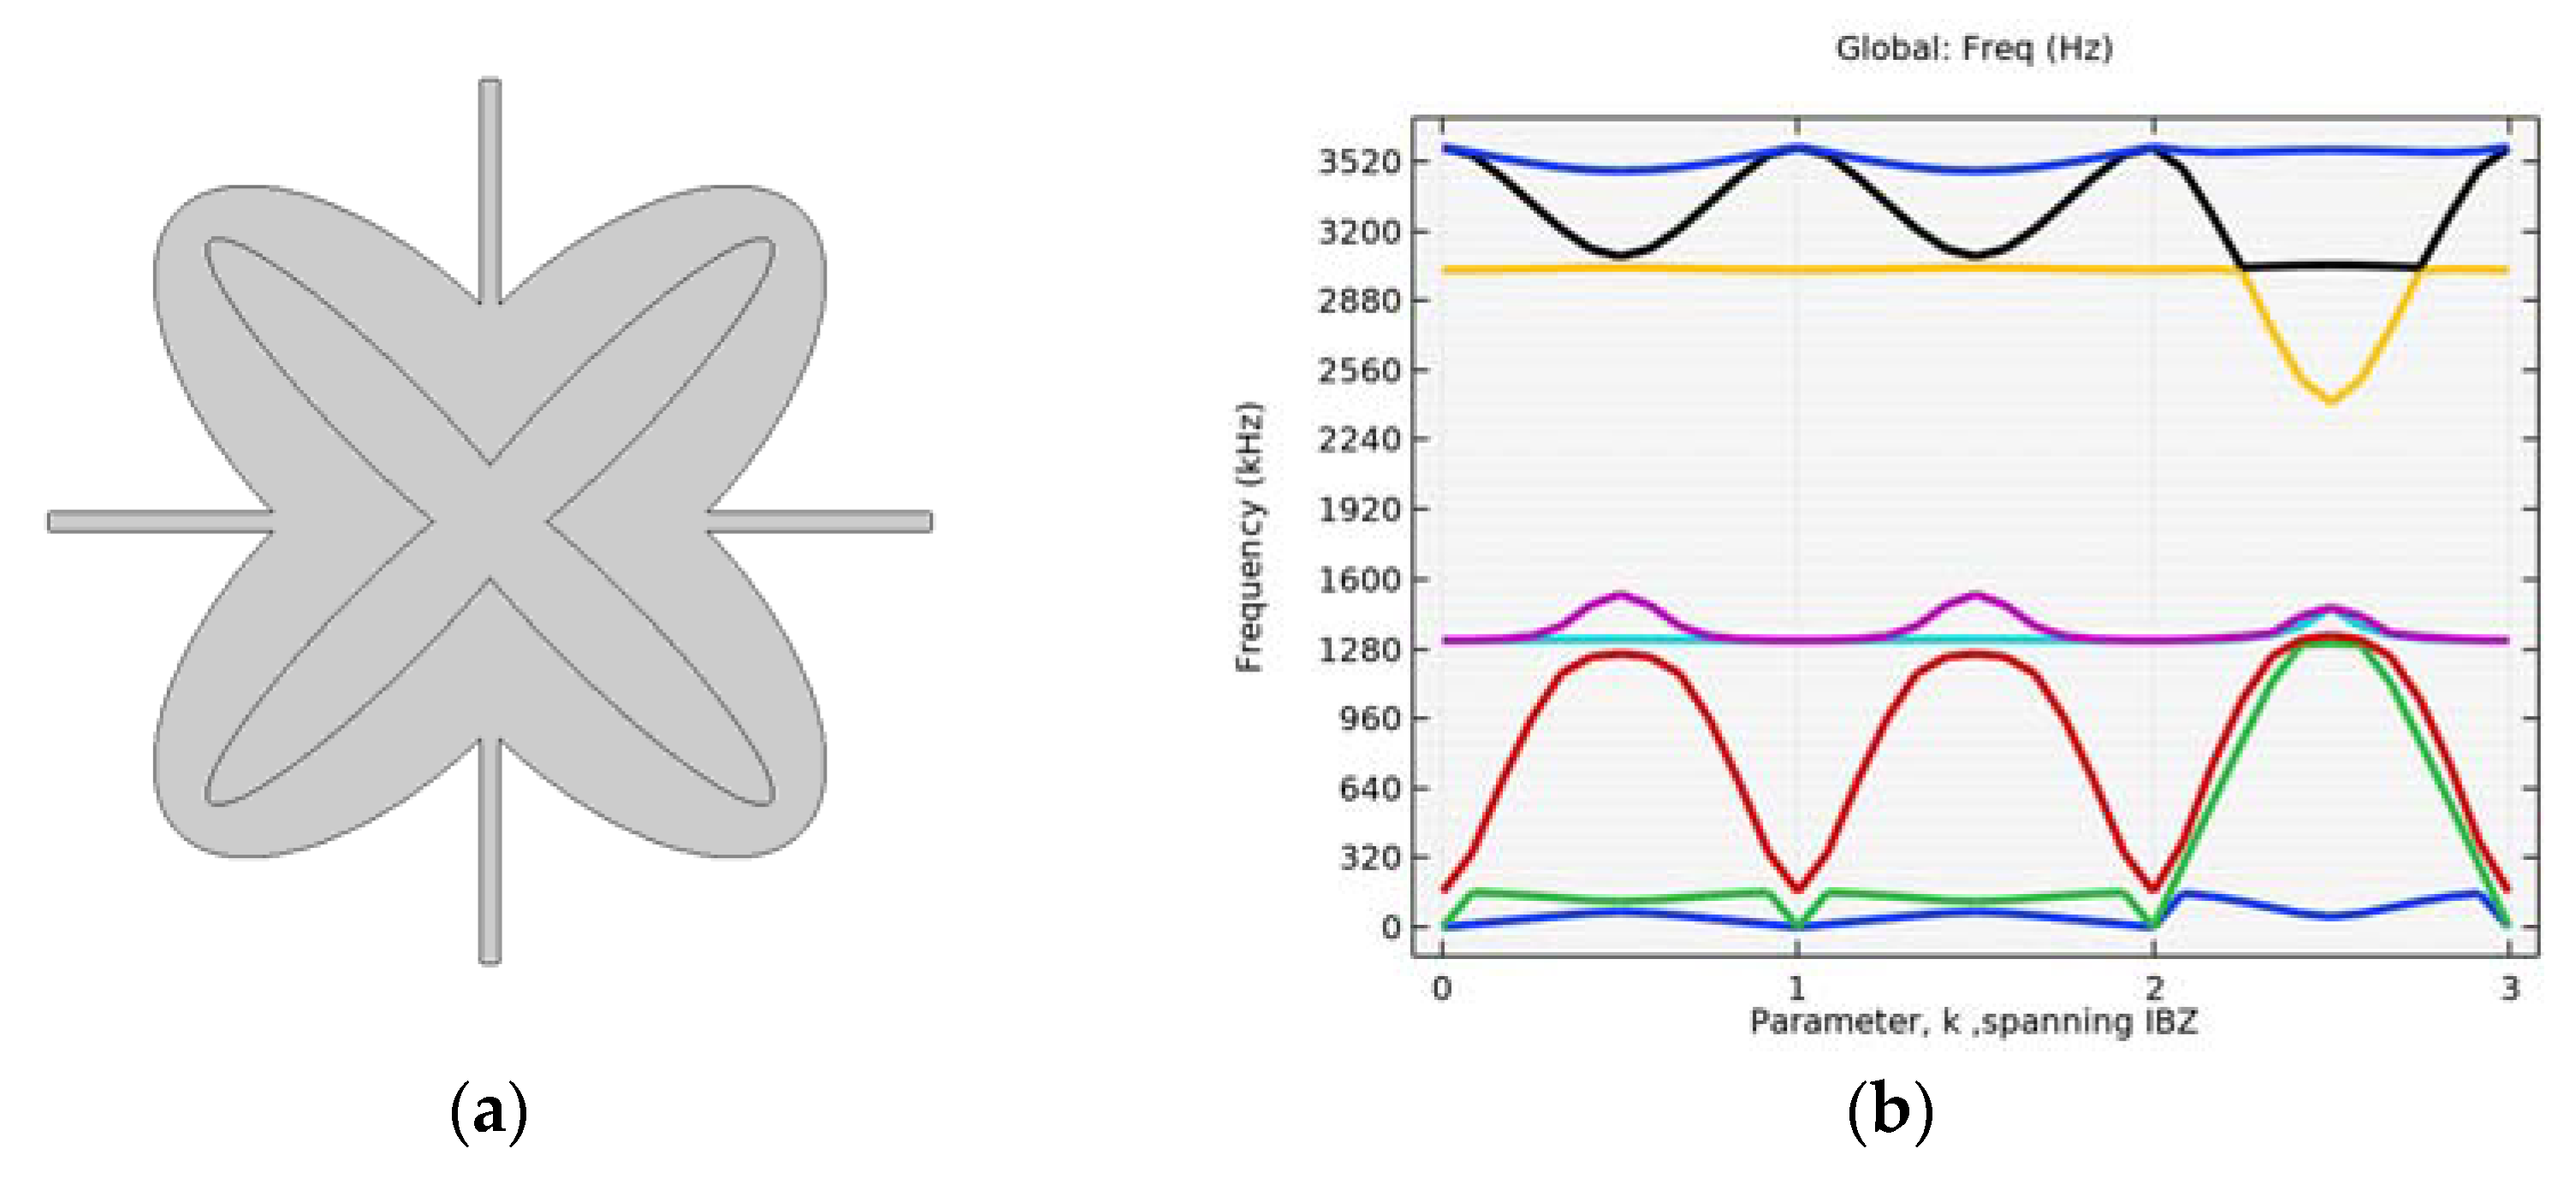
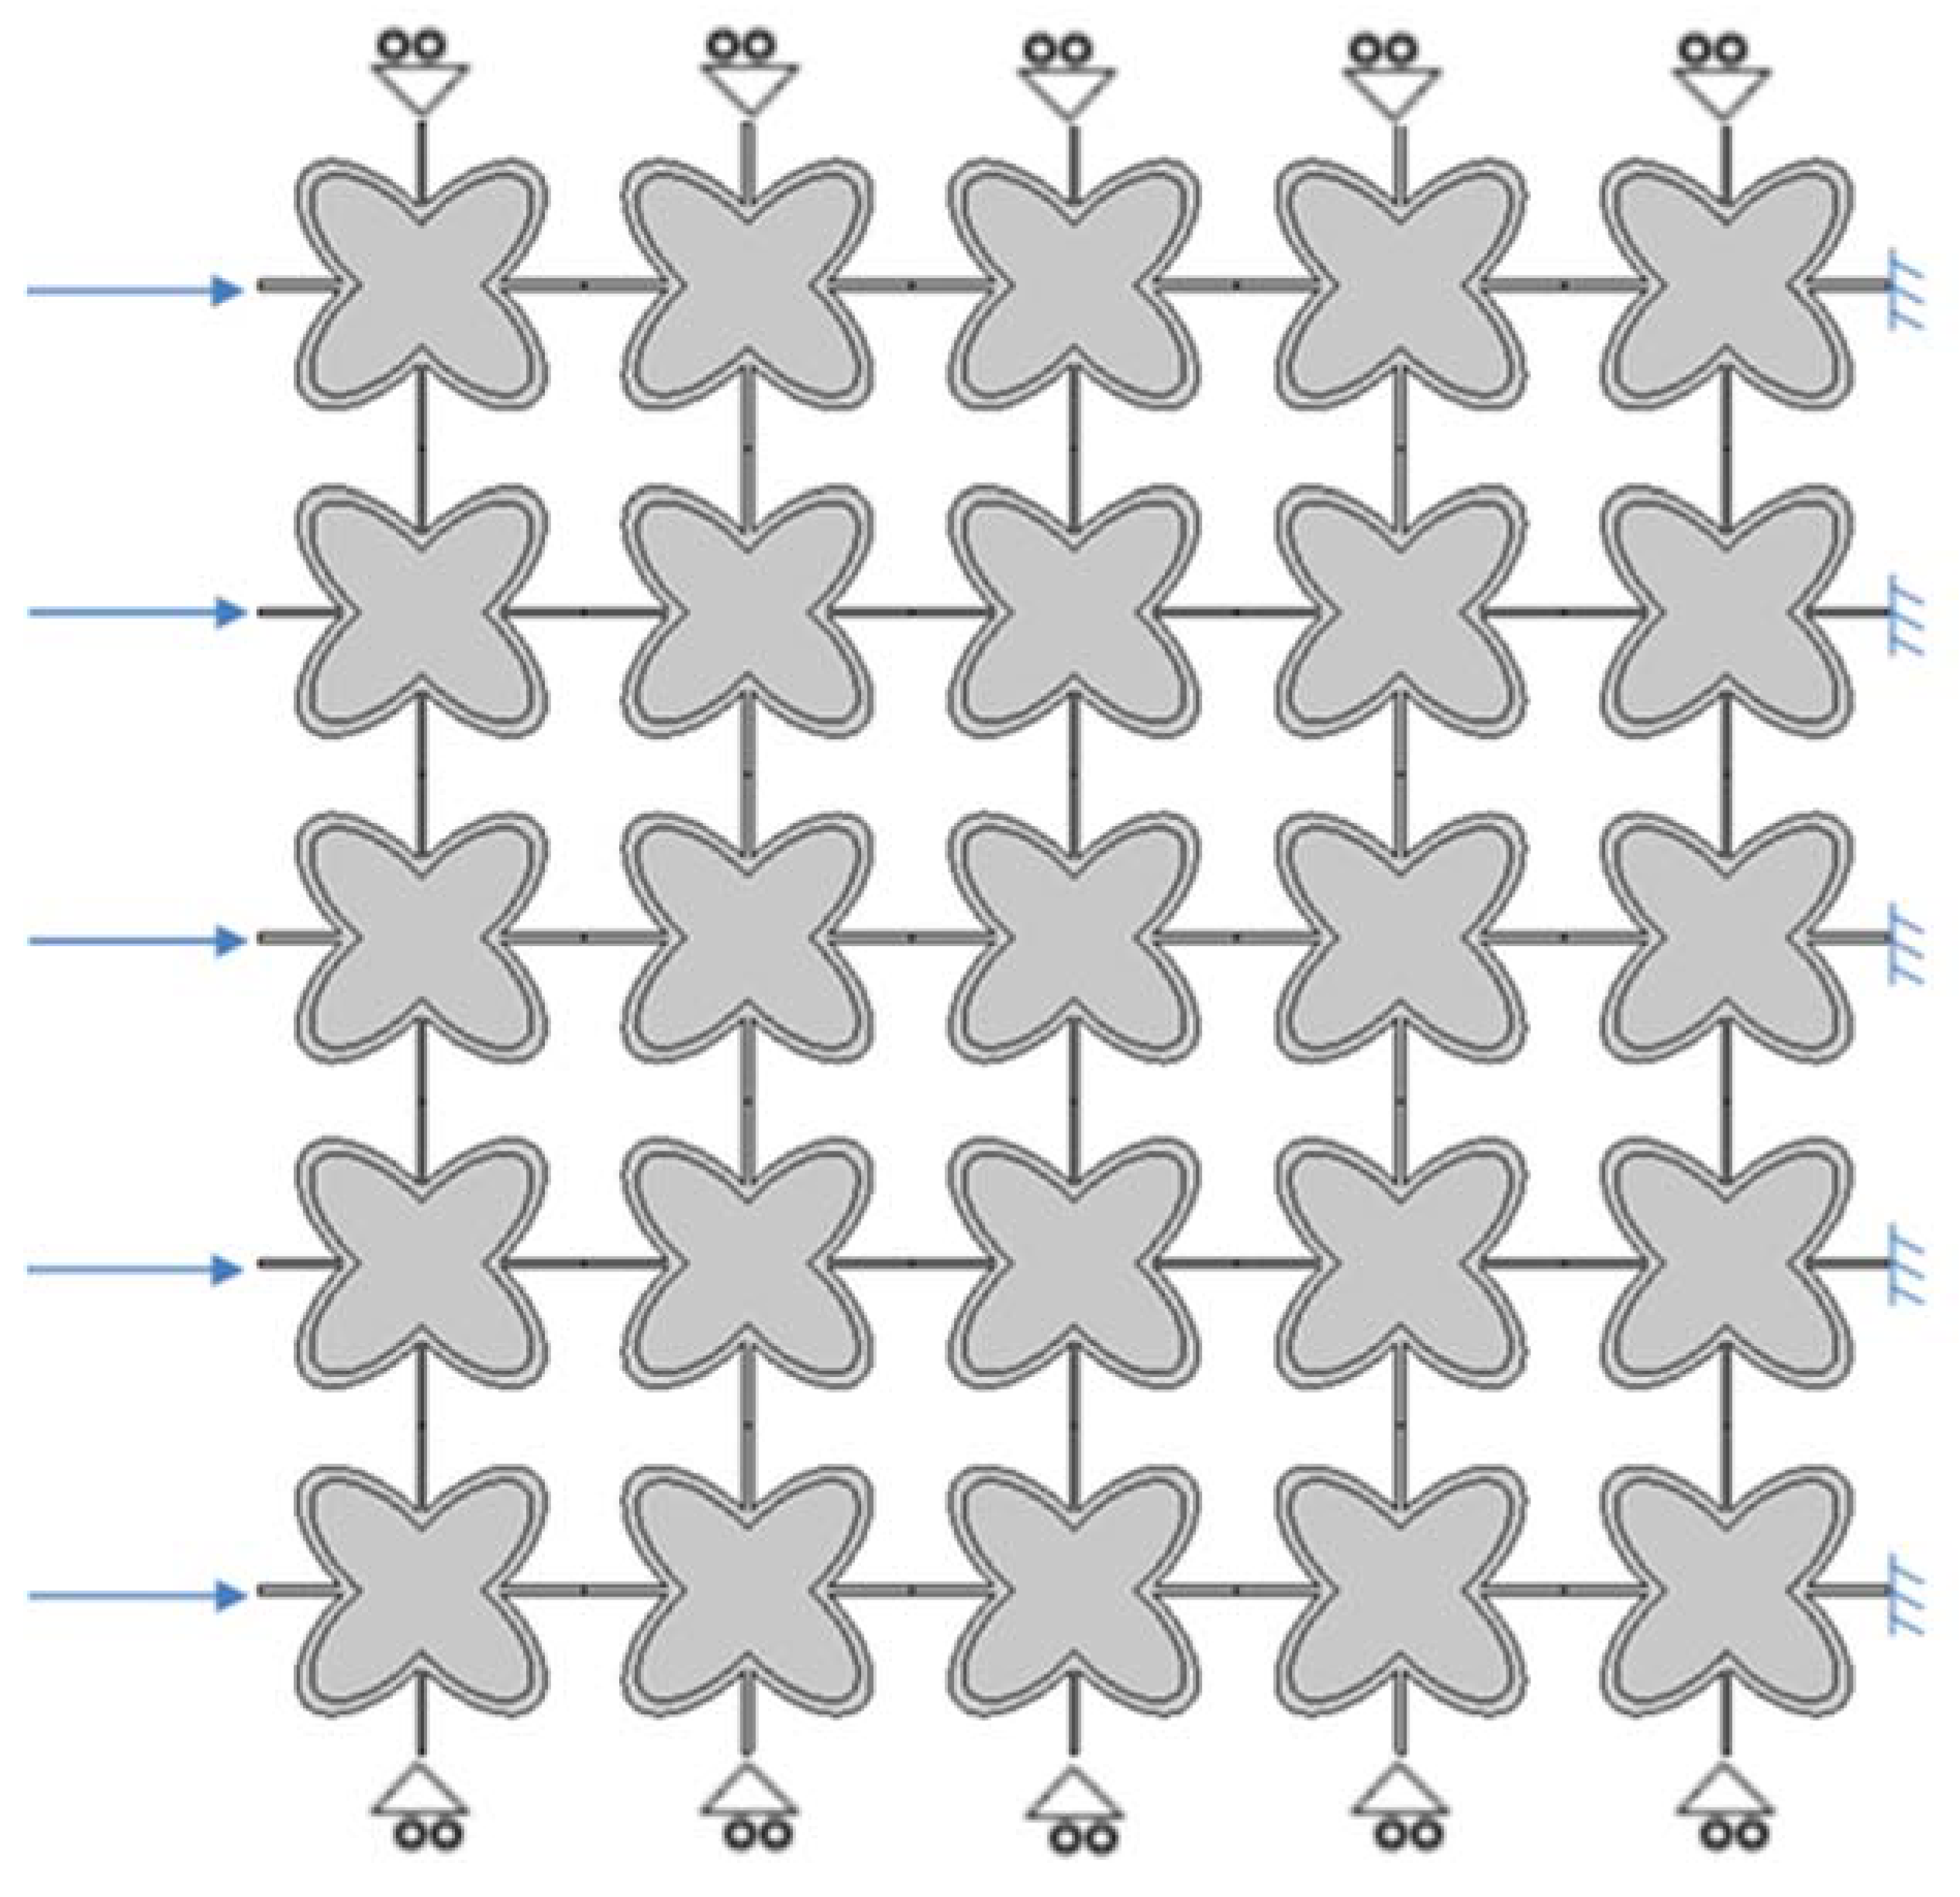
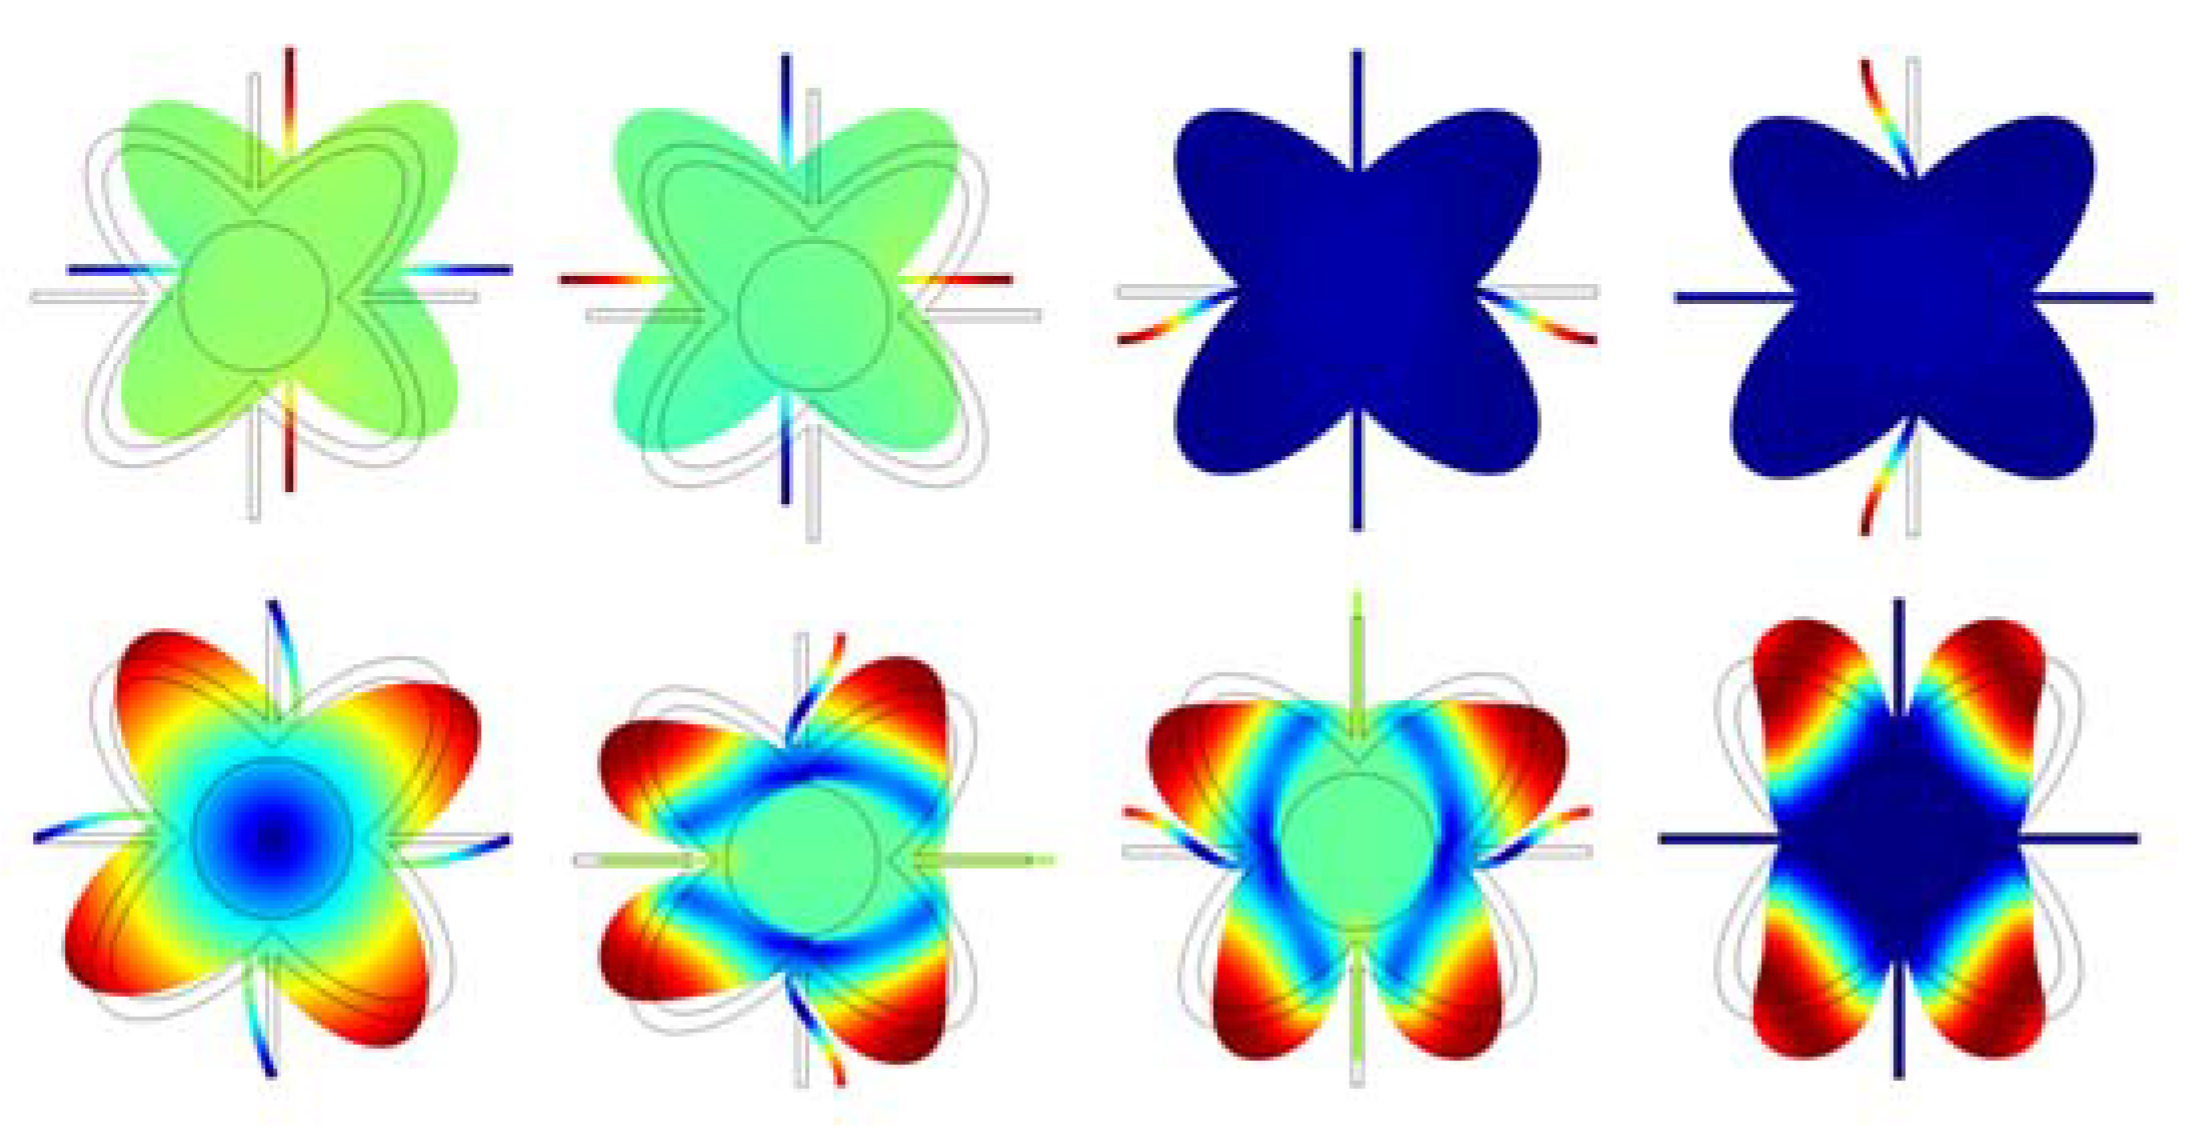
4.4. Investigating the Effectiveness of Combined Microstructures

Taking inspiration from the design of photonic devices, the usage of different microstructures that block the waves in different frequencies is proposed. The resulting continuum will eventually present wider band gaps with respect to the one that is composed of one single microstructure.
The characteristics of the studied grid are presented in Figure 18. Specifically, it consists of elements with an internal ellipse of dimensions 170 × 80, in a combination of 6 and 12 mm thick bars. The second element consists of an internal ellipse of dimensions 170 × 40, with a circular inclusion of 40 mm diameter and 12 and 15 mm thick bars.
For the microstructure with the internal ellipse of dimensions 170 × 80 and the one with internal ellipse element 170 × 40 and circular inclusion ø40, the results are summarized in Table 7 and Table 8, respectively.
Figure 19 show the frequency-displacement diagrams for the grid point we have chosen. In particular, the point we have chosen for the study of the wave propagation inside the mesh is located at the junction of the third and fourth element of the second row.

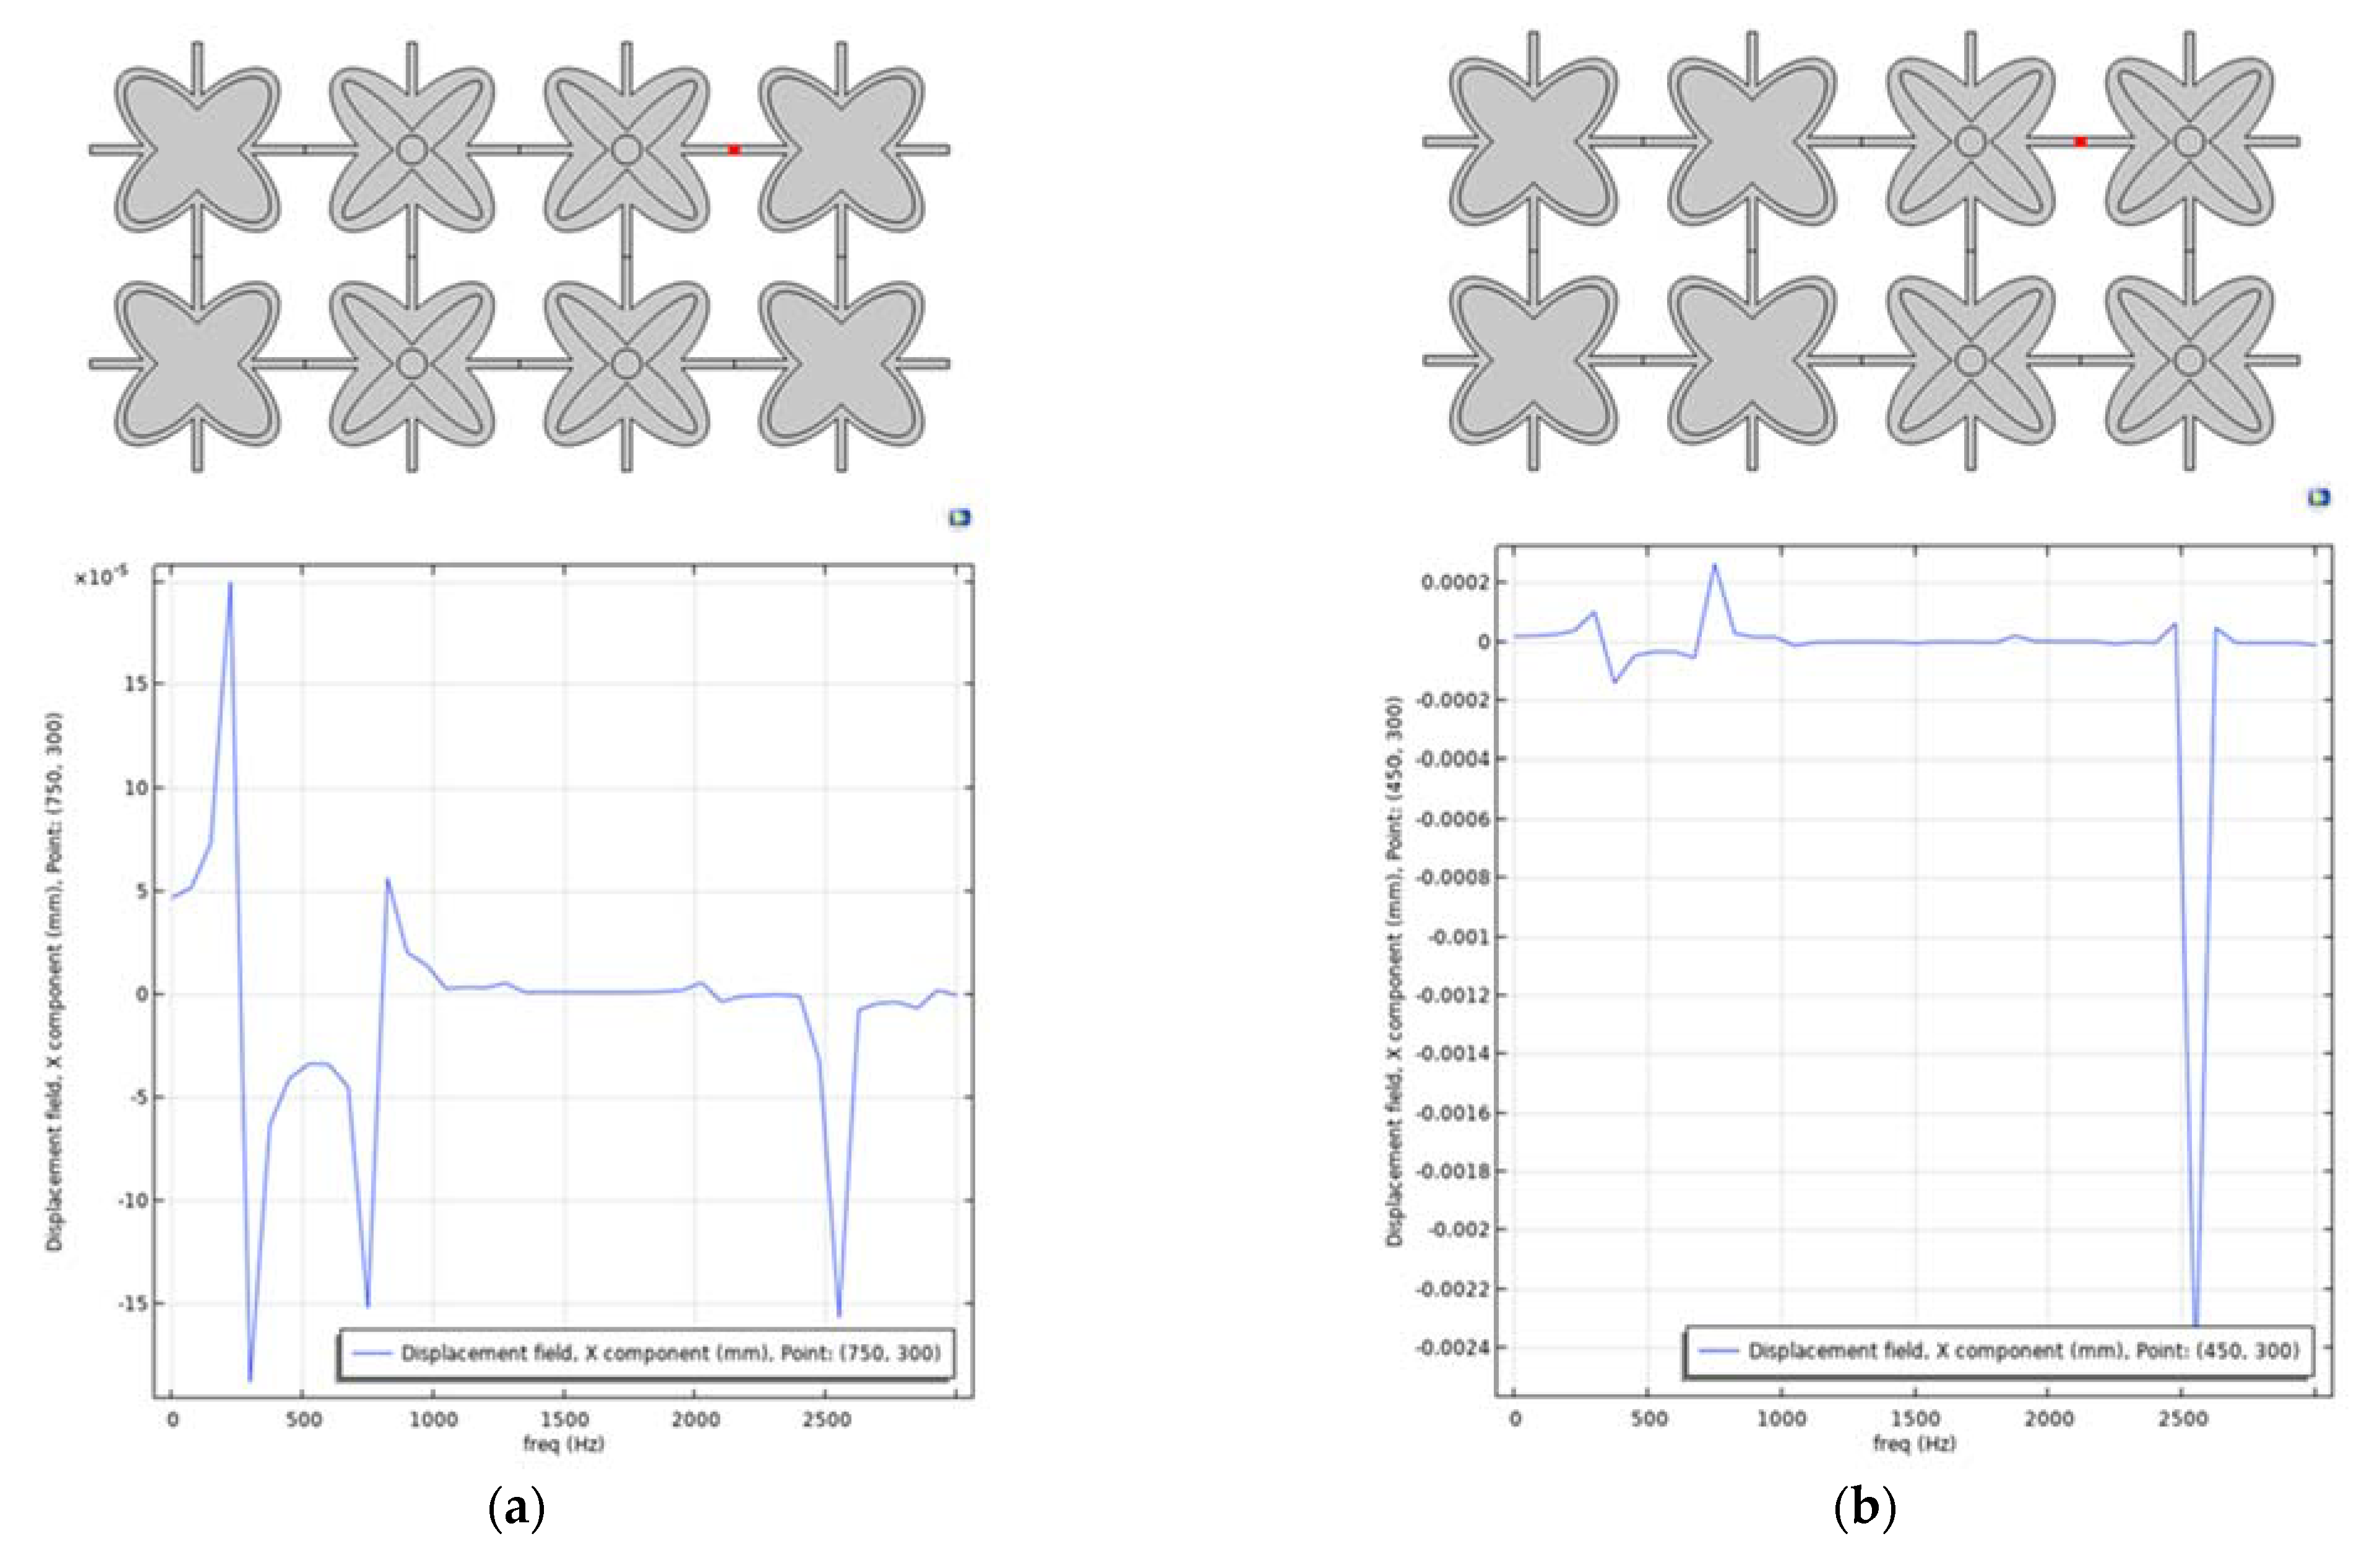
4.5. Single Layer Grid–Different Layouts of Elements

Continuing the study, four variations of the microstructure arrangement have been considered. They consist of internal ellipse elements 170 × 80, with 12 mm bar and ellipse 170 × 40, with circular inclusion of 40 mm diameter and 12 mm bar thickness. In each of the four cases, a red dot represents the point at which we chose to examine its displacement in case the wave propagates or is not inside the grid. The results are shown in Figure 20.
Then, investigating the combined performance of the elements that we examined individually and constructing different variations of grids, we notice that the range of frequencies for which the propagation of a wave is interrupted is located between the values that vary between 1150–2000 Hz.

5. Discussion

Wave propagation and band gap formation has been investigated for cookie-shaped auxetics. The parametric investigation shows the complex dependence of the results from the parameters of the microstructure. On the other hand, the addition of a rigid inclusion has not influenced the results. The investigation of the contact, prestressing, and electromechanical control may lead to different results. Further investigation and optimal design are suggested in order to provide results suitable for specific applications.
A possible inspiration for suitable measures in order to influence the band gap results by using prestressing provide the different eigenvalues of the microstructure, given in Figure 21.
Finally, the production cost should be considered for a specific application. By using auxetic shapes with round corners, the stress concentrations have been reduced and the longer life of the component is guaranteed. Experimental investigation is planned in order to demonstrate this effect.

Author Contributions

Conceptualization, and methodology D.C. and G.E.S.; software, investigation, writing—original draft preparation, D.C.; writing—review and editing, D.C. and G.E.S.; supervision, G.E.S. All authors have read and agreed to the published version of the manuscript.

Funding

This research received no external funding.

Informed Consent Statement

Not applicable.

Data Availability Statement

The data will be provided to interested readers upon reasonable request.

Conflicts of Interest

The authors declare no conflict of interest.

References

  1. Prawoto, Y. Seeing auxetic materials from the mechanics point of view: A structural review on the negative Poisson’s ratio. Comput. Mater. Sci. 2012, 58, 140–153. [Google Scholar] [CrossRef]
  2. Stavroulakis, G.E. Auxetic behaviour: Appearance and engineering applications. Phys. Stat. Sol. (B) 2005, 242, 710–720. [Google Scholar] [CrossRef]
  3. Lim, T.C. Auxetic Materials and Structures; Springer: Berlin/Heidelberg, Germany, 2015. [Google Scholar]
  4. Mariam Mir, M.; Ali, M.N.; Sami, J.; Ansari, U. Review of Mechanics and Applications of Auxetic Structures. Adv. Mater. Sci. Eng. 2014, 2014, 753496. [Google Scholar] [CrossRef] [Green Version]
  5. Ruzzene, M.; Mazzarella, L.; Tsopelas, P.; Scarpa, F. Wave Propagation in Sandwich Plates with Periodic Auxetic Core. J. Intell. Mater. Syst. Struct. 2002, 13, 587–597. [Google Scholar] [CrossRef]
  6. Ruzzene, M.; Scarpa, F. Directional and band-gap behavior of periodic auxetic lattices. Phys. Stat. Sol. (B) 2005, 242, 665–680. [Google Scholar] [CrossRef]
  7. Bacigalupo, A.; De Bellis, M.L. Auxetic anti-tetrachiral materials: Equivalent elastic properties and frequency band-gaps. Compos. Struct. 2015, 131, 530–544. [Google Scholar] [CrossRef]
  8. D’Alessandro, L.; Zega, V.; Ardito, R.; Corigliano, A. 3D auxetic single material periodic structure with ultra-wide tunable bandgap. Sci. Rep. 2018, 8, 2262. [Google Scholar] [CrossRef] [Green Version]
  9. Bruggi, M.; Corigliano, A. Optimal 2D auxetic micro-structures with band gap. Meccanica 2019, 54, 2001–2027. [Google Scholar] [CrossRef]
  10. Koutsianitis, P.K.; Tairidis, G.K.; Drosopoulos, G.A.; Stavroulakis, G.E. Conventional and star-shaped auxetic materials for the creation of band gaps. Arch. Appl. Mech. 2019, 89, 2545–2562. [Google Scholar] [CrossRef]
  11. Koutsianitis, P.; Tairidis, G.K.; Kougkoulos, A.; Stavroulakis, G.E. Parametric investigation of band gap effects in chiral microstructures. J. Serb. Soc. Comput. Mech. 2021, 15, 63–78. [Google Scholar] [CrossRef]
  12. Xiao, S.-H.; Zhang, C.; Qing-Hua, Q.-H.; Wang, H. A novel planar auxetic phononic crystal with periodic cookie-shaped cellular microstructures. Mech. Adv. Mater. Struct. 2022, 29, 3345–3358. [Google Scholar] [CrossRef]
  13. Chen, W.; Tian, X.; Gao, R.; Liu, S. A low porosity perforated mechanical metamaterial with negative Poisson’s ratio and band gaps. Smart Mater. Struct. 2018, 27, 115010. [Google Scholar] [CrossRef]
  14. Liebold-Ribeiro, Y.; Körner, C. Phononic Band Gaps in Periodic Cellular Materials. Adv. Eng. Mater. 2014, 16, 328–334. [Google Scholar] [CrossRef]
  15. Hou, J.; Li, D.; Dong, L. Study on Band-Gap Behaviors of 2D Hierarchical Re-Entrant Lattice Structures. Phys. Status Solidi B 2019, 256, 1800693. [Google Scholar] [CrossRef]
  16. Meng, J.; Deng, Z.; Zhang, K.; Xu, X.; Wen, F. Band gap analysis of star-shaped honeycombs with varied Poisson’s ratio. Smart Mater. Struct. 2015, 24, 095011. [Google Scholar] [CrossRef]
  17. Sheykhi, M. Vibroacoustic performance of star-shaped honeycomb-core annular cellular structures. Arch. Appl. Mech. 2022, 93, 1–20. [Google Scholar] [CrossRef]
  18. Zhao, P.; Zhang, K.; Qi, L.; Deng, Z. 3D chiral mechanical metamaterial for tailored band gap and manipulation of vibration isolation. Mech. Syst. Signal Process. 2022, 180, 109430. [Google Scholar] [CrossRef]
  19. Fei, X.; Jin, L.; Zhang, X.; Li, X.; Lu, M. Three-dimensional anti-chiral auxetic metamaterial with tunable phononic bandgap. Appl. Phys. Lett. 2020, 116, 021902. [Google Scholar] [CrossRef]
  20. Xin, Y.; Wang, H.; Wang, C.; Yao, J. Design and Wave Propagation Characterization of Starchiral Metamaterials. Acta Mech. Solida Sin. 2022, 35, 215–227. [Google Scholar] [CrossRef]
  21. Saxena, K.K.; Das, R.; Calius, E.P. Three Decades of Auxetics Research − Materials with Negative Poisson’s Ratio: A Review. Adv. Eng. Mater. 2016, 18, 1847–1870. [Google Scholar] [CrossRef]
  22. Hengsbach, S.; Lantada, A.D. Direct laser writing of auxetic structures: Present capabilities and challenges. Smart Mater. Struct. 2014, 23, 085033. [Google Scholar] [CrossRef]
  23. Spadoni, A.; Ruzzene, M.; Gonella, S.; Scarpa, F. Phononic properties of hexagonal chiral lattices. Wave Motion 2019, 46, 435–450. [Google Scholar] [CrossRef] [Green Version]
  24. Phani, A.S.; Woodhouse, J.; Fleck, N.A. Wave propagation in two-dimensional periodic lattices. J. Acoust. Soc. Am. 2006, 119, 1995–2005. [Google Scholar] [CrossRef] [PubMed] [Green Version]
  25. Brillouin, L. Wave Propagation in Periodic Structures, 2nd ed.; Dover: New York, NY, USA, 1953. [Google Scholar]
  26. Kittel, C. Elementary Solid-State Physics: A Short Course, 1st ed.; Wiley: New York, NY, USA, 1962. [Google Scholar]
  27. Xiong, Y.; Xu, A.; Wen, S.; Li, F.; Hosseini, S.M. Optimization of vibration band-gap characteristics of a periodic elastic metamaterial plate. Mech. Adv. Mater. Struct. 2022, 1–11. [Google Scholar] [CrossRef]
  28. Aage, N.; Gersborg, A.R.; Sigmund, O. Topology optimization of optical band gap effects in slab structures modulated by periodic rayleigh waves. In Proceedings of the XXII ICTAM, Adelaide, Australia, 25–29 August 2008. [Google Scholar]
  29. Vatanabe, S.L.; Paulino, G.H.; Silva, E.C. Maximizing phononic band gaps in piezocomposite materials by means of topology optimization. J. Acoust. Soc. Am. 2014, 136, 494–501. [Google Scholar] [CrossRef] [Green Version]
  30. Halkjær, S.; Sigmund, O.; Jensen, J.S. Maximizing band gaps in plate structures. Struct. Multidisc. Optim. 2006, 32, 263–275. [Google Scholar] [CrossRef]
  31. Quinteros, L.; Meruane, V.; Cardoso, E.L. Phononic band gap optimization in truss-like cellular structures using smooth P-norm approximations. Struct. Multidisc. Optim. 2021, 64, 113–124. [Google Scholar] [CrossRef]
  32. Drosopoulos, G.A.; Kaminakis, N.; Papadogianni, N.; Stavroulakis, G.E. Mechanical Behaviour of Auxetic Microstructures Using Contact Mechanics and Elastoplasticity. Key Eng. Mater. 2016, 681, 100–116. [Google Scholar] [CrossRef]
  33. Pyskir, A.; Collet, M.; Dimitrijevic, Z.; Lamarque, C.-H. Enhanced Vibration Isolation with Prestressed Resonant Auxetic Metamaterial. Materials 2021, 14, 6743. [Google Scholar] [CrossRef]
Figure 1. (a) The representative volume element and (b) the Irreducible Brillouin Zone (IBZ).
Applsci 13 02774 g001
Figure 2. Rectangular segments with four nodes.
Applsci 13 02774 g002
Figure 3. Representative element microstructure (a) with and (b) without circular inclusion.
Applsci 13 02774 g003
Figure 4. Response along the IBZ of the RVE, for (a) with and (b) without circular inclusion.
Applsci 13 02774 g004
Figure 5. Response for Inner ellipse 170 × 30, rod thickness 3 mm. (a) microstructure, (b) responce for first eigenfrequenciew. Two band gaps are identified. Between 5th and 6th eigenfrequency (1160–1800 Hz) and between 7th and 8th eigenfrequency (1800–2460 Hz).
Applsci 13 02774 g005
Figure 6. Response for inner ellipse 170 × 30, rod 6 mm with one band gap, between 5th and 6th eigenfrequency (1520–2400 Hz). (a) microstructure, (b) responce for first eigenfrequenciew.
Applsci 13 02774 g006
Figure 7. Response for inner ellipse 170 × 30 and rod thickness 12 mm. (a) microstructure, (b) responce for first eigenfrequenciew. Two band gaps between 3rd and 4th eigenfrequency (1720–2320 Hz) and a marginal between 5th and 6th eigenfrequency (2680–2700 Hz).
Applsci 13 02774 g007
Figure 8. Response for inner ellipse 170 × 60, rod 3 mm. (a) microstructure, (b) responce for first eigenfrequenciew. Two band gaps are shown, between 5th and 6th eigenfrequency (1120–1775 Hz) and between 7th and 8th eigenfrequency (1805–1835 Hz).
Applsci 13 02774 g008
Figure 9. Response for inner ellipse 170 × 60 and rod thickness 6 mm (a) microstructure, (b) responce for first eigenfrequenciew. One band gap between 5th and 6th eigenfrequency (1440–1780 Hz).
Applsci 13 02774 g009
Figure 10. Response for inner ellipse 170 × 60 and rod thickness 12 mm. (a) microstructure, (b) responce for first eigenfrequenciew. One band gap exists between 3rd and 4th eigenfrequency (1420–1680 Hz).
Applsci 13 02774 g010
Figure 11. Response for inner ellipse 170 × 80, rod 3 mm. (a) microstructure, (b) responce for first eigenfrequenciew. One band gap exists between 5th and 6th eigenfrequency (970–1740 Hz).
Applsci 13 02774 g011
Figure 12. Response for inner ellipse 170 × 80, rod 12 mm. (a) microstructure, (b) responce for first eigenfrequenciew. One band gap exists, between 3rd and 4th eigenfrequency (1050–1530 Hz).
Applsci 13 02774 g012
Figure 13. Response for inner ellipse 170 × 90, rod 3 mm. (a) microstructure, (b) responce for first eigenfrequenciew. One band gap exist, between 5th and 6th eigenfrequency (850–1570 Hz).
Applsci 13 02774 g013
Figure 14. Response for inner ellipse 170 × 90, rod 6 mm. (a) microstructure, (b) responce for first eigenfrequenciew. Two band gaps exist, between 3rd and 4th eigenfrequency (840–1160 Hz) and between 5th and 6th eigenfrequency (1220–1570 Hz).
Applsci 13 02774 g014
Figure 15. Response for inner ellipse 170 × 90, rod 12 mm. (a) microstructure, (b) responce for first eigenfrequenciew. One band gap is shown, between 3rd and 4th eigenfrequency (950–1530 Hz).
Applsci 13 02774 g015
Figure 16. Mesh structure for verification with 25 representative volume elements.
Applsci 13 02774 g016
Figure 17. Mesh response at (a) 200 Hz, (b) 550 Hz, (c) 875 Hz and (d) 1100 Hz.
Applsci 13 02774 g017
Figure 18. Mesh with combined geometry.
Applsci 13 02774 g018
Figure 19. Displacement-frequency diagram of (a) 170 × 80 ellipse combination grid with 6 mm bar and 170 × 40 ellipse, with 40 mm diameter circular inclusion and 15 mm bar thickness, (b) 170 × 80 ellipse combination grid with 12 mm bar and 170 × 40 ellipse, with 40 mm diameter circular inclusion and 15 mm bar thickness and (c) 170 × 80 ellipse combination grid with 12 mm bar and 170 × 40 ellipse, with 40 mm diameter circular inclusion and 12 mm bar thickness.
Applsci 13 02774 g019
Figure 20. Different combinations of microstructures and the corresponding displacement-frequency diagrams. (a) first arrangement with two layers of complex microstructures in the middle rows, (b) two layers of complex microstructures at the end, (c) complex microstructures at first and last rows and (d) alternating placement of complex and simple microstructures.
Applsci 13 02774 g020aApplsci 13 02774 g020b
Figure 21. Deformation of microstructures for different eigenfrequencies.
Applsci 13 02774 g021
Table 1. Coordinates used for the Irreducible Brillouin Zone, see Figure 1b.
Cartesian Coordinates
Γ(0,0)
Χ(L1/2,0)
Μ(L1/2, L1/2)
Table 2. Properties of materials.
Material NameDensityPoisson’s RatioYoung’s Modulus
Material18000 kg/m30.342 × 1011 Pa
Material21000 kg/m30.452 × 109 Pa
Table 3. Parametric investigation. Inner ellipse 170 × 30.
Inner Ellipse
170 × 30 (mm)
Rod Thickness
3 mm
Rod Thickness
6 mm
Rod Thickness
12 mm
1st bandgap5th–6th (1160–1800 Hz)5th–6th (1520–2400 Hz)3rd–4th (1720–2320 Hz)
2nd bandgap7th–8th (1800–2460 Hz)-7th–8th (2680–2700 Hz)
Table 4. Parametric investigation. Inner ellipse 170 × 60.
Inner Ellipse
170 × 60 (mm)
Rod Thickness
3 mm
Rod Thickness
6 mm
Rod Thickness
12 mm
1st bandgap5th–6th (1120–1775 Hz)5th–6th (1440–1780 Hz)3rd–4th (1420–1680 Hz)
2nd bandgap7th–8th (1805–1835 Hz)--
Table 5. Parametric investigation. Inner ellipse 170 × 80.
Inner Ellipse
170 × 80 (mm)
Rod Thickness
3 mm
Rod Thickness
6 mm
Rod Thickness
12 mm
1st bandgap5th–6th (970–1740 Hz)3rd–4th (1020–1240 Hz)3rd–4th (1050–1530 Hz)
2nd bandgap-5th–6th (1340–1680 Hz)-
Table 6. Parametric investigation. Inner ellipse 170 × 90.
Inner Ellipse
170 × 90 (mm)
Rod Thickness
3 mm
Rod Thickness
6 mm
Rod Thickness
12 mm
1st bandgap5th–6th (850–1570 Hz)3rd–4th (840–1160 Hz)3rd–4th (950–1530 Hz)
2nd bandgap-5th–6th (1220–1570 Hz)-
Table 7. Band gaps for a grid with homogeneous microstructure. Inner ellipse 170 × 80.
Inner Ellipse 170 × 80 (mm)Rod Thickness 6 mmRod Thickness 12 mm
1st bandgap3rd–4th (1020–1240 Hz)3rd–4th (1050–1530 Hz)
2nd bandgap5th–6th (1340–1680 Hz)-
Table 8. Band gaps for a grid with homogeneous microstructure. Inner ellipse 170 × 40.
Inner Ellipse 170 × 40 and Circular CoreRod Thickness 12 mmRod Thickness 15 mm
1st bandgap3rd–4th (1710–2395 Hz)3rd–4th (1800–2540 Hz)
2nd bandgap-6th -7th (3185–3255 Hz)
Disclaimer/Publisher’s Note: The statements, opinions and data contained in all publications are solely those of the individual author(s) and contributor(s) and not of MDPI and/or the editor(s). MDPI and/or the editor(s) disclaim responsibility for any injury to people or property resulting from any ideas, methods, instructions or products referred to in the content.

