
Wireless Sensor Networks Based on Multi-Criteria Clustering and Optimal Bio-Inspired Algorithm for Energy-Efficient Routing

 ,
,  , , and
Abstract
:1. Introduction
2. Methodology
2.1. Energy Model
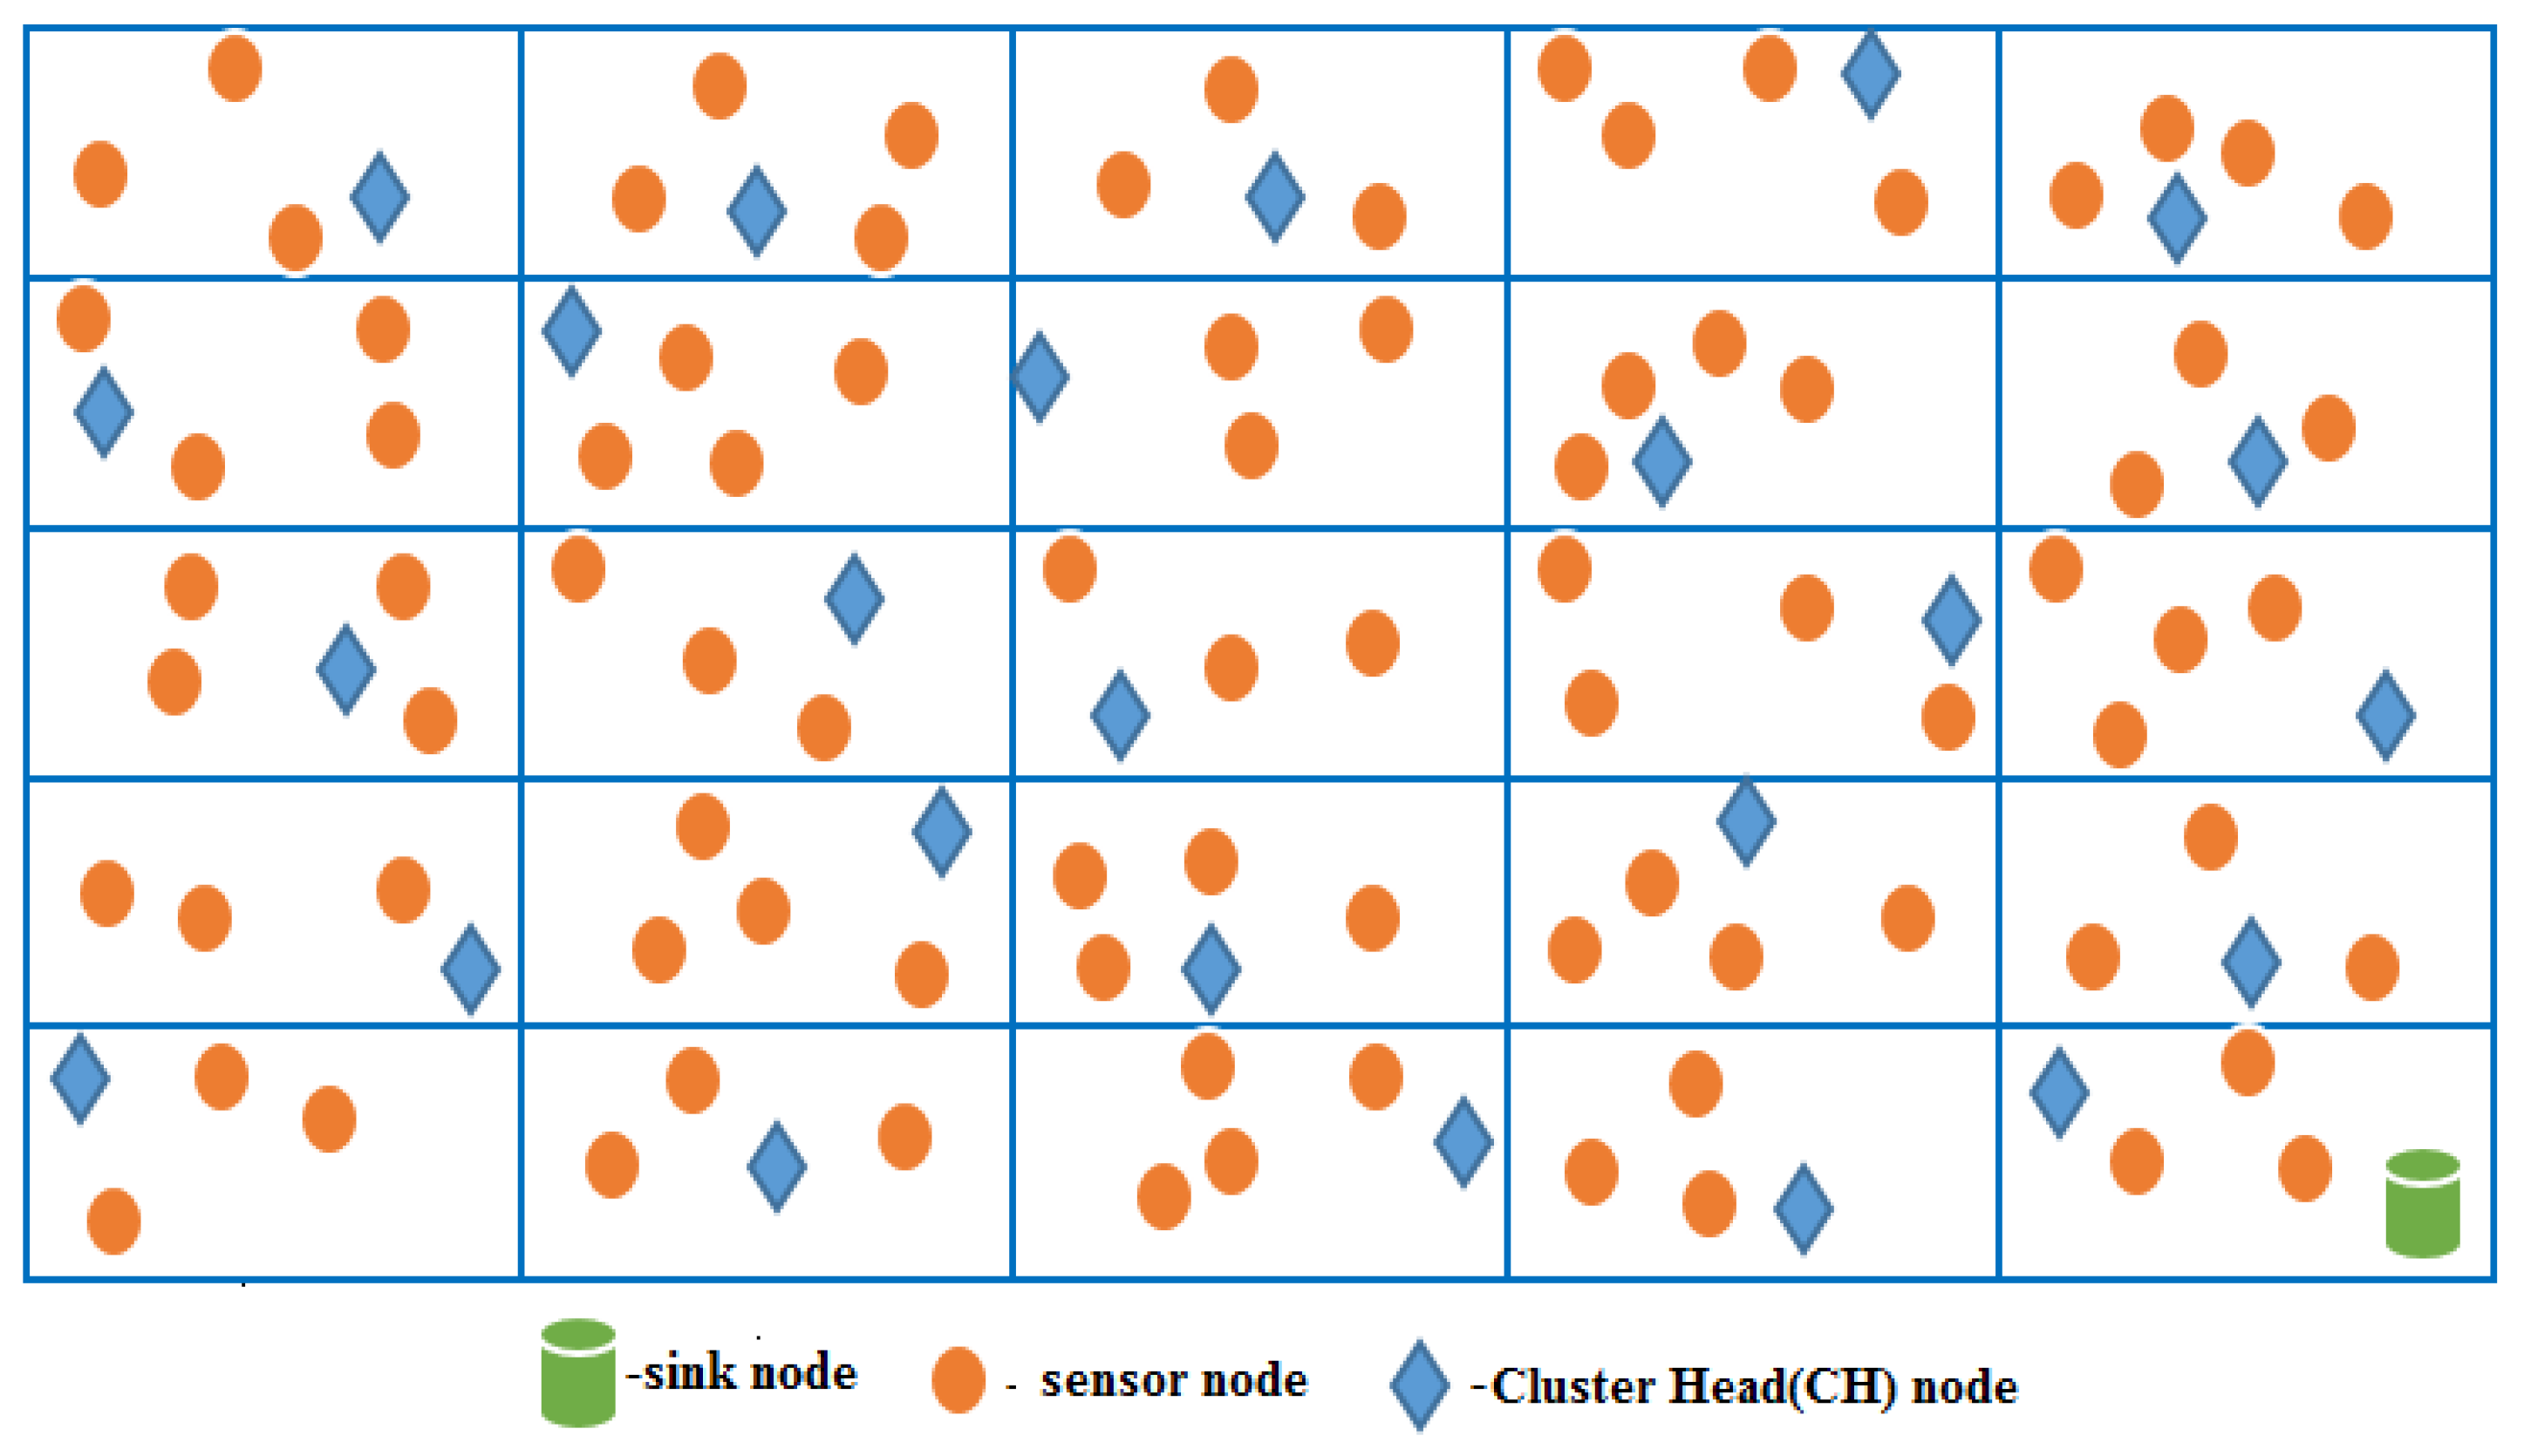
2.2. Multi-Criteria Clustering
2.3. Optimal Bio-Inspired Algorithm
| Algorithm 1. Pseudo code of the proposed Optimal Bio-inspired algorithm |
| 1: Start 2: Initialization of the new path Ki 3: Generation of maximum path MG 4: Maximum step size (Step max), β and acceleration factor (AF) 5: Iteration = 1, 6: Fitness evaluation using equation 7: While iteration < MG 8: Then 9: Compute the average of all the population/path 10: If i < M/2 11: Then 12: Update the CH position based on moth flame algorithm using Equation (13) 13: Else 14: Update the CH position based on salp swarm algorithm using Equation (14) 15: End if 16: Newly updated position iteration = iteration +1 17: End While 18: Output optimal path 19: End |
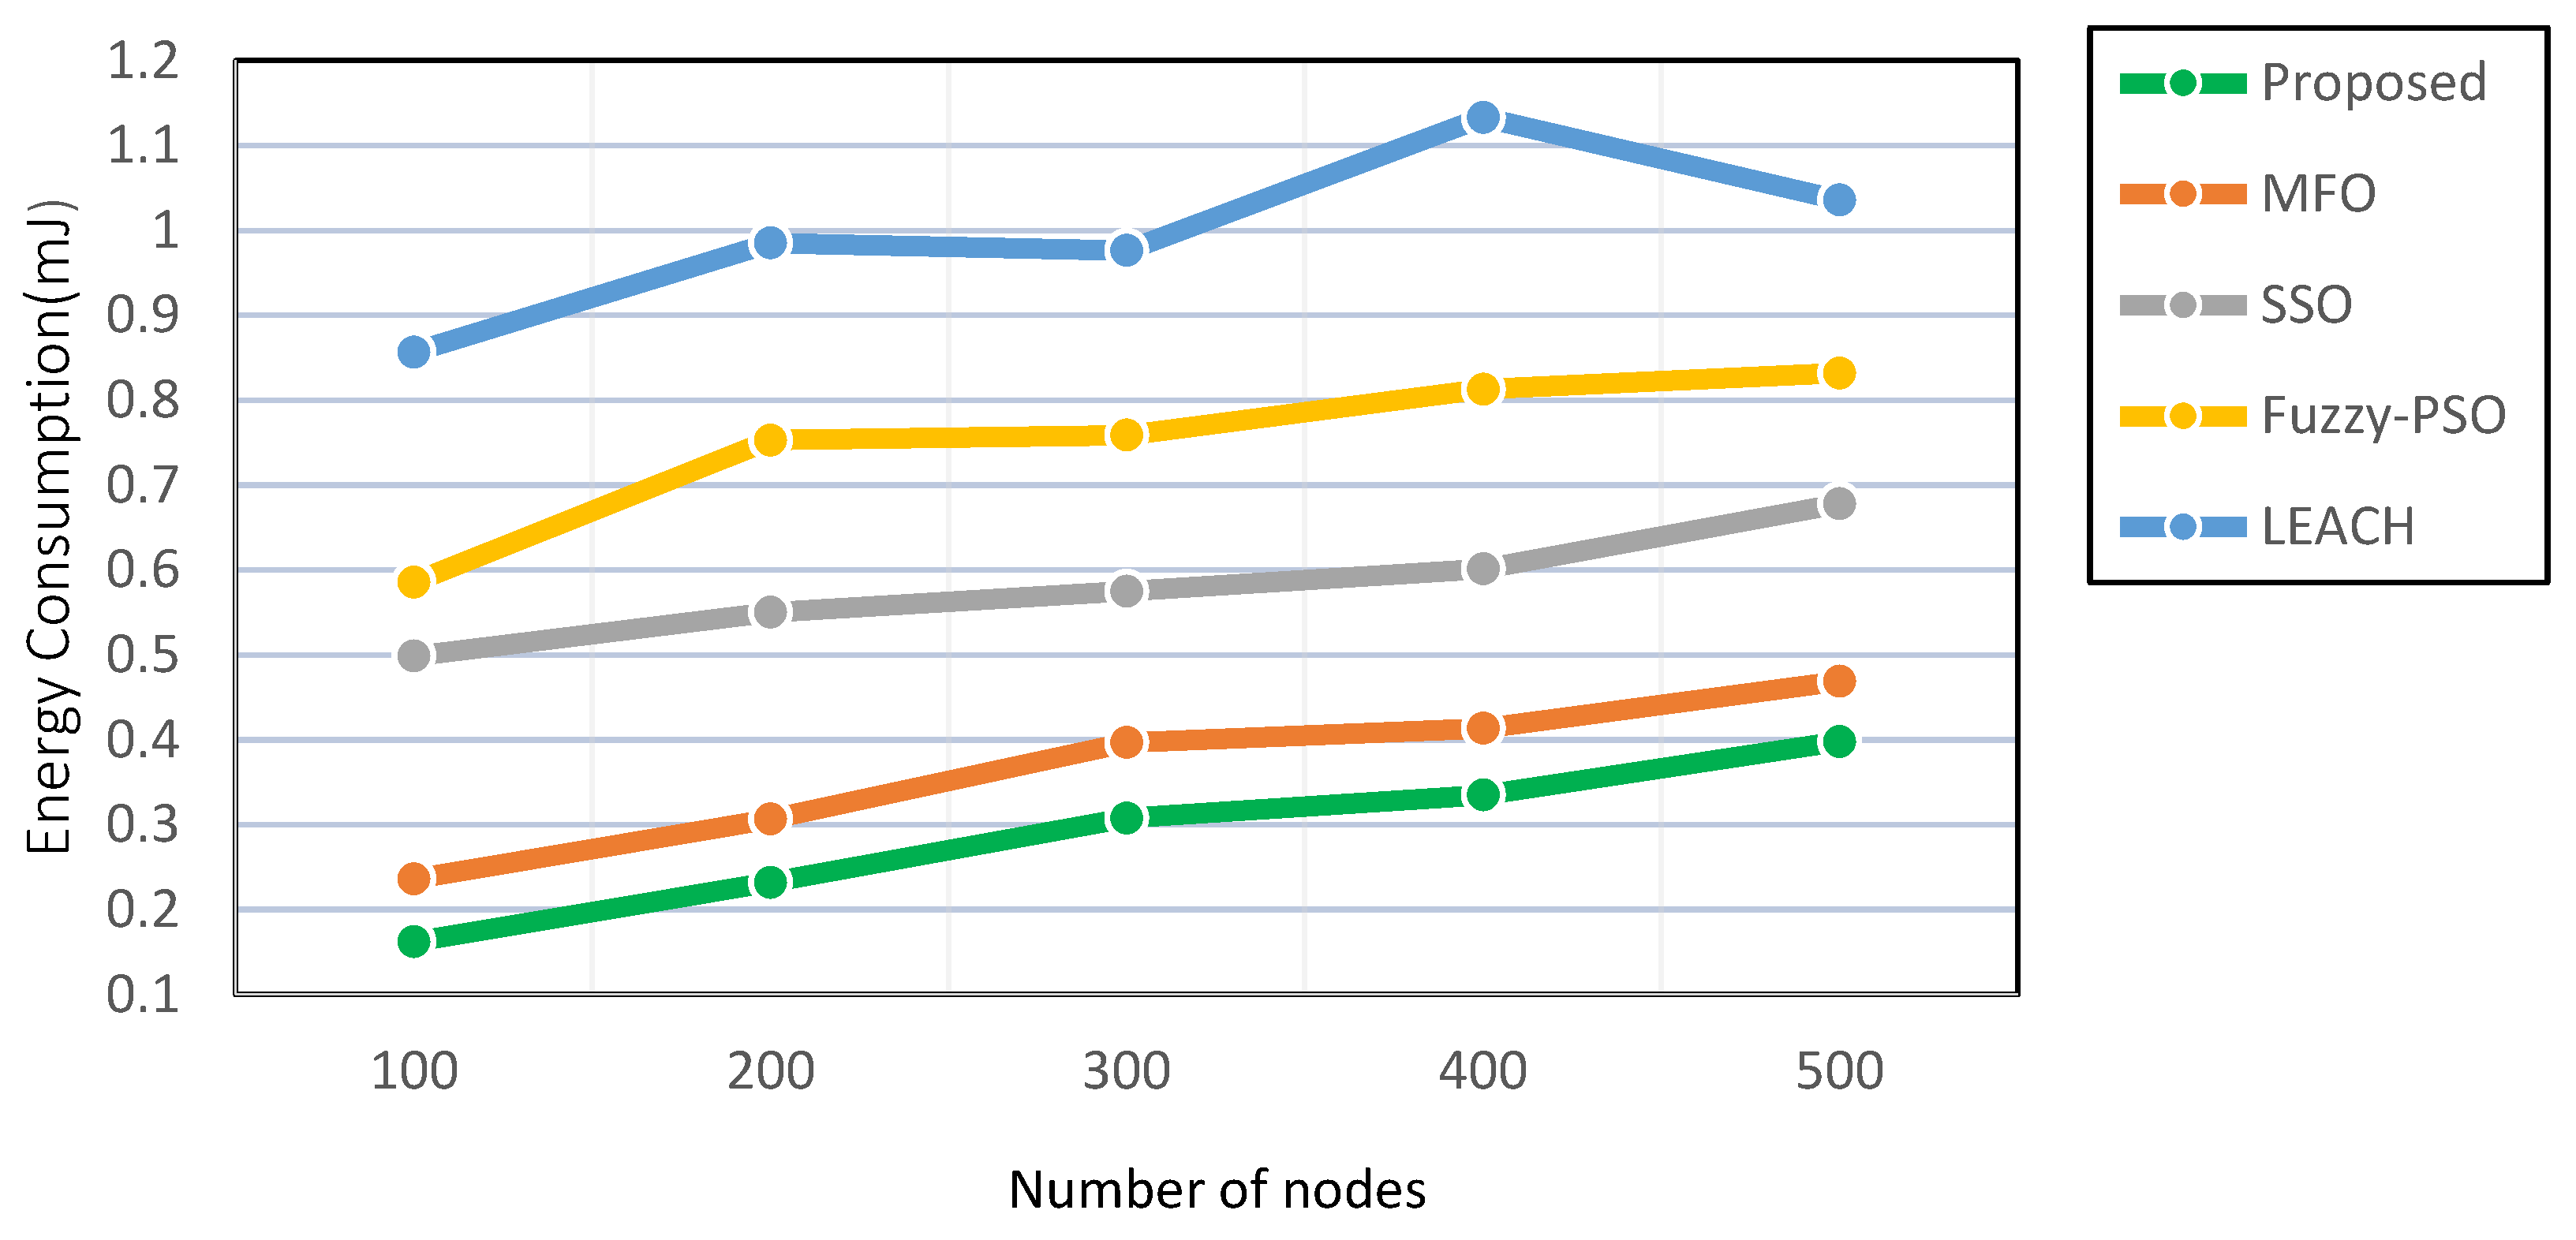
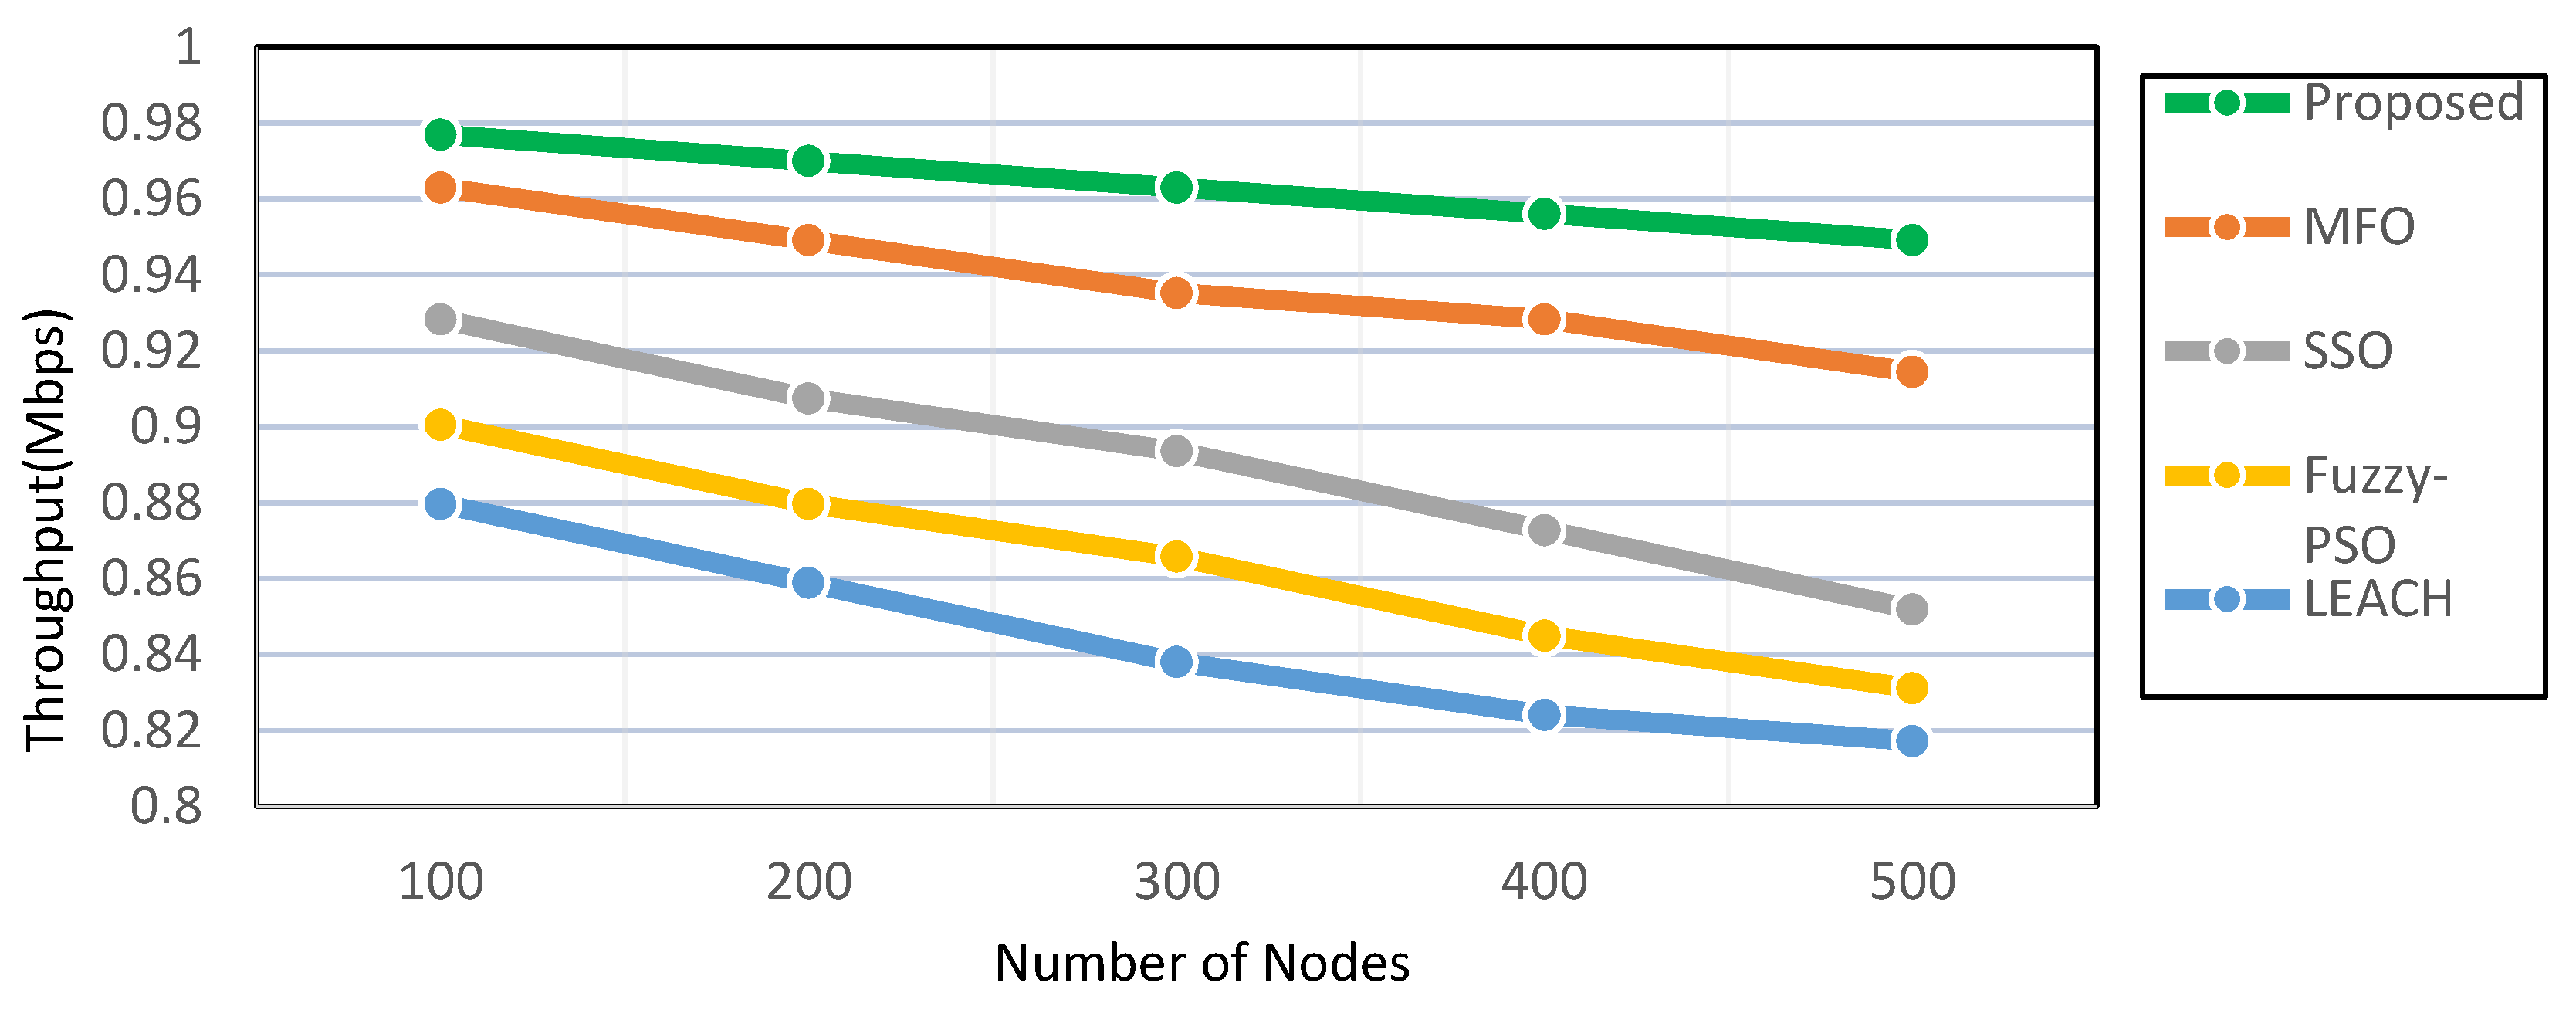
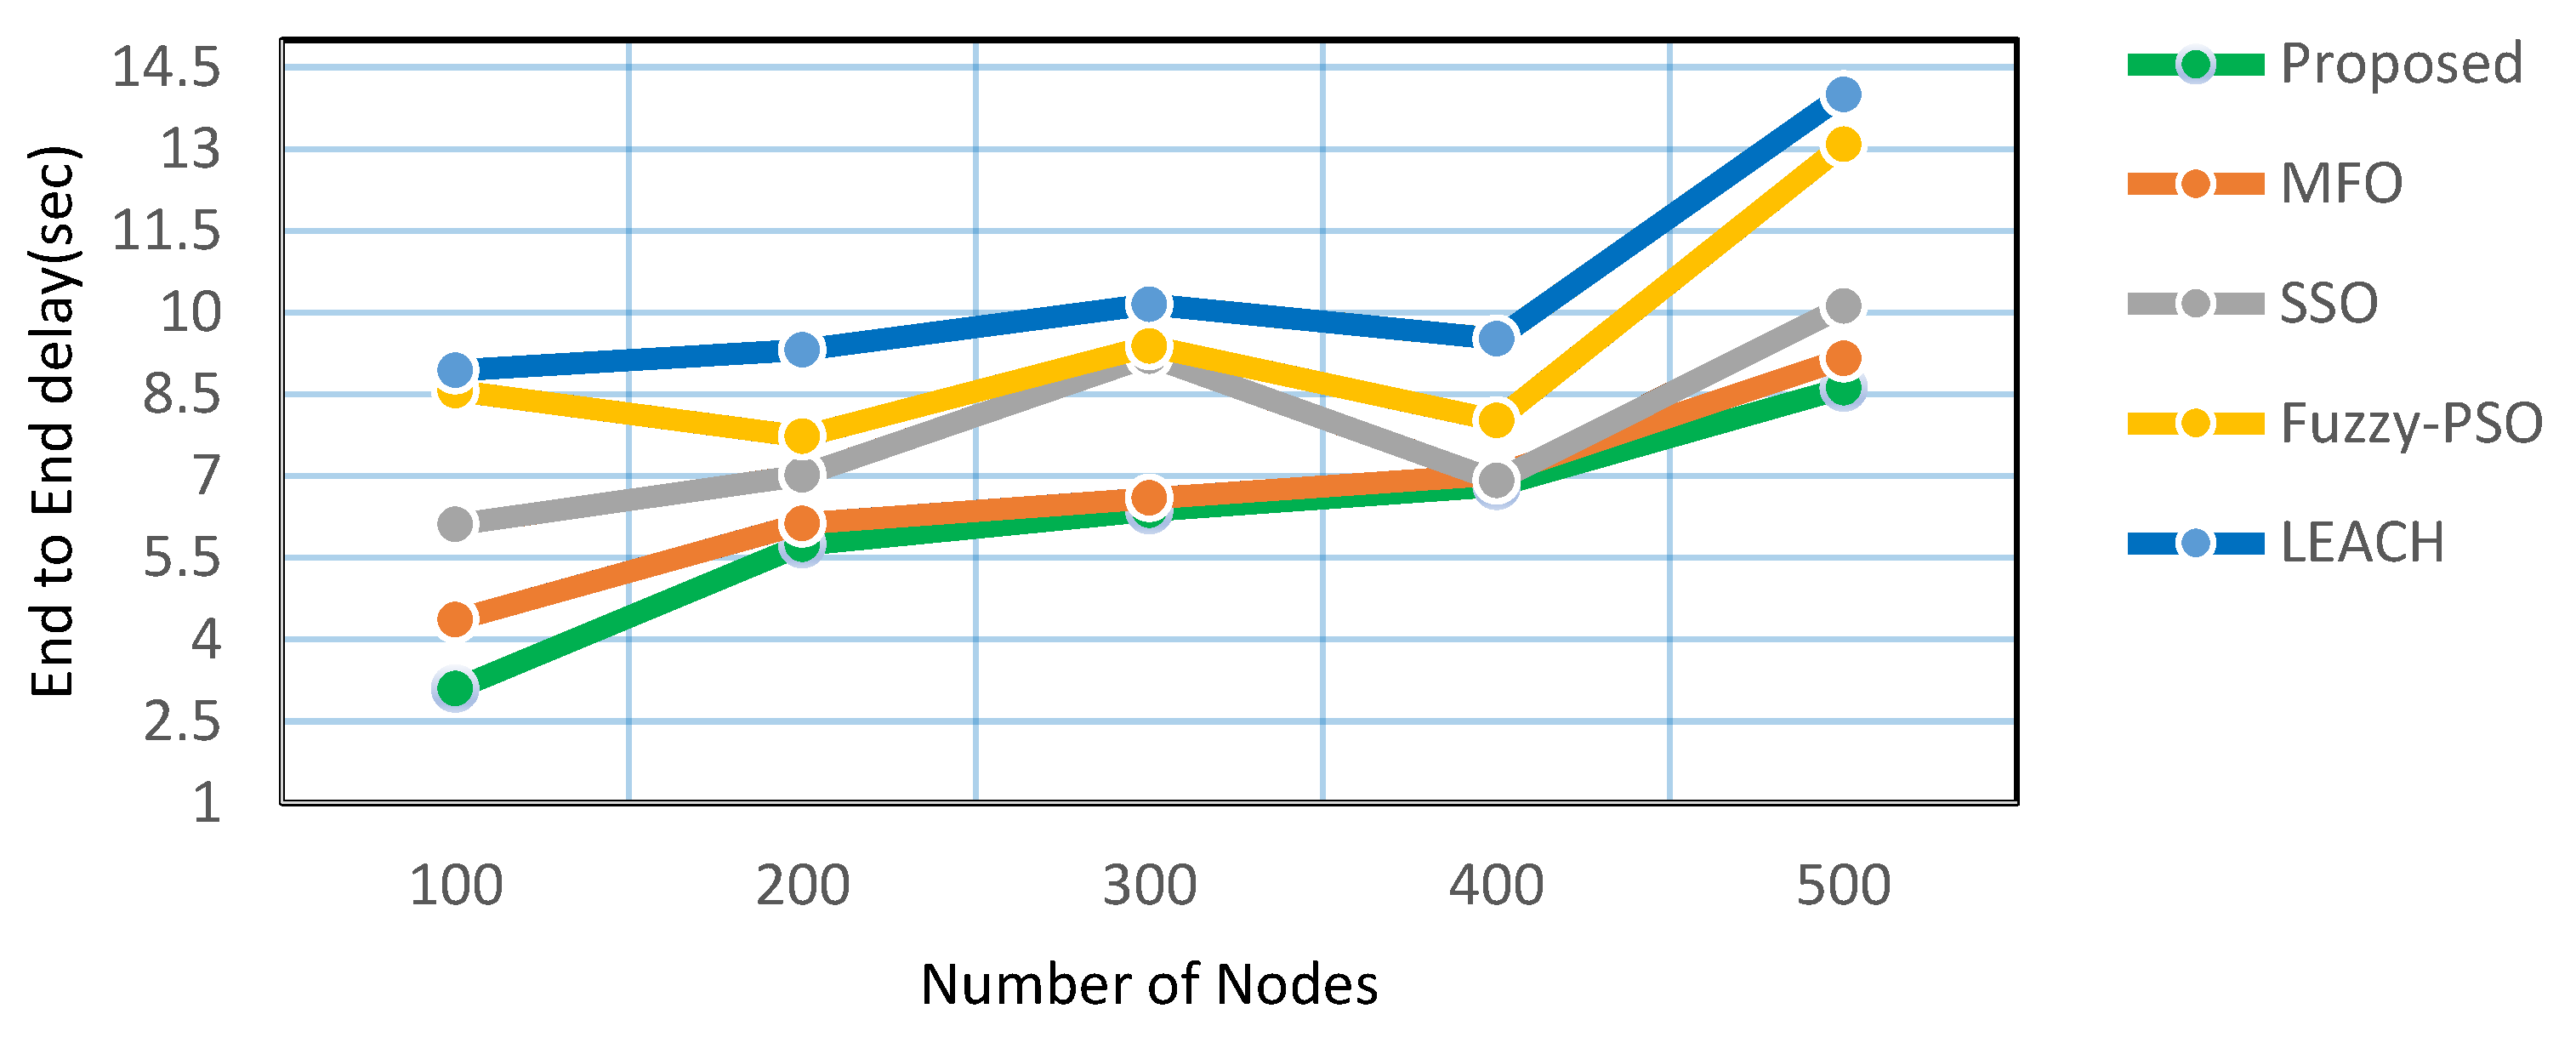
3. Results and Discussion
4. Conclusions
Author Contributions
Funding
Institutional Review Board Statement
Informed Consent Statement
Data Availability Statement
Acknowledgments
Conflicts of Interest
References
- Mostafaei, H. Energy-Efficient Algorithm for Reliable Routing of Wireless Sensor Networks. IEEE Trans. Ind. Electron. 2019, 66, 5567–5575. [Google Scholar] [CrossRef]
- Song, G.; Qu, G.; Ma, Q.; Zhang, X. Improved energy efficient adaptive clustering routing algorithm for WSN. Commun. Comput. Info. Sci. 2018, 812, 74–85. [Google Scholar]
- Zhang, Y.; Chen, H.; Gao, T. WSN routing algorithm based on energy approximation strategy, lecture notes of the Institute for Computer Sciences. Soc. Info. Telecom. Eng. 2018, 237, 3–12. [Google Scholar]
- Heinzelman, W.R.; Chandrakasan, A.; Balakrishnan, H. Energy-efficient communication protocol for wireless microsensor networks. In Proceedings of the 33rd Annual Hawaii International Conference on System Sciences, Maui, HI, USA, 7 January 2000; p. 10. [Google Scholar]
- Feng, X.; Yan, F.; Liu, X. Study of wireless communication technologies on Internet of Things for precision agriculture. Wirel. Pers. Commun. 2019, 108, 1785–1802. [Google Scholar] [CrossRef]
- Singh, S.P.; Sharma, S.C. A survey on cluster-based routing protocols in wireless sensor networks. Procedia Comput. Sci. 2015, 45, 687–695. [Google Scholar] [CrossRef] [Green Version]
- Soro, S.; Heinzelman, W.B. Prolonging the lifetime of wireless sensor networks via unequal clustering. In Proceedings of the 19th IEEE International Parallel and Distributed Processing Symposium, Denver, CO, USA, 4–8 April 2005; p. 8. [Google Scholar]
- Younis, O.; Fahmy, S. HEED: A hybrid, energy-efficient, distributed clustering approach for ad hoc sensor networks. IEEE Trans. Mob. Comput. 2004, 3, 366–379. [Google Scholar] [CrossRef] [Green Version]
- Kumar, D.; Aseri, T.C.; Patel, R.B. EEHC: Energy efficient heterogeneous clustered scheme for wireless sensor networks. Comput. Commun. 2009, 32, 662–667. [Google Scholar] [CrossRef]
- Khalil, E.A.; Attea, B.A. Energy-aware evolutionary routing protocol for dynamic clustering of wireless sensor networks. Swarm Evol. Comput. 2011, 1, 195–203. [Google Scholar] [CrossRef]
- Mittal, N.; Singh, U.; Sohi, B.S. Harmony search algorithm based threshold-sensitive energy-efficient clustering protocols for WSNs. Ad. Hoc. Sens. Wirel. Netw. 2017, 36, 149–174. [Google Scholar]
- Mittal, N.; Singh, U.; Sohi, B.S. A boolean spider monkey optimization based energy efficient clustering approach for WSNs. Wirel. Netw. 2018, 24, 2093–2109. [Google Scholar] [CrossRef]
- Kuila, P.; Jana, P.K. A novel differential evolution based clustering algorithm for wireless sensor networks. Appl. Soft Comput. 2014, 25, 414–425. [Google Scholar] [CrossRef]
- Singh, S.P.; Sharma, S.C. A PSO based improved localization algorithm for wireless sensor network. Wirel. Pers. Commun. 2018, 98, 487–503. [Google Scholar] [CrossRef]
- Shahraki, A.; Taherkordi, Ø.; Haugen; Eliassen, F. Clustering objectives in wireless sensor networks: A survey and research direction analysis. Comput. Netw. 2020, 180, 107376. [Google Scholar] [CrossRef]
- Mirjalili, S. Moth-flame optimization algorithm: A novel nature-inspired heuristic paradigm. Knowl.-Based Syst. 2015, 89, 228–249. [Google Scholar] [CrossRef]
- Hayashida, T.; Nishizaki, I.; Sekizaki, S. Improvement of Particle Swarm Optimization Focusing on Diversity of the Particle Swarm. In Proceedings of the 2020 IEEE International Conference on Systems, Man, and Cybernetics, Toronto, ON, Canada, 11–14 October 2020; pp. 191–197. [Google Scholar]
- Dorigo, M.; Birattari, M.; Stutzle, T. Ant colony optimization. IEEE Comput. Intell. Mag. 2006, 1, 28–39. [Google Scholar] [CrossRef]
- Rao, P.C.S.; Jana, P.K.; Banka, H. A particle swarm optimization-based energy efficient cluster head selection algorithm for wireless sensor networks. Wirel. Netw. 2017, 23, 2005–2020. [Google Scholar] [CrossRef]
- Srinivasalu, G.; Umadevi, H. Cluster Based Routing Protocol Using Energy Centric Multi Objective Salp Swarm Algorithm for WSNs. Int. J. Intell. Eng. Syst. 2021, 14, 35–45. [Google Scholar] [CrossRef]
- El Alami, H.; Najid, A. ECH: An Enhanced Clustering Hierarchy Approach to Maximize Lifetime of Wireless Sensor Networks. IEEE Access 2019, 7, 107142–107153. [Google Scholar] [CrossRef]
- Huang, H.; Zhang, J.; Zhang, X.; Yi, B.; Fan, Q.; Li, F. Emgr: Energy efficient multicast geographic routing in wireless sensor networks. Comput. Netw. 2017, 129, 51–63. [Google Scholar] [CrossRef]
- Juneja, S.; Kaur, K.; Singh, H. An intelligent coverage optimization and link-stability routing for energy efficient wireless sensor network. Wirel. Netw. 2022, 28, 705–719. [Google Scholar] [CrossRef]
- Srikanth, N.; Ashok, B.; Chandini, B.; Chandole, M.K.; Jyothi, N. Intelligent Routing Protocol for Energy Efficient Wireless Sensor Networks. In International Conference on Electrical and Electronics Engineering; Springer: Singapore, 2018. [Google Scholar]
- Kanoosh, H.M.; Houssein, E.H.; Selim, M.M. Salp Swarm Algorithm for Node Localization in Wireless Sensor Networks. J. Comput. Netw. Commun. 2019, 2019, 1028723. [Google Scholar] [CrossRef] [Green Version]
- Gupta, V.; Doja, M.N. H-LEACH: Modified and efficient LEACH protocol for hybrid clustering scenario in wireless sensor networks. In Advances in Intelligent Systems and Computing; Springer: Singapore, 2017; pp. 399–408. [Google Scholar]
- Jain, D.; Shukla, P.K.; Varma, S. Energy efficient architecture for mitigating the hot-spot problem in wireless sensor networks. J. Ambient. Intell. Humaniz. Comput. 2018, 1–18. [Google Scholar] [CrossRef]
- Sadiq, A.S.; Almohammad, T.Z.; Khadri, R.A.B.M.; Ahmed, A.A.; Lloret, J. An EnergyEfficient Cross-Layer approach for cloud wireless green communications. In Proceedings of the 2nd International Conference on Fog and Mobile Edge Computing (FMEC), Valencia, Spain, 8–11 May 2017; pp. 230–234. [Google Scholar]


| (5,1) | (5,2) | (5,3) | (5,4) | (5,5) |
| (4,1) | (4,2) | (4,3) | (4,4) | (4,5) |
| (3,1) | (3,2) | (3,3) | (3,4) | (3,5) |
| (2,1) | (2,2) | (2,3) | (2,4) | (2,5) |
| (1,1) | (1,2) | (1,3) | (1,4) | (1,5) |
| Parameters | Values |
|---|---|
| Simulation Tool | Matlab 2018 a |
| MAC protocol | IEEE 802.11 p |
| Deployment area | 450 m × 450 m |
| BS Location | (225,225) |
| Transmission energy per node | 0.8 × 10⁻³ J |
| Receiving energy per node | 2.9 × 10⁻³ J |
| Initial node energy Depend | 0.7 J |
| Initial network energy | Varying based on the number of nodes |
| Bandwidth | 9 Mbps |
| Number of nodes | 100–500 |
| Packet Size | 512 Kb |
| Number of rounds | 2400 |
| Type of Antenna | Omni directional |
| Bit Error Rate | 2% |
| Transmission Delay | 3.1 s |
| Number of Nodes | Proposed Approach | MFO | SSO | Fuzzy-PSO | LEACH |
|---|---|---|---|---|---|
| 100 | 0.1621 | 0.2369 | 0.4985 | 0.5856 | 0.8567 |
| 200 | 0.2323 | 0.3065 | 0.5500 | 0.7528 | 0.9851 |
| 300 | 0.3078 | 0.3967 | 0.5748 | 0.7589 | 0.9763 |
| 400 | 0.3356 | 0.4135 | 0.6012 | 0.8139 | 1.1331 |
| 500 | 0.3981 | 0.4689 | 0.6779 | 0.8320 | 1.0356 |
| Number of Nodes | Proposed Method | MFO | SSO | Fuzzy-PSO | LEACH |
|---|---|---|---|---|---|
| 100 | 0.975921 | 0.962033 | 0.927321 | 0.901537 | 0.879736 |
| 200 | 0.967780 | 0.947245 | 0.906462 | 0.879131 | 0.859863 |
| 300 | 0.961233 | 0.931253 | 0.891598 | 0.867812 | 0.839068 |
| 400 | 0.955117 | 0.927517 | 0.871758 | 0.845910 | 0.826147 |
| 500 | 0.945241 | 0.916425 | 0.856928 | 0.833919 | 0.819231 |
| Number of Nodes | Proposed | MFO | SSO | Fuzzy-PSO | LEACH |
|---|---|---|---|---|---|
| 100 | 3.091469 | 4.356343 | 6.106201 | 8.563210 | 8.936313 |
| 200 | 5.738117 | 6.126811 | 7.011156 | 7.723164 | 9.311644 |
| 300 | 6.363435 | 6.589253 | 9.193434 | 9.381968 | 10.14887 |
| 400 | 6.812625 | 7.027501 | 6.914689 | 8.016534 | 9.521367 |
| 500 | 8.615246 | 9.150356 | 10.11083 | 13.08119 | 13.99697 |
| Number of Nodes | Proposed | MFO | SSO | Fuzzy-PSO | LEACH |
|---|---|---|---|---|---|
| 100 | 3.107003 | 3.812061 | 5.333651 | 7.018231 | 8.320626 |
| 200 | 2.812463 | 4.714863 | 6.519877 | 8.010662 | 9.125211 |
| 300 | 3.305389 | 5.051717 | 7.012548 | 8.921786 | 10.11163 |
| 400 | 4.108043 | 6.190821 | 8.018762 | 9.702966 | 10.09091 |
| 500 | 5.060925 | 7.081879 | 8.312151 | 10.01457 | 12.09015 |
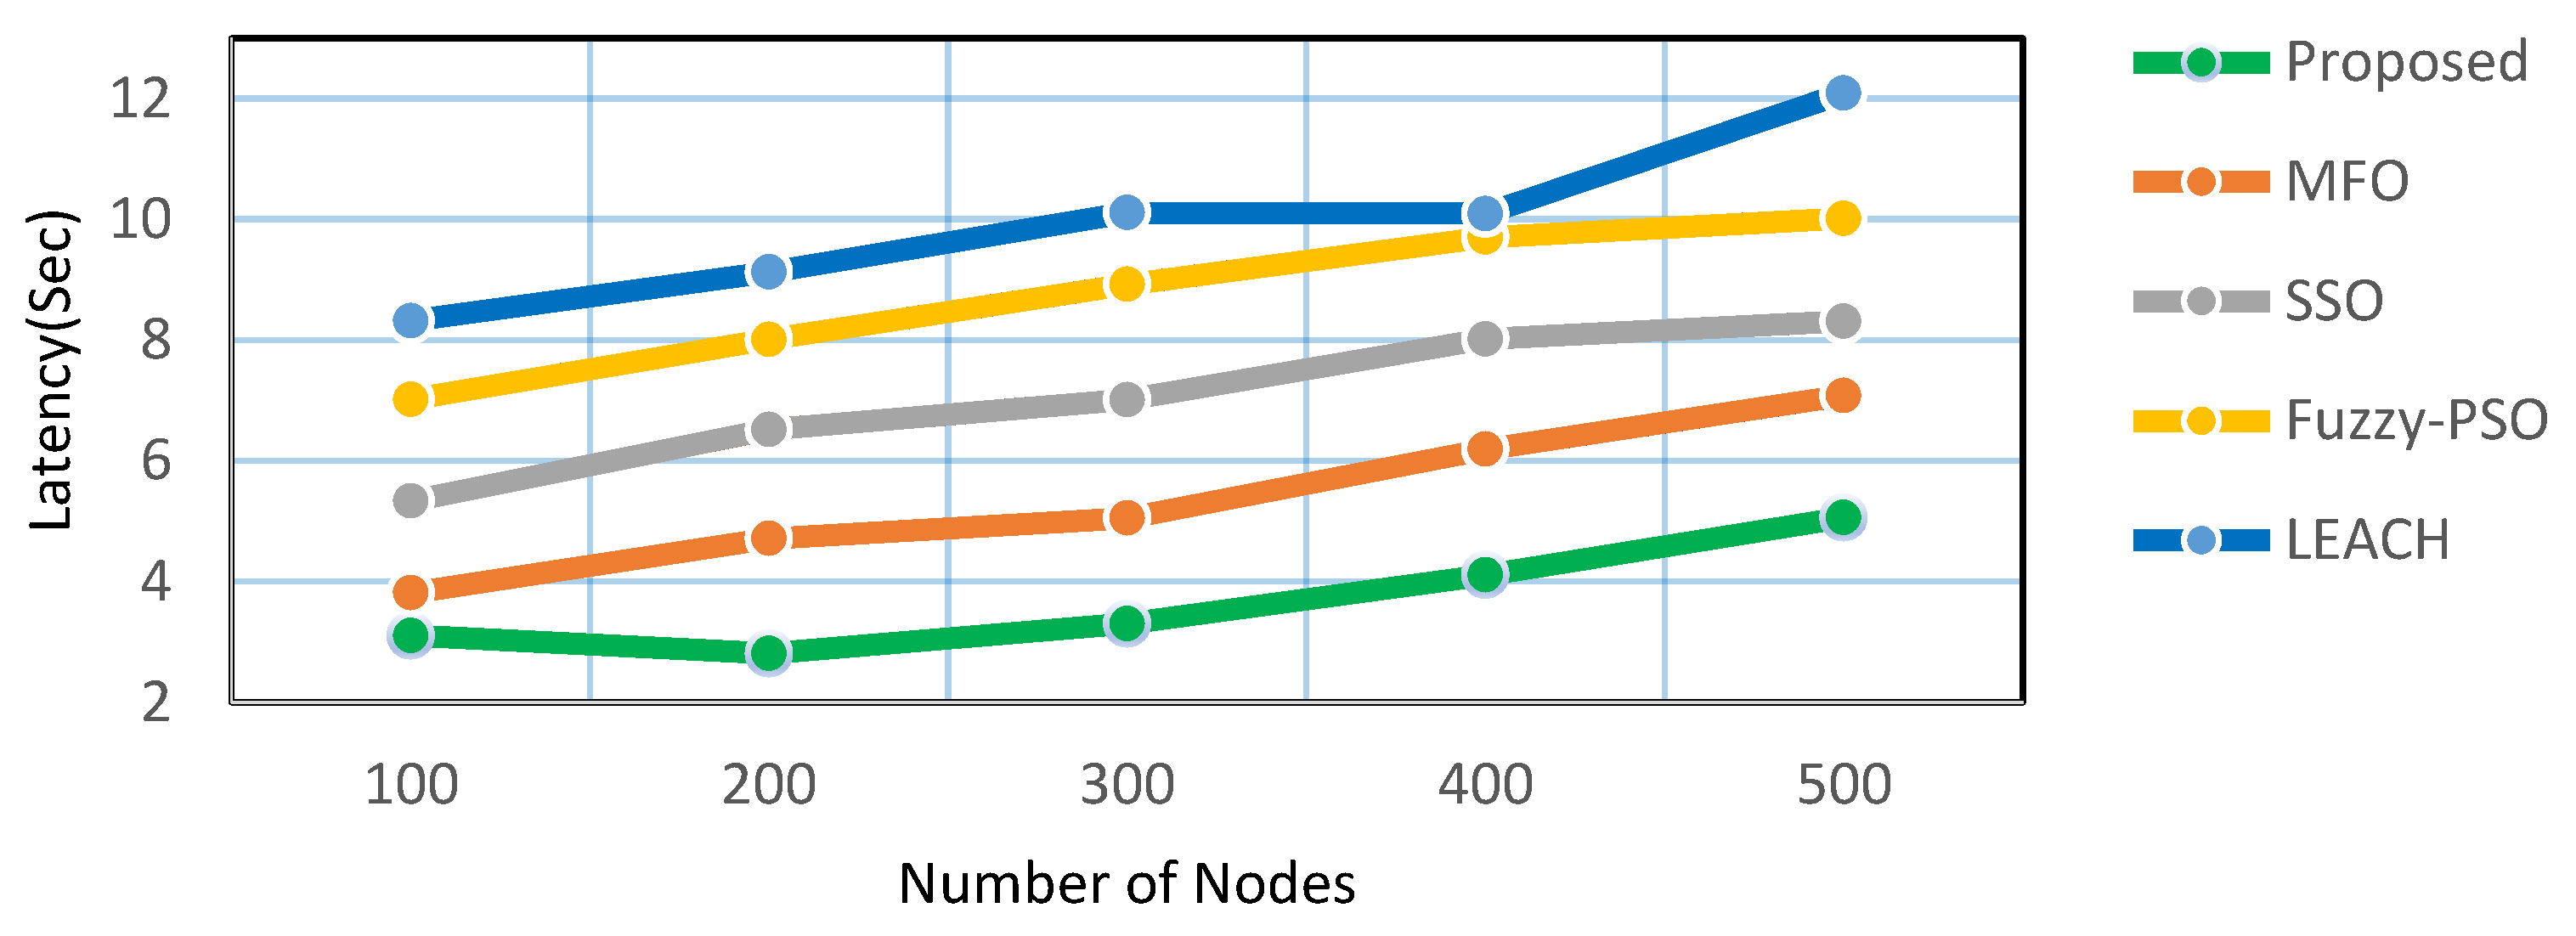
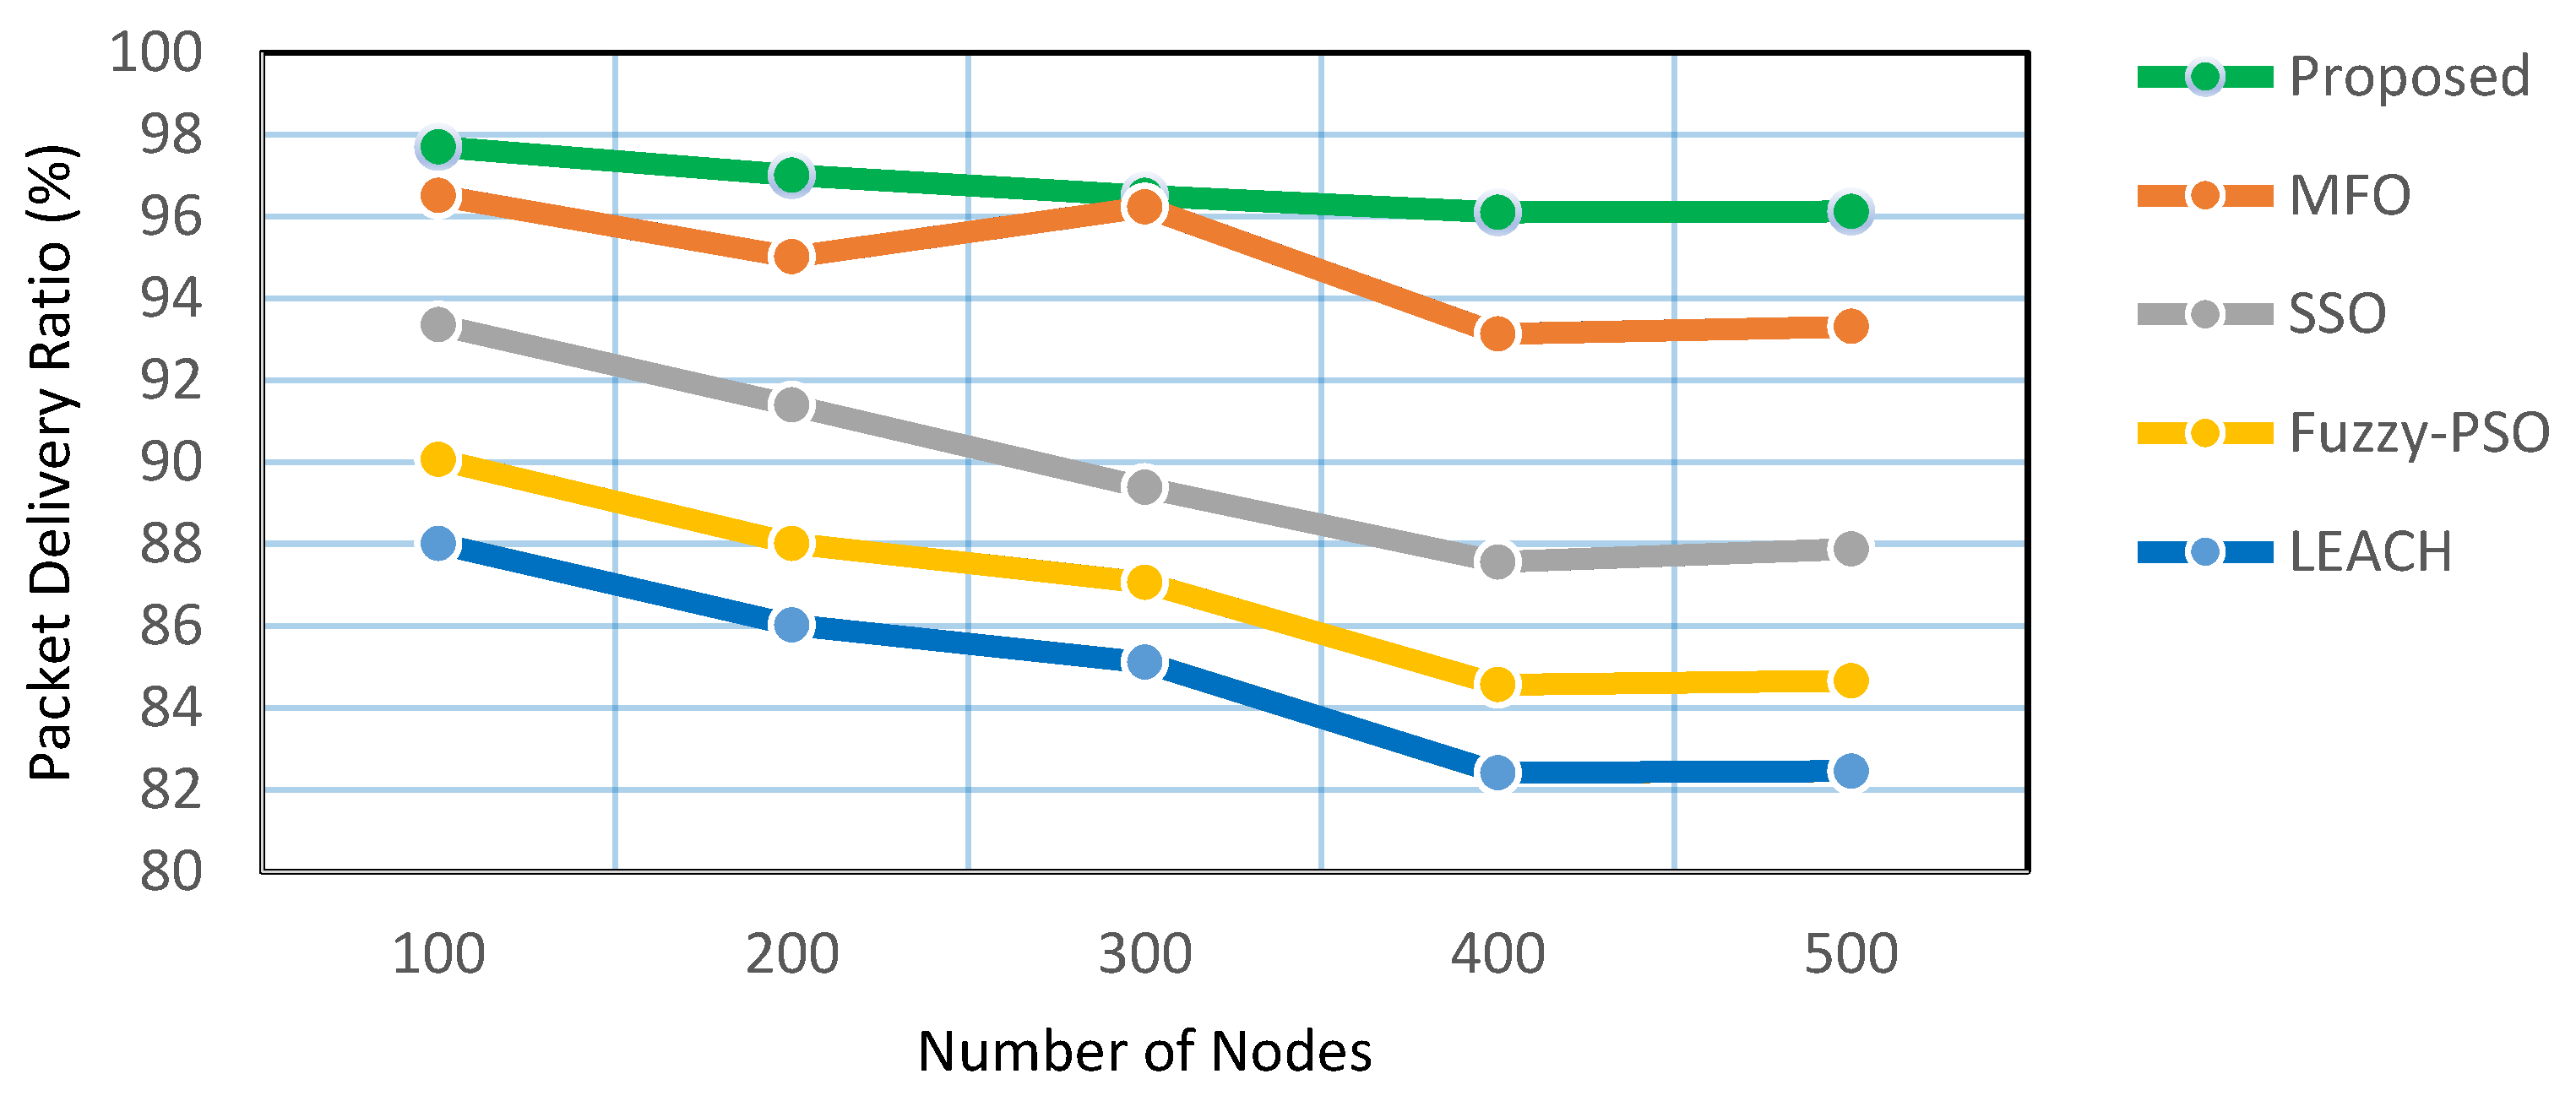
| Number of Nodes | Proposed | MFO | SSO | Fuzzy-PSO | LEACH |
|---|---|---|---|---|---|
| 100 | 97.7 | 96.51 | 93.35 | 90.06 | 88.01 |
| 200 | 97.01 | 95.01 | 91.39 | 88.01 | 86.02 |
| 300 | 96.51 | 96.23 | 89.38 | 87.06 | 85.11 |
| 400 | 96.13 | 93.13 | 87.56 | 84.56 | 82.41 |
| 500 | 96.12 | 93.31 | 87.88 | 84.66 | 82.45 |
| Number of Nodes | Proposed | MFO | SSO | Fuzzy-PSO | LEACH |
|---|---|---|---|---|---|
| 100 | 1550 | 1313 | 1295 | 1312 | 1112 |
| 200 | 1708 | 1401 | 1429 | 1388 | 1376 |
| 300 | 1981 | 1698 | 1696 | 1630 | 1253 |
| 400 | 2298 | 1792 | 1765 | 1891 | 1547 |
| 500 | 2391 | 2173 | 2001 | 2121 | 1920 |
Disclaimer/Publisher’s Note: The statements, opinions and data contained in all publications are solely those of the individual author(s) and contributor(s) and not of MDPI and/or the editor(s). MDPI and/or the editor(s) disclaim responsibility for any injury to people or property resulting from any ideas, methods, instructions or products referred to in the content. |
© 2023 by the authors. Licensee MDPI, Basel, Switzerland. This article is an open access article distributed under the terms and conditions of the Creative Commons Attribution (CC BY) license (https://creativecommons.org/licenses/by/4.0/).
Share and Cite
Vellaichamy, J.; Basheer, S.; Bai, P.S.M.; Khan, M.; Kumar Mathivanan, S.; Jayagopal, P.; Babu, J.C. Wireless Sensor Networks Based on Multi-Criteria Clustering and Optimal Bio-Inspired Algorithm for Energy-Efficient Routing. Appl. Sci. 2023, 13, 2801. https://doi.org/10.3390/app13052801
Vellaichamy J, Basheer S, Bai PSM, Khan M, Kumar Mathivanan S, Jayagopal P, Babu JC. Wireless Sensor Networks Based on Multi-Criteria Clustering and Optimal Bio-Inspired Algorithm for Energy-Efficient Routing. Applied Sciences. 2023; 13(5):2801. https://doi.org/10.3390/app13052801
Chicago/Turabian StyleVellaichamy, Jeevanantham, Shakila Basheer, Prabin Selvestar Mercy Bai, Mudassir Khan, Sandeep Kumar Mathivanan, Prabhu Jayagopal, and Jyothi Chinna Babu. 2023. "Wireless Sensor Networks Based on Multi-Criteria Clustering and Optimal Bio-Inspired Algorithm for Energy-Efficient Routing" Applied Sciences 13, no. 5: 2801. https://doi.org/10.3390/app13052801
APA StyleVellaichamy, J., Basheer, S., Bai, P. S. M., Khan, M., Kumar Mathivanan, S., Jayagopal, P., & Babu, J. C. (2023). Wireless Sensor Networks Based on Multi-Criteria Clustering and Optimal Bio-Inspired Algorithm for Energy-Efficient Routing. Applied Sciences, 13(5), 2801. https://doi.org/10.3390/app13052801