Article

Algorithm and Application of Foundation Displacement Monitoring of Railway Cable Bridges Based on Satellite Observation Data

1
China Academy of Railway Sciences Corporation Limited Railway Engineering Research Institute, Beijing 100081, China
2
State Key Laboratory for Track Technology of High-Speed Railway, Beijing 100081, China
3
State Nuclear Electric Power Planning, Design & Research Institute Co., Ltd., Beijing 100095, China
*
Author to whom correspondence should be addressed.
Appl. Sci. 2023, 13(5), 2868; https://doi.org/10.3390/app13052868
Submission received: 13 September 2022 / Revised: 2 February 2023 / Accepted: 2 February 2023 / Published: 23 February 2023
(This article belongs to the Special Issue Advanced Technologies for Bridge Design and Construction)

Abstract

:
In order to realize real time monitoring of foundation displacement of railway cable bridge based on satellite observation system, reasonable data sources of satellite monitoring and data analysis duration are necessary, and the influence of various errors should be eliminated in the process of satellite signal acquisition. In this paper, the validity of foundation settlement monitoring of bridge tower by satellite is verified through accuracy and stability tests. For eliminating the multipath error and random noise of GNSS signal, a new method is presented by combining stationary wavelet transform and empirical mode decomposition in this study. For improving the observation accuracy of the satellite monitoring system, combing the measured data, the GNSS data are corrected by establishing non-linear mapping between the GNSS data and precise leveling data by BP neural network. Based on that, the accuracy of the presented method is verified by the foundation settlement data of a new railway cable bridge tower.

1. Introduction

The self-weight of girder and vehicle load are usually transmitted to the bridge tower by stay cable or main cable. To satisfy the stability of the vehicle and the rational dis-tribution of the cable force, the bridge tower has been designed as higher tower and larger cross-section in engineering [1]. As the deadweight of the structure increases, it can easily deform the foundation of the bridge tower and affect the vehicle riding comfort. In addition, the foundation settlement of the bridge tower can affect the construction formwork positioning, steel anchor beam positioning, and alignment control of the main girder in the construction process. As a consequence, the continuous monitoring of the foundation displacement of the long-span bridge is the necessary guarantee for the bridge safety during the construction and operation periods. Currently, traditional foundation displacement monitoring is usually adopted for the precise leveling. However, due to various disadvantages of manual monitoring, such as heavy workload, error accumulation, long observation period, etc., especially in the service period of bridges, it is difficult to achieve rapid, accurate, and real-time monitoring of foundation displacement.
The technological improvement in Global Navigation Satellite System (GNSS) tech-niques and advances in data processing algorithms, compared with the traditional deformation monitoring methods, have provided real-time 3D absolute displacements, continuously operating under all-weather conditions, and no need for line-of-sight between stations. With the increase of sampling frequency and dual-frequency GPS real-time kinematic, GNSS technology has been carried out to examine the ability of displacement detection of static and dynamic response of high-rise buildings [2] and long-span bridges [3]. Due to the satellite ephemeris error, tropospheric delay error, multipath effect error, etc., the obtained data with real-time GNSS techniques has a short-term accuracy of 10 mm. However, at times, foundation displacement monitoring requires greater accuracies during construction and operation. Then, the way of collecting data directly through GNSS cannot meet the accuracy requirements in real-time monitoring of foundation displacement and prediction of the final settlement.
GNSS system usually adopts short baseline (i.e., less than 5 km) when it is applied to deformation monitoring of structures [4]. In relative positioning of short baselines, the double difference (DD) method causes some errors to be eliminated or decreased [5], such as receiver and satellite clock errors, orbital errors and ionosphere/troposphere errors, whereas the multipath error is the main error in DD residual of LS solutions [6]. Multipath errors differ from receiver to receiver and are not correlated. Then the DD technique cannot reduce multipath disturbances due to the lack of correlation. In dynamic de-formation monitoring, on account that the position of satellite antenna and its sur-rounding environment are basically unchanged, the signal noise can be decreased by employing wavelet de-noising [7], empirical mode decomposition [8] (EMD), and filtering algorithm [9] through the multipath interference-effect.
The focus of this study is to demonstrate the performance of the continuous monitoring of the foundation displacement in long-span bridges with GNSS technology. This pa-per is organized as follows. Section 2 offers brief descriptions of the relevant theories on de-nosing approach. The stability and accuracy tests are summarized in Section 3. A new method is proposed to realize real-time monitoring of foundation displacement and prediction of final settlement in Section 4. In Section 5, based on the Hutong Yangtze River Bridge, the quality of the proposed method is proved by analysis and comparison with the precise level method in the construction process. Finally, Section 6 summarizes the key findings.

2. Theoretical Background

2.1. Extraction of Multipath Effect

GNSS monitoring signal is mainly composed of actual vibration, multipath error, and random noise, in which the multipath error is mostly from 0 to 0.2 Hz in frequency domain [10]. The origin of multipath effect is that the received signal in a GNSS receiver may come from several directions and are referred to as multipath signals. In practice, there are objects near the receiver which create replicas of the signal. These replicas go through a longer path than the original signal causing the large propagation delay for these replicas [11]. If the elapsed time is more than a code chip, the receiver usually can cope with multipath disturbance, and multipath signals have a slight effect on the receiver positioning accuracy. Multipath signals with short delay caused by close objects greatly affect the performance of the receiver. Actually, the process of correlation computation between the received signal and the generated reference in the receiver is affected since the received signal is a distorted version of the original signal. Furthermore, phase distortion of the received signal results in pseudorange and carrier phase measurements error and consequently positioning error [12].
The GNSS observations are always defined as the non-stationary process. Because the GPS multipath error appears in the low-frequency part of the decomposition, the wavelet transform (WT) can be used for suitable resolution acquisition and error extraction. The double difference (DD) residuals are considered to be the input signal by the WT approach. The high frequency components generated by the WT need to denoised. The sampling of orthogonal wavelet on the basis of the discrete wavelet transform in scales is not uniform, and with the increase of the scale, the interval of sampling increases exponentially to the power of 2. The stationary wavelet transform (SWT) is distinct from the standard WT. The filter output by the former is not sub-sampled and the used filters are up-sampled at each level. But the produced result at each level by the latter becomes shorter in length. As a result, SWT can weaken the oscillation effect in DWT. The specific procedures which remove the multipath error of GNSS signal using the SWT method are shown as follows [13].
The first step of this procedures is applying the SWT to the pseudorange DD residuals using symmlets family as the mother wavelet. The decomposition level is three. In the standard method, the transformation used is the standard WT, whereas in the proposed method the SWT has been used which creates a redundant representation due to its shift invariant property.
In the second step, the thresholding procedure is used to change coefficients. The threshold can be expressed as [7]
TH = MAD 0.6745 2 log L
where L is the length of signal; MAD is absolute median difference of high-frequency coefficients.
Thresholding is done by determining the method of coefficients reformation and the noise model. The noise model is always defined as the standard Gaussian distribution with zero mean and one variance.
The third step is reconstructing the coefficients obtained from the previous stage. Since the applied transformation is the SWT, which results in the coefficients redundancy, the reconstruction process has no up samplers.
The fourth step is applying the extracted multipath to the DD observations. For eliminating the multipath error, the extracted multipath disturbance from the last stage is needed to be applied directly to the DD observations. Then the obtained DD observations eliminating multipath errors are used to the least square method. By this approach, the newly residual shows how efficiently the multipath effect has been removed.

2.2. Denoising Random Noise

The relationship between the monitored data and real deformation signal can be expressed as:
x ( t ) = s ( t ) + n ( t )
where x(t) is recorded data, s(t) and n(t) are the true signal and noise, respectively. Because noise is ubiquitous and represents a highly undesirable and dreaded part of any data, many data analysis methods were designed specifically to remove the noise and extract the true signals in data, although often not successful.
The Empirical Mode Decomposition (EMD) has been proposed recently as an adaptive time-frequency data analysis method. The EMD can decompose any data into a set of Intrinsic Mode Function (IMF) components, which become the basis representing the data. Such an EMD method is not limited by the Heisenberg uncertainty principle, and can get relatively high frequency resolution. Also because of the adaptive nature of the basis, there is no need for harmonics; therefore, EMD is ideally suited for analyzing data from nonstationary and nonlinear processes. The basic process of decomposition is shown in the Refs. [14,15].
Through EMD, the signal containing noise x(t) is decomposed into the intrinsic mode IMFi and residual component rn from high frequency to low frequency, that is
x ( t ) = i = 1 n IMF i ( t ) + r n ( t )
where rn(t) is the residue of data x(t), and IMFs are simple oscillatory functions that vary with amplitude and frequency.
The filtering method relies on the basic idea that most of the important structures of the signal are often concentrated on the lower frequency ones (last IMFs) and decrease toward high-frequency modes (first IMFs). It is generally believed that high-frequency components are corrupted by the noise, while low-frequency components are subjected to little impacts of the noise. According to this idea, there is a mode, after which, monitored data are dominated by the real dynamic deformation signal, whereas the previous modes are high-frequency components dominated by the noise. It has been shown that based on partial reconstruction of relevant modes, EMD performs signals filtering in an adaptive way [16]. However, it still raises two questions on how to select such modes in an efficient way, and some IMFs which contain noise and signal both are abandoned directly. The authors in [17,18] use a correlation-based threshold to discriminate between relevant and irrelevant IMFs. Generally speaking, the model of Gaussian white noise is usually employed to simplify the random noise in GNSS signal. The autocorrelation function of the white noise at the zero-point equals to one, and although it is not equivalent to zero at other points, the values of autocorrelation functions of such points are lower compared with that of the zero point. In the paper, based on the characteristics of Gaussian white noise model, autocorrelation function is employed to judge the number of IMF truncation, and then all components that have been processed and unprocessed are reconstructed to gain the denoised GNSS signal, x’(n), which is expressed as
x ( n ) = i = 1 k IMF i + j = k + 1 N IMF j
where k is the order of the dominant mode of noise determined by autocorrelation function. IMFj whose order is lower than k should be filtered by wavelet soft threshold.

3. Test for GNSS Monitoring System

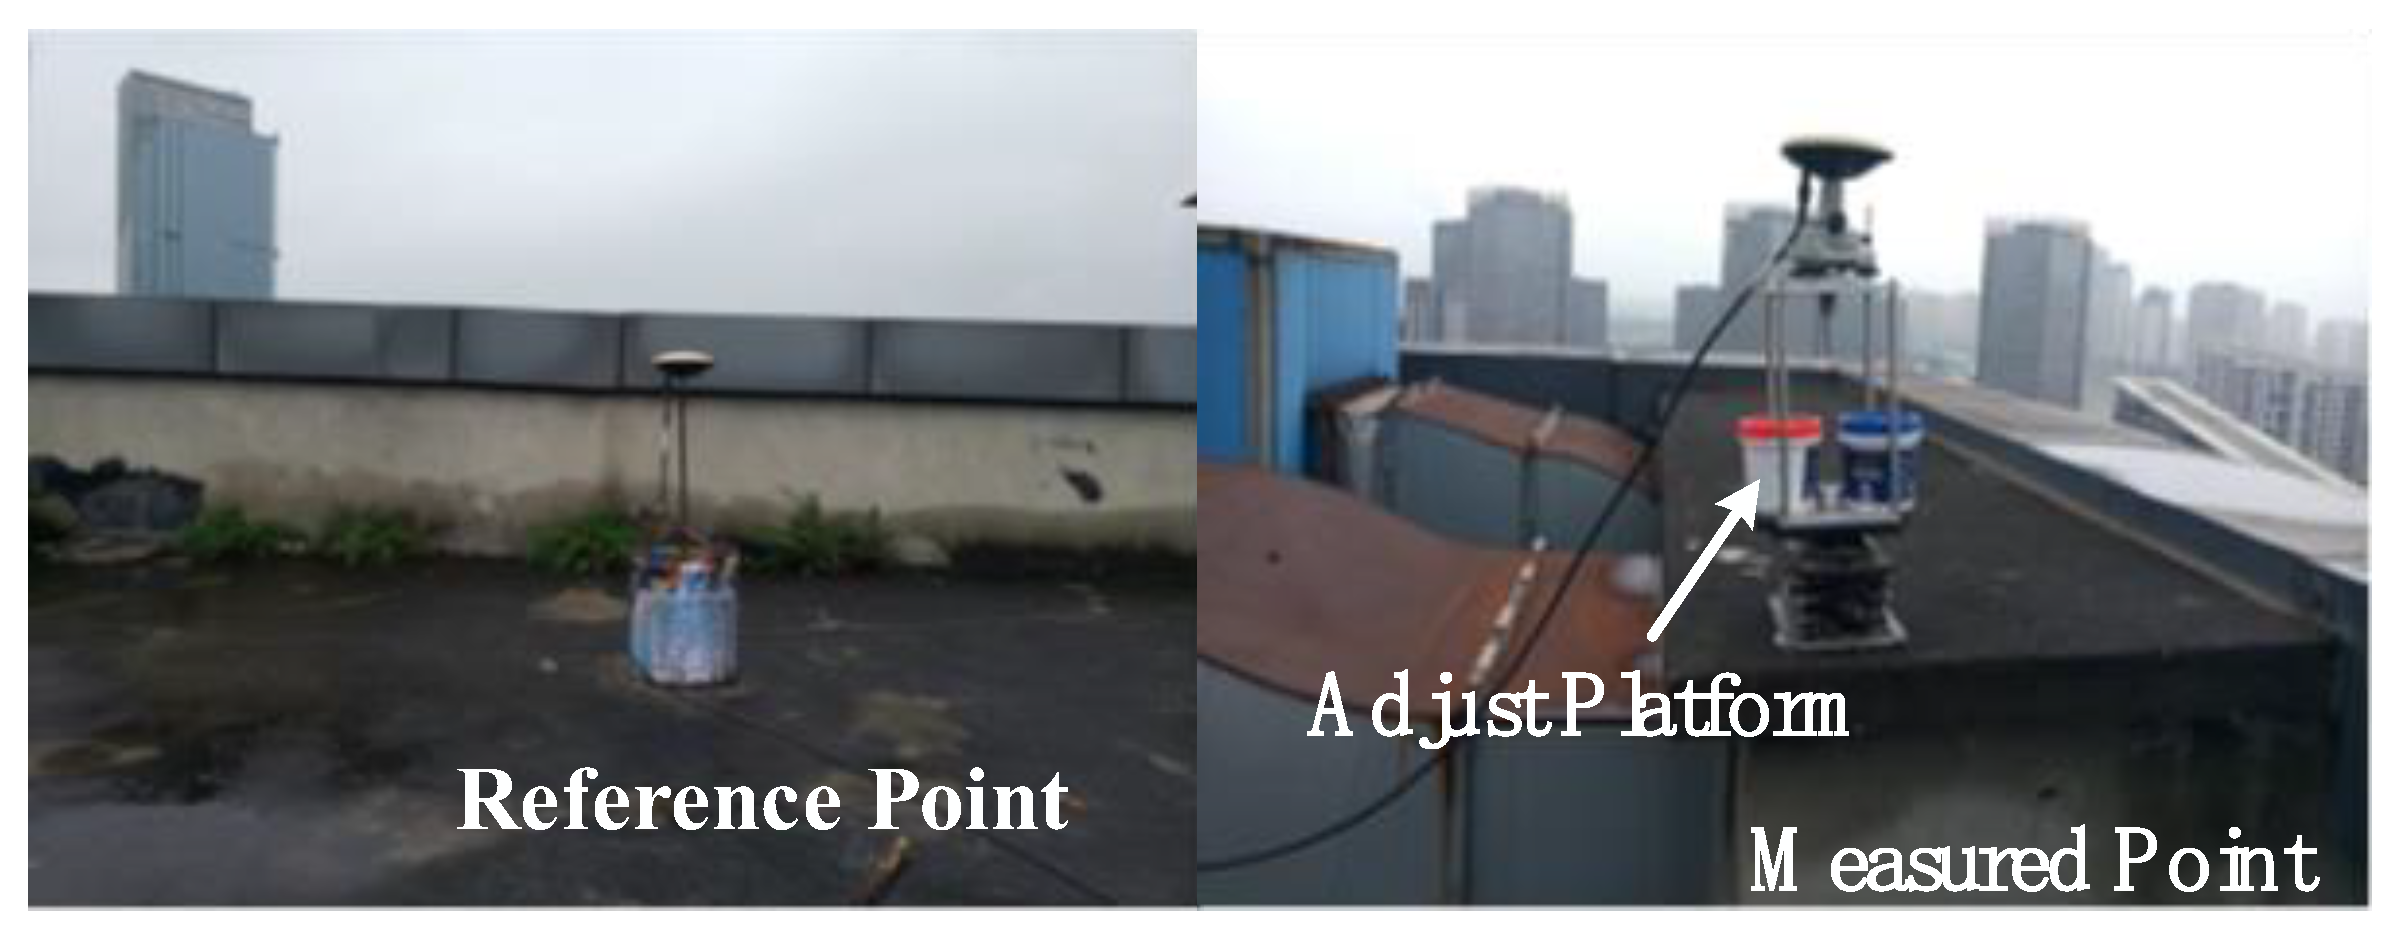
This test aims to estimate the accuracy of satellite positioning processed with GNSS sensors and noise reduction algorithm, and to distinguish the GNSS signal component. As shown in Figure 1, three control points were arranged in an open space. Monitoring Point B was coaxially mounted with a prism and a GNSS satellite antenna, the latter of which was able to receive GPS, BDS, and GPS + BDS satellite positioning signals. The support platform of Measuring B allows three-direction adjustment, as shown in Figure 2. Point A was arranged for a precision leveling measurement station and a total station was installed at the point with a centering device. Point P was for the rearview prism of the total station. The Point D was the reference station for GNSS satellite monitoring, equipped with a GNSS receiver and an antenna. The initial observation time lasted for 1 h in the precision experiment; after the displacement of the adjustable platform at Measurement Point B was adjusted, the duration of each observation was 30 min.
Figure 3 shows the results of the accuracy test, the results of precision leveling, and GNSS signal express the same trends with the actual displacement variations at the measurement point. The optimal accuracy is found in precision leveling, with both planar and vertical accuracy higher than 1 mm; GNSS data obtained by BDS + GPS and noise reduction algorithms achieve the planar accuracy higher than 1 mm, and the vertical accuracy higher than 3 mm.
Figure 4 shows the continuous observation of Point B, throughout which process the position of Point B remained unchanged. The stability experiment employed the stationary wavelet transform and the empirical noise reduction mode for experimental data; the calculations were carried out for 30 min, 1 h, 2 h, and 4 h respectively. As shown in the figure, with the GNSS positioning method, as the calculation duration extends, variation range of the monitoring data narrowed gradually, leading to smaller variance among the observed data. From the accuracy and stability experiment of GNSS, it can thus be concluded that the GPS + BDS data and the 4 h calculation scheme result in higher data positioning accuracy.

4. Method to Extract Foundation Settlement by Satellite Monitoring

It is difficult to avoid deformation of the foundation of long-span bridge structure. Given this phenomenon, there exist many problems in the conventional method, precise leveling, such as large monitoring workload, error accumulation, long observation period, and so. Then, it is also difficult for this practice to achieve the purpose of rapid and accurate real-time monitoring of displacement, deformation, and settlement. Considering the above factors, GNSS satellite observation system can be regarded as a basis, and a monitoring system for settlement and deformation of bridge tower foundation is established, to realize continuous observation of foundation displacement in the stage of construction and operation. It is inevitable that there are acquisition errors in terms of the measured data, so the collected data should be denoised in real-time. In the construction stage of the bridge, the constructors observe the foundation displacement manually using the total station and other measuring devices. On this basis, the observation data obtained through GNSS satellite can be corrected according to the precise leveling data in the construction stage, to provide the basis for the continuous observation of the foundation settlement and the prediction of the final settlement of the bridge in the operation stage.
The error of satellite signals of monitoring the foundation displacement of bridge tower includes multipath errors and random noises. In this paper, SWT and improved EMD decomposition are respectively employed to eliminate the multipath error and random noise, to remove the error induced by GNSS signal collection to some extent. Considering the fact that the refraction and delay of the ionosphere and troposphere, as well as the multipath error cannot be absolutely eliminated, there are still errors between such denoised GNSS data and the foundation settlement obtained by precise leveling in the construction process. Generally, in the construction process, the measurement of the foundation displacement and the construction of the bridge structure are carried out simultaneously, and the process data such as the temporary load involved in the process and the quality of the bridge tower should be comprehensively mastered. As a consequence, based on the measurement data in the construction process, the data of foundation displacement obtained through GNSS signal can be corrected, and then the phased and final settlement can be predicted according to the revised data.
At present, the method of using measured data to predict foundation settlement is generally to select a specific model, determine the parameters in the settlement model through parameter fitting, and then predict the phased or final settlement. The frequently used models for settlement prediction include Asaoka model [19], hyperbolic model [20], exponential model, Hoshino Nori model, Gompertz model, and Weibull model, among which the hyperbolic model, exponential model, and Hoshino Nori model are associated with two parameters, which can be expressed as
S t = S 0 + Δ S ( a , b , t , t 0 )
where St is the total settlement with the time t; S0 and ∆S are the initial settlement and settlement, respectively; t0 and t are the initial time and elapsed time of settlement, respectively; a and b are coefficients. When the settlement model has been selected, the results of settlement observation are treated with parameter fitting based on the Equation (5) to represent the settlement of the foundation of bridge tower.
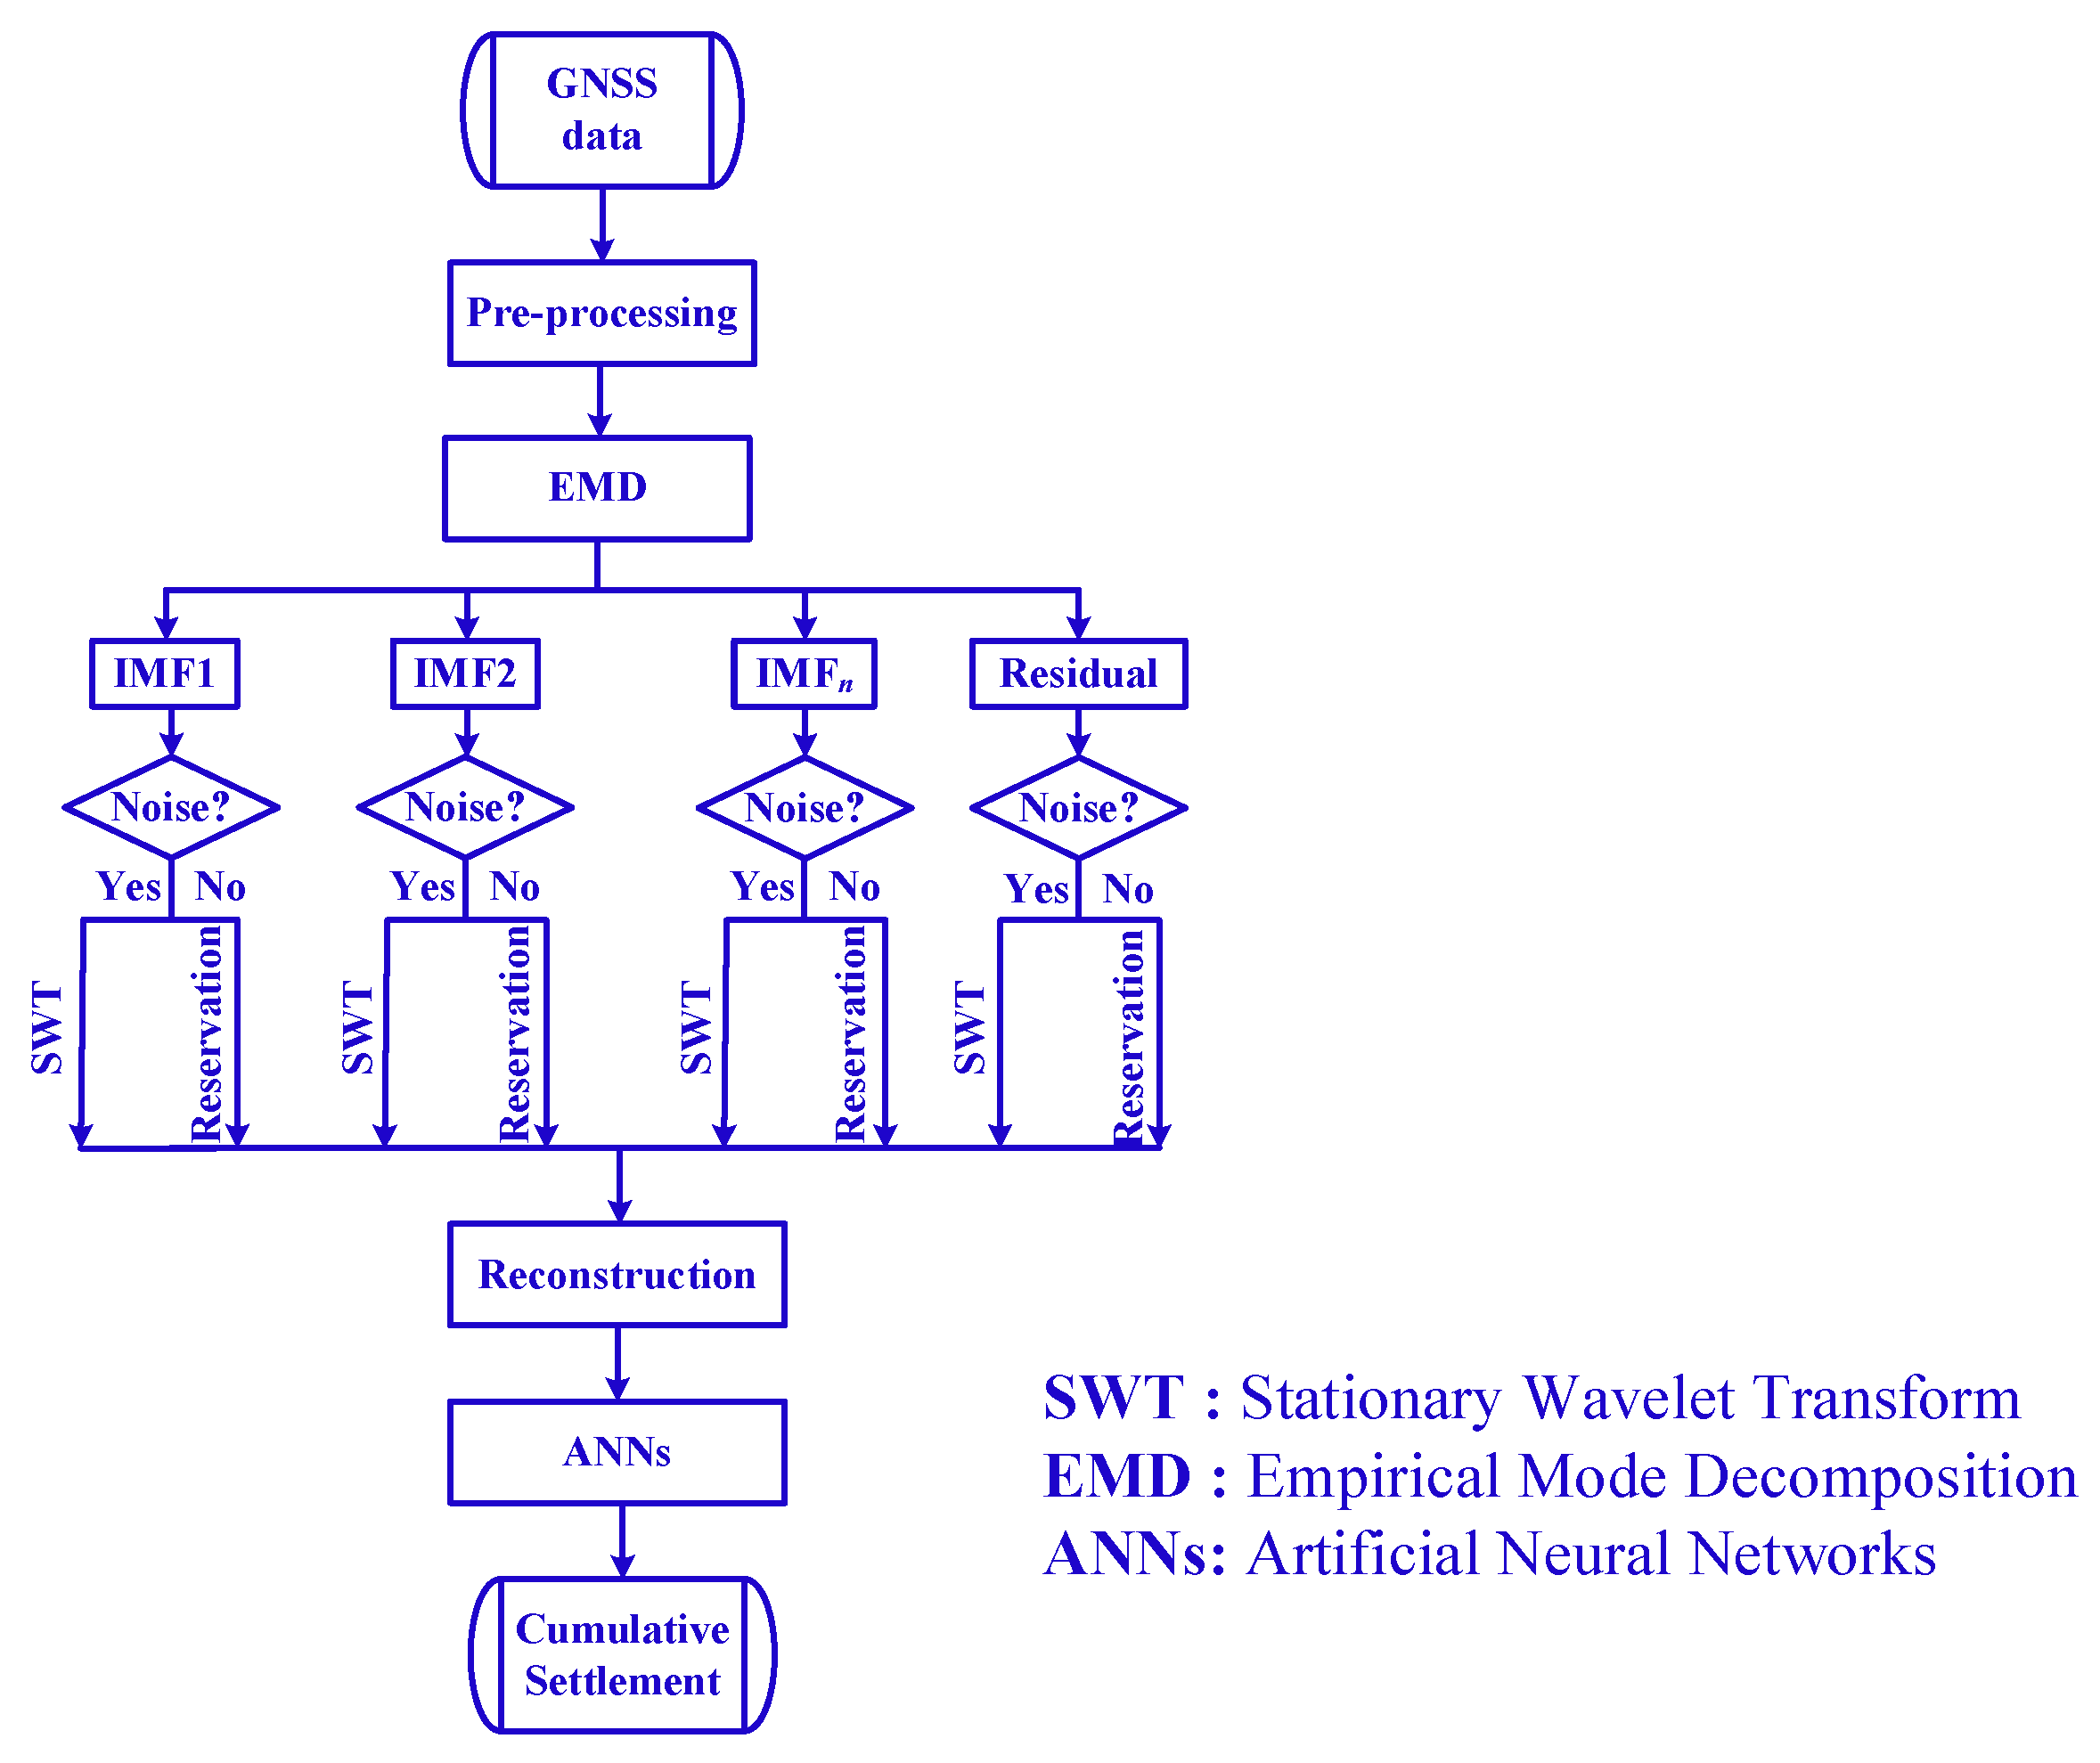
The present work focuses on the development of a predictive tool to accurately estimate foundation settlement of the bridge tower. This tool is based on artificial neural networks (ANNs) and makes use of the precise leveling data. For the bridge tower in the process of construction, the tower mass, GNSS signals, precise leveling data, and observation time are regarded as the input layer by BP neural network to establish the non-linear mapping relationship between the model parameters a’ and b’ obtained through GNSS-based parameter fitting and the parameters a and b obtained through the precise leveling measurement, as shown in Figure 5. For the bridge tower in the operation process, there is generally no need to implement regular precise leveling measurement. As the above consequence, the measured data can be mapped to the revised foundation settlement data according to the GNSS signal and the non-linear mapping relationship obtained through training in the process of construction. Then, the final settlement can be predicted according to the selected settlement model. The flow chart representing the method in this paper is shown in Figure 6.
The major steps of the proposed method are outlined as follows:
  • The poor values can be eliminated according to the median absolute difference of three times, and the data loss induced by signal masking can be compensated by linear interpolation, to obtain the pre-processed signal.
  • The GNSS signal denoised by SWT and EMD.
  • The hyperbolic model is applied to fitting the parameters of GNSS signal and the settlement data obtained by precise leveling, respectively.
  • In order to correct the foundation settlement of bridge tower, two three-layer backpropagation neural network structures were used for mapping from the a׳ and b׳ fitting by GNSS signal to the a and b fitting by the precise leveling.

5. Cased Study

5.1. Monitoring System of Foundation Displacement of Long-Span Bridge

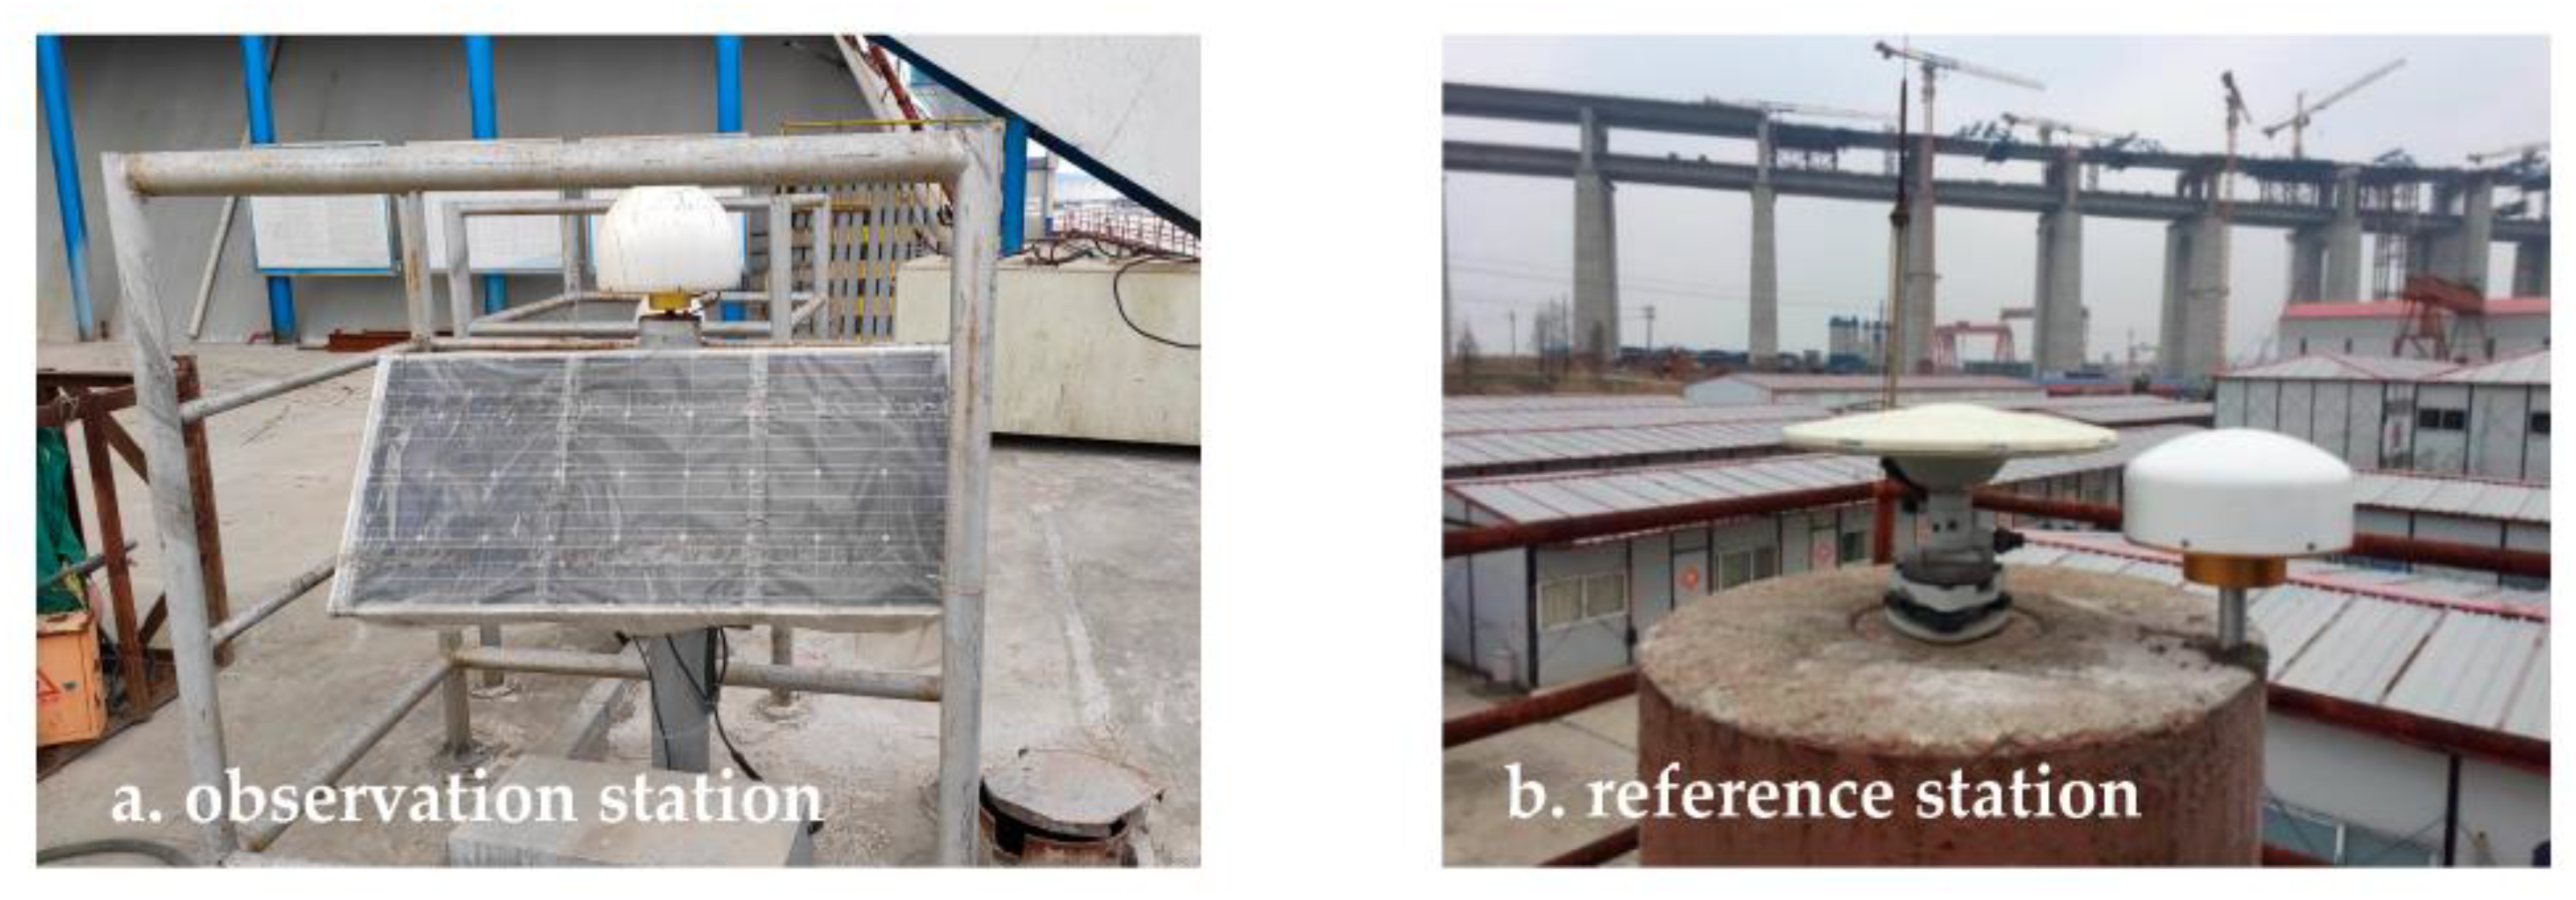
In order to verify the accuracy of the proposed method in this paper, GNSS observation stations are established in a highway-railway cable-stayed bridge in the construction stage with a main span of 1092 m, as shown in Figure 7. HWA-BM-300 dual-frequency receiver is arranged at each corner of the cushion cap to receive signals of GPS and BDS satellites at the same time. Whereas, the data serving analysis is mainly from GPS + BDS signals, which can monitor the deformation of the cushion cap. The reference station is set up in the south bank (within 2 km), in which the GNSS base station used for measuring and lofting has been built. The reference station antenna is set up side by side with the original antenna on the top of the steel pipe pile of the base station (without mutual interference), and the wireless transmission and solar power supply are adopted, as shown in Figure 8. In addition, a base station for monitoring the deformation of bearing platform is set up independently.
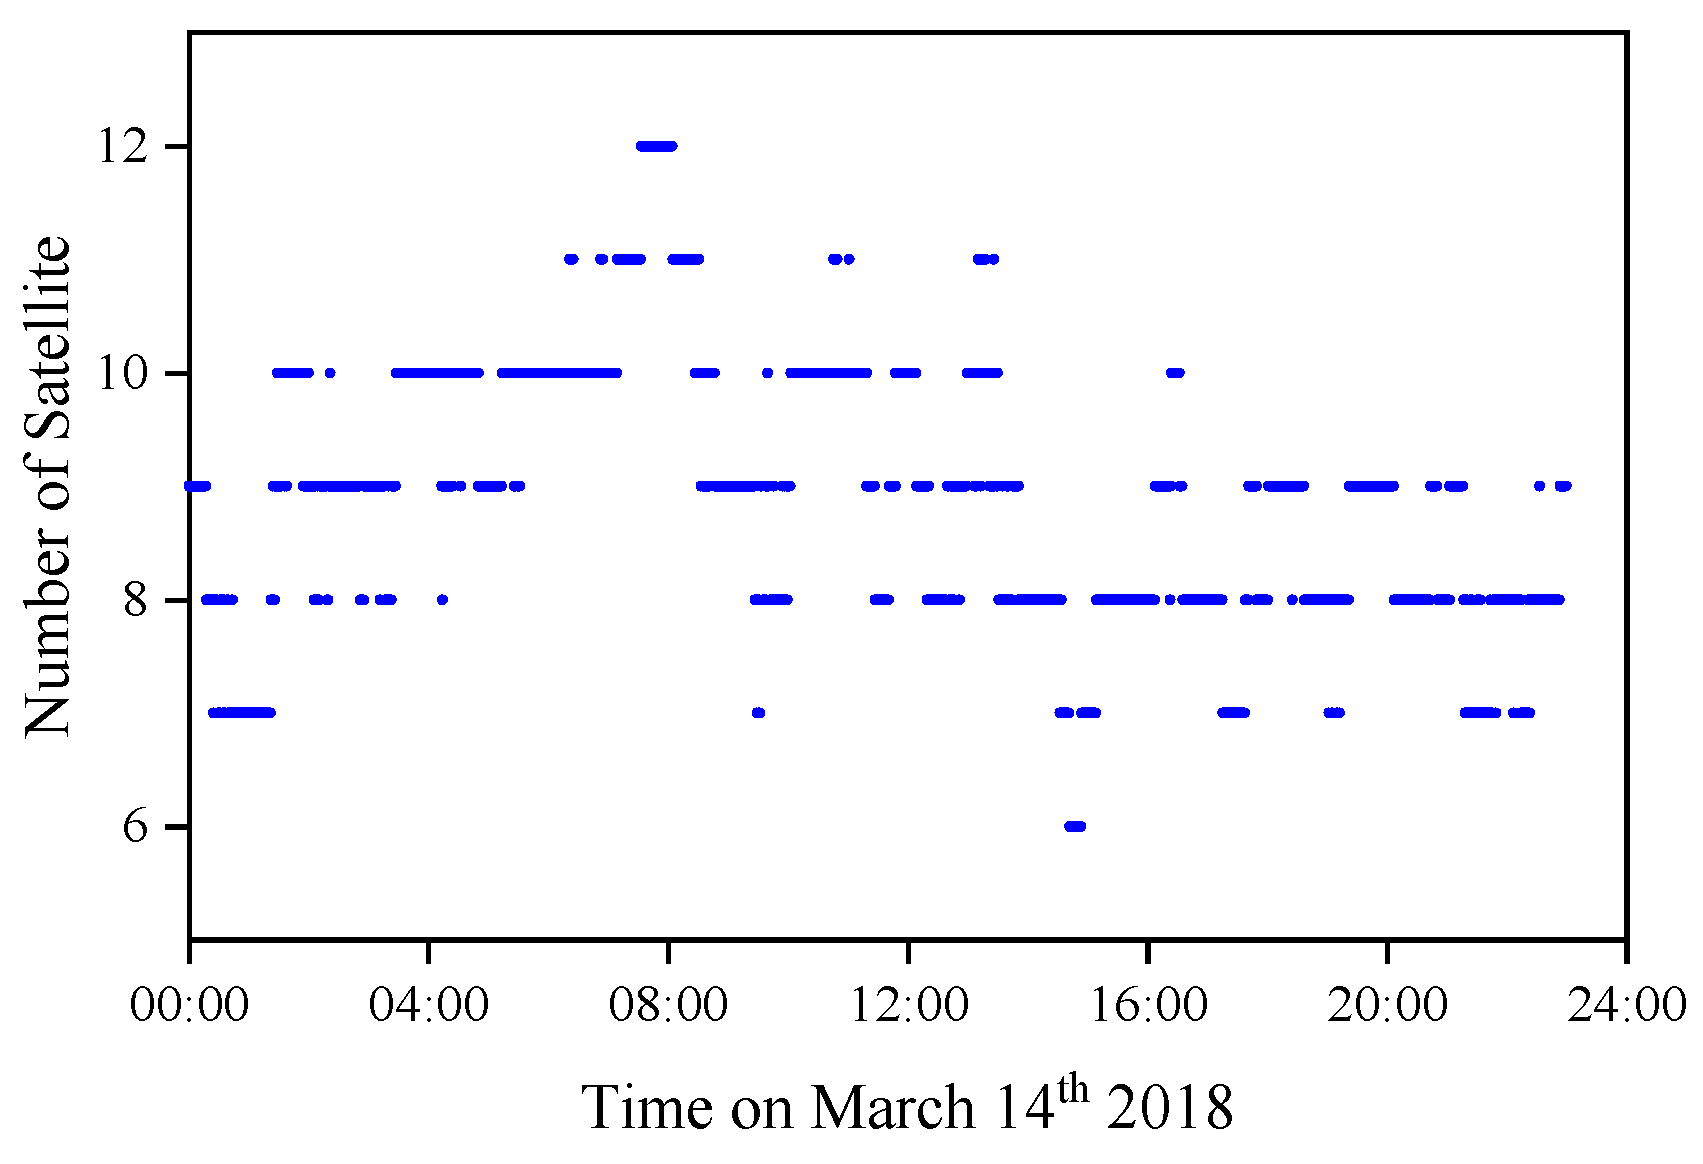
Figure 9 and Figure 10 show the satellite visibility of the GNNS at the observation station and reference station on 14 March 2018. As shown, GNSS receivers can obtain signal from more than four satellites, meeting the needs of three-dimensional positioning. Since all the monitoring stations are not far from this site, they can have a similar observation condition.

5.2. Data Preprocessing

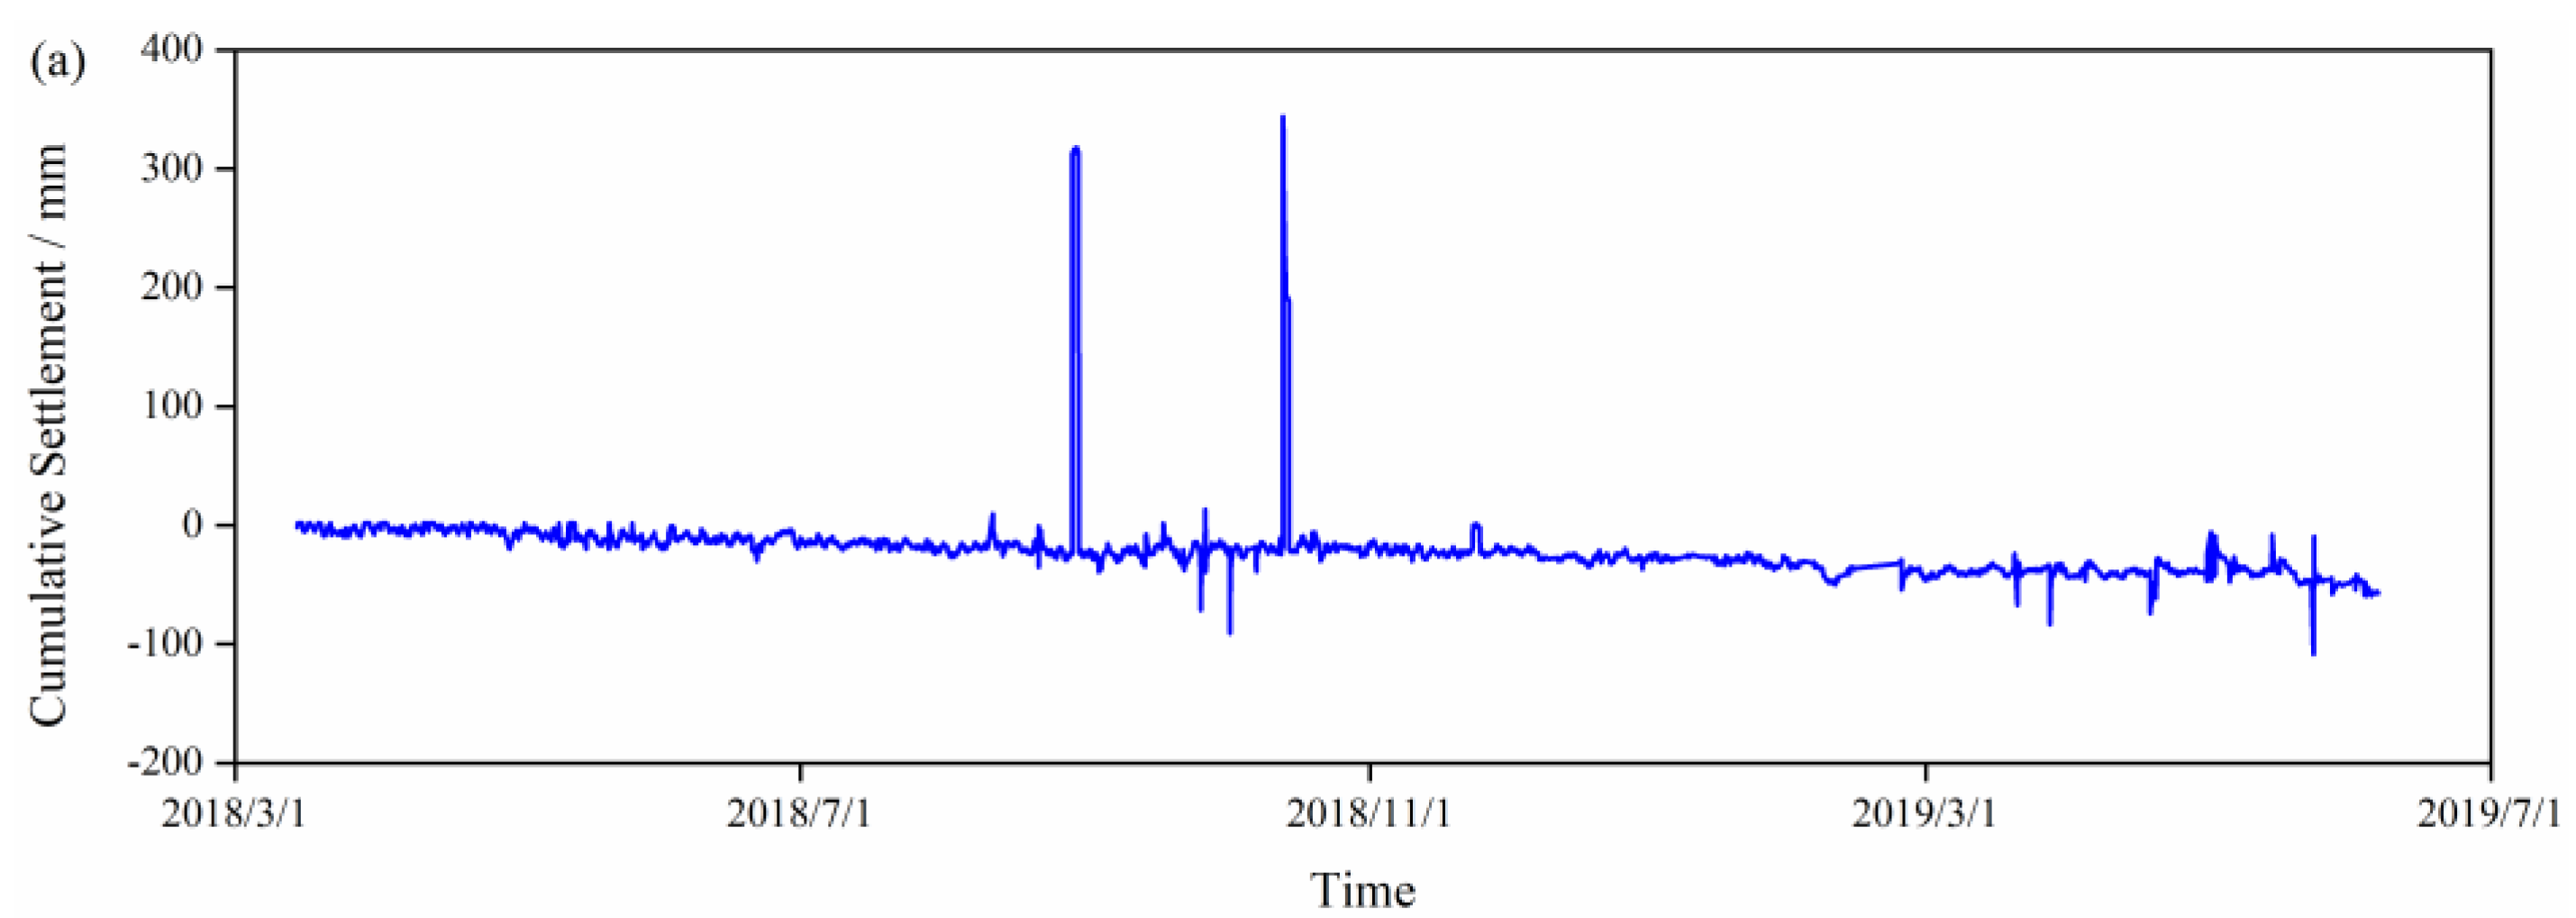
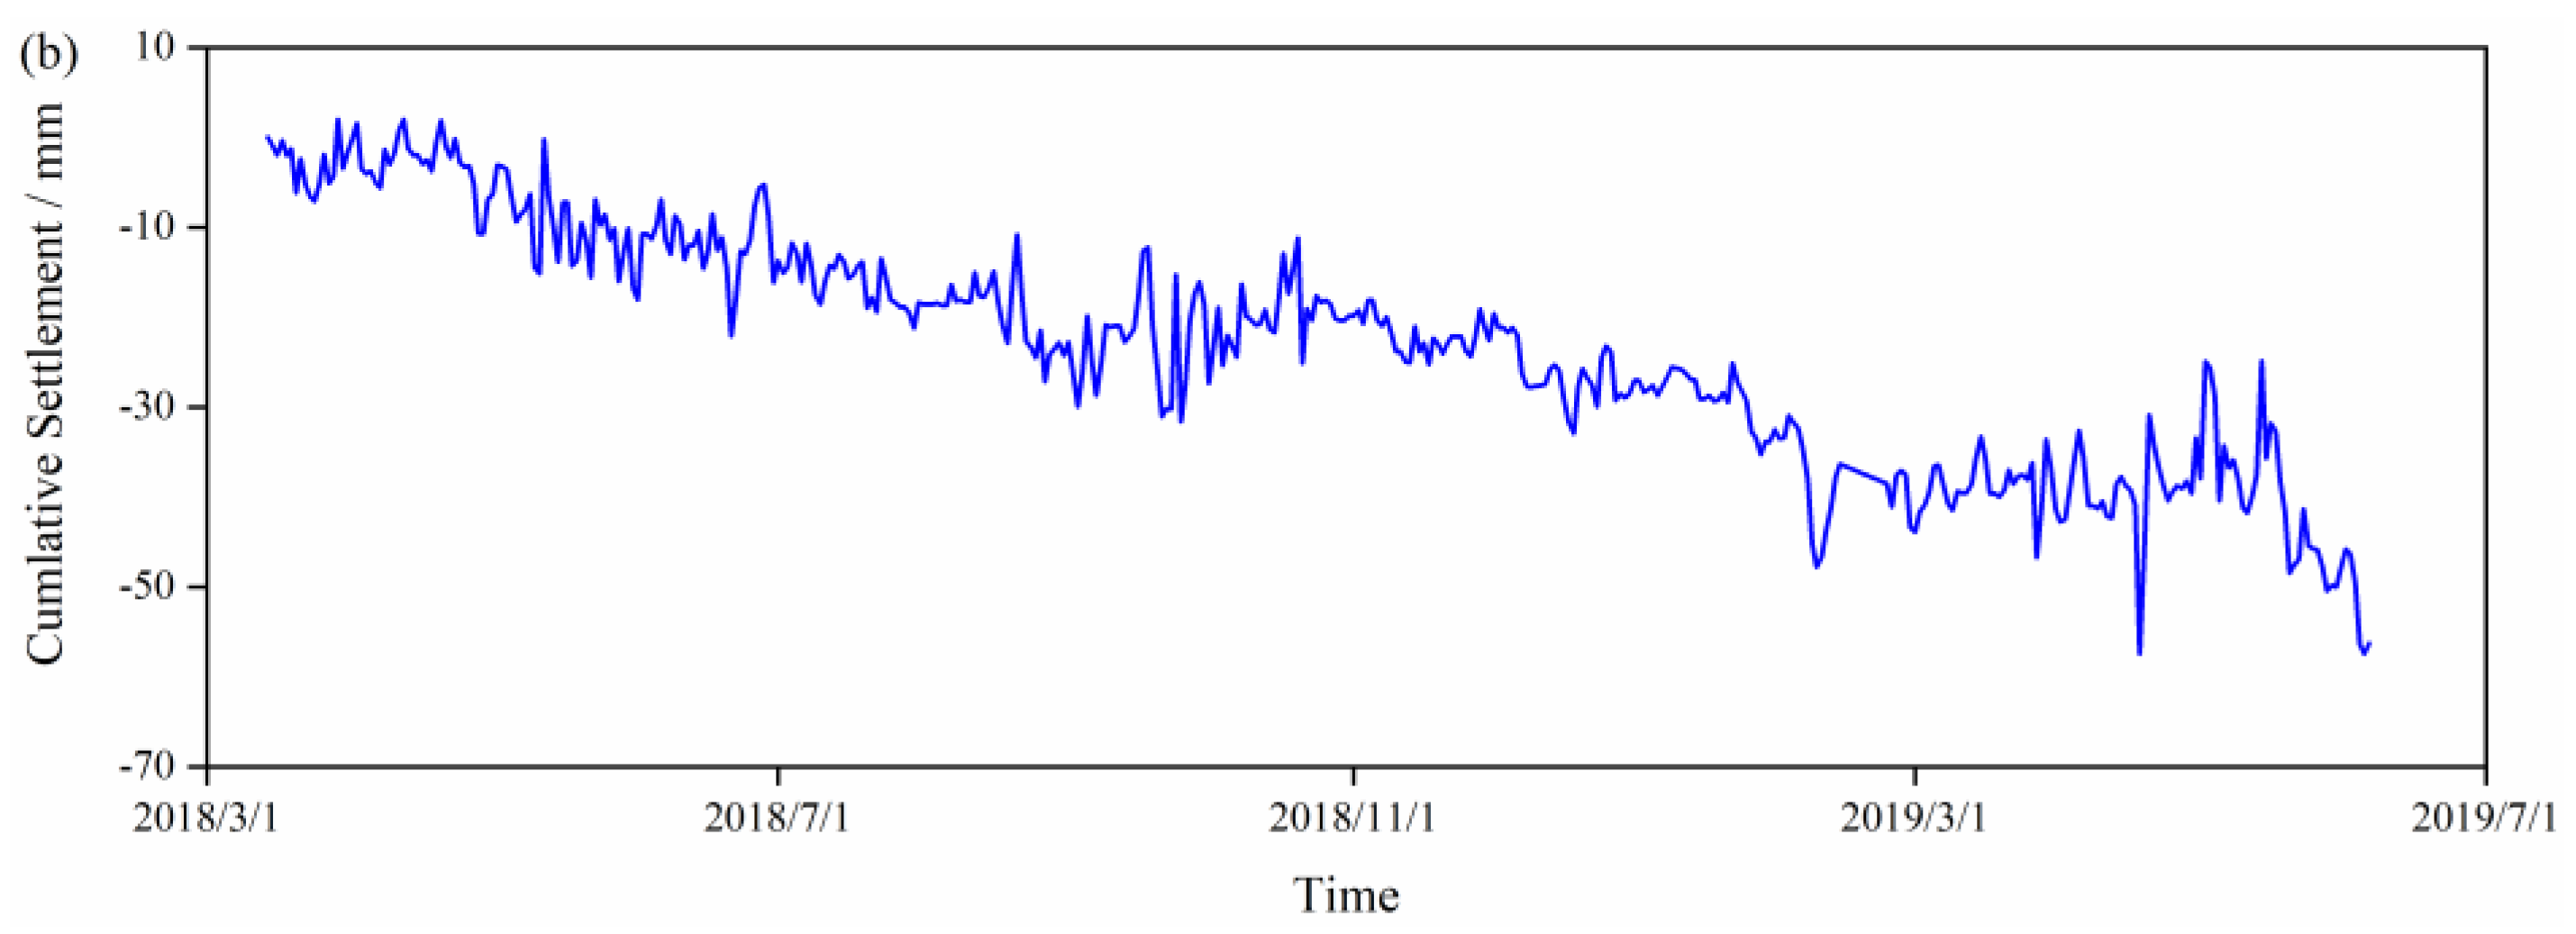
The data of this study are analyzed by using the proposed method from 14 March 2018 to 27 June 2019. These times are respectively corresponding to the concrete pouring of the 6th tower section and the concrete pouring of the 54th tower section, with a total of 63 manual measurements by precise leveling during this time. The GNSS high-precision device sends data once every 5 s, and the software carrying out resolving the data once every 4 h by the proposed method in this paper. Since the foundation settlement is a slow process, and considering the discreteness of the original data, the bad values can be eliminated according to the median absolute difference of three times, and the data loss induced by signal masking can be compensated by linear interpolation, to obtain the pre-processed signal. Figure 11a,b represents the original settlement data and pre-processed signal of observation station A, respectively. As shown in the figure, the pre-processing data eliminate the bad points and missing points in the original signal.

5.3. Wavelet Basis Function

In wavelet denoising, the choice of wavelet basis function is directly related to the effect of signal denoising. To compare the performance difference between GNSS and precise leveling, signal-to-noise ratio (SNR) and root mean square error (RMSE) are used in the study as below:
SNR = 10 lg n x 2 ( n ) n x ( n ) x ( n ) 2 ;           RMSE = 1 n n x ( n ) x ( n ) .
The SNR generally means the dimensionless ratio of the signal power to the noise power contained in the recording, and RMSE is a frequently applied measure of the differences between the denoising signal with original signal. Table 1 compares the SNR and RMSE of the wavelet basis functions of five different symmlets clusters. As shown in Table 1, the SNR of the wavelet basis function sym2 is the highest and the RMSE is the lowest with the condition of the hardening threshold. It can be considered that this wavelet basis function is suitable for eliminating the multipath error in GNSS signal.
Figure 12 shows the comparison between the GNSS signal denoised by sym2 wavelet basis function and the results of manual measurement by precise leveling. It can be seen that after the SWT noise reduction, the difference sequence of multipath model extracted from GNSS settlement accumulation curve is basically on the zero level, which indicates that such a method can play a more effective role in extracting the systematic (repetitive) section of multipath errors.

5.4. Random Noise Reduction by EMD Decomposition

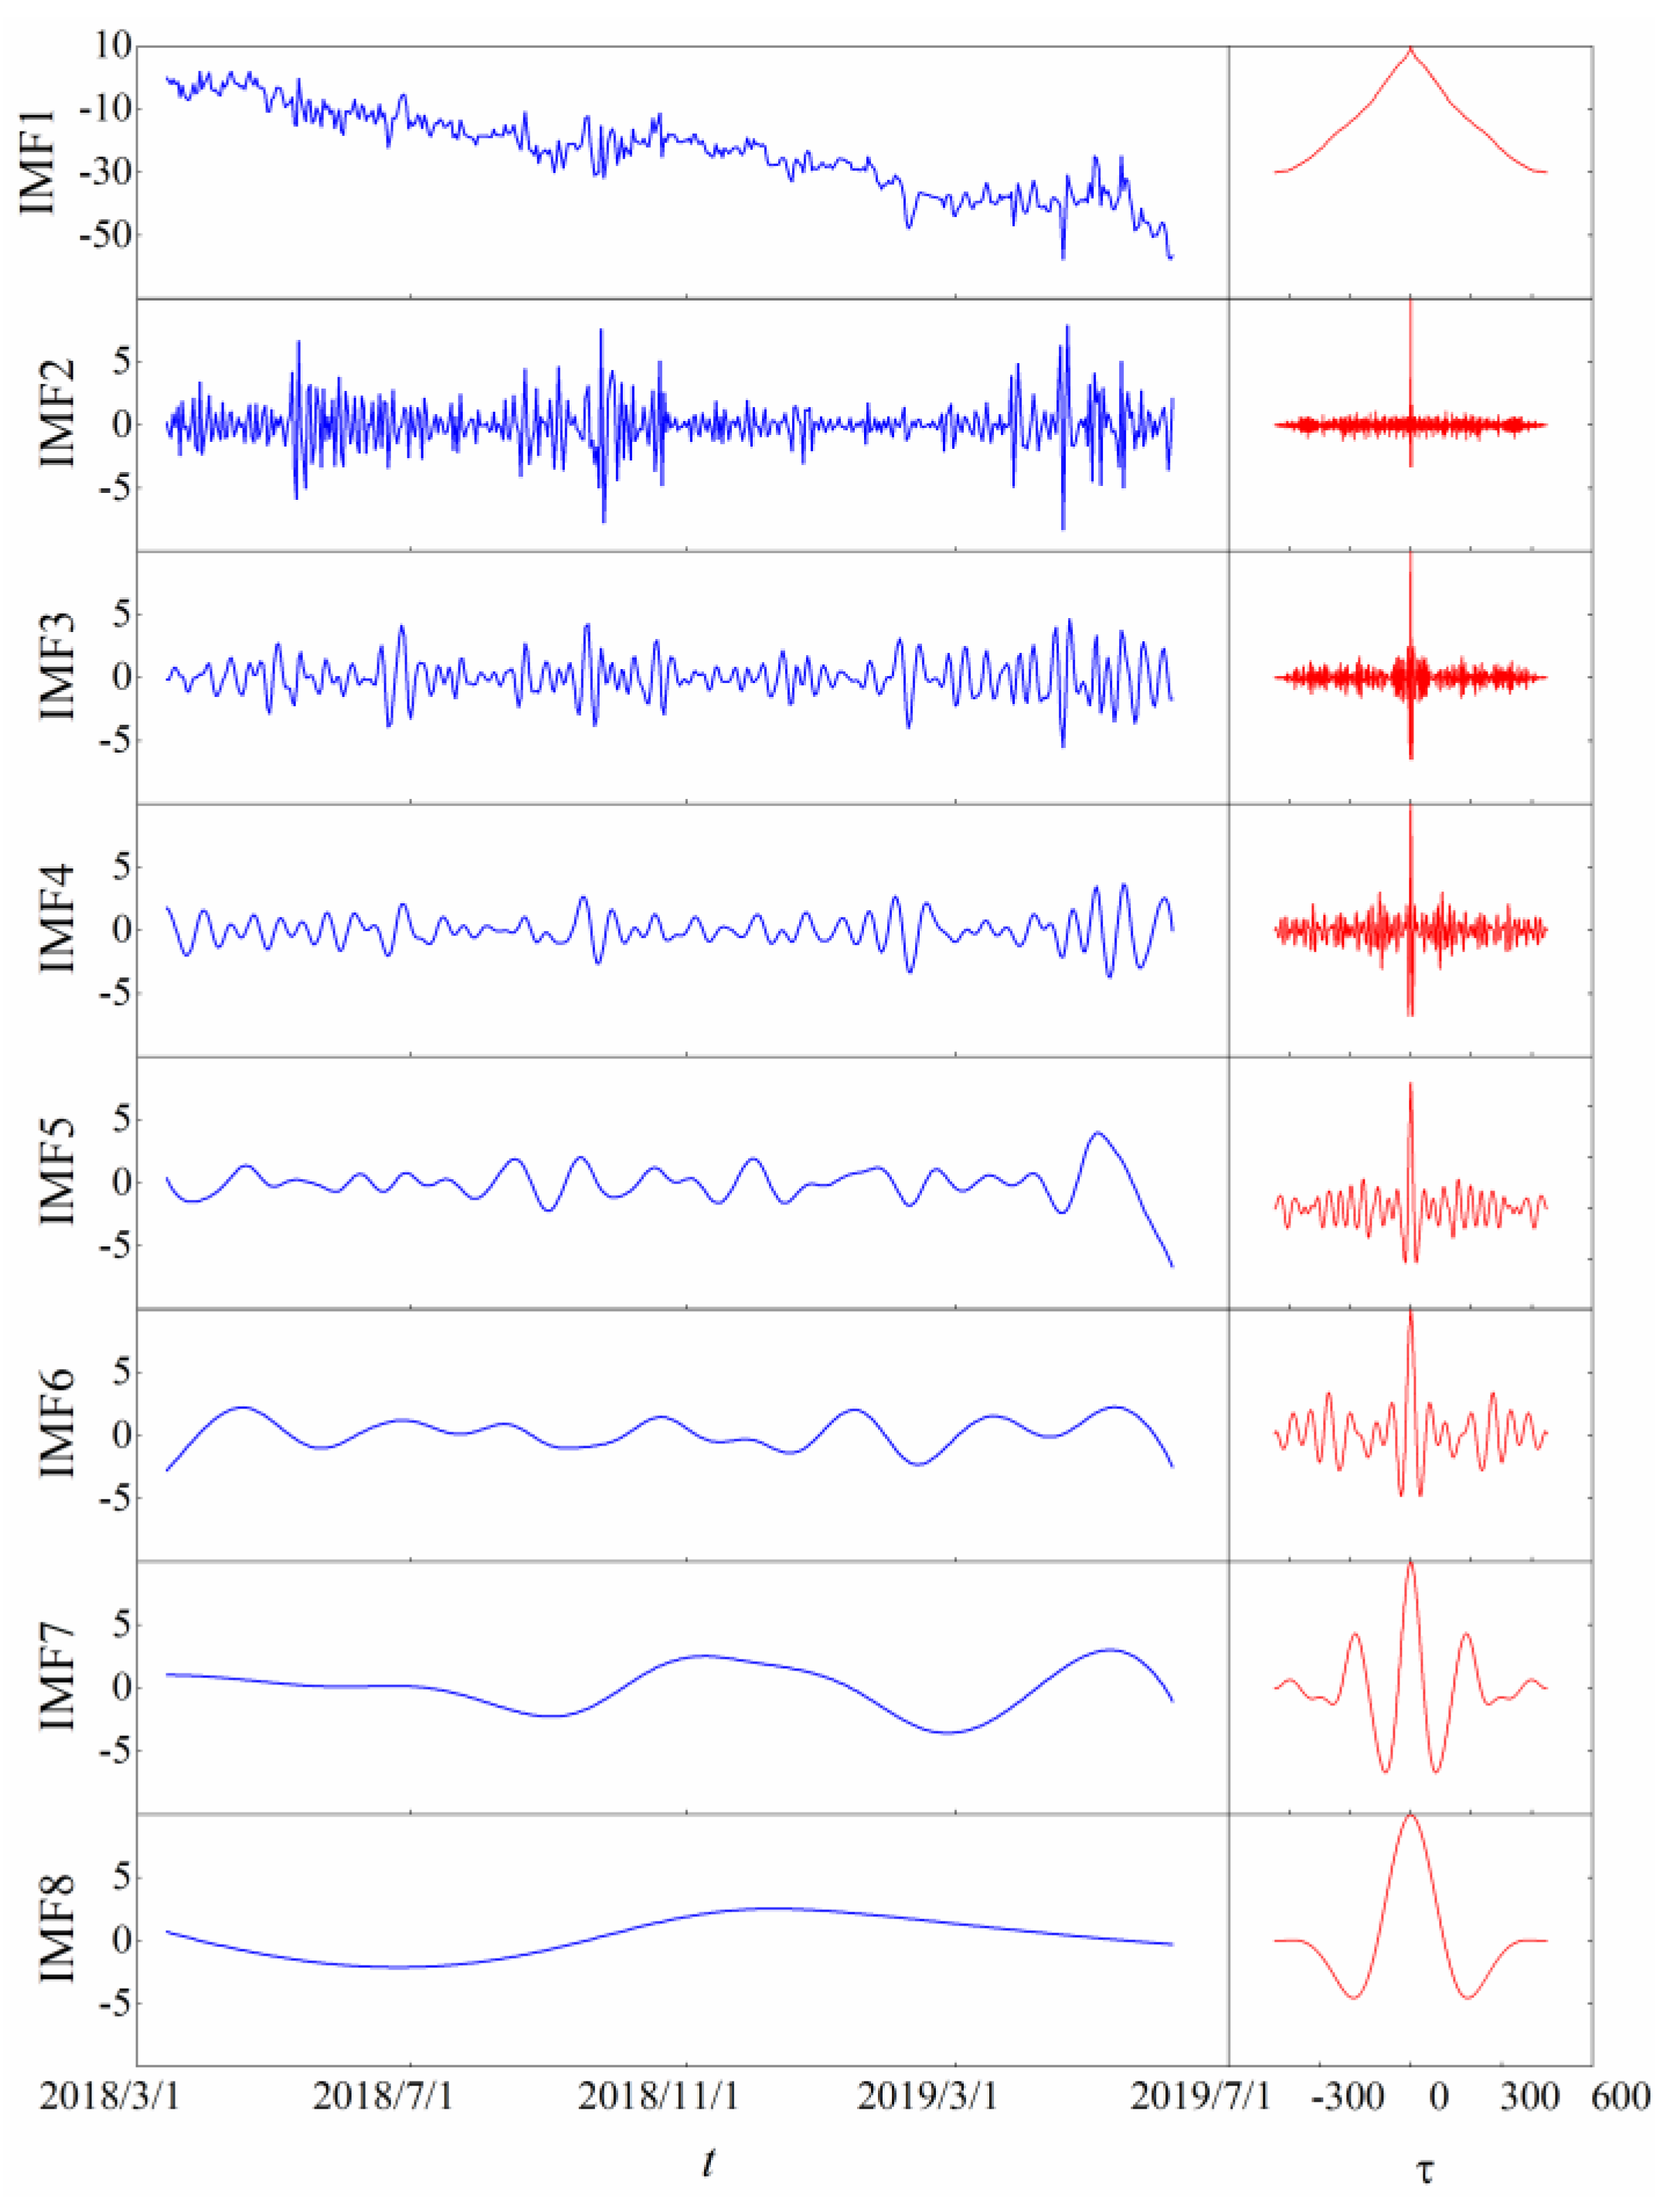
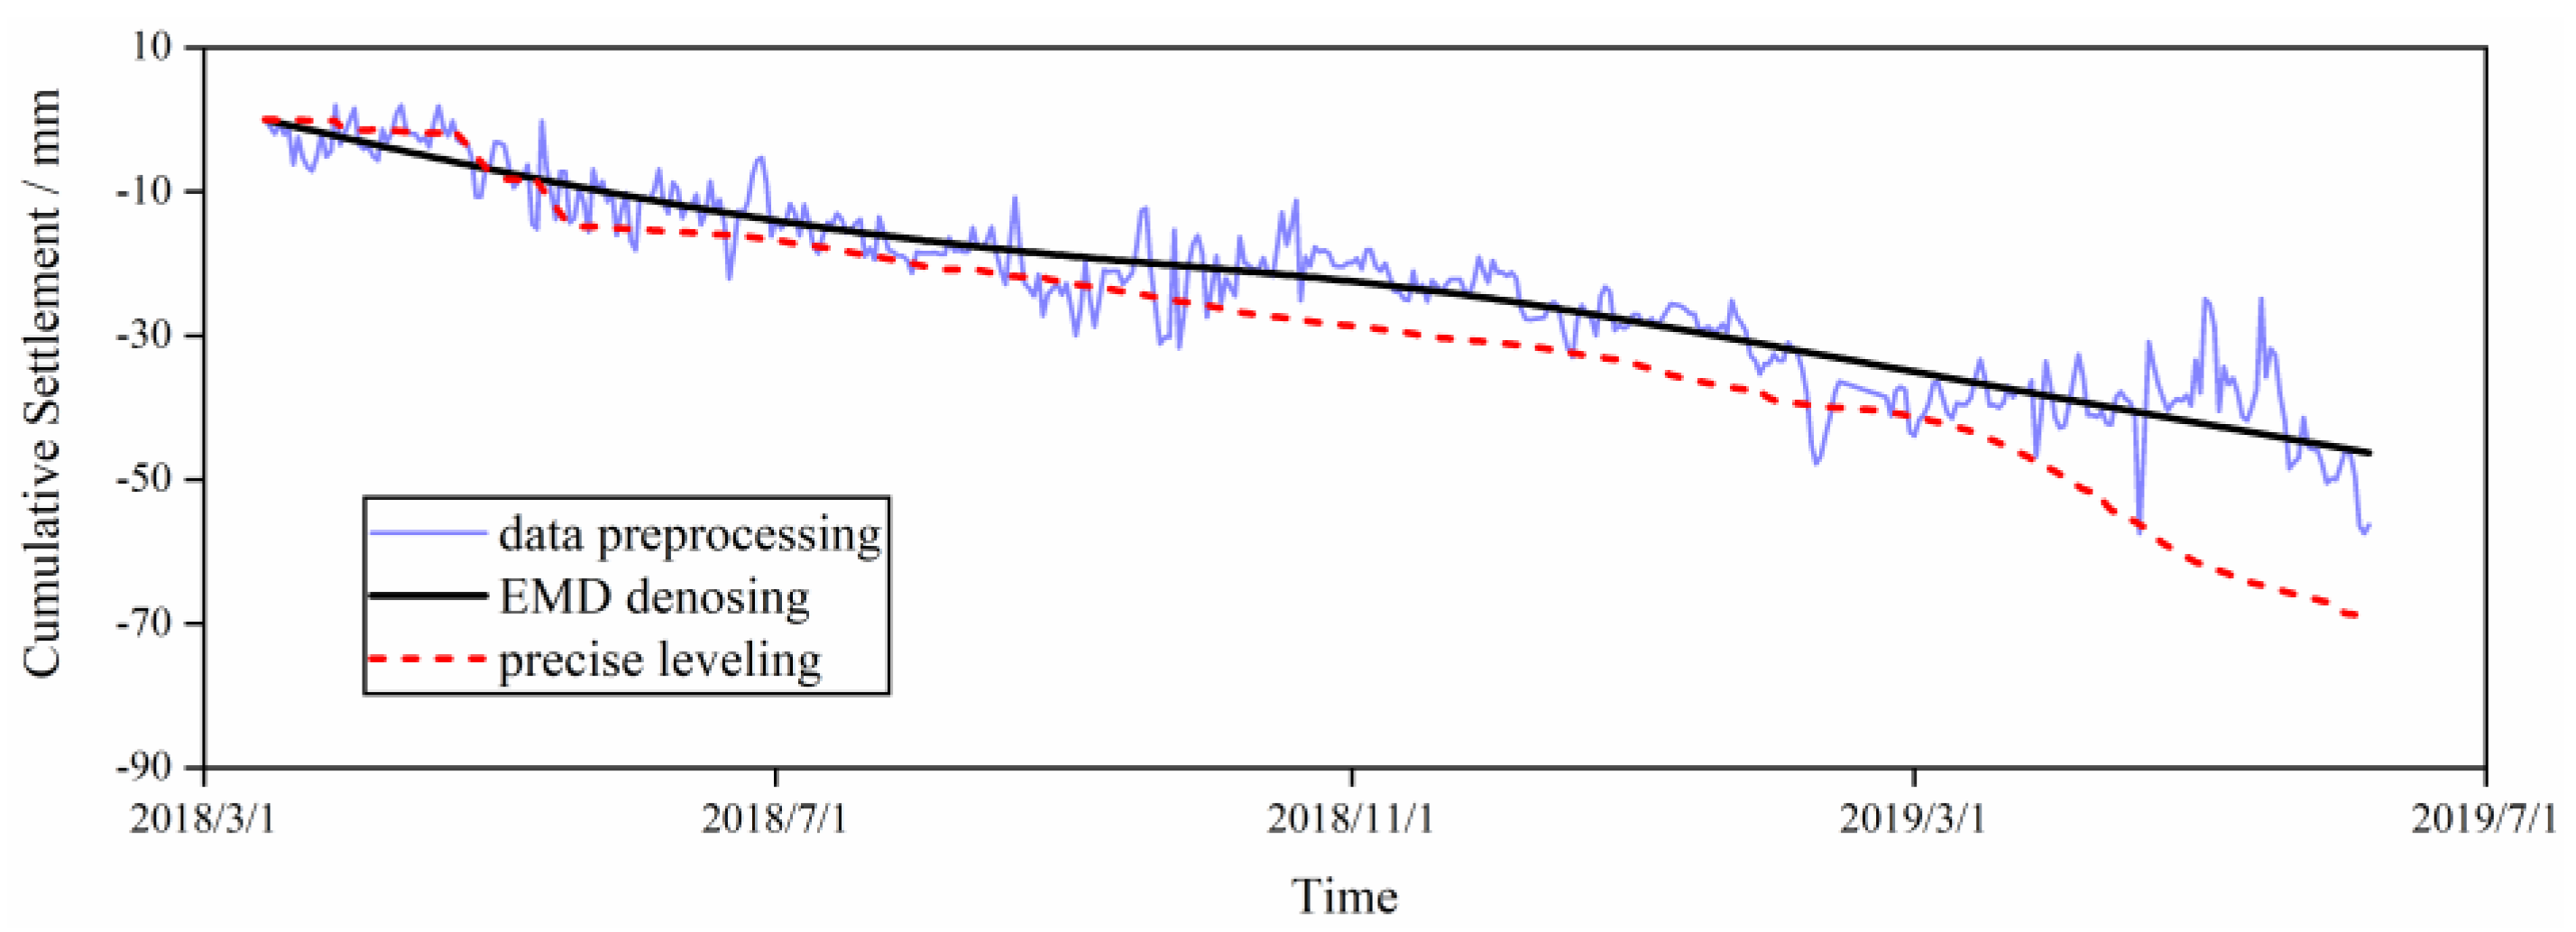
The GNSS signal after the multipath error eliminated through wavelet de-nosing is decomposed by EMD, and the autocorrelation function is calculated. Generally speaking, that the signal power is concentrated in low-frequency ranges, and the noise is concentrated in high-frequency ranges. Figure 13 shows the intrinsic mode functions and its autocorrelation functions obtained through EMD decomposition. As shown in the autocorrelation functions, the intrinsic mode functions from the first order to the seventh order are all dominant noise, which can be regarded as the noise signal, while the eighth order is the measured signal, which is required to be maintained. Figure 14 shows the GNSS signal denoised by SWT and EMD. Compared with the GNSS signal treated only by wavelet de-nosing, the EMD method greatly reduces the noise power of the GNSS signal and has the same trend with the elevation of the measuring point obtained by precise leveling.

5.5. GNSS Signal Correction

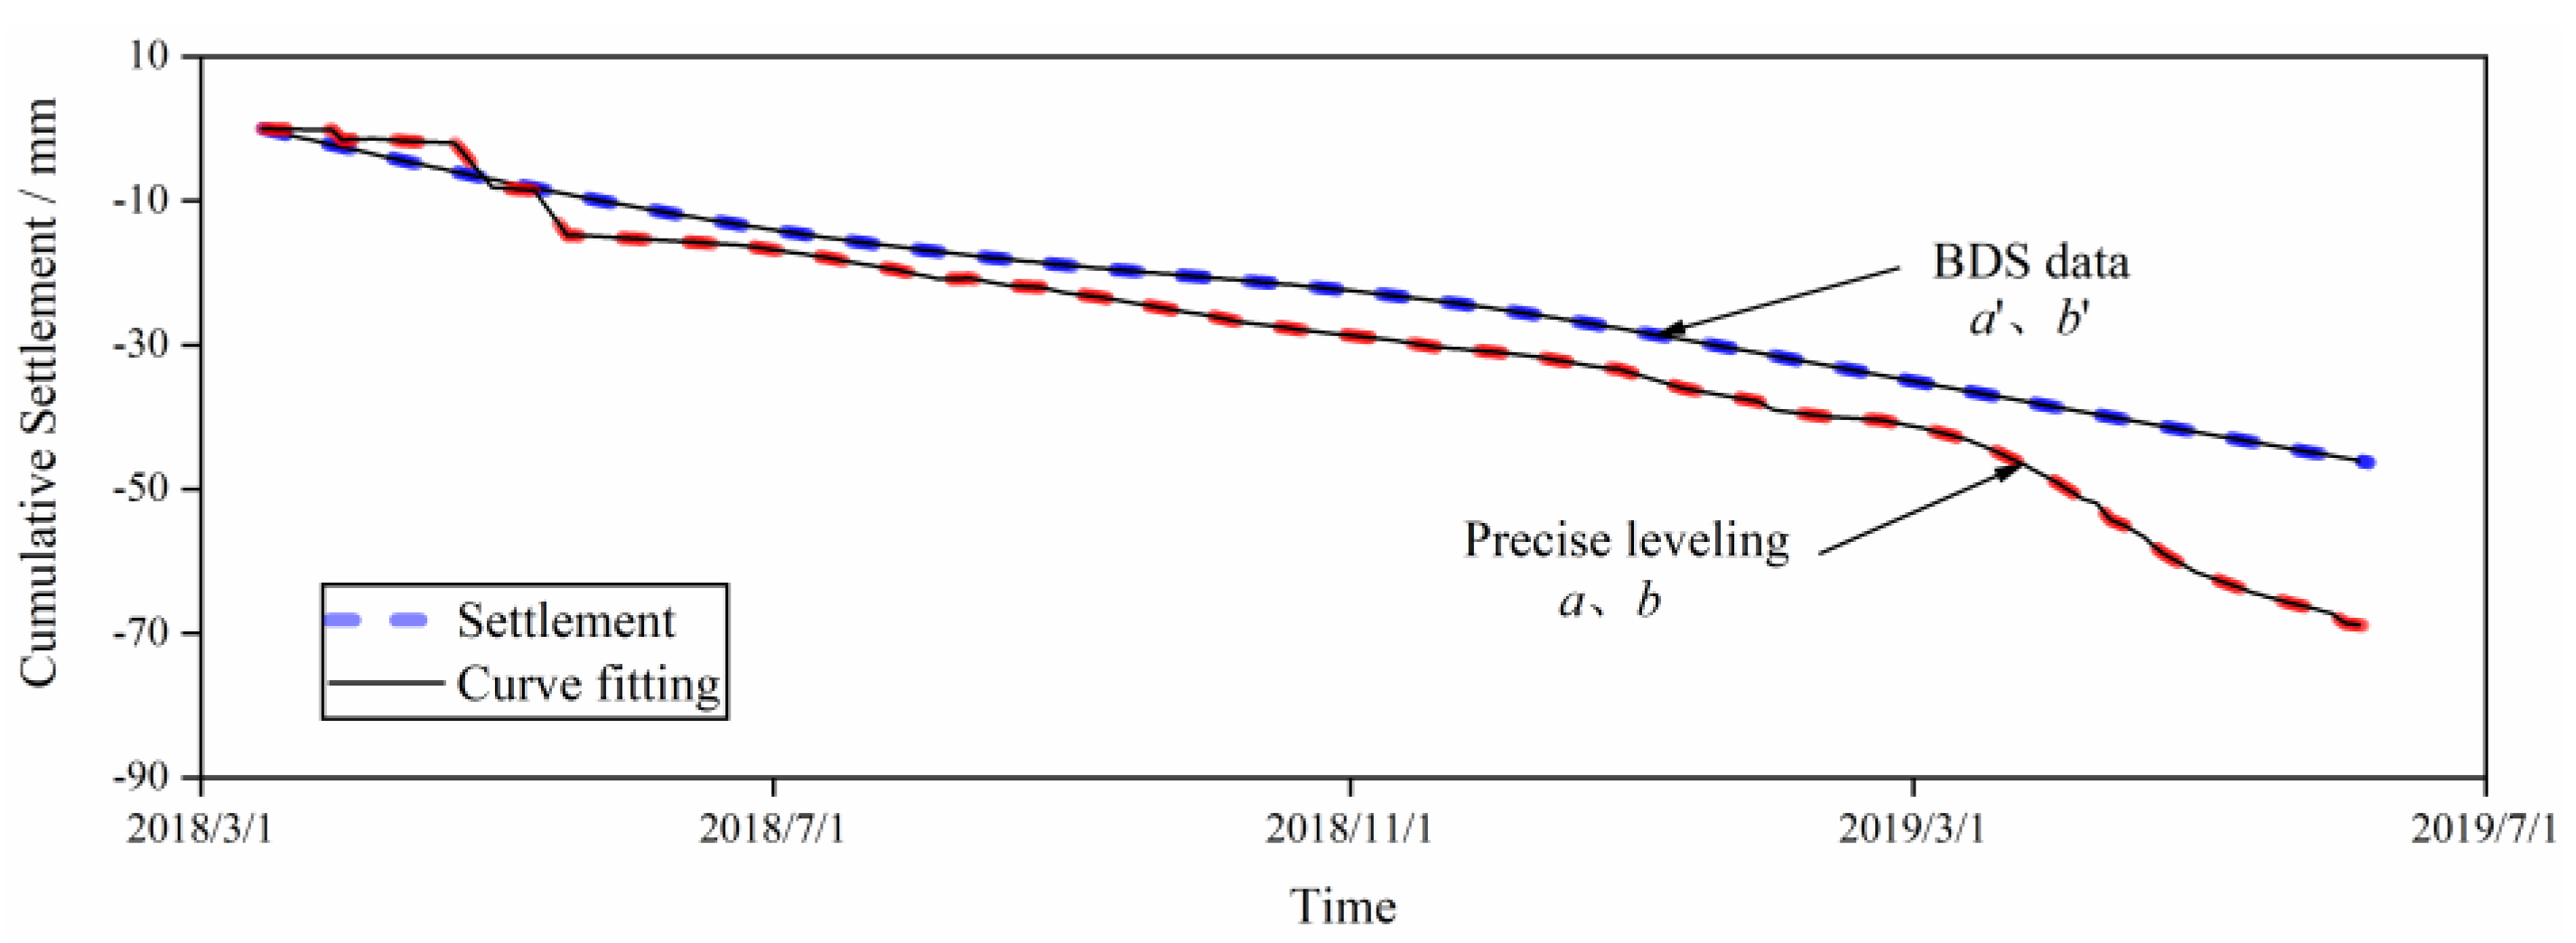
GNSS signal denoised by EMD can meet the requirements of general engineering projects, while in terms of controlling projects such as the long-span bridge, the denoised data are treated with error correction to meet the requirements associated with real-time observation and final prediction of foundation settlement. In this paper, the hyperbolic model is applied to fitting the parameters of GNSS signal and the settlement data obtained by precise leveling, respectively. The fitting parameters of the two groups of data are obtained, which are expressed as a, b and a’, b’, respectively. The fitting figure is shown in Figure 15.
The objective of the present work is to develop ANN models which are accurate and robust for the prediction and interpolation of foundation settlement of bridge tower. They are composed of several layers of many interconnected neurons operating in parallel. Since ANN have many inputs (external stimuli) and outputs (responses) and allow nonlinearity in the transfer functions of the neurons, they can be used to solve multivariate and nonlinear modeling problems. Of course, ANNs are gross simplifications of the human brain function. In any case, they can be viewed as elaborate, nonlinear systems which, given an external input, will estimate the corresponding output, even if the inputs are noisy or incomplete.
In order to correct the foundation settlement of bridge tower, two three-layer backpropagation neural network structures were chosen since three-layer fully connected ANNs are capable of forming an arbitrarily close approximation to any continuous nonlinear mapping. By using a trial-and-error approach which starts with a small number of hidden neurons and then increasing the size until the training performance is acceptable, three-layer network structures with varying numbers of hidden neurons and different training parameters have been investigated.
Currently, there are no standard rules for choosing the proper neural network structure. There are, however, some guidelines to place an upper bound on the network size such as (i) using no more than three layers (excluding input layer) for the fully connected multilayer networks, and (ii) using fewer hidden layer neurons than training data. Specific structures are problem dependent and are fixed by trial-and-error, especially when given little or no prior knowledge of the problem.
In order to obtain parameters a and b, two three-layer backpropagation neural network structures were chosen since three-layer fully connected ANNs are capable of forming an arbitrarily close approximation to any continuous nonlinear mapping. And the Levenberg–Marquardt backpropagation training algorithm, a standard numerical optimization technique which approaches second-order training speed without having to compute the Hessian matrix, was applied in this work because of its fast convergence in training. For overcoming the “overfitting” (or overtraining) problem and improving the generalization, the early stopping technique (i.e., cross-validation) was used during training. The transfer functions, training parameters, and training performance of the developed ANN models are summarized in Table 2, and the corresponding training processes for obtaining the parameters a and b. In this study, the 63 precis leveling datasets obtained at Measurement Points were divided into two groups, one containing 33 datasets, and the other 30, for neural network parameter training and training result evaluation. The study applied three different types of hidden node numbers and transfer functions, with the times, rate, and accuracy of the training set to be 200, 0.01, and 0.0001 respectively. Table 2 shows the computational accuracy of the rectification of GNSS signal for the BP neural network of the three types of hidden node numbers and transfer functions. The error analysis shows that calculation results varied slightly depending on different network nodes and transfer functions. Logsig function was taken as the transfer function in the paper, and the 4-8-1 node grid was adopted. MAE and MAPE in the table are written as
MAE = 1 N i = 1 N x i x i ;           MAPE = 1 N i = 1 N x i x i x i .
Based on the two groups of parameters a and b obtained through the fitting of settlement curve, the nonlinear mapping relationship between the two groups of data is established by the learning and verification process through the method of BP neural network, and the settlement data obtained through the GNSS signal measured in real time are corrected.
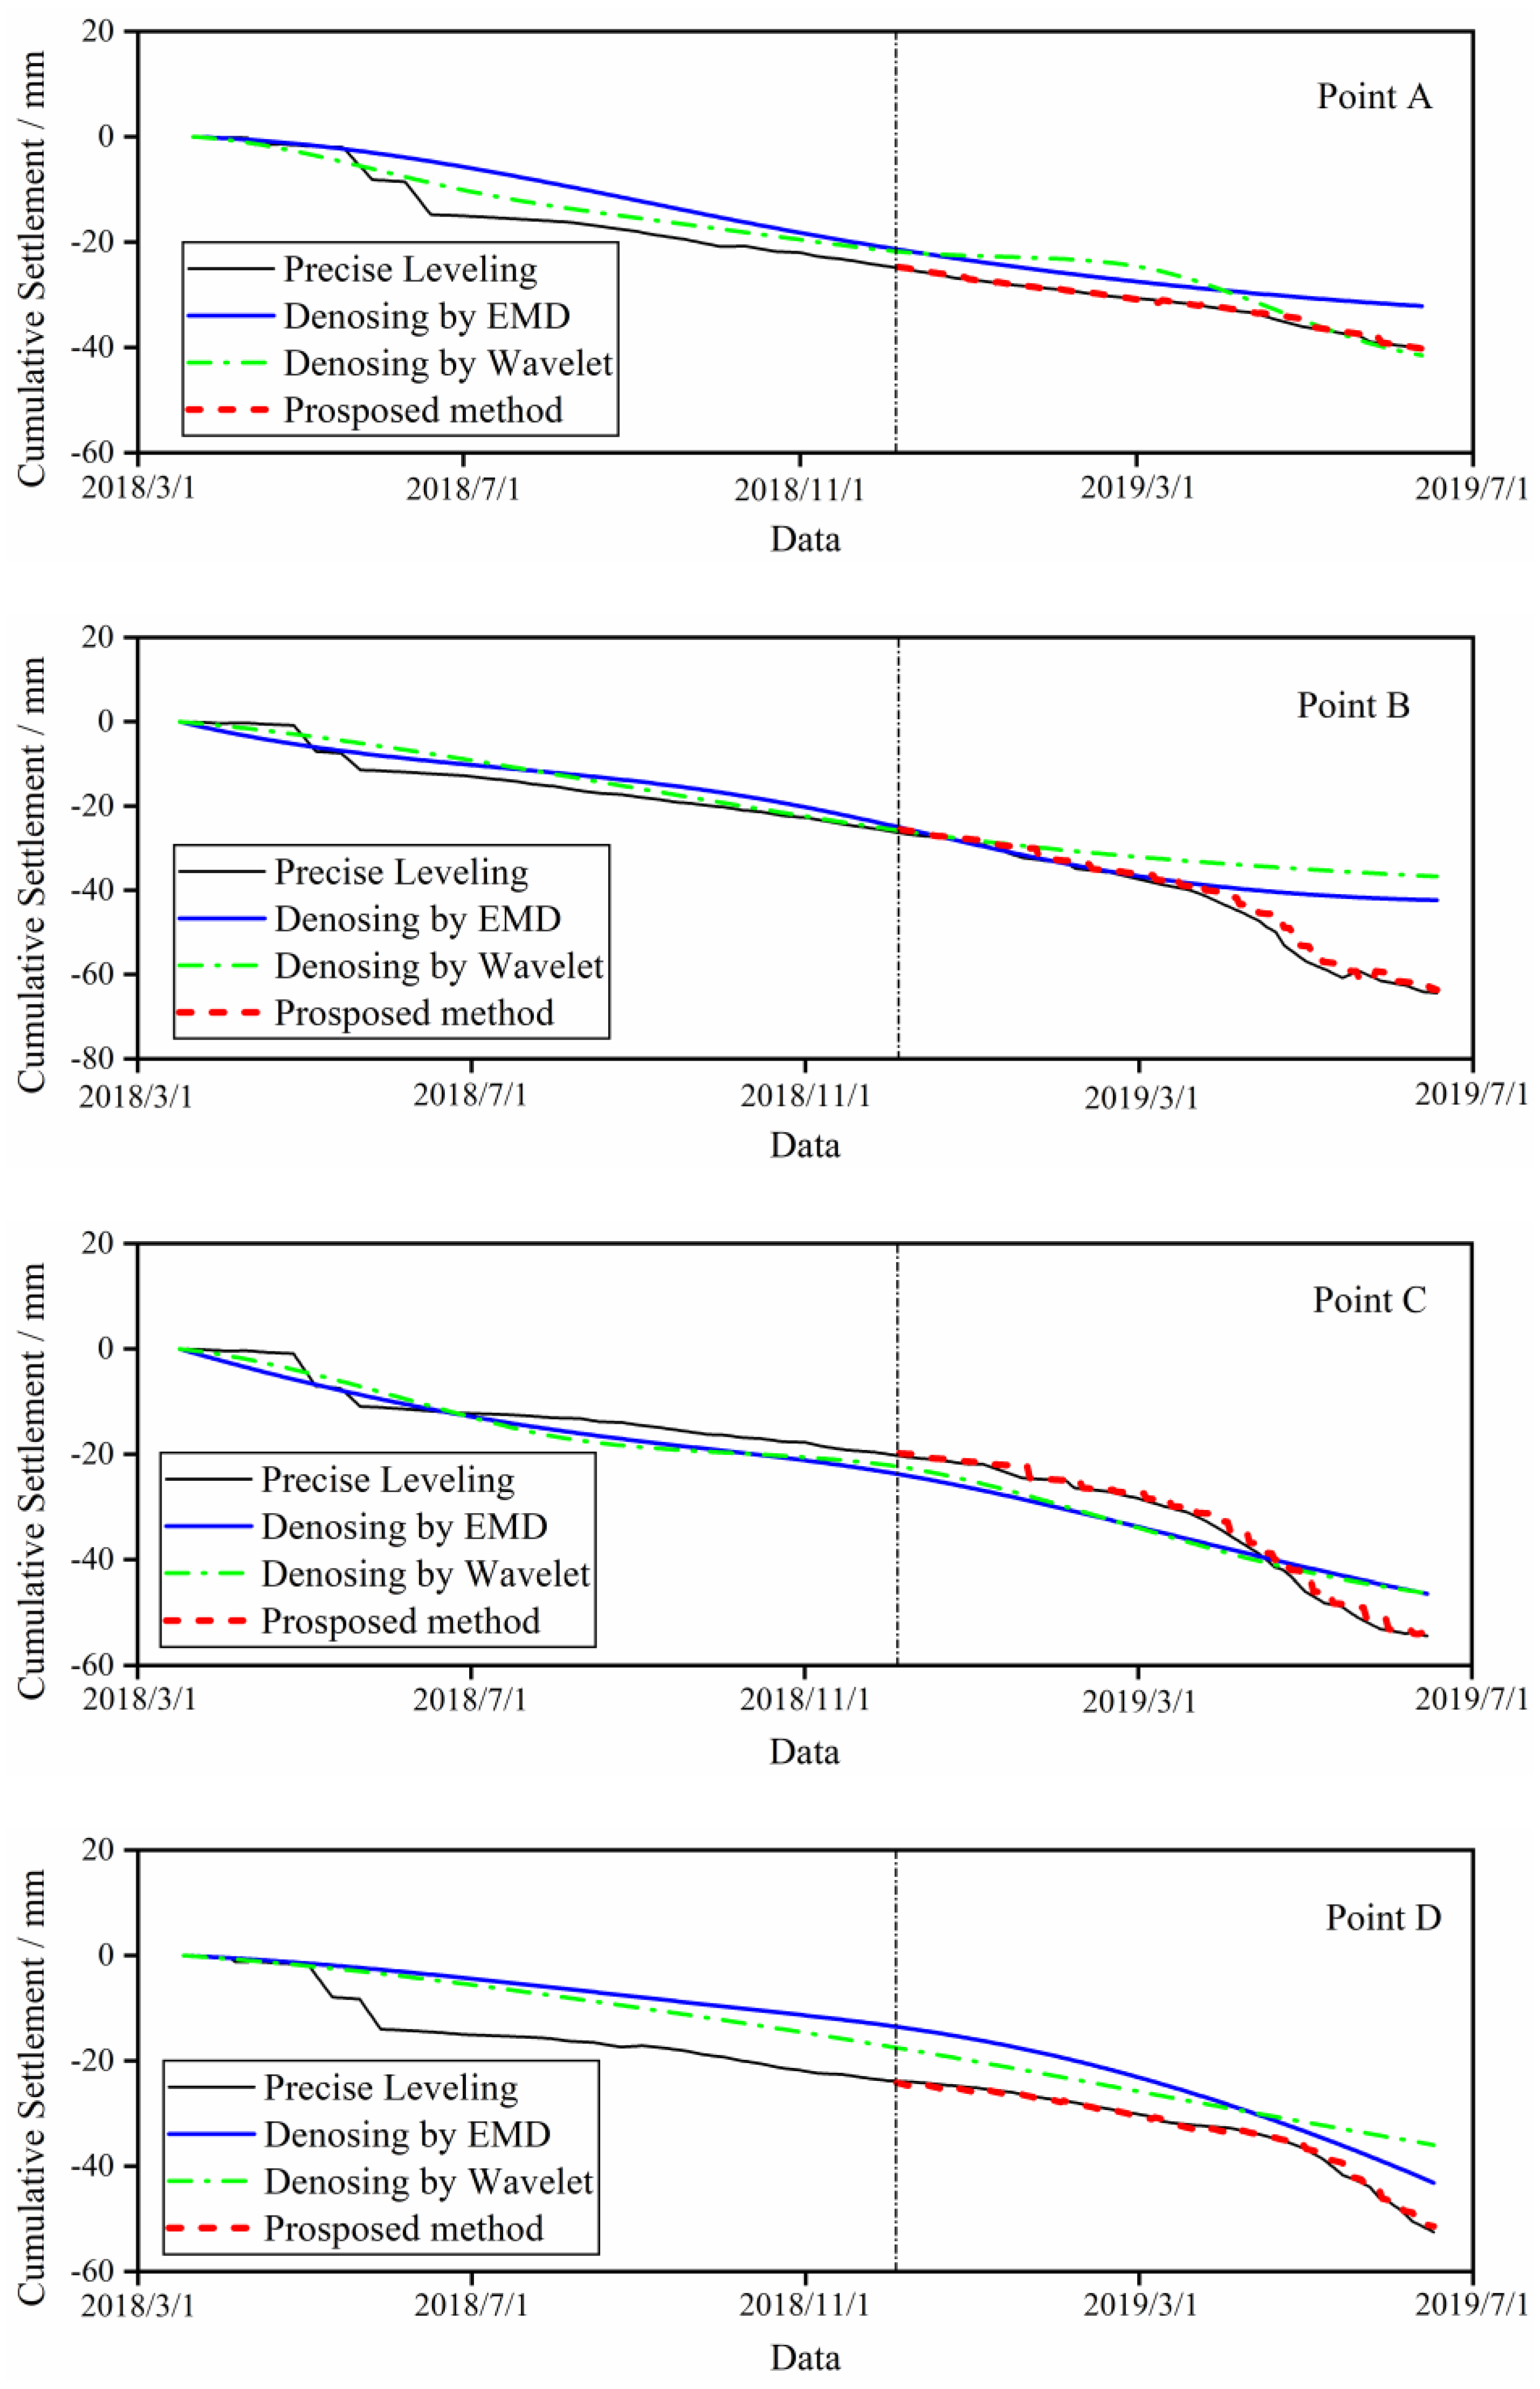
Figure 16 and Table 3 present the comparison of the real-time data of foundation settlement at the four observation stations of the bearing platform by the proposed algorithm, empirical mode decomposition, and wavelet decomposition. As shown in the figure, the black solid line indicates the results of precision leveling; the dotted green line shows the results processed with empirical mode decomposition and the solid blue line for the results of wavelet decomposition. The dotted red line represents the real-time subsidence data at the points processed by the proposed method: the multipath errors and random noise of the data were erased by stationary wavelet transform and empirical mode decomposition, and the data were rectified. It should be noted that, the signal-to-noise ratios and mean-square errors in the table represent the result errors between the three methods and precise leveling. According to data, the errors between the GNSS signals corrected by the proposed method with the precise leveling were all less than 1 mm, which proves that the proposed method in the paper can better rectify GNSS signal errors, and hence have higher accuracy.

6. Conclusions

For the purposes of realizing the real-time monitoring of the foundation displacement of long-span bridges, the GNSS satellite observation stations are established on the foundation platform to obtain the data of foundation displacement. And then the multipath error and random noise of satellite signals with GNSS technology are denoised by SWT and EMD methods. In view of the deviation between the denoised GNSS signals and the precise leveling data, the combination of BP neural network-based algorithm and the construction process data is developed in this paper to establish the non-linear mapping relationship between the GNSS data and the precise leveling data. The case study shows that the proposed method in this paper can meet the requirements of real-time monitoring of foundation displacement of long-span bridges, and the conclusions are shown as follows:
  • It can achieve desirable effect for using the stationary wavelet denoising to eliminate the multipath error in GNSS signals;
  • Autocorrelation function-based EMD denoising algorithm can effectively process GNSS signals with random noise;
  • Based on measured data in construction process, the nonlinear mapping between the precise leveling data and GNSS signals can be established by the BP neural network;
  • The position and reliability of GNSS measurements can be improved by using the proposed method in this study. The GNSS signal processing method presented in this paper makes the submillimeter monitoring of foundation settlement of long-span bridges come true.

Author Contributions

Conceptualization, Y.Z.; methodology, Y.Z.; formal analysis, M.S.; investigation, D.S.; data curation, D.S.; writing—original draft preparation, Y.Z. and M.S.; writing—review and editing, Y.Z. and M.S.; funding acquisition, H.G. All authors have read and agreed to the published version of the manuscript.

Funding

The authors are grateful for the financial support received from the National Key Research and Development Plan (No. 2022YFB2602900), National Railway Group Science and Technology Research and Development Plan (No. SY2021G002), China Academy of Railway Sciences Group Major Project (No. 2021YJ084) and China Railway Shanghai Bureau Group Co., Ltd. Scientific Research and Development Project (2021142).

Institutional Review Board Statement

Not applicable.

Informed Consent Statement

Not applicable.

Data Availability Statement

Data are available upon reasonable request at the Corresponding Authors.

Conflicts of Interest

The authors declare no conflict of interest.

References

  1. Brownjohn, J.M.W.; Koo, K.-Y.; Scullion, A.; List, D. Operational deformations in long-span bridges. Struct. Infrastruct. Eng. 2015, 11, 556–574. [Google Scholar] [CrossRef] [Green Version]
  2. Quesada-Olmo, N.; Jimenez-Martinez, M.J.; Farjas-Abadia, M. Real-time high-rise building monitoring system using global navigation satellite system technology. Measurement 2018, 123, 115–124. [Google Scholar] [CrossRef]
  3. Xi, R.; Jiang, W.; Meng, X.; Chen, H.; Chen, Q. Bridge monitoring using BDS-RTK and GPS-RTK techniques. Measurement 2018, 120, 128–139. [Google Scholar] [CrossRef]
  4. Yi, T.; Li, H.; Gu, M. Recent research and applications of GPS based technology for bridge health monitoring. Sci. China Technol. Sci. 2010, 53, 2597–2610. [Google Scholar] [CrossRef]
  5. Chen, D.; Ye, S.; Zhou, W.; Liu, Y.; Jiang, P.; Tang, W.; Yuan, B.; Zhao, L. A double-differenced cycle slip detection and repair method for GNSS CORS network. GPS Solut. 2016, 20, 439–450. [Google Scholar] [CrossRef]
  6. Mosavi, M.R. Comparing DGPS corrections prediction using neural network, fuzzy neural network, and Kalman filter. GPS Solut. 2006, 10, 97–107. [Google Scholar] [CrossRef]
  7. Azarbad, M.R.; Mosavi, M.R. A new method to mitigate multipath error in single-frequency GPS receiver with wavelet transform. GPS Solut. 2014, 18, 189–198. [Google Scholar] [CrossRef]
  8. Chan, W.S.; Xu, Y.L.; Ding, X.L.; Dai, W.J. An integrated GPS–accelerometer data processing technique for structural deformation monitoring. J. Geod. 2006, 80, 705–719. [Google Scholar] [CrossRef]
  9. Xu, Y.; Brownjohn, J.M.W.; Hester, D.; Koo, K.Y. Long-span bridges: Enhanced data fusion of GPS displacement and deck accelerations. Eng. Structures. 2017, 147, 639–651. [Google Scholar] [CrossRef] [Green Version]
  10. Stiros, S.C. Errors in velocities and displacements deduced from accelerographs: An approach based on the theory of error propagation. Soil Dyn. Earthq. Eng. 2008, 28, 415–420. [Google Scholar] [CrossRef]
  11. Erickson, J.W.; Maybeck, P.S.; Raquet, J.F. Multipath-adaptive GPS/INS receiver. IEEE Trans. Aerosp. Electron. Syst. 2005, 41, 645–657. [Google Scholar] [CrossRef]
  12. Kaplan, E.D.; Hegarty, C. Understanding GPS: Principles and Applications; Artech House: Norwood, MA, USA, 2005. [Google Scholar]
  13. Pugliano, G.; Robustelli, U.; Rossi, F.; Santamaria, R. A new method for specular and diffuse pseudorange multipath error extraction using wavelet analysis. GPS Solut. 2016, 20, 499–508. [Google Scholar] [CrossRef]
  14. Huang, N.E.; Shen, Z.; Long, S.R.; Wu, M.C.; Shih, H.H.; Zheng, Q.; Yen, N.-C.; Tung, C.C.; Liu, H.H. The empirical mode decomposition and the Hilbert spectrum for nonlinear and non-stationary time series analysis. Proc. R. Soc. London. Ser. A Math. Phys. Eng. Sci. 1998, 454, 903–995. [Google Scholar] [CrossRef]
  15. Wu, Z.; Huang, N.E. Ensemble empirical mode decomposition: A noise-assisted data analysis method. Adv. Adapt. Data Anal. 2009, 1, 1–41. [Google Scholar] [CrossRef]
  16. Boudraa, A.O.; Cexus, J.C. EMD-Based Signal Filtering. IEEE Trans. Instrum. Meas. 2007, 56, 2196–2202. [Google Scholar] [CrossRef]
  17. Peng, Z.K.; Tse, P.W.; Chu, F.L. A comparison study of improved Hilbert–Huang transform and wavelet transform: Application to fault diagnosis for rolling bearing. Mech. Syst. Signal Process. 2005, 19, 974–988. [Google Scholar] [CrossRef]
  18. Ayenu-Prah, A.; Attoh-Okine, N. A Criterion for Selecting Relevant Intrinsic Mode Functions in Empirical Mode Decomposition. Adv. Adapt. Data Anal. 2010, 2, 1–24. [Google Scholar] [CrossRef]
  19. Asaoka, A. Observational procedure of settlement prediction. Soils Found. 1978, 18, 87–101. [Google Scholar] [CrossRef] [PubMed] [Green Version]
  20. Tan, S. Hyperbolic method for settlements in clays with vertical drains. Can. Geotech. J. 1994, 31, 125–131. [Google Scholar] [CrossRef]
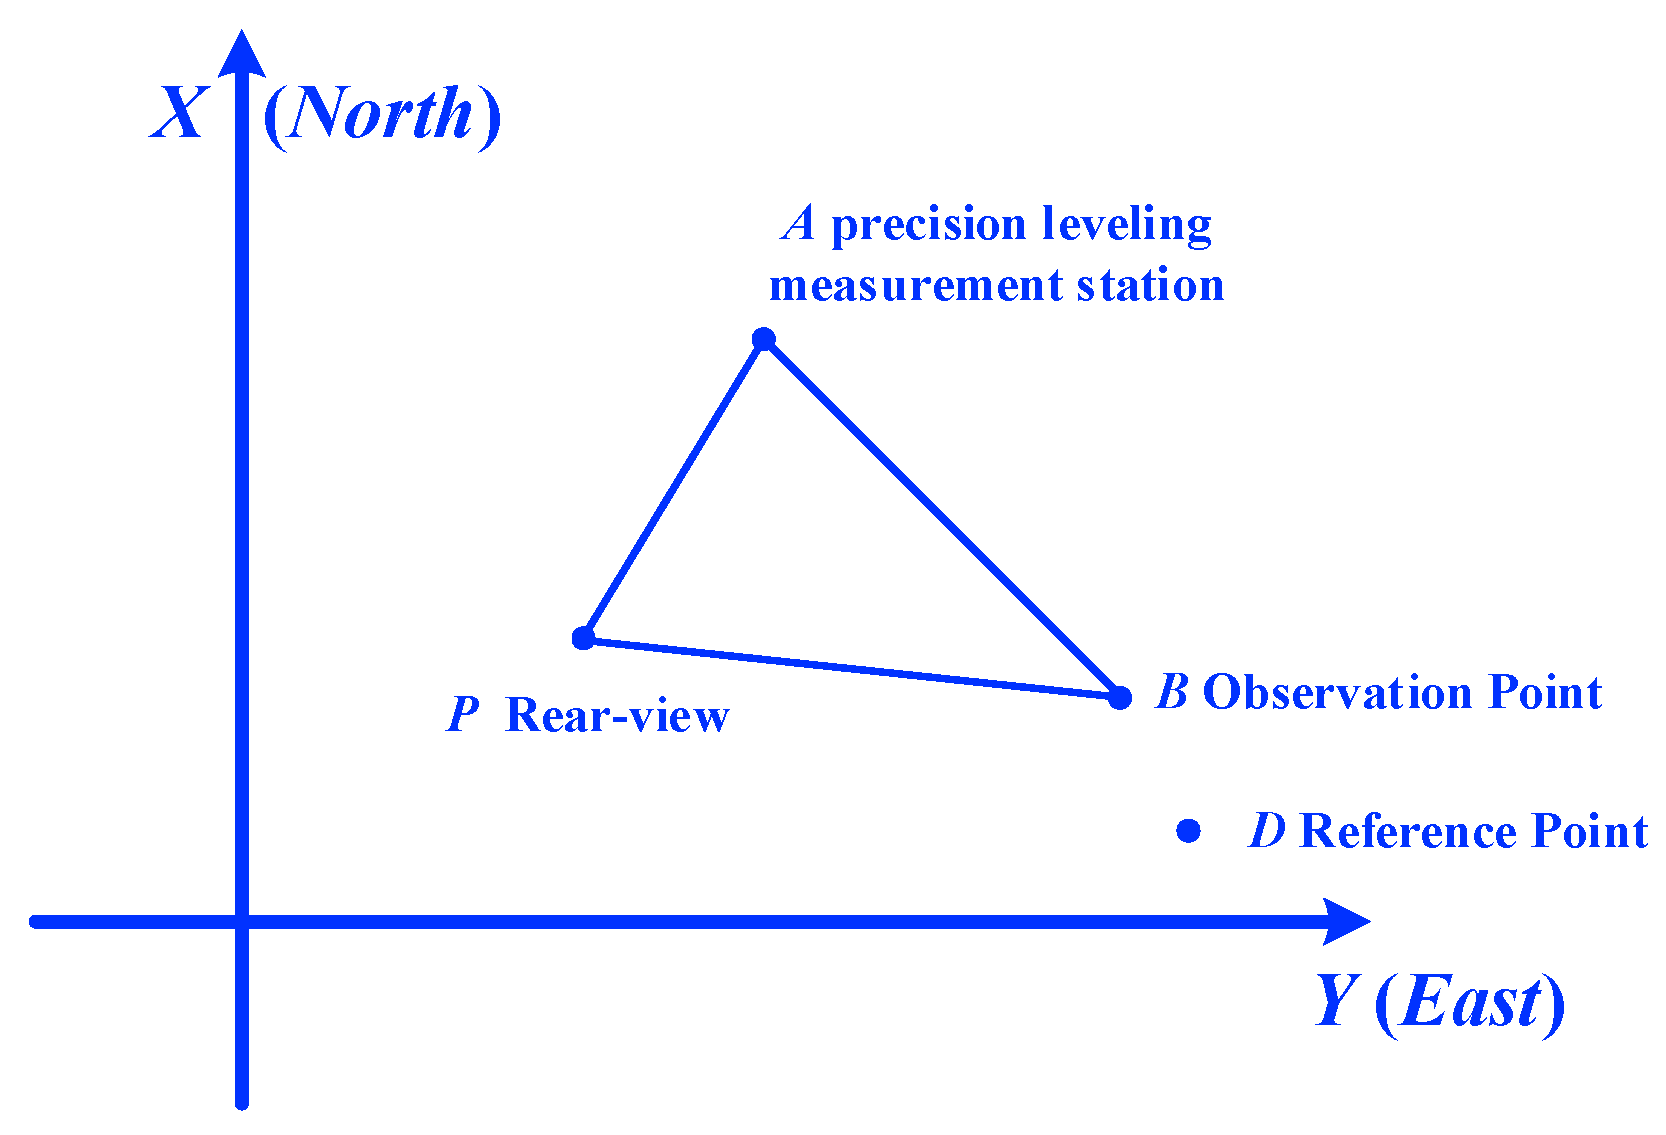
Figure 1. Layout of measuring points.
Applsci 13 02868 g001
Figure 2. The control point and measured point of GPS.
Applsci 13 02868 g002
Figure 3. Comparison of the accuracy of precise leveling data and GNSS: (a) horizontal, (b) elevation.
Applsci 13 02868 g003
Figure 4. Stability test of GNSS: (a) horizontal stability, (b) vertical stability.
Applsci 13 02868 g004
Figure 5. Correction and prediction of GNSS data.
Applsci 13 02868 g005
Figure 6. The flow chart of the proposed method.
Applsci 13 02868 g006
Figure 7. The general bridge and monitoring system.
Applsci 13 02868 g007
Figure 8. The observation and reference station: (a) observation station, (b) reference station.
Applsci 13 02868 g008
Figure 9. The number of available satellites.
Applsci 13 02868 g009
Figure 10. The sky plot of the visible satellites.
Applsci 13 02868 g010
Figure 11. GNSS data: (a) original data, (b) pre-processing data.
Applsci 13 02868 g011aApplsci 13 02868 g011b
Figure 12. Elimination of the errors from GNSS multipath by stationary wavelet transform.
Applsci 13 02868 g012
Figure 13. EMD decomposition of GNSS signal.
Applsci 13 02868 g013
Figure 14. Denoising GNSS signal.
Applsci 13 02868 g014
Figure 15. Curve fitting of foundation settlement.
Applsci 13 02868 g015
Figure 16. Foundation settlements of different points by the proposed method.
Applsci 13 02868 g016
Table 1. The SNR and RMSE of different wavelet basic functions.
SNRRMSE
sym113.15.4
sym216.93.5
sym314.74.5
sym515.54.1
sym814.44.5
Table 2. Error indexes of the proposed method forecasting results.
Neural NetworksTransfer FunctionMAE (mm)MAPERMSE (mm)
4-7-1Tangent Sigmoid0.570.0150.68
4-7-1Logarithmic Sigmoid0.510.0150.66
4-7-1Line0.640.0170.73
4-8-1Tangent Sigmoid0.670.0180.77
4-8-1Logarithmic Sigmoid0.470.0120.43
4-8-1Line0.640.0170.74
4-9-1Tangent Sigmoid0.670.0180.77
4-9-1Logarithmic Sigmoid0.500.0130.61
4-9-1Line0.600.0160.70
Table 3. Comparison of the proposed method with traditional methods.
SNR (dB)RMSE (mm)
EMDDWTProposed MethodEMDDWTProposed Method
Point A9.817.737.54.94.20.4
Point B13.010.327.89.112.40.7
Point C16.717.436.84.74.30.4
Point D11.913.235.88.06.90.5
Disclaimer/Publisher’s Note: The statements, opinions and data contained in all publications are solely those of the individual author(s) and contributor(s) and not of MDPI and/or the editor(s). MDPI and/or the editor(s) disclaim responsibility for any injury to people or property resulting from any ideas, methods, instructions or products referred to in the content.