Abstract
Digital twin is an important emerging technology for digital transformation and intelligent upgrading. Digital twin models are the prerequisite for digital twin applications, and their quality directly affects the quality of digital twin services in monitoring, simulation, prediction, optimization, and other areas. However, researchers have paid insufficient attention to the quality control of digital twin models, thus hindering their effective application. To effectively control model construction and optimize model quality in the design process, this study developed digital twin model quality optimization and control methods based on workflow management. First, a workflow process model integrating digital twin model evaluation was constructed, which integrated the design process and model evaluation methods into workflow management. Then, digital twin model quality control and optimization in different stages were achieved at the macro and micro levels. Thus, the digital twin model quality was effectively controlled during the design process, and targeted design resources were selected to optimize model quality. Finally, the validity of the proposed method of model quality optimization and control was verified using the digital twin models of a practical teaching platform and a multifunctional lift-and-slide experimental line. All evaluation indexes of the model achieved good values, and the target quality optimization of the model could be performed during the design process. The results indicate that the proposed method can effectively control and optimize the model quality, which has excellent feasibility and enables the effective application of the digital twin.
1. Introduction
Believed to be an effective means of fusing the physical and virtual spaces, digital twins can support scheduling optimization, accurate control, and reliable prediction, and the relevant studies have evolved from theoretical research to practical implementation [1,2,3]. Models are an important part of digital twins, and model quality assurance is a prerequisite for the successful application of digital twins [4,5,6]. The lack of digital twin model quality control could easily lead to problems such as the lack of digital twin services, non-transparent digital twin model quality, and easy failure in migration and reuse, which seriously hinders the extensive promotion and application of digital twins. Therefore, digital twin model quality optimization and control are highly necessary.
Since the quality of digital twin models is important to their practical applications, researchers have studied digital twin model quality evaluation and optimization. In terms of model quality evaluation, Liu et al. [7] constructed an adaptive evaluation network to analyze, evaluate, and optimize the reliability of the digital twin for a machining system. Zhang et al. [8] proposed a cross-granularity, cross-stage, and cross-disciplinary model lifecycle evaluation method for different phases of digital twin models (e.g., model maintenance and reuse). Tao et al. [9] proposed a set of guidelines and theories for the construction of digital twin models to guide the standardized construction of digital twin models. C. Zhang et al. [10] constructed a digital twin model evaluation index system and provided 29 quantitative calculation methods. L. Zhang et al. [11] performed digital twin construction and evaluation based on the modeling simulation theory and methods. Schluse et al. [12] proposed an adaptability approach for assessing the potential applications of digital twin models. In terms of model optimization, Fang et al. [13] proposed a digital twin geometric model lightweighting method, which reduced geometric errors in the mesh model and improved the frame rate. To reasonably modify the parameters of digital twin models, Vrabic et al. [14] proposed optimizing model output accuracy and control parameters with gradient descent. Li et al. [15] proposed a model simplification method that preserved important mesh details and reduced redundant surfaces, which facilitated the transfer, loading, and browsing of digital twin models. Shu et al. [16] proposed a fast render method for digital twin models in large-scale scenes, which was of great significance for the dynamic real-time performance and interactivity of digital twin systems. Xu et al. [17] proposed a lightweighting method for the digital twin model of bogies and verified the validity of lightweight models in dynamics simulation.
In summary, various digital twin model evaluation indexes, evaluation methods, and optimization solutions have been proposed in recent years to effectively improve the quality of digital twin models. In terms of digital twin model evaluation, the relevant studies are mainly conducted from the perspective of generality, and the proposed evaluation indexes and methods are numerous and mainly focused on the final results, while the subsequent model quality optimization is rarely considered. In terms of digital twin model optimization solutions, scholars have also proposed optimization solutions for digital twin model application scenarios, such as mesh models, model parameter refinement and tuning, etc., which are mainly focused on the optimization of a particular aspect. However, digital twin models involve different data and feature dimensions of the physical entities, such as geometry, physics, behavior, and rules, and their practical applications have increasingly diverse requirements for the models. Thus, there are multiple aspects to consider for model optimization. Meanwhile, little attention has been paid to combining the various model evaluation indexes and accumulated model optimization solutions for digital twin model quality control in the modeling process. Therefore, integrating existing digital twin model evaluations with the growing number of optimization solutions and applying them to model quality control optimization can facilitate further in-depth research and scaled-up implementations of digital twin models.
2. Overview
Digital twin modeling is a highly complex process involving knowledge in multiple disciplines and domains, and requiring consideration of all aspects of model validity, generality, and efficiency. The modeling is usually conducted step by step in a collaborative design process by teams of engineers with different disciplinary backgrounds. However, the results of digital twin model construction are difficult to estimate during the collaborative design process, rendering it challenging to control model quality at each stage and effectively allocate solutions to improve model quality. Due to the above problems, digital twin model quality issues often emerge and draw attention in the application and maintenance phases.
Based on the current state of digital twin model quality studies and digital twin model construction, this study proposes a workflow management-based digital twin model quality optimization and control method to effectively apply a wide variety of digital twin model evaluation methods and optimization solutions. The proposed method integrates the digital twin modeling process into the workflow of product data management (PDM) [18,19] so that the flow of the model in the workflow can be controlled at the macro level through workflow techniques in the design process, and the model quality optimization can be supported at the micro level. The operation framework is shown in Figure 1. The main steps of the proposed method are as follows: First, the initial files of the model are inputted into the PDM’s workflow integrated with digital twin model evaluation. Then, through macro-level model quality control, and based on workflow management, the qualified digital twin model continues its flow, leaving the unqualified digital twin models at the current workflow node. If an abnormal index is found in the macro control, the model quality is optimized through micro-level model quality optimization methods by selecting the solution for the abnormal index. Finally, the above process is repeated until the model is archived in the workflow, at which moment the digital twin model of acceptable quality is outputted.
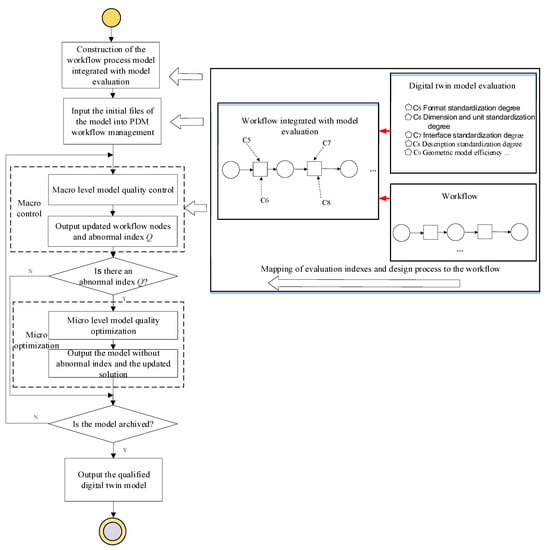
Figure 1.
Digital twin model quality optimization and control method based on workflow management.
The innovation of this study is to integrate a wide variety of model evaluation indexes and optimization solutions into the workflow for digital twin model quality optimization and control, which is of great value for shortening the product development lifecycle and promoting the development of enterprise information management. The contributions of this study are as follows:
- From a macro perspective, a digital twin model quality control method based on workflow management is proposed.
- Referring to the biological immunity process, a micro-level digital twin model quality optimization method is proposed.
- A digital twin model quality control optimization method incorporating macro-control and micro-optimization is proposed.
The rest of this article is structured as follows: Section 2 provides a general overview. The modeling of the workflow integrated with model evaluation is presented in Section 3. The digital twin model quality optimization and control method is described in Section 4 and Section 5. Section 6 presents the experimental results and analysis. The discussion is in Section 7. Section 8 is the conclusion.
3. Modeling of the Workflow Integrated with Model Evaluation
3.1. Digital Twin Model Quality Evaluation
Quantitative evaluation of the digital twin model quality can effectively reflect the current model quality status and inform digital twin model quality optimization and control. To quantitatively score each index of the digital twin model, each index (, the ith index) is calculated using the quantitative calculation method for the 29 digital twin model evaluation indexes, such as static parameter accuracy and dynamic parameter accuracy, proposed by C. Zhang et al. [10]. As each index of the digital twin model is scored according to the aspects of validity, generality, intuitiveness, and intelligence, the quality, performance, and applicability of the digital twin models can be reasonably evaluated. The model quality evaluation method set can be expressed as:
where B1 denotes the validity evaluation set, B1 = {C1, C2, C3, C4}, which may involve static and dynamic parameter accuracy, parameter association accuracy, and the degree of co-occurrence of virtual and actual entities; B2 denotes the generality evaluation set, B2 = {C5, C6, C7, C8}, which may involve the format standardization degree, dimension and unit standardization degree, interface standardization degree, and description standardization degree; B3 denotes the efficiency evaluation set, B3 = {C9, C10, C11, C12}, which may involve geometric model efficiency, physical model efficiency, behavior model efficiency, and rule model efficiency; B4 denotes the intuitiveness evaluation set, B4 = {C13, C14, C15, C16}, which may involve parameter intuitiveness, structural intuitiveness, operational process intuitiveness, and evolutionary process intuitiveness; B5 denotes the connectivity evaluation set, B5 = {C17, C18, C19, C20}, which can involve virtual and physical model connectivity, inter-digital twin model connectivity, digital twin model and service connectivity, and model and digital twin data connectivity; B6 denotes the integrity evaluation set, B6 = {C21, C22, C23}, which can involve the multidimensional data fusion degree, the multidimensional feature fusion degree, and the multidimensional submodel decision fusion degree; B7 denotes the flexibility evaluation set, B7 = {C24, C25, C26}, which can involve configurability, assemblability, and scalability; B8 denotes the intelligence evaluation set, B8 = {C27, C28, C29}, which can involve adaptability, autonomy, and self-learning capability.
The digital twin model of a robotic arm processed by the geometric model lightweighting solution in [15] is shown in Figure 2, and the C9 calculation is expressed in Equation (2). Then, the geometric model efficiency is 0.858. In Equation (2), n9 is the total number of geometric models, ngmpi is the total number of parameters of the ith geometric model before lightweighting, and is the number of parameters of the ith geometric model after lightweighting.
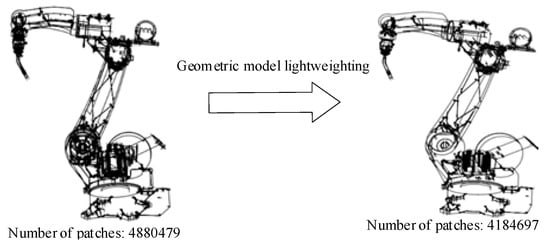
Figure 2.
Number of patches before and after model lightweighting.
3.2. Modeling of the Workflow Integrated with Model Evaluation
Digital twin modeling, the digital modeling of the attributes, methods, behaviors, and other characteristics of physical entities in a virtual space, is a highly complex process requiring a lot of time for positioning, fine-tuning, and optimization. Workflow is an important business process control technique widely used in all kinds of organizations to facilitate the consistent, accurate, efficient, and reliable execution of business processes. A workflow is the automation of a whole or part of a business process. In this process, documents, information, or products are passed from one participant (program, machine, or person) to another to perform a task according to a set of procedural rules [20]. A workflow management system can automatically control the model quality by the orderly execution of the relevant operations within the defined constraints [21]. On this basis, model evaluation can be integrated into the workflow. The quality is automatically controlled using the evaluation value as the flow constraint. To achieve effective control over digital twin model quality during the design process, the modeling activities and evaluation indexes at each stage of the digital twin model lifecycle, such as design and development, verification, and confirmation, are incorporated into a workflow. The existing workflow process metamodels of the Workflow Management Coalition provide no support for the representation of the various aspects of quality management. Thus, the existing workflow process model representation is extended accordingly so that the digital twin model quality control content can be properly described in the workflow process model. Workflow process models are expressed in many forms, such as Petri nets, directed network graphs (DNGs), and their various extensions [22]. This study combined the Petri net widely used in process control and quality control mechanisms to represent the workflow process model, with mapping of the design activities into the workflow, and configuration of the model evaluation methods for the transitions in the workflow process model, as shown in Figure 3. The workflow process metamodel defined by the Workflow Management Consortium describes the workflow components and logical relationships through five categories of elements: activities, transfer conditions, roles, workflow-related data, and deployed applications. Referring to the workflow process metamodel defined by the Workflow Consortium, the workflow process model integrated with model evaluation can be formalized and expressed as follows:
where TID indicates the identification of the model, N represents the node set in the process model, i.e., the place set of the Petri net, N = {N0, N1,..., Nn}. T is the transition set in the Petri net, T = {T1, T2,..., Tn}. G is the transition success condition, i.e., the threshold set for satisfactory model quality. A corresponds to the arc set in the Petri net, where the arc indicates the flow direction of the node, denoted by “→”. O is the model evaluation method set correlated with the transition. R is the workflow participant set. D is the related data. P is the selected external application set.
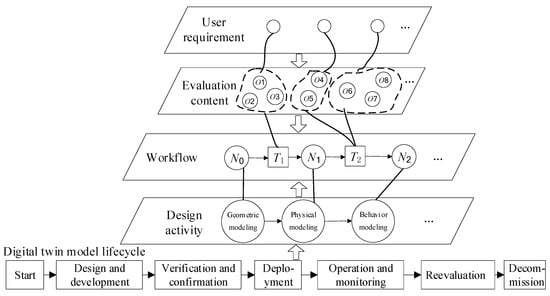
Figure 3.
Mapping relationships between design activity, workflow, and digital twin model evaluation content.
4. Macro-Level Model Quality Control Method
Traditional workflows do not support workflow state transitions according to model evaluation results. To effectively control the flow of digital twin models among the nodes in the workflow according to the model evaluation results, a macro-level model quality control method is developed based on workflow technology. When each digital twin model R enters the PDM workflow as a design document, model R will undergo step-by-step design approval. The flow of model R among the nodes is navigated according to the pre-defined workflow model. The model evaluation activity is the operation that takes place when the node is changed. If a model evaluation method is configured on the transition between current active nodes of the workflow, the configured model evaluation is executed. If no abnormal index is generated, the flow proceeds to the next workflow node. The control process of the proposed method is shown in Figure 4, and the steps are as follows:
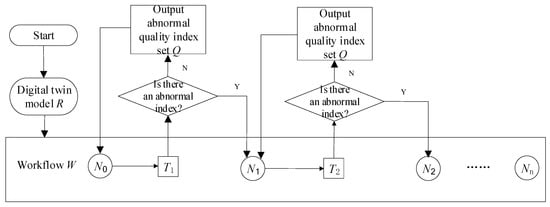
Figure 4.
Macro-level model quality control process.
The inputs include workflow model W, current workflow node N0 of digital twin model R, next workflow node N1, transition T1 between workflow nodes N0 and N1, evaluation set O = {O1, O2,…,Om} associated with T1, and the threshold set corresponding to the evaluation set G = {G1, G2,…,Gm}.
The outputs include the latest workflow node of model R and abnormal quality index set Q = {Q1,…, Qn}.
Step 1: Based on the evaluation method in Section 3.1, model R is evaluated using evaluation set O to obtain the evaluation results. First, model R is evaluated with each method in the evaluation set O, and each evaluation index value is exported. Then, whether the output evaluation index value reaches the corresponding threshold is judged according to the set of thresholds G = {G1, G2,..., Gm} corresponding to the evaluation set. Finally, the set Q of evaluation indexes failing to reach the corresponding threshold is output to the workflow management system and the user.
Step 2: If there is an abnormal index, the current node of model R remains unchanged, and the process ends by outputting the abnormal index set Q.
Step 3: If there is no abnormal index, the process ends by allowing the flow of model R from workflow node N0 to the next node N1.
5. Micro-Level Model Quality Optimization Method
The micro-level model quality optimization process requires effectively retrieving solutions for digital twin model abnormal indexes to optimize model quality. In addition, the solution library must be continuously enriched during the model control process to enhance the ability to address future abnormal indexes of the digital twin model. The cognitive, activation, and effector stages of biological immunity allow for the recognition and elimination of foreign antigenic substances to maintain the balance and stability of the internal environment [23]. Since the biological immunity processes fit well with the micro-level model quality optimization process, a micro-level model quality optimization method is proposed based on such processes. The micro-level model quality optimization model is presented in Figure 5. The solution retrieval methods, which play a key role in the micro-level model quality optimization, are presented in the subsequent sections.
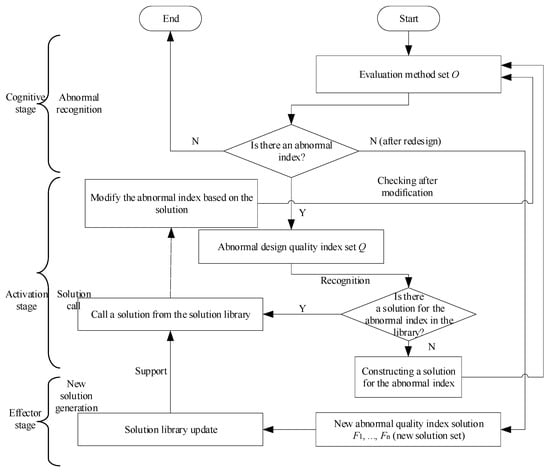
Figure 5.
Micro-level model quality optimization model.
The steps of the micro-level model quality optimization method are as follows:
Step 1: Cognitive stage. In the design process, based on the evaluation method in Section 3.1, the evaluation set O is used for determining whether the index is abnormal.
Step 2: Activation stage. If there is an abnormal index Q, the appropriate solution is selected using the method in Section 5.2. First, abnormal indexes in the set Q are input to the solution retrieval method in Section 5.2 to establish the optimized mathematical model of the solution. Then, the mathematical model is solved to retrieve suitable and targeted solutions from the solution library. Finally, the retrieved solutions are fed to the user to correct the abnormal indexes.
Step 3: Effector stage. The model is processed based on the retrieved solution and rechecked after processing. An abnormal index that has never appeared before is called a new abnormal index, the handling of which requires redesigning; if the model passes recheck after redesigning, the abnormal index and the corresponding solution are recorded in the solution library.
5.1. Optimal Solution Selection Factor Analysis
Retrieving the right solution is key to model quality optimization. The solution is the optimization of resources (data, rules, templates, criteria, algorithms, experience, etc.) for a specific abnormal evaluation index. Due to the correlation between some evaluation indexes, multiple abnormal indexes may be solved by the same solution. To retrieve the right solution for model quality optimization, the validity of the solution needs to be considered. The solution can be expressed as follows:
where denotes the specified abnormal index set; denotes the optimization resources for the abnormal index; denotes the actual case solved by the solution. Validity is the evaluation set for the validity of a solution for solving different abnormal indexes, and the final value is the average of their historical scores [24,25]. It is defined for obtaining, through qualitative research, the gap between the expectation and output value of the solution, which reflects the limitations of the solution and affects its re-selection and recommendation rates.
where indicates the validity of the solution , is the validity evaluation score of the jth solution, and N is the total number of evaluations.
Collaborative compatibility refers to the degree of tacit collaboration between solutions [25]. A particular abnormal index in the digital twin model may have multiple solutions, which can complement each other’s deficiencies. Collaborative compatibility is measured based on historical logs and calculated as follows:
where indicates the collaborative compatibility between solutions and ; indicates the average validity after the combined application of and ; is the minimum evaluation value of the index; is the maximum evaluation value of the index; , .
The collaborative validity of two solutions, and , collaborating to optimize the same abnormal index, can be noted as:
where is the scale factor to map collaborative compatibility to validity, and i is the ith abnormal index.
For any instance s, and are the computational targets, respectively, as shown below, where the ideal solution of the optimization objective is , denotes the Euclidean distance between and , dn is the minimum distance from the nth solution to the other solutions, and denotes the average of dn [24,25].
5.2. Solution Selection
A mathematical model for the optimal selection of the solution is developed. Maximizing the validity of the solution and minimizing the variance of the validity for each index are objectives 1 and 2, and objective 1 is transformed into a minimization objective by taking the inverse.
Aik identifies whether abnormal indicator Ti is assigned to the solution; indicates that each abnormal indicator should be assigned to a solution. The constraint is as follows:
Employing the constructed mathematical model, an optimal solution selection method is proposed based on the NSGAII algorithm [26,27]. To take advantage of multiple solutions while not affecting their implementation with too many solutions, we set at least one and at most two solutions for each abnormal index. The steps of the solution are as follows:
Step 1: The population and algorithm parameters are initialized.
Step 2: The operation is initialized, and the fitness is calculated [28].
Step 3: Operator manipulation is conducted, and individual selection is performed according to the environment selection strategy.
Step 4: it is determined whether the iteration is finished. If yes, the TOPSIS method [29,30] is used to set the relative weight vector, and the process ends by outputting the optimal solution; otherwise, the process proceeds to Step 2.
- (1)
- Coding method. The chromosome code consists of the sequence of the desired solution, and the candidate solution codes are numbered and binary coded, based on which the initialized populations are generated.
- (2)
- GA operator manipulation strategy. The fine-grained original fitness assignment method and the density estimation method were combined to calculate the fitness. The roulette wheel selection method was adopted for individual selection, and GA crossover and mutation manipulation operators were executed to generate new solutions. For the crossover operator, two chromosomes were randomly selected, and crossover points were randomly selected for gene fragment exchanges. The number of crossover points was set to two. For the mutation operator, one gene in the chromosome is randomly selected for efficient regeneration in the chunk.
- (3)
- Environment selection strategy. Environment selection is used to evaluate the quality of contemporary and elite solutions, and the better solution will be selected for the next iteration. The evaluation strategies adopted are the non-dominated solution level and congestion calculation [28]. The non-dominated solution level indicates the dominance relationship between individuals in the population, and a higher level (smaller value) indicates a better solution. A greater congestion value indicates better distribution performance of the solution.
6. Instance Verification
6.1. Experimental Data
The quality optimization and control processes of the digital twin models of a university’s practical teaching platform (E1) and a design and research institute’s multifunctional lift-and-slide experimental line (E2) were selected to verify the validity of the proposed method of quality optimization and control. The finally qualified digital twin models and the corresponding physical entities are shown in Figure 6 and Figure 7. The initial files of the selected models E1 and E2 undergo the same design process shown in Figure 8, which mainly contains design activities such as geometric model construction, physical model construction, and behavior model construction. The parameters of the solution selection algorithm in this paper are set. Specifically, the number of populations is set to 250, the number of external files is set to 250, the number of iterations is set to 200, the probability of mutation is set to 0.2, and the probability of crossover is set to 0.5.
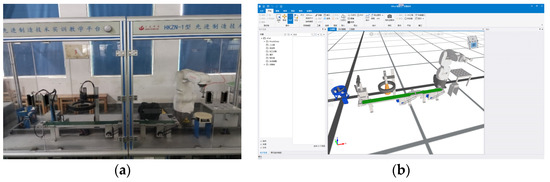
Figure 6.
Practical teaching platform: (a) physical entities; (b) digital twin models.
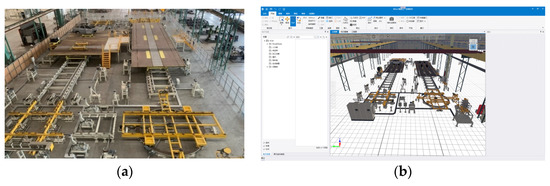
Figure 7.
Multifunctional lift-and-slide experimental line: (a) physical entities (b) digital twin models.
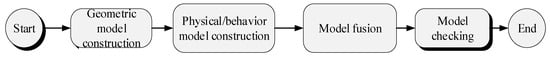
Figure 8.
Design process.
6.2. Instance Validation and Result Analysis
6.2.1. Modeling of the Workflow Integrated with Model Evaluation
Based on the proposed workflow model integrated with model evaluation, the design process in Figure 8 and the model evaluation method defined in Section 3.1 are mapped to the workflow, as shown in Figure 9, and Table 1 and Table 2.
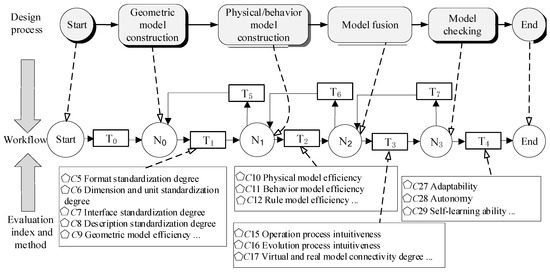
Figure 9.
Modeling of the workflow integrated with model evaluation.

Table 1.
Description of some activities in the workflow.
Table 2.
Description of transitions in the workflow.
The specific workflow is as follows: Models E1 and E2 first enter the workflow node Start. Then, node transformation is achieved through transition after engineer operation, and the process proceeds to node N0. Subsequent node transformations are executed sequentially in the workflow until reaching the node End. Based on the above process, the proposed method is validated.
6.2.2. Model Quality Optimization and Control Results Analysis
Based on the above work, the macro-control model quality advantage and the integrated consideration of macro-control and micro-optimization model quality advantage were verified by two processes.
To verify the advantages of macro control, models E1 and E2 underwent the flow from node N0 to node N1. As a result, model E1 successfully flowed to the next workflow node N1, while model E2 with abnormal quality indexes was left at its original workflow node N0. The abnormal quality index for model E2 in this execution stage is C9, where the current C9 of models E1 and E2 is shown in Figure 10. It can be seen that the C9 value of model E1 achieves the target threshold. If the threshold values of other required evaluation indexes are satisfied, the workflow can proceed to the next node N1 according to the constraint rules. Due to the low C9 value in model E2, the target threshold is not achieved, and the model does not meet the requirement of flowing to the next node, remaining at the original workflow node N0. Then, models E1 and E2 underwent the entire workflow to the end, and the methods (MQCM) in this paper were compared with the critical quality characteristic immune preventive control method (CQCTIPCM) [23] without considering macro quality control. CQCTIPCM is not implemented from the beginning of geometric modeling, and concentrated quality evaluation and optimization for the previous stages are performed before model fusion. Figure 11 shows the abnormal indexes of each model before and after quality control. It can be observed that the method proposed in this paper can keep models with abnormal indexes in the workflow through macro-level model quality control, thus avoiding the output of models with abnormal indexes.
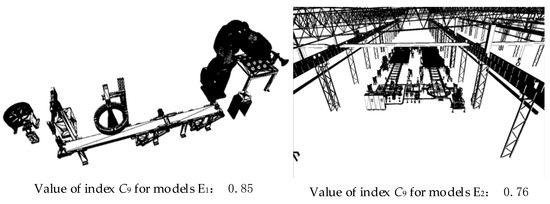
Figure 10.
Values of index C9 for models E1 and E2.
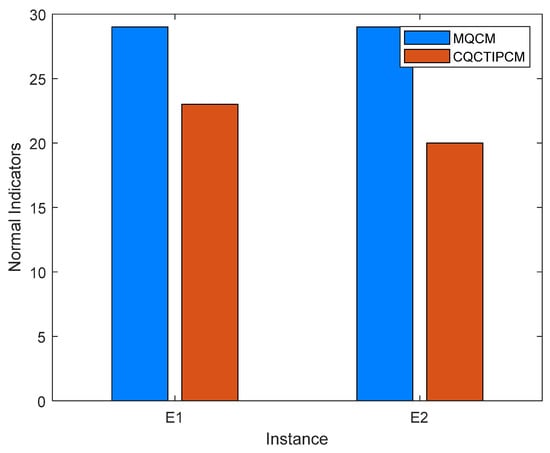
Figure 11.
Comparison results of the number of abnormal indexes before and after quality control.
To verify the advantages of combining macro and micro control, the flow of model E2 from workflow node N2 to N3 was used as an example for analysis. Based on the macro-level control results, micro-level quality optimization was further applied to the model with abnormal indexes, and the results are presented in Table 3. The E2 abnormal indexes in Table 3 are those generated when applying macro quality control methods, while the E′2 abnormal indexes are those generated without the quality optimization of model E2. According to Table 3, the C9 and C16 abnormal indexes interact with each other, and the results of the earlier design activities affect the subsequent modeling quality. Through micro control, targeted geometric model optimization solutions are selected to optimize abnormal index C9. According to the evaluation by Equation (2), the scores before and after optimization are 0.76 and 0.93, respectively, as shown in Figure 12. Due to the absence of a direct solution for abnormal index C15 in the solution library, the new solution for it is stored in the solution library to solve similar problems in the future. The experiments showed that by spreading the model evaluation tasks across the transitions of the workflow and avoiding addressing too many abnormal indexes in concentrated evaluation and optimization, we effectively prevented early abnormal activities from affecting subsequent design activities while providing targeted solutions to abnormal indexes.
Table 3.
Abnormal evaluation indexes.
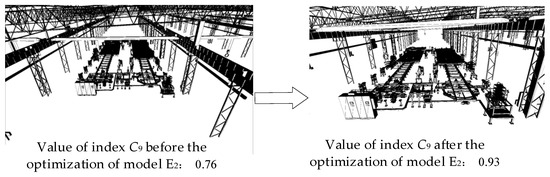
Figure 12.
Values of index C9 before and after the optimization of model E2.
To verify the overall effect of the method in this paper on the quality control and optimization of models E1 and E2, the two models were executed in the workflow to the archive node. The number of times each model was controlled at the original node in the workflow during execution, the number of model optimization solutions obtained, and the optimization effects were counted, as shown in Figure 13, Figure 14 and Figure 15, respectively. Referring to C. Zhang et al. [10], some of the indicators in Figure 15 are calculated as described below.
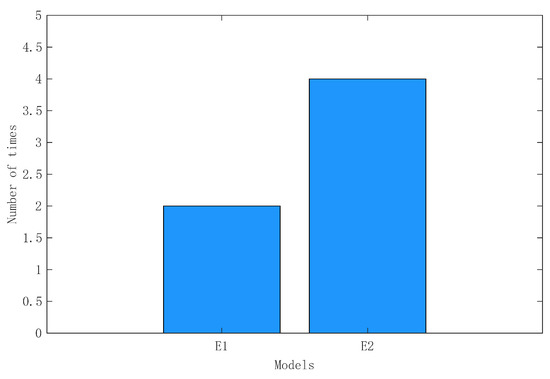
Figure 13.
The number of times each model was controlled at the original node in the workflow.
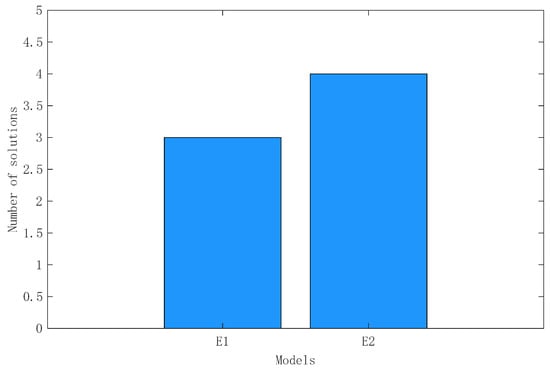
Figure 14.
The number of model optimization solutions obtained for each model.
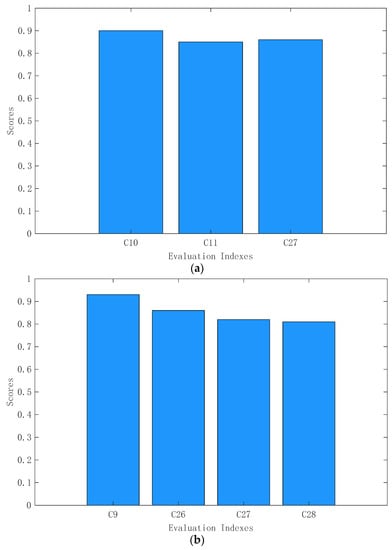
Figure 15.
Each model anomaly indicator score after the optimization of the model optimization solutions: (a) model E1; (b) model E2.
The physical model/behavior model efficiency in the digital twin model is calculated as follows:
In Equation (14), is the total number of physical/behavior models; is the total number of parameters before the ith physical/behavior model is lightened; is the number of parameters after the ith physical/behavior model is lightened.
The digital twin model scalability is calculated as follows:
In Equation (15), mce and mct denote the degree of functional expansion and tailoring of the digital twin model, respectively. are the weights of mce and mct, respectively, which are determined according to the business requirements and take values in the range of [0, 1], .
The digital twin model adaptivity is calculated as follows:
In Equation (16), denote the degree of autonomous adaptation of the digital twin model to task requirements, operating environment, and changes in its functions, respectively, and take the values of [0, 1]; are the weights of , determined according to business requirements, .
The range of values for digital twin model autonomy is shown in Table 4.
Table 4.
Reference table for the value of .
As can be seen from Figure 13, in the workflow, the total number of times that the two models were controlled at the original nodes by the method presented in this paper is six. The results show that the method in this paper can effectively control the models with the abnormal indicators at the original workflow nodes through the workflow. From Figure 14 and Figure 15, it can be seen that our method provides a total of seven optimization solutions for the two models for the abnormal indicators, and can optimize all of these seven abnormal indicators to a score of 0.8 or more. There are eight abnormal indicators for which there are no targeted solutions in the library, but the solutions generated by the design process have been stored in the knowledge base. Thus, the results in Figure 14 and Figure 15 show that the approach in this paper can effectively target optimization for model quality and can obtain solutions that are not available in the library to support the next anomaly. In summary, the methods in this paper provide a good solution for the quality optimization and control of digital twin models by integrating macro and micro quality optimization and control. In summary, the methods in this paper provide a good solution for the quality optimization and control of digital twin models by integrating macro and micro quality optimization and control.
7. Discussion
This study investigates the control and optimization of the digital twin model with respect to quality control. In the process of model quality control and optimization, the inadequate control of the traditional design process and the difficulty of extracting targeted applications from various optimization solutions are addressed. The objective of this study was to realize the integration of the design process, model evaluation, and model optimization solutions by establishing workflows, thus supporting the quality control and optimization of various digital twin models. The controlled and optimized digital twin model has better values of 29 evaluation indexes, which lays the foundation for future research on the effective application of digital twin models. In the instance validation, the evaluation indexes achieved by the model and the optimization results of the model solution during the design process were observed. The results indicate that the proposed method can be applied to model quality control and optimization, which contributes to the effective application of digital twins. According to the digital twin model of the practical teaching platform and multifunctional lift-and-slide experimental line, the proposed method shows higher effectiveness and feasibility compared with the single domain model optimization and traditional design process control. The results of this study can also be applied to quality control and optimization in other fields. Meanwhile, model-based approaches [31,32] can be combined with the methods in this paper to control and optimize the quality of digital twin models and their applications. For example, the model-based approach can be used for workflow process formulation in this paper and to improve model data consistency, data traceability, and communication efficiency among collaborating staff, which helps to reduce the number of controls at the current workflow node due to abnormal indexes. This part can be used as the next research direction following this paper. In future studies, researchers may promote quality control and optimization for more digital twin models with the proposed method. They may also explore additional model optimization options to improve the effectiveness of the proposed method.
8. Conclusions
Digital twin model quality is key in all phases of its lifecycle. A digital twin model quality optimization and control method based on workflow management was proposed to effectively control model quality and allocate solutions for model quality optimization. By constructing the workflow process model integrated with digital twin model evaluation, we achieved macro-level model quality control and micro-level model quality optimization in the design process. Finally, the practical instance shows that the proposed method can effectively realize the quality optimization and control of the digital twin model, demonstrating its excellent practicality. Compared with the traditional workflow control and model quality optimization methods, the proposed method can identify quality problems and provide targeted solutions promptly, contributing to the scale implementation of digital twin models. However, before the implementation, the evaluation method needs to be mapped into the workflow according to the actual needs. It requires proficient operators in business processes and software operations, and the process is time-consuming. The future work following this paper will be conducted on the following two aspects: (1) efficient methods for mapping evaluation methods to workflows and (2) digital twin model evaluation methods to enhance model evaluation diversity.
Author Contributions
All authors contributed to the study presented in this paper. R.L.: conceptualization, methodology, software, writing—original draft. B.S.: supervision, writing—review and editing, funding acquisition. Y.L.: investigation, visualization. Y.H.: visualization, writing—review and editing. G.F.: formal analysis, resources. X.Y.: formal analysis, investigation. All authors have read and agreed to the published version of the manuscript.
Funding
This research was funded by Hubei Science and Technology Major Projects (2021AAA007).
Institutional Review Board Statement
Not applicable.
Informed Consent Statement
Not applicable.
Data Availability Statement
Not applicable.
Conflicts of Interest
The authors declare no conflict of interest.
References
- Zhang, C.; Dong, L.; Wang, Y. Design-Manufacturing-Operation & Maintenance (O&M) Integration of Complex Product Based on Digital Twin. Appl. Sci. 2023, 13, 1052. [Google Scholar]
- Kritzinger, W.; Karner, M.; Traar, G.; Henjes, J.; Sihn, W. Digital Twin in manufacturing: A categorical literature review and classification. IFAC-PapersOnLine 2018, 51, 1016–1022. [Google Scholar] [CrossRef]
- Singh, M.; Fuenmayor, E.; Hinchy, E.P.; Qiao, Y.; Murray, N.; Devine, D. Digital Twin: Origin to Future. Appl. Syst. Innov. 2021, 4, 36. [Google Scholar] [CrossRef]
- Wang, Z. Digital Twin Technology. In Industry 4.0-Impact on Intelligent Logistics and Manufacturing; IntechOpen: London, UK, 2020; pp. 95–114. [Google Scholar]
- Kunkera, Z.; Opetuk, T.; Hadžić, N.; Tošanović, N. Using Digital Twin in a Shipbuilding Project. Appl. Sci. 2022, 12, 12721. [Google Scholar] [CrossRef]
- Zhang, H.; Qi, Q.; Tao, F. A consistency evaluation method for digital twin models. J. Manuf. Syst. 2022, 65, 158–168. [Google Scholar] [CrossRef]
- Liu, S.; Sun, Y.; Zheng, P.; Lu, Y.; Bao, J. Establishing a reliable mechanism model of the digital twin machining system: An adaptive evaluation network approach. J. Manuf. Syst. 2022, 62, 390–401. [Google Scholar] [CrossRef]
- Zhang, L.; Zhou, L.; Horn, B. Building a right digital twin with model engineering. J. Manuf. Syst. 2021, 59, 151–164. [Google Scholar] [CrossRef]
- Tao, F.; Zhang, H.; Qi, Q.; Xu, J.; Sun, Z.; Hu, T.; Xiao, B. Theory and application of digital twin model construction. CIMS 2021, 27, 1–15. [Google Scholar]
- Zhang, C.; Tao, F. Digital twin model evaluation index system. CIMS 2021, 27, 2171–2186. [Google Scholar]
- Zhang, L.; Lu, H. Digital twins from modeling simulations. Hsi T’ung Fang Chen Hsueh Pao. 2021, 33, 995. [Google Scholar]
- Roungas, B.; Meijer, S.A.; Verbraeck, A. A framework for optimizing simulation model validation & verification. Int. J. Adv. Syst. Meas. 2018, 11, 137–152. [Google Scholar]
- Fang, L.; Liu, Q.; Zhang, D. A Digital Twin-Oriented Lightweight Approach for 3D Assemblies. Machines 2021, 9, 231. [Google Scholar] [CrossRef]
- Vrabič, R.; Erkoyuncu, J.A.; Butala, P.; Roy, R. Digital twins understanding the added value of integrated models for through-life engineering services. Procedia Manuf. 2018, 16, 139–146. [Google Scholar] [CrossRef]
- Li, M.; Nan, L. Feature-preserving 3D mesh simplification for urban buildings. ISPRS J. Photogramm. Remote Sens. 2021, 173, 135–150. [Google Scholar] [CrossRef]
- Shu, L.; Zhang, J.; Chen, X.; Yang, Y. A fast rendering method of digital twin model for large-scale scenes. CIMS 2022, 28, 9. [Google Scholar]
- Xu, L.; Gao, G.; Dong, W.; Yu, Y. Research on key technologies of digital twin modeling and simulation of train bogie. J. Railw. Sci. Eng. 2023. [Google Scholar] [CrossRef]
- Weber, C.; Werner, H.; Deubel, T. A different view on Product Data Management/Product Life-Cycle Management and its future potentials. J. Eng. Design 2003, 14, 447–464. [Google Scholar] [CrossRef]
- Deelman, E.; Vahi, K.; Rynge, M.; Mayani, R.; Da Silva, R.F.; Papadimitriou, G.; Livny, M. The evolution of the pegasus workflow management software. Comput. Sci. Eng. 2019, 21, 22–36. [Google Scholar] [CrossRef]
- Zacharewicz, G.; Frydman, C.; Giambiasi, N. G-DEVS/HLA environment for distributed simulations of workflows. Simulation 2008, 84, 197–213. [Google Scholar] [CrossRef]
- Rabah, S.; Zacharewicz, G.; Chapurlat, V. Digital Twin for services (DT4S): Conceptual strategy. IFAC-PapersOnLine 2022, 55, 3256–3261. [Google Scholar] [CrossRef]
- Evermann, J.; Kim, H. Workflow Management on BFT Blockchains. Enterp. Model. Inf. Syst. Archit. 2020, 15, 1–22. [Google Scholar]
- Zhang, G.; Ji, F.; Ren, X.; Ge, H. Immune preventive control model for key quality characteristics of product manufacturing process. CIMS 2011, 17, 791–799. [Google Scholar]
- Yu, D.; Wang, J.; Liu, C. An Optimal Employee Assignment Method Based on Collaboration Mode in Workflow. J. Softw. 2018, 29, 15. [Google Scholar]
- Lu, L.; Hu, H.; Li, Z.; Chen, J.; Hu, H. Task assignment optimization of workflow system based on ant colony algorithm. CIMS 2018, 24, 1723–1735. [Google Scholar]
- Jaber, A.; Lafon, P.; Younes, R. A branch-and-bound algorithm based on NSGAII for multi-objective mixed integer nonlinear optimization problems. Eng. Optim. 2022, 54, 1004–1022. [Google Scholar] [CrossRef]
- Deb, K.; Pratap, A.; Agarwal, S.; Meyarivan, T.A.M.T. A fast and elitist multiobjective genetic algorithm: NSGA-II. IEEE Trans. Evol. Comput. 2002, 6, 182–197. [Google Scholar] [CrossRef]
- Zhu, Q.; Lin, Q.; Li, J.; Coello, C.A.C.; Ming, Z.; Chen, J.; Zhang, J. An elite gene guided reproduction operator for many-objective optimization. IEEE Trans. Cybern. 2019, 51, 765–778. [Google Scholar] [CrossRef]
- Fang, K.; Wang, T.; Zhou, X.; Ren, Y.; Guo, H.; Li, J. A TOPSIS-based relocalization algorithm in wireless sensor networks. IEEE Trans. Ind. Inform. 2021, 18, 1322–1332. [Google Scholar] [CrossRef]
- Hussian, Z.; Yang, M.S. Distance and similarity measures of Pythagorean fuzzy sets based on the Hausdorff metric with application to fuzzy TOPSIS. Int. J. Intell. Syst. 2019, 34, 2633–2654. [Google Scholar] [CrossRef]
- Zacharewicz, G.; Diallo, S.; Ducq, Y.; Agostinho, C.; Jardim-Goncalves, R.; Bazoun, H.; Wang, Z.; Doumeingts, G. Model-based approaches for interoperability of next generation enterprise information systems: State of the art and future challenges. Inf. Syst. e-Bus. Manag. 2017, 15, 229–256. [Google Scholar] [CrossRef]
- Model Based Systems Engineering (MBSE). Oct. Available online: http://www.nasa.gov/consortium/ModelBasedSystems (accessed on 18 January 2023).


Disclaimer/Publisher’s Note: The statements, opinions and data contained in all publications are solely those of the individual author(s) and contributor(s) and not of MDPI and/or the editor(s). MDPI and/or the editor(s) disclaim responsibility for any injury to people or property resulting from any ideas, methods, instructions or products referred to in the content. |
© 2023 by the authors. Licensee MDPI, Basel, Switzerland. This article is an open access article distributed under the terms and conditions of the Creative Commons Attribution (CC BY) license (https://creativecommons.org/licenses/by/4.0/).