Article

Design Optimization Methodology for Diversion Structure with Concrete Cofferdam Using Risk-Based Least-Cost Design Method

1
DL E&C, Nepal UT1 HEPP Project Team, Seoul 03181, Republic of Korea
2
Department of Safety Engineering, Incheon National University, Incheon 22012, Republic of Korea
*
Author to whom correspondence should be addressed.
Appl. Sci. 2023, 13(5), 2903; https://doi.org/10.3390/app13052903
Submission received: 30 December 2022 / Revised: 4 February 2023 / Accepted: 20 February 2023 / Published: 24 February 2023

Abstract

:
The optimal size of a diversion structure should be carefully studied to ensure economic viability and safety during construction. In practice, to determine the size of a diversion structure, design flood frequency is selected as the suggested return period presented by the design standard, which is presented differently. This study proposes a methodology for the design of a diversion structure with a concrete cofferdam adopting risk analysis to reflect the more practical hazard and risk of diversion structure during dam construction. The proposed methodology is based on a risk-based least-cost design process and risk analysis. The optimization result is presented as the lowest expected monetary value, which accounts for construction cost, reconstruction cost, and delay liquidated damage with the failure probability and recovery cost with the overflow probability. This methodology was applied to the case study of the Gulpur hydropower project in Pakistan. The results showed that the optimal design flood frequency is 1 year for a recovery cost of USD 0.5 mil. and 1~2 years for a recovery cost of USD 1.0~2.0 mil. with 3, 4, and 5 years of the usage period of the diversion structure. Furthermore, 2~10 years is the optimal value for a recovery cost of USD 3.0~4.0 mil. These results indicated that the optimal design flood frequency increases as the recovery cost and usage period of the diversion structure increase. The results of the study reveal that the recovery cost and the period of use of the diversion structure affect the design flood frequency of the diversion structure. From a design perspective, the period of use is determined by the construction period of the project or the construction method, whereas the recovery cost depends on the countermeasure method. Therefore, after preparing a proactive plan and estimating the recovery cost, the design flood frequency for the diversion structure should be determined.

1. Introduction

A dam is a barrier constructed across a river to store water or arrest the flow of water. Before erecting a dam, a temporary diversion structure should be installed to provide dry work conditions for main dam construction. A diversion structure consists of an upstream/downstream cofferdam and diversion tunnel. By constructing a cofferdam, the river water can be diverted into a diversion tunnel, which makes a dry workspace between the upstream and downstream cofferdams for the main dam construction.
Although a diversion structure is used temporarily, it has a large proportion of total EPC (Engineering, Procurement, Construction) cost. Therefore, an optimal size of a diversion structure should be determined to optimize projects in terms of economic feasibility and safety. Theoretically, the design flood frequency of a diversion structure is determined by considering characteristics of flood frequency, basin size, construction period, the type of main dam, and damage or loss caused by flooding during construction. However, in practice, the return period presented by the design standard is normally used as the design flood frequency for the diversion structure, which is normally related to the type of main dam. However, the return period for a diversion structure is presented differently in design standards; for example, ICOLD proposes 10 years as a return period for a diversion structure when the type of main dam is a concrete gravity dam [1], whereas the Korean dam design standard proposes 1–2 years [2].
Tung et al. [3] classified the evolution of design approaches for hydro-system infrastructure into three principal stages: (1) the historical event-based approach, (2) the return-period approach, and (3) the risk-based approach [3]. According to this classification, the practical method to determine the design flood frequency for a diversion structure can be classified as the return-period approach. The risk-based approach is an advanced procedure that evaluates different alternatives by considering the trade-off between the investment cost and the expected economic losses due to failure. Therefore, the risk-based approach can be utilized to study or evaluate the optimal design flood frequency for a diversion structure.
In previous studies on the design flood frequency of a diversion structure, an optimization model based on permanent hydraulic structures was applied to the diversion structure in a dam construction project. In this modeling, the failure of the diversion structure is defined such that the flood water level resulting from an extreme rainfall event is higher than the design flood water level. The results of optimization are presented using the relations graph of the failure risk, construction period, expected damage, and loss for the flood water level [4,5]. The failure of a cofferdam should, however, be evaluated considering the overall force relationship, which lies in the scope of stability analysis after calculating the loadings and resistances acting on a cofferdam.
This study explores the design optimization methodology for a diversion structure with a concrete cofferdam using a risk-based approach to quantify the practical hazards and risks of dam construction. The proposed methodology is based on a risk-based least-cost design process and risk analysis and is applied to a case study of the Gulpur hydropower project in Pakistan. Risks for the design optimization methodology include the structural failure of the upstream cofferdam as a structure risk and the overflow of the upstream cofferdam as a functional risk. The failure probability was calculated using the limit state function and Monte Carlo Simulation (MCS). The overflow probability was calculated from the inverse of the return period. Finally, the optimization result was presented as the lowest value of Expected Monetary Value (EMV), which considers construction cost, re-construction cost and delay LD (Liquidated Damage) with the failure probability and the recovery cost with the overflow probability.

2. Design Optimization Methodology for a Diversion Structure

2.1. Risk-Based Least-Cost Design
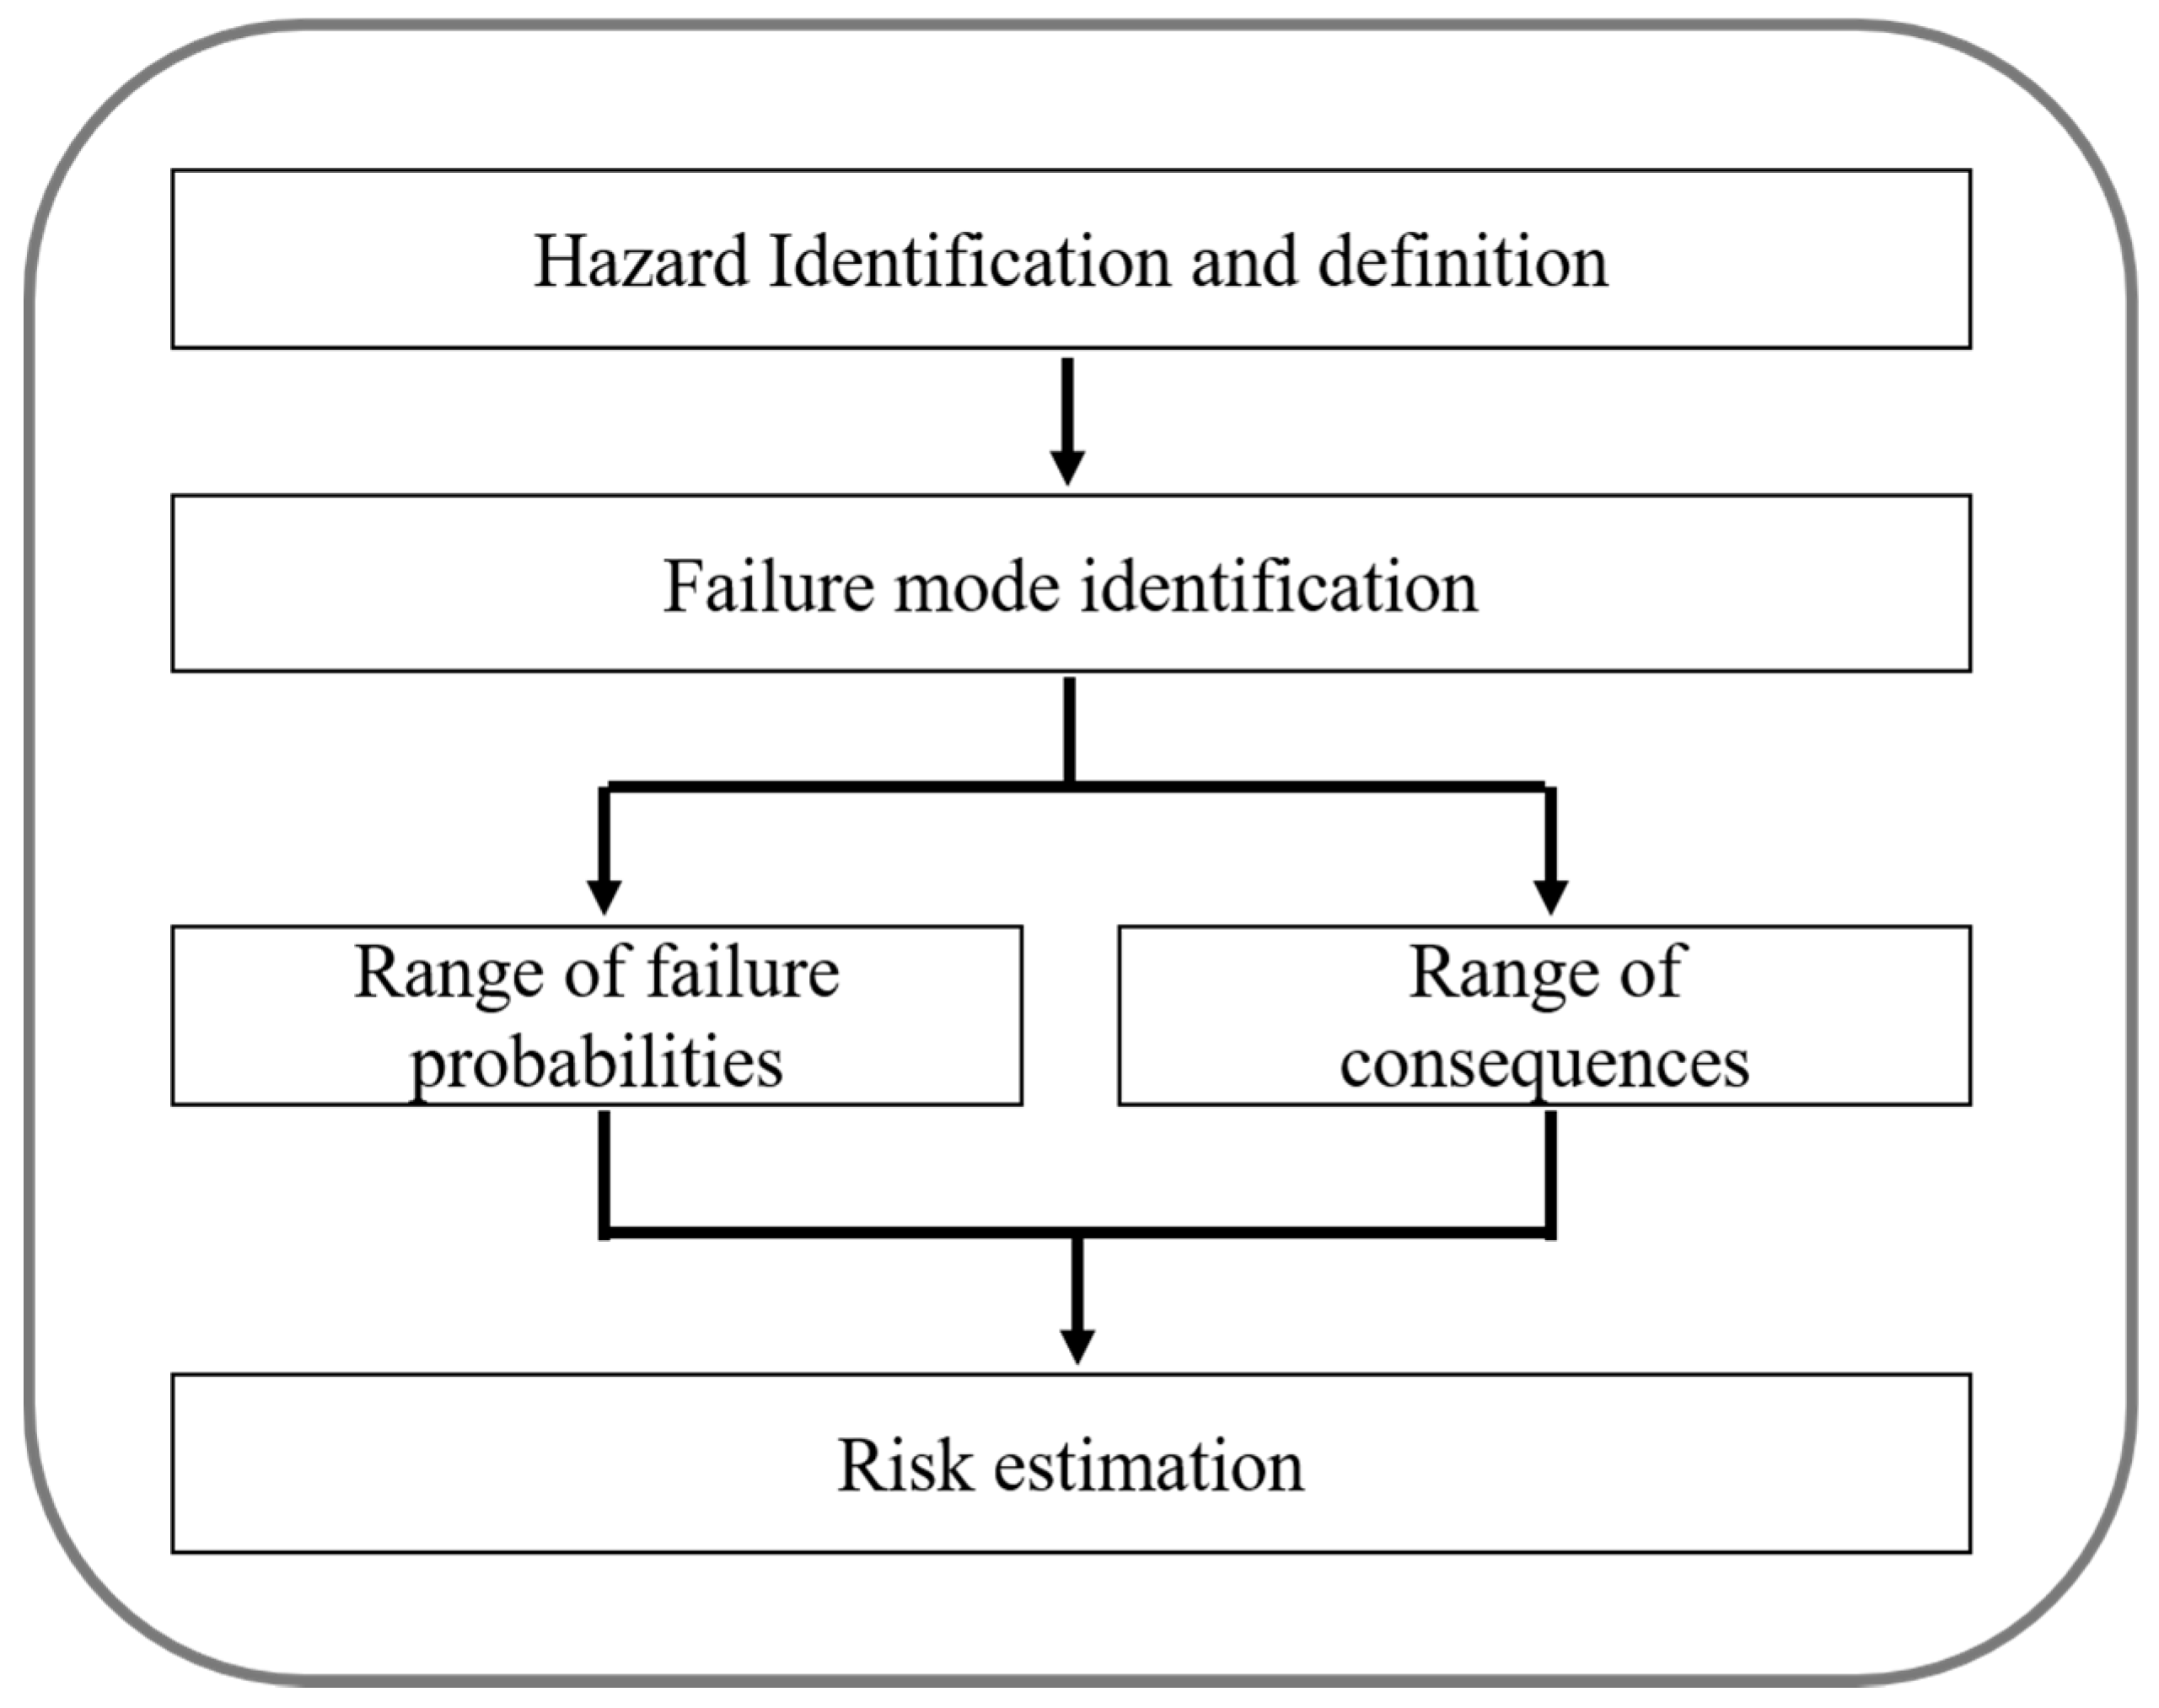
The basic idea of reliability engineering is to determine the failure probability of an engineering system, with which the safety of the system can be assessed, or a rational decision can be made for the design, operation, or forecasting of the system. Failure probability and its consequent damage should be a basis for optimization. If the risk, damage and loss, construction cost, and operation and maintenance (O&M) cost are calculated, the total cost can be calculated using the size of the structure. Additionally, the optimal size of the structure can be determined in terms of cost. Therefore, this methodology is an optimization process adopting risk analysis.
A failure engineering system can be defined as a system in which the load (external forces) acting on the system exceeds the resistance (e.g., strength or capacity) of the system. The failure of infrastructure can be classified broadly into structural failure and functional (performance) failure. Structural failure involves damage or change in a structure or facility and hinders the ability to function as desired. Functional (performance) failure does not necessarily involve structural damage, yet the performance limit of the structure is exceeded and there are undesirable consequences [3].

2.2. Risk Analysis

Risk analysis is the estimation of the likelihood of unwanted events, such as a catastrophic failure or unsatisfactory performance, and their associated consequences. Risk analysis involves breaking down a dam system into its components, identifying the failure mechanisms of each component, analyzing the associated risks, and then recombining the system to get over the overall risk [6]. A conceptual diagram is presented in Figure 1. Risk analysis techniques are typically classified as standard-based approaches, qualitative approaches, and quantitative approaches. A standard-based approach is a method of expressing the evaluation result of risk using a safety factor, whereas a qualitative approach adopts indexing and ranking to consider dam safety and the failure results. A quantitative approach involves a reliability analysis and probabilistic analysis in which the representative methods are Monte Carlo Simulation (MCS) and Bayesian network modeling. MCS is a computerized mathematical technique that accounts for risk in risk analysis and decision-making. MCS provides the decision-maker with a range of possible outcomes and their probabilities and shows the various possibilities along with all possible consequences for decisions.

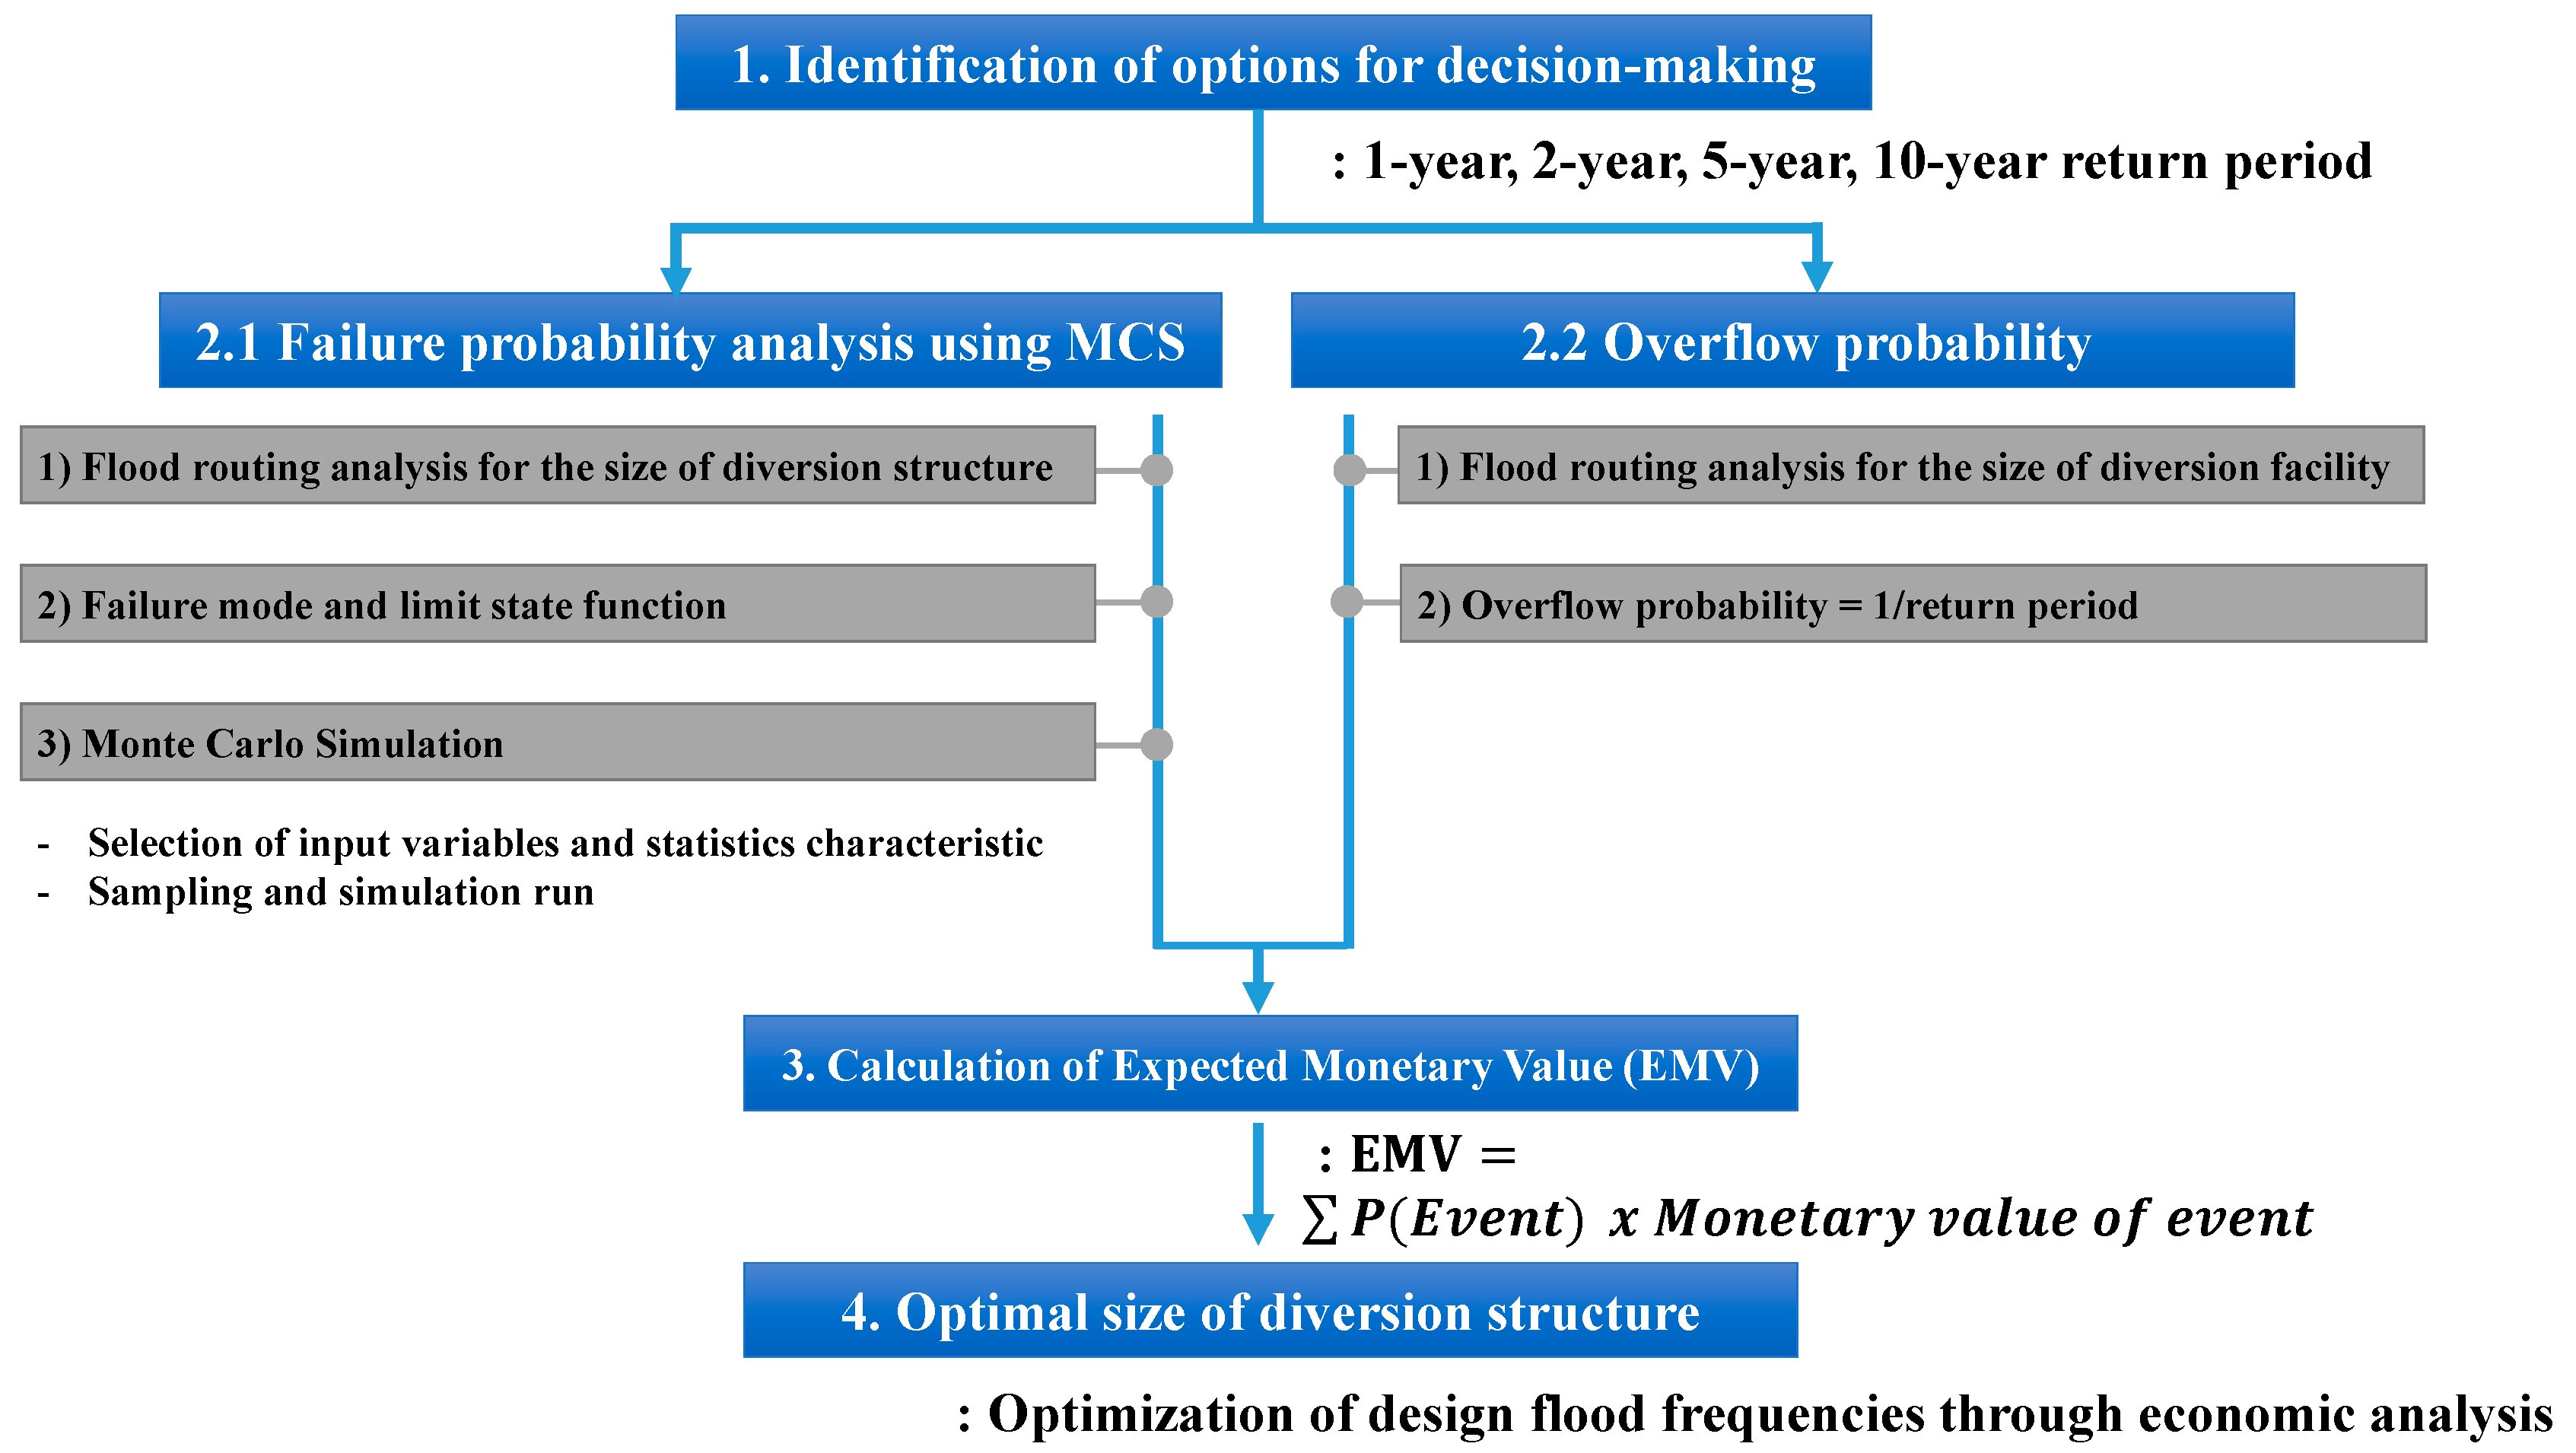
2.3. Methodology of Design Optimization

This study proposes a design optimization methodology for a diversion structure with a concrete-type cofferdam based on a risk-based least-cost design. In general, a diversion structure is installed to provide a dry workspace by blocking the inflow of river water during the construction of the main dam. In this regard, the hazards of the diversion structure are the destruction of the cofferdam (the structural risk) and the flow of water over the cofferdam (the functional risk). Both structural risk and functional risk should be considered when calculating the risk associated with a diversion structure. In this study, the probability of structural failure is calculated using the limit state function of a concrete cofferdam and MCS [6,7]. The variables considered in the limit state function were the dead load of the dam weight, the hydrostatic head water pressure, the uplift on the bottom, the silt pressure by sediment, and the seismic force. Detailed explanations can be found in Section 3.2.2. The probability of functional risk was calculated using the inverse of the return period. The expected cost was calculated using the EMV. Figure 2 shows the overview of the methodology for the design optimization of a diversion structure.

3. Application

3.1. Gulpur Hydropower Project

The Gulpur hydropower project to build a hydropower plant generating 102 MW of electricity began in January 2014. The project site is located on the Jhelum River near Gulpur in the Kotli District of Azad Kashmir, Pakistan. The site has a catchment area of 3648 km2 and average annual rainfall of 1280 mm; the average annual flow rate of the river is 125.3 m3/s. The cofferdam was made from concrete and the diversion tunnel has a horseshoe shape [8]. The diversion structure is illustrated in Figure 3. For deciding the size of the diversion structure, 1-, 2-, 5-, and 10-year floods were selected as the options to design flood frequency according to ICOLD design standard [1] and Korean dam design standard [2]. Hydrological data of the observed annual maximum flood discharge, curve of water level storage, and rating curve were used in the analysis.

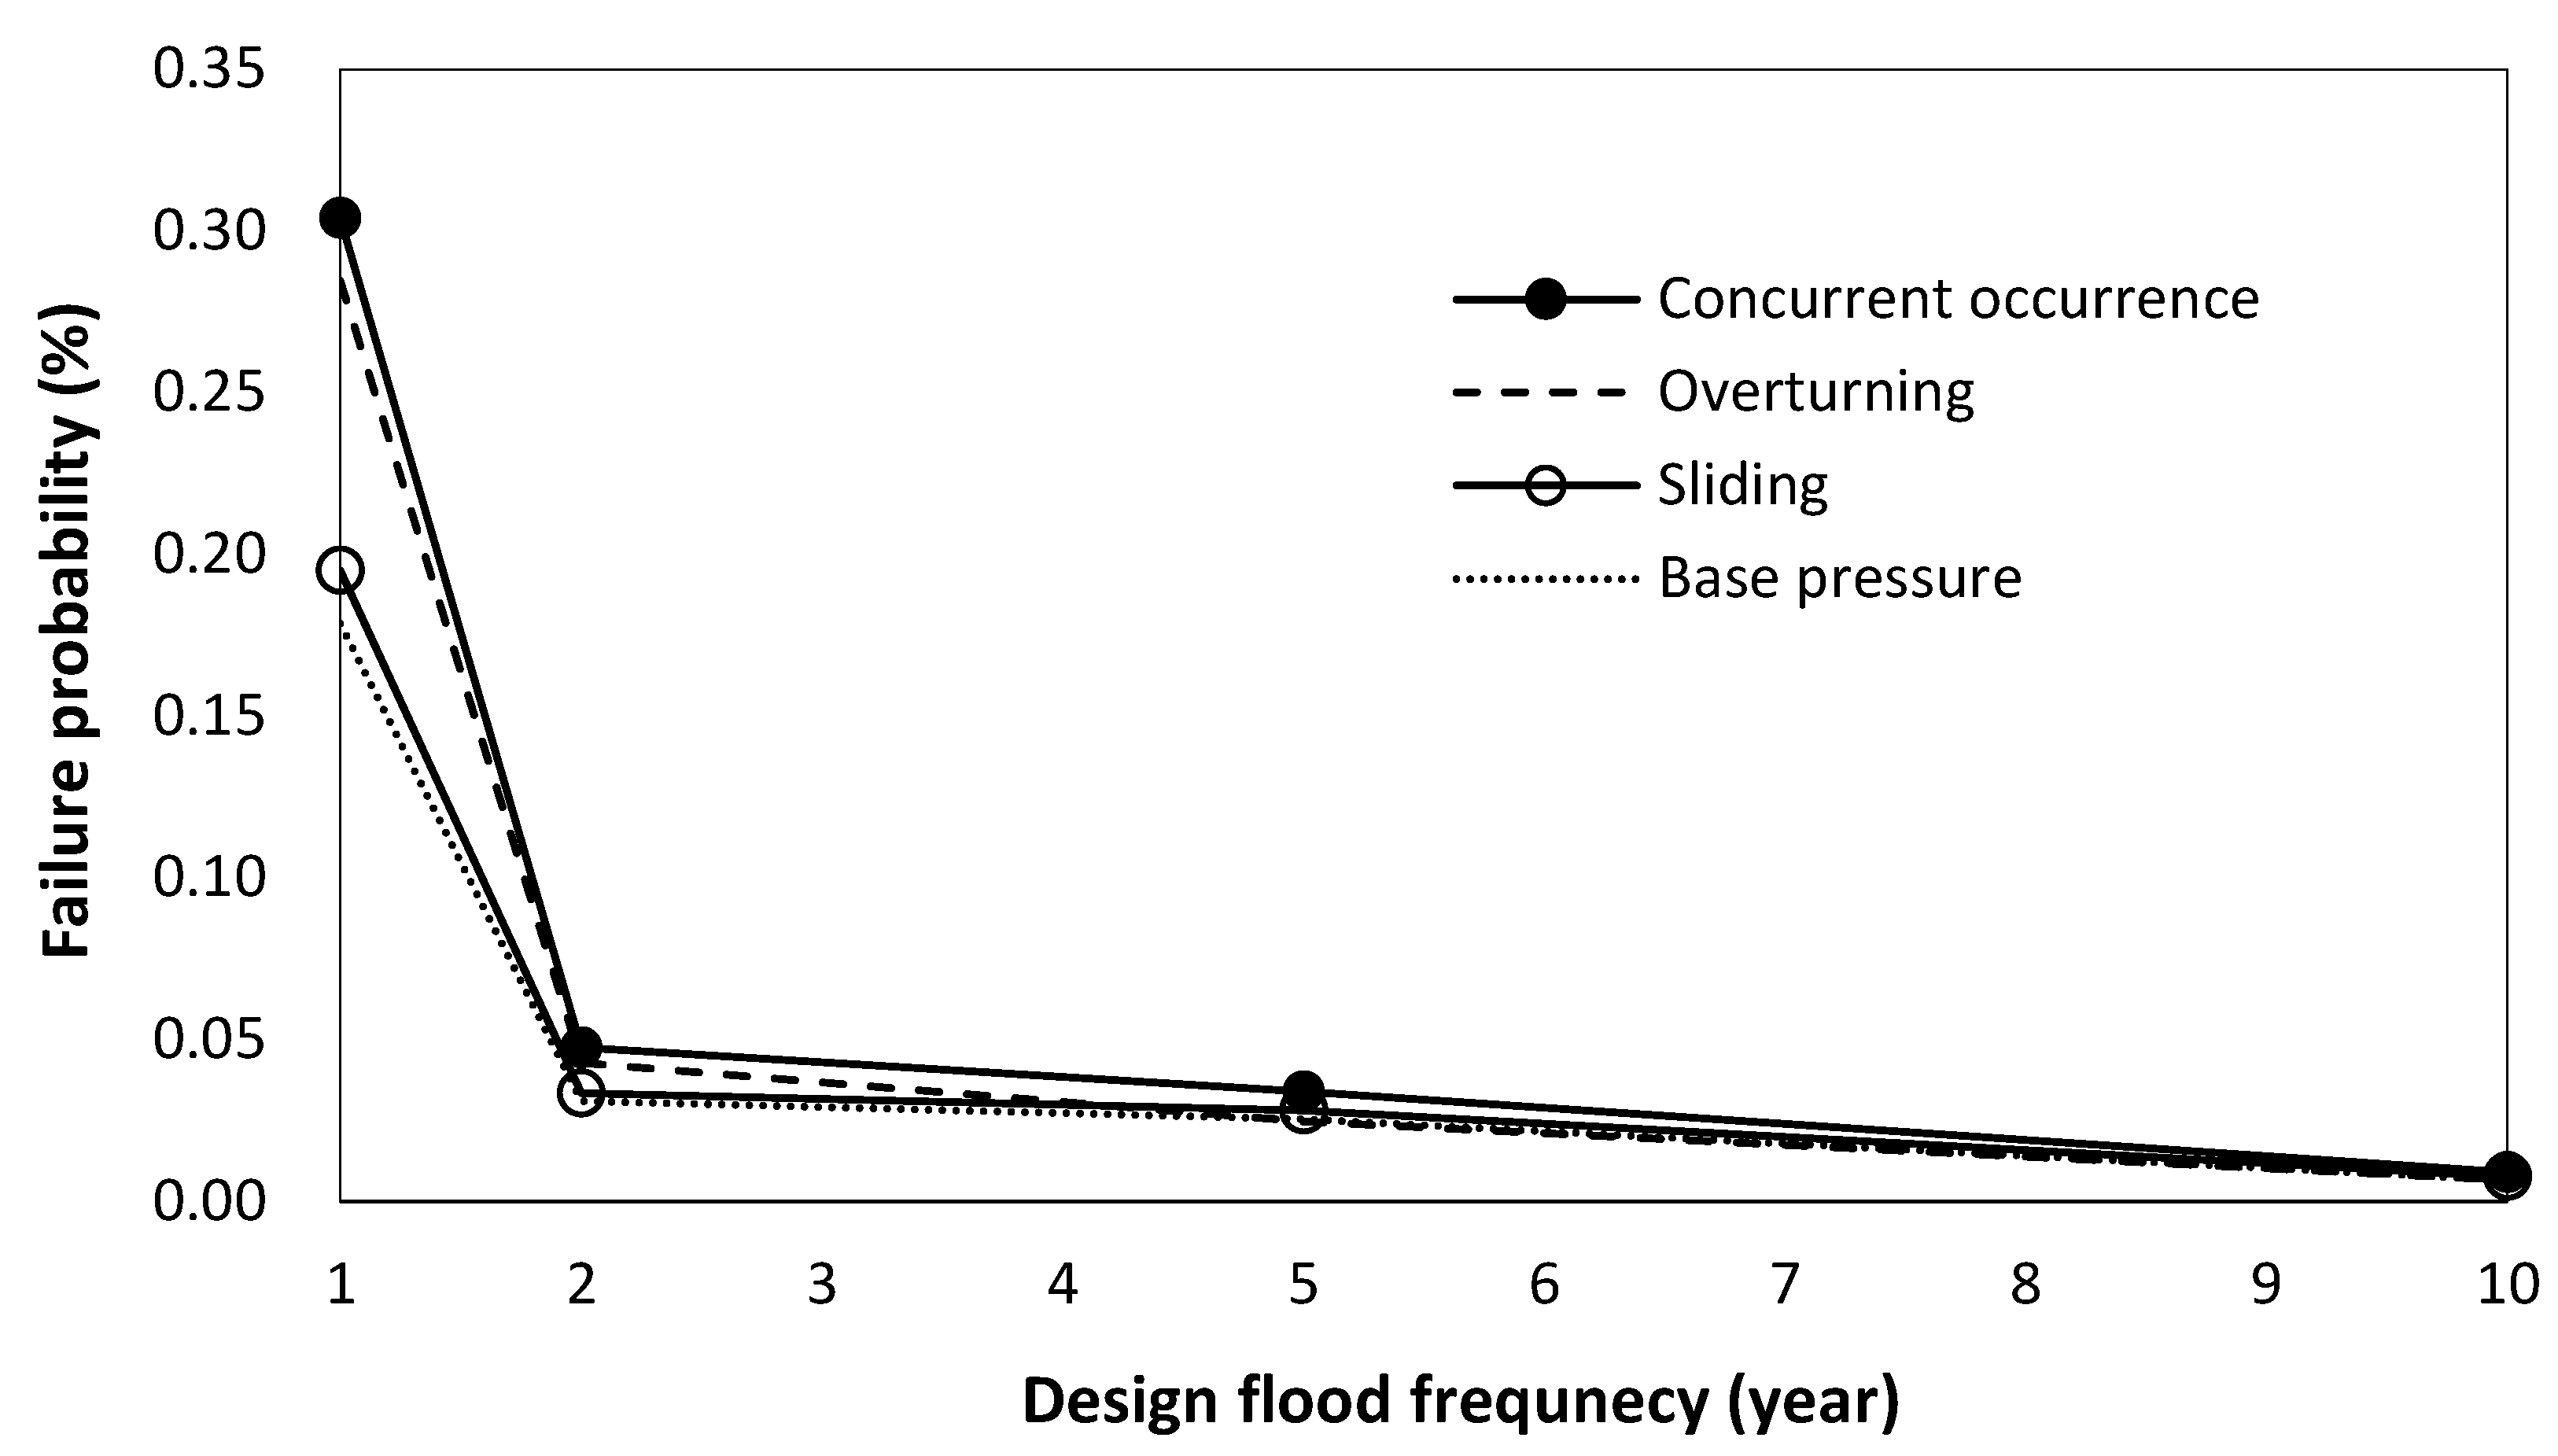
3.2. Failure Probability Analysis Using MCS

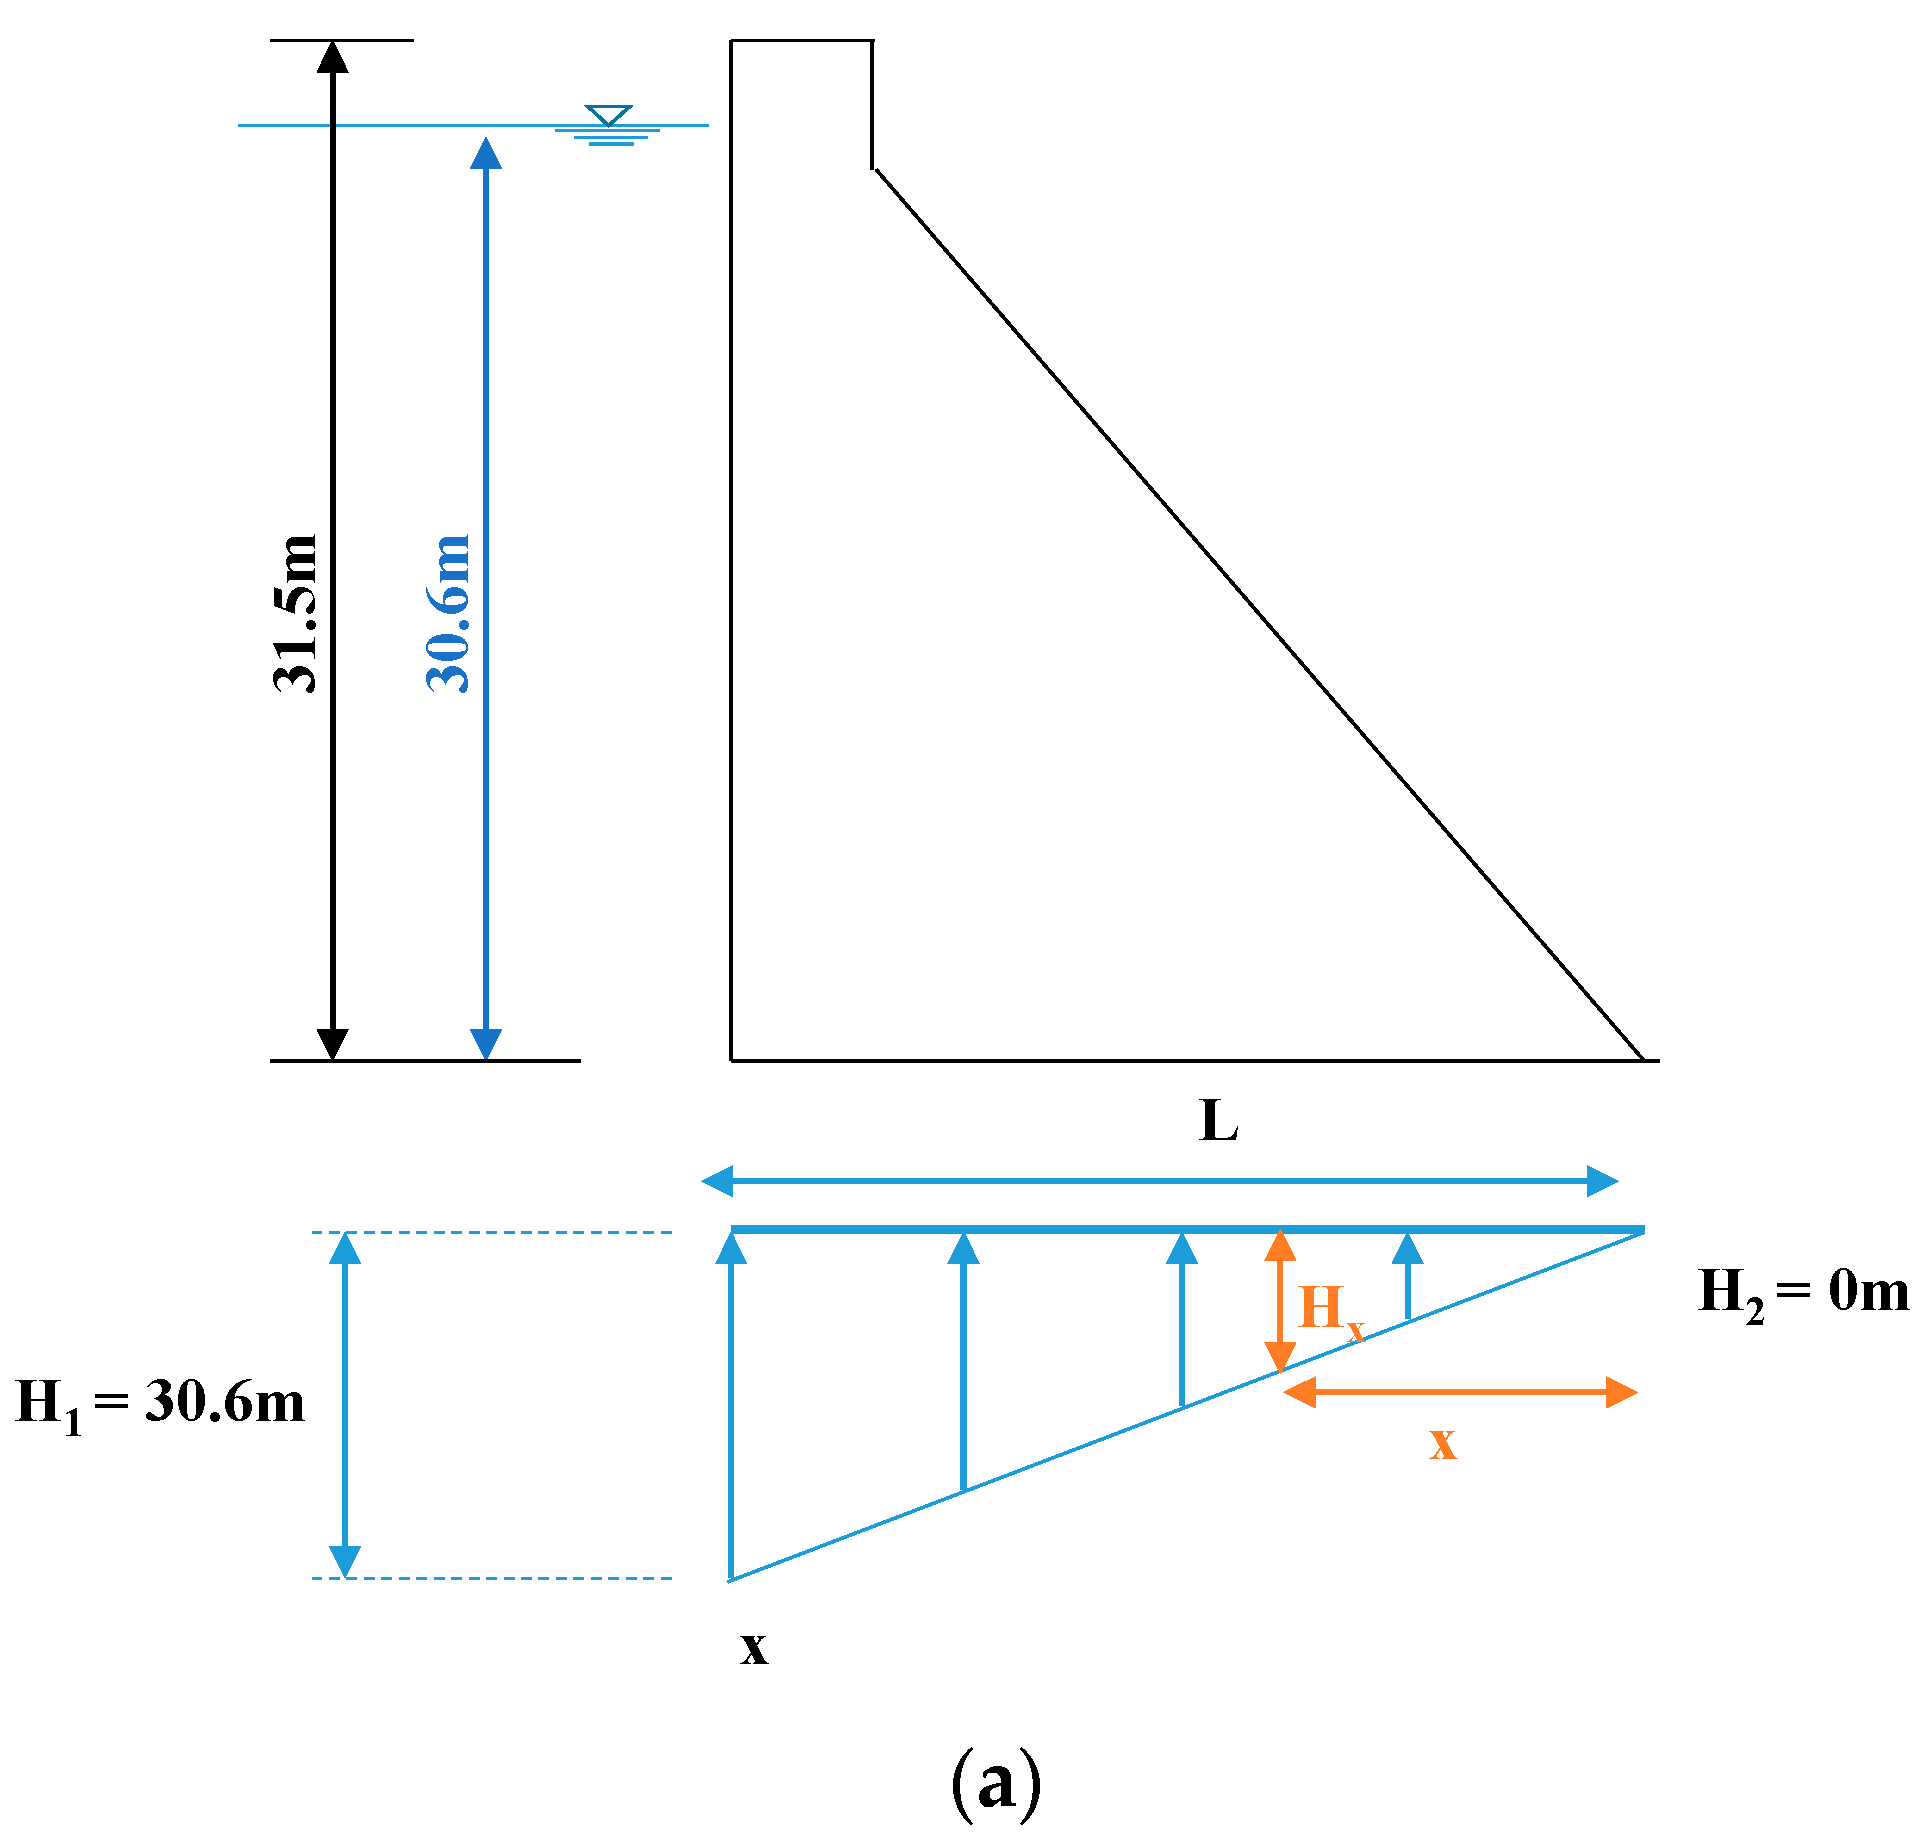
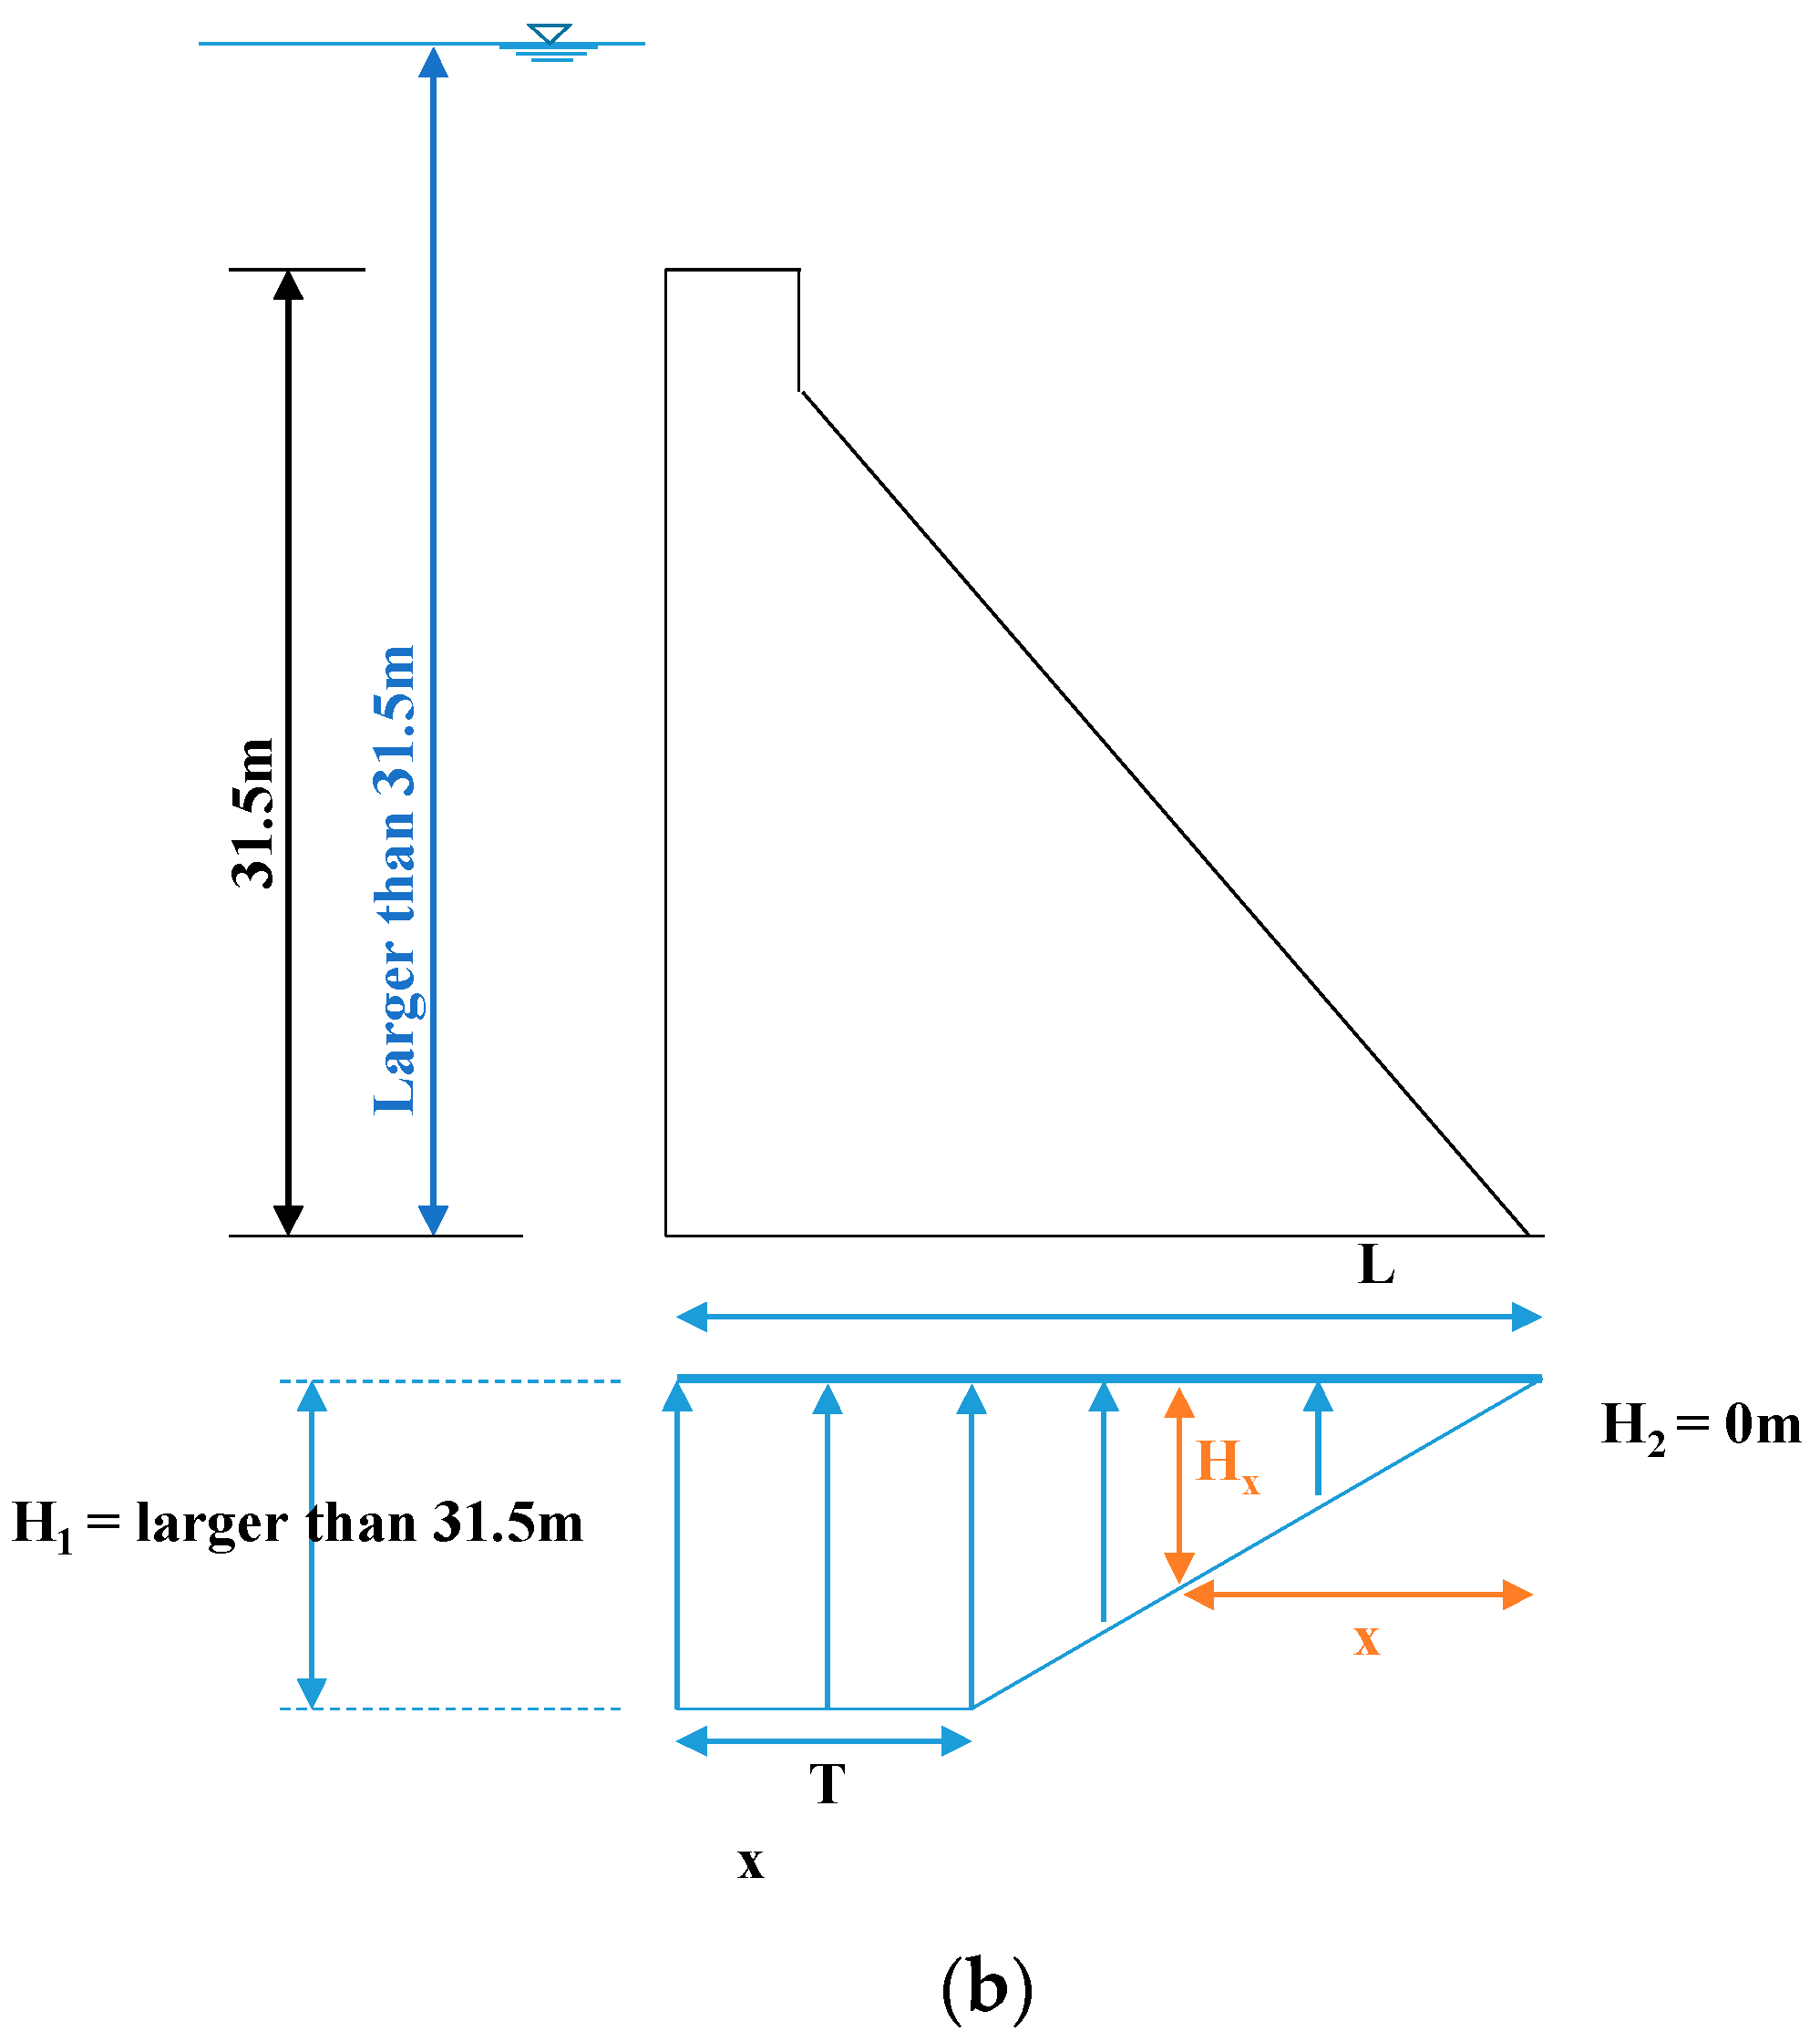
3.2.1. Flood Routing Analysis

Flooding routing analysis derives an outflow hydrograph from an inflow hydrograph for an upstream cofferdam with consideration of the elevation, storage, and discharge characteristics of the diversion tunnel. The conservation-of-mass equation is solved assuming that the outflow discharge and volume of storage are directly related. The diameter or the number of diversion tunnels and the height of the cofferdam are determined using flood routing analysis. In this paper, the diameter of the diversion tunnel is set at 10 m, which is the limit of full-face excavation, and the optimal combination of cofferdam height and the number of diversion tunnels in terms of construction cost is obtained. In addition, 1 m freeboard is included to determine the height of the upstream cofferdam. Using flood routing analysis, the optimal combination of the cofferdam height and the number of diversion tunnels are calculated as shown in Table 1.

3.2.2. Limit State Function

From a design point of view, a cofferdam can be regarded as a main dam with a low design flood frequency to determine the size of the cofferdam. Therefore, the limit state function for a cofferdam is utilized as that for a main dam. The failure mode is the process of failure occurrence and refers to the root cause and failure effect in risk analysis. Cho et al. proposed the failure modes of a main dam with concrete gravity type and their limit state functions based on numerous reviews in the domestic and international literature on dam failure cases and design standards [9]. The limit state function for overturning ( f o ) is defined as
f o = M r M o
where M r is the resistance moment and M o is the overturning moment. The limit state function for sliding ( f s ) is expressed as
  f s = S H = S ( N tan + c L )
where S is the resistance force, H is the horizontal force, is the angle of internal friction, c is the cohesion intercept, N is the resultant of forces normal to the assumed sliding plane, and L is the length of the base in compression for a unit strip of the dam. The limit state function for base pressure ( f b ) is expressed as
f b = σ a σ m a x
where σ a is the allowable bearing capacity on the foundation and σ m a x is the maximum applied basal pressure.
To analyze the limit state function, the related loads have to be calculated in advance. The related loads for the cofferdam are (1) the dead load of the dam weight, (2) the headwater pressure exerted by hydrostatic water pressure, (3) the uplift acting on the bottom of the dam, (4) the silt pressure activated by sediment deposition behind the dam, and (5) the seismic force developed by earthquake loading [10]. Among these loads, the headwater pressure and the uplift acting on the bottom should be modified because the cofferdam has a low design flood frequency; it means that a flood exceeding the design flood frequency can overflow a cofferdam during main dam construction. The loads are described in detail as follows:
(1)
Dead load.
The unit weight of concrete generally should be assumed to be 23 kN per cubic meter (kN/m3) in the design stage.
(2)
Headwater pressure.
External water pressure loads are to be applied to the structure using the upstream water level. When the overflow has occurred, the headwater pressure is higher than the cofferdam height as shown in Figure 4.
The hydrostatic pressure to the dam is a function of the water depth and the unit weight of water.
p w = γ w × h
where
p w : water pressure at depth “h” (kN/m2);
γ w : unit weight of water (10 kN/m3);
h : water depth (m).
(3)
Uplift pressure.
The uplift pressure resulting from headwater and tailwater has to be considered for stability analysis which exists through cross sections, at the bottom of the cofferdam. When overflowing, a zero-compression region can occur at the bottom of the cofferdam, especially in vicinity of the heel. So, the uplift pressure should be calculated both for the non-overflow case and the overflow case as shown in Figure 5.
The uplift pressures in Figure 5a,b have the following formulas, respectively
H x = H 2 + ( H 1 H 2 ) L
where
H 1   = 30.6 m (water depth at heel);
H 2 = 0 m (water depth at toe).
H x = H 2 + ( H 1 H 2 ) L T
where
H1 = larger than 31.5 m (water depth at heel);
H2 = 0 m (water depth at toe);
T = zero compression length.
(4)
Silt.
Silt pressures are considered in the design if suspended sediment measurements indicate that such pressures are expected.
(a)
Horizontal.
H s = C e × γ s h × d
where
H s : horizontal silt pressure at depth ‘d’ (kN/m2);
C e : horizontal silt pressure coefficient;
γ s h : unit weight of submerged horizontal silt (kN/m3);
d : depth of silt (m).
  • (b)
    Vertical.
H s v = γ s v × d
where
H s : vertical silt pressure at depth ‘d’ (kN/m2);
γ s h : unit weight of submerged horizontal silt (kN/m3);
d : depth of silt (m).
(5)
Earthquake forces.
The earthquake loading used in the design is based on design earthquakes and site-specific motions determined with a seismological evaluation. The seismic coefficient method of analysis should be used in determining the resultant location and sliding stability of dams. The seismic coefficient method is commonly known as the pseudo-static analysis. Earthquake loading is treated as an inertial force that is applied statically to the structure. The loadings are of two types (①) inertial force due to the horizontal acceleration of the dam and (②) hydrodynamic forces resulting from the reaction of the reservoir against the dam.
① Inertial of concrete for horizontal earthquake acceleration. The force required to accelerate the concrete mass of the dam is determined using the equation:
H 3 = K ( H 1 H 4 ) ( L X ) L + H 4
P e x = M a x = W g α g = W α
where
P e x : horizontal earthquake force (kN);
M : mass of dam (kg);
a x : horizontal earthquake acceleration (m/s2);
W : weight of dam (kN);
g : acceleration of gravity (m/s2);
α : seismic coefficient.
② The inertial of the reservoir water induces an increased or decreased pressure on the dam concurrently with concrete inertia forces. This force may be computed using the equation:
P w x = 7 12 K h γ w h 2
where
P w x : additional total water load down to depth ‘h’ (kN);
K h : horizontal seismic coefficient;
γ w : unit weight of water (9.8 kN/m3);
h : water depth.

3.2.3. Loadings and Combinations

Combinations of these loads for the limit state function analysis were also modified from that of the main dam design. Because the cofferdam is a temporary structure and is used only for 3~5 years during the main dam construction, the extreme cases such as Maximum Credible Earthquake and Probable Maximum Flooding are excluded from the combinations of these loads. Combinations of loads are presented in Table 2.

3.2.4. MCS

MCS was implemented by extracting randomly repeated variable values from a predefined probability distribution. The variables required for analyzing the structural failure of a diversion structure with a concrete cofferdam are loads and parameters related to overturning, sliding, and base pressure on the foundation. Specifically, the mass density of concrete, allowed support force of the dam foundations, friction angle, and adhesive force of the soil were selected as variables. The variables of the material properties of the deposit were height, mass density, and friction coefficient. The probability function, mean, and standard deviation of these variables were taken from previous studies [10,11,12] and presented in Table 3. Failure probabilities with a design flood frequency of 1-, 2-, 5-, and 10-year return periods were then calculated using MCS. The stability analysis for overturning, sliding, and base pressure on the foundations was performed 500,000 times after the sampling of random variables with predefined statistical characteristics. The calculation sheet for the stability analysis of the concrete cofferdam was built using Macro supported by Microsoft Excel. Additionally, data of the observed annual maximum discharge for 53 years were used to calculate the upstream water level in the flood routing analysis. The results of the probability of failure for overturning, sliding, base pressure, and concurrent occurrence are presented in Figure 6.

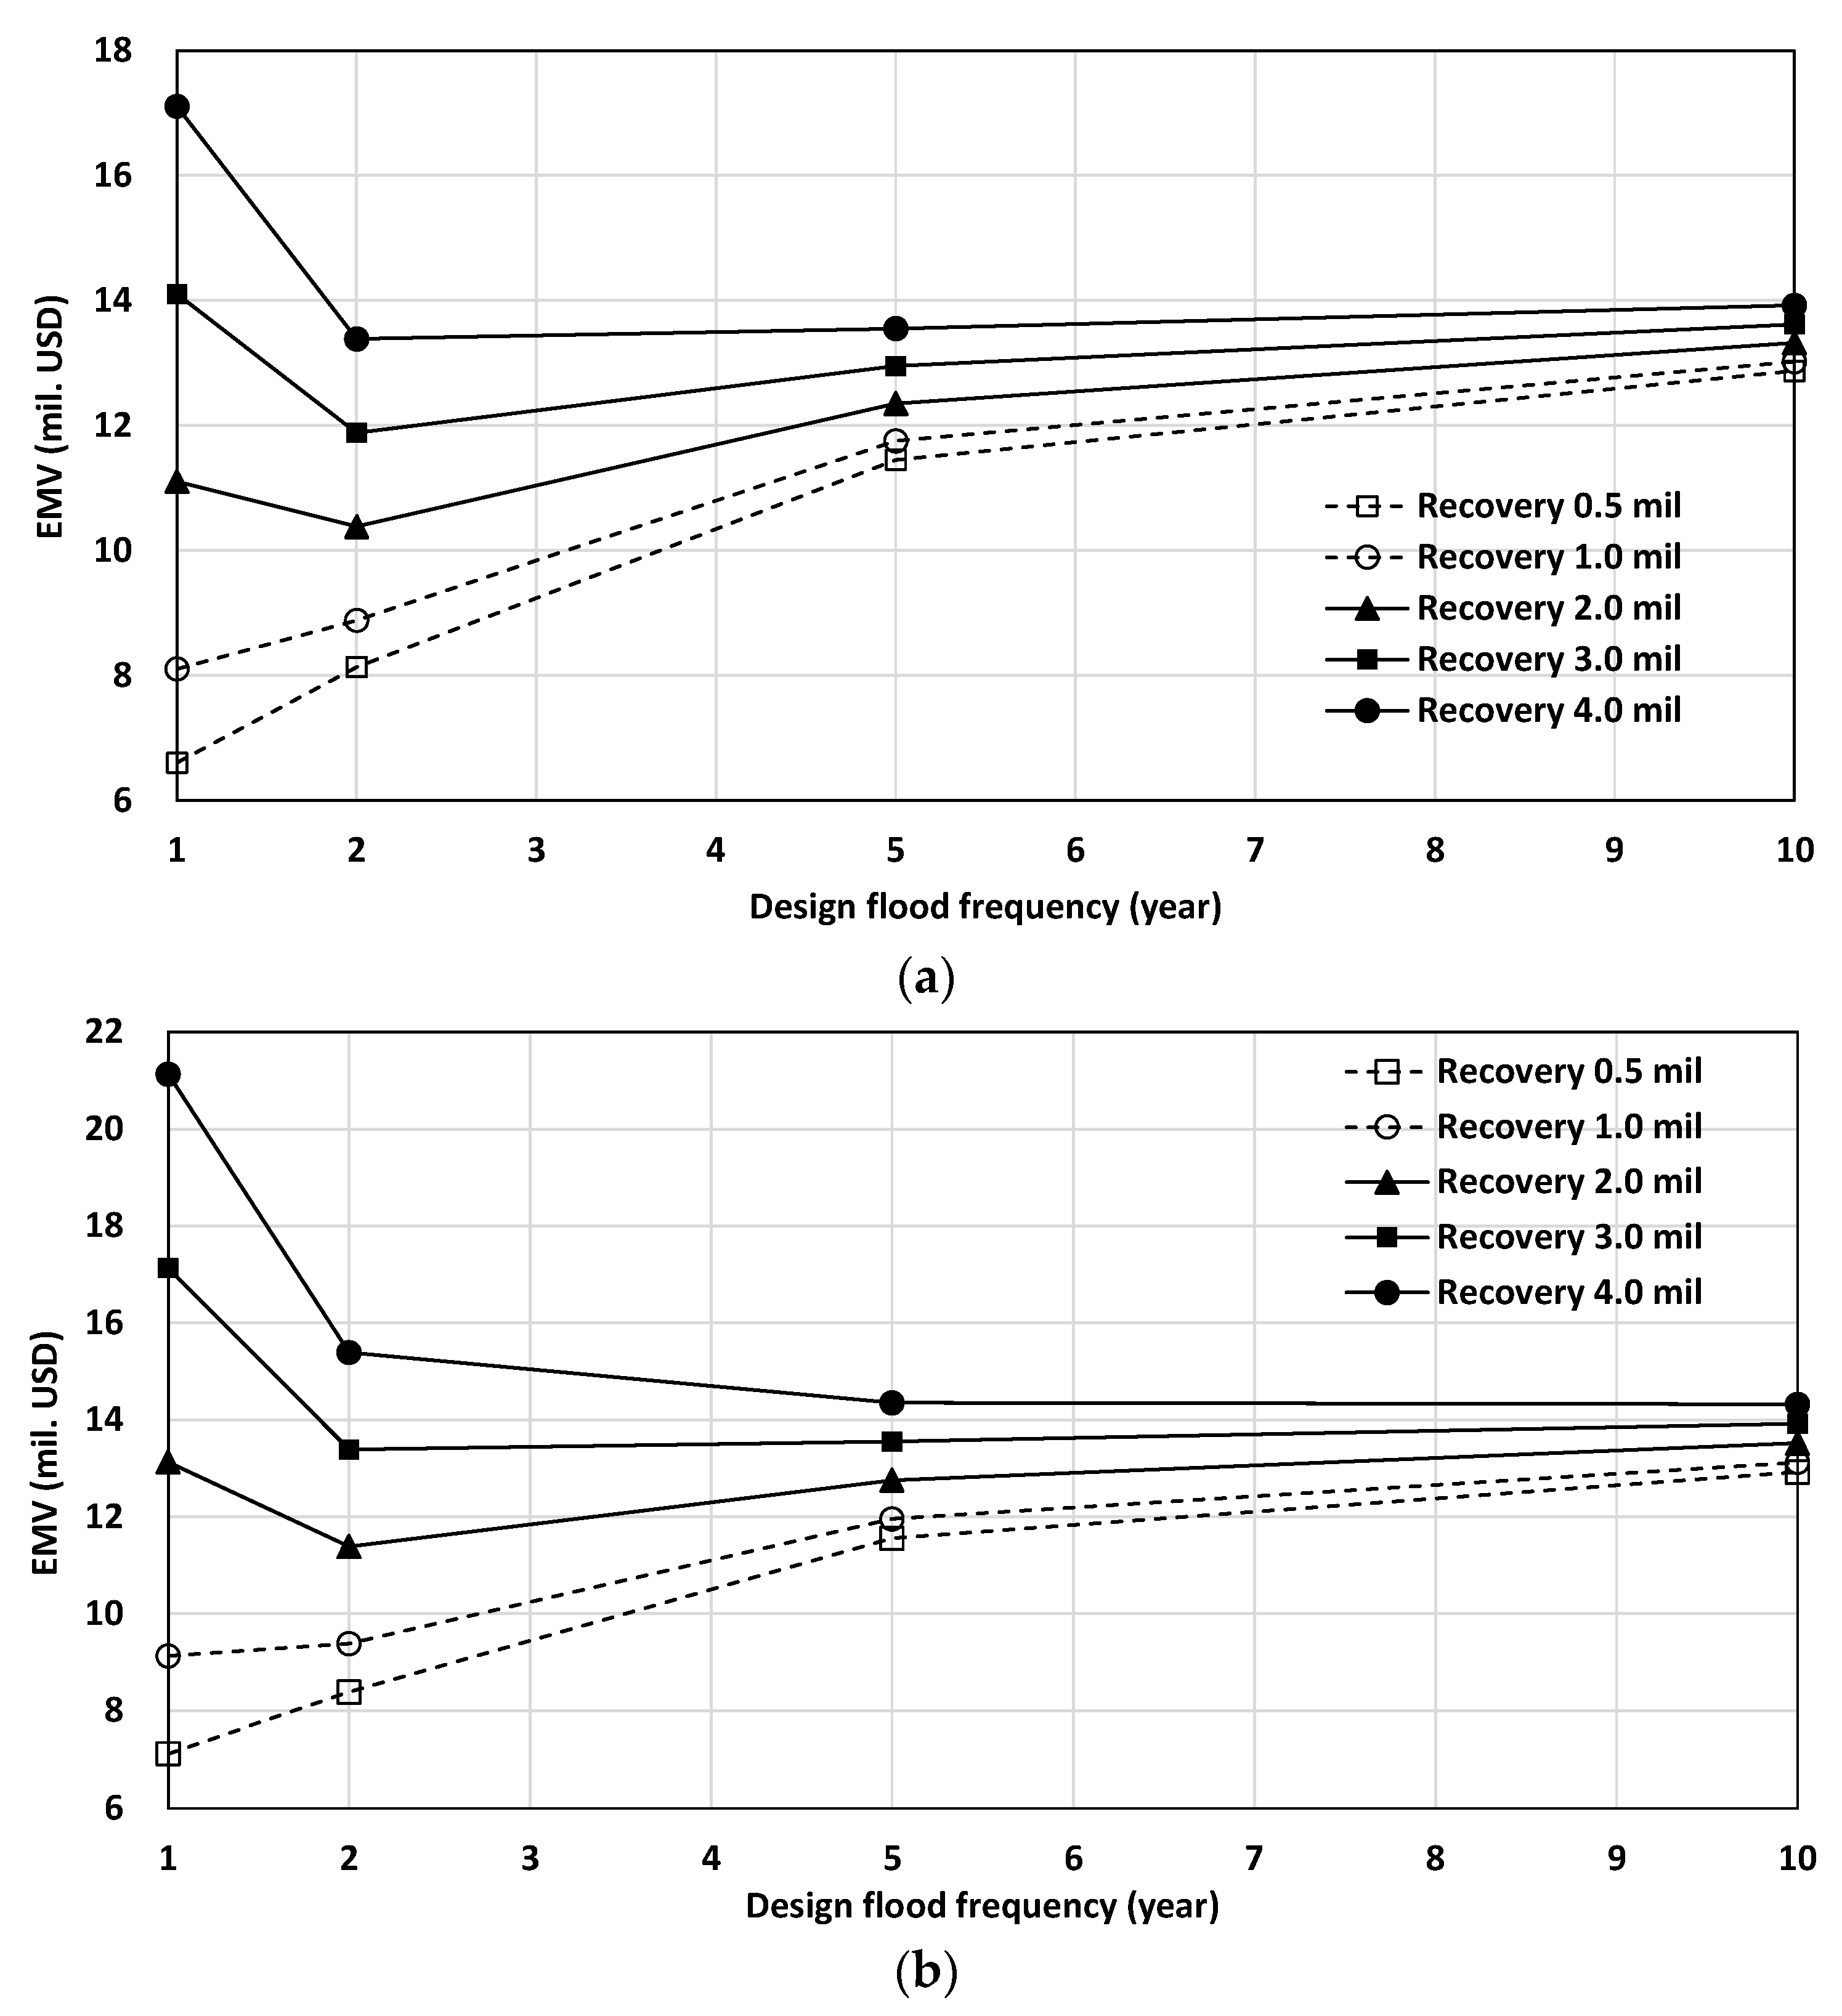
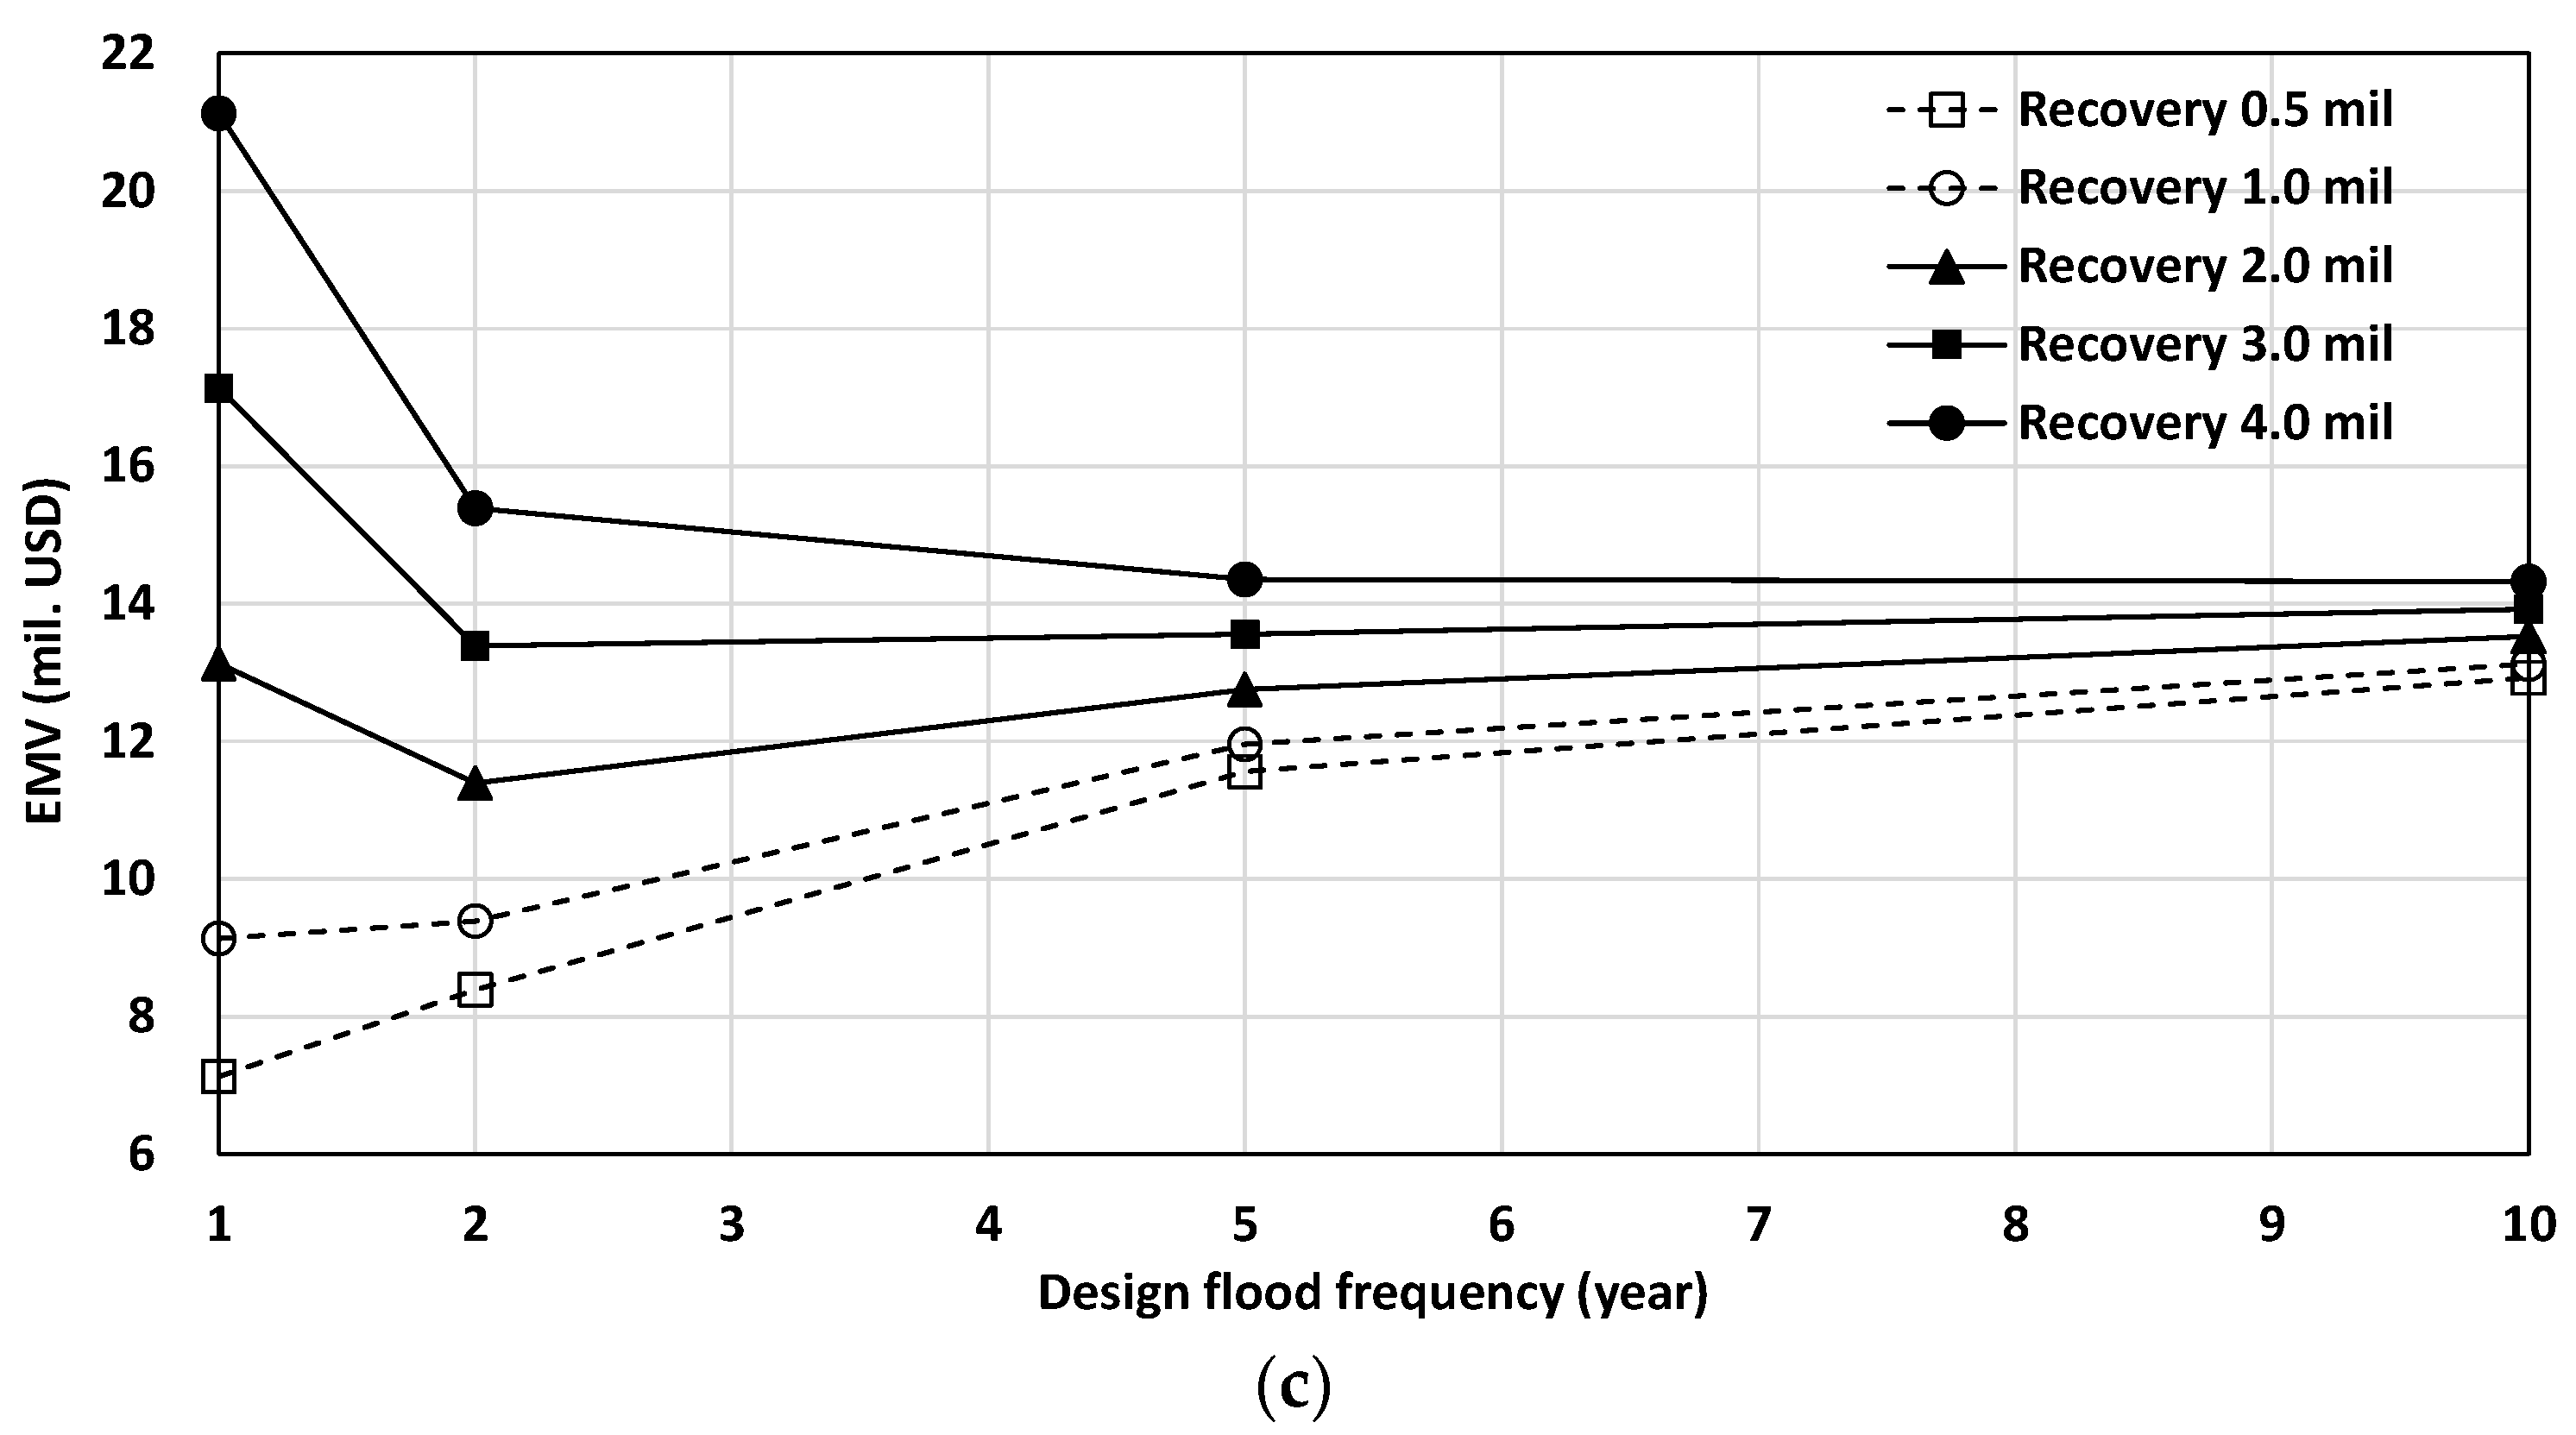
3.3. Calculation of EMV

When determining the optimal design flood frequency of the diversion structure, the individual risk should be quantified to make an optimal decision. The EMV is the total expected cost of the diversion structure with a 1-, 2-, 5- and 10-year flood frequency, including construction cost, re-construction cost, and delay LD (Liquidated Damage) with the failure probability and the recovery cost with the overflow probability.
The EMV is thus calculated as
EMV = Construction cost of diversion structure
                 + Failure probability of upstream cofferdam
                                                                        × [(Reconstruction cost of upstream & downstream cofferdams) + Delay LD]
                                                 + Overflow probability of upstream cofferdam × Recovery cost
The costs of the diversion tunnel and upstream/downstream cofferdam are considered as the construction cost of the diversion structure.
For failure probability, only the probability of destruction of the upstream cofferdam was considered because the downstream cofferdam is normally destroyed after destruction of the upstream cofferdam. For the re-construction cost, both the upstream and downstream cofferdam construction costs were considered.
For delay LD, if the upstream cofferdam was destroyed, it should be restored to construct the main dam. Therefore, the total construction period inevitably increased. In this paper, the delayed period for the re-construction was set as two months based on the construction schedule, and Delay LD was set as 1.5% of the total EPC cost.
The number of overflows during the construction period depends on the design flood frequency of the diversion structure. After overflow, the water stored in the working space for the main dam construction has to be pumped out and the sedimentation should be cleaned. In addition, some damages to the upstream/downstream cofferdam or on the equipment should be repaired. Accordingly, the costs for pumping out, cleaning, and repairing were considered as the recovery cost. Recovery cost varies according to construction condition, circumstances, and the proactive plan. In this paper, recovery cost was set as USD 0.5 mil., USD 1.0 mil., USD 2.0 mil., USD 3.0 mil., and USD 4.0 mil.

4. Results

Results of the EMV by the period of use of the diversion structure are shown in Figure 7. In Figure 7a, the optimal design flood frequency was 1 year for a recovery cost of USD 0.5 mil. and USD 1.0 mil. and 2 years for USD 2.0 mil.~4.0 mil. In Figure 7b, the optimal design flood frequency was 1 year for a recovery cost of USD 0.5 mil. and USD 1.0 mil., and 2 years for USD 2.0 mil. and USD 3.0 mil., and 10 years for USD 4.0 mil. In Figure 7c, the optimal design flood frequency was 1 year for a recovery cost of USD 0.5 mil., and 2 years for USD 1.0 mil. and USD 2.0 mil., and 5 years for USD 3.0 mil., and 10 years for USD 4.0 mil.
Based on these results, it can be concluded that the optimal design flood frequency is affected by recovery cost and the period of use. When recovery cost is high and the period of use is long, a larger design flood frequency is found to be optimal value. The reason why recovery cost and the period of use have significant influences on the design optimization is that the overflow probability is much larger than the failure probability. Namely, although delay LD and the reconstruction cost are relatively large, these do not affect to the optimal value of the design flood frequency. Therefore, the design flood frequency for the diversion structure should be determined based on recovery cost and the period of use of the diversion structure, which are estimated or determined in advance.

5. Discussion

From a designer’s point of view, the period of use is normally determined by the construction period of a main dam and thus, it is not within the control of the designer. However, the recovery cost can be managed by designers, and it can be minimized by applying a proactive plan such as an early warning plan or flood damage reduction plan, etc. Accordingly, after preparing a proactive plan and estimating the recovery cost, the design flood frequency for the diversion structure should be determined.
Future works are planned to investigate how to reduce the recovery cost by implementing proactive plans such as early warning plans, flood damage reduction plans, and protecting structures under construction to ensure economic viability. Additional risk analyses of the hydrology, hydraulics, and diversion tunnel will help evaluate the overall risk.

6. Conclusions

This paper proposes a design optimization methodology for a diversion structure using a risk-based least-cost design process and risk analysis. The methodology considers the structure failure of the upstream cofferdam as a structural risk and the overflow of the upstream cofferdam as a functional risk. The failure probability was calculated using the limit state function for non-overflow and overflow cases and MCS. The overflow probability was calculated using the inverse of the return period. The optimization was performed using the lowest EMV, which encompasses the construction cost, the reconstruction cost, and the delay LD with the failure probability and the recovery cost with the overflow probability.
The above methodology was applied to a case study of the Gulpur hydropower project on the Jhelum River near Gulpur in the Kotli District of Azad Kashmir, Pakistan. The results showed that the optimal design flood frequency was 1 year for a recovery cost of USD 0.5 mil., 1~2 year for a recovery cost of USD 1.0~2.0 mil. with a usage period of 3, 4, and 5 years of the diversion structure. Furthermore, 2~10 years was the optimal value for a recovery cost of USD 3.0~4.0 mil. Consequently, it could be suggested that the optimal design flood frequency should be increased as the recovery cost and usage period of the diversion structure increase. The reason why recovery cost and the period of use have significant influences on the design optimization is that the overflow probability is much larger than the failure probability. Although the failure probability decreases as the design flood frequency of the diversion structure increases, the decrease is negligible. Therefore, the delay LD and the reconstruction cost do not affect the EMV, and the design flood frequency for the diversion structure should be determined based on recovery cost and the period of use of the diversion structure, which are estimated or determined in advance.

Author Contributions

Writing—original draft, W.H.; Writing—review & editing, T.E.; Supervision, C.G.S. All authors have read and agreed to the published version of the manuscript.

Funding

This work was supported by a Incheon National University Research Grant awarded in 2019.

Informed Consent Statement

Not applicable.

Conflicts of Interest

The authors declare no conflict of interest.

References

  1. Bulletin 48a: River Control during Dam Construction; ICOLD (International Commission on Large Dams): Paris, France, 1986.
  2. Dam Design Standard; KWRA (Korea Water Resources Association): Daejeon, Republic of Korea, 2011.
  3. Tung, T.K.; Yen, B.C.; Melching, C.S. Hydrosystems Engineering Reliability Assessments and Risk Analysis; McGraw-Hill: New York, NY, USA, 2006. [Google Scholar]
  4. Afshar, A.; Rasekh, A.; Afshar, M.H. Risk-based optimization of large flood-diversion systems using genetic algorithms. J. Eng. Optim. 2009, 41, 259–273. [Google Scholar] [CrossRef]
  5. Rasekh, A.; Afshar, A.; Afshar, M.H. Risk-Cost Optimization of Hydraulic Structures: Methodology and Case Study. J. Water Resour. Manag. 2010, 24, 2833–2851. [Google Scholar] [CrossRef]
  6. Bulletin 130: Risk Assessment in Dam Safety Management; ICOLD: Paris, France, 2005.
  7. Yen, B.C.; Tung, Y.K. Some recent progress in reliability analysis for hydraulic design. In Reliability and Uncertainty in Hydraulic Design; ASCE: New York, NY, USA, 1993. [Google Scholar]
  8. Gulpur Hydropower Project Detailed Design Report; MiraPower Ltd.: Islamabad, Pakistan, 2016.
  9. Cho, S.J.; Shin, S.W.; Sim, S.H.; Lim, J.Y. Failure Probability Assessment for Risk Analysis of Concrete Gravity Dam under Flood. J. Korean Soc. Saf. 2011, 31, 58–66. [Google Scholar]
  10. EM 1110-2-2200; Gravity Dam Design. USACE (United States Army Corps of Engineers): Paris, France, 1995.
  11. Peyras, L.; Royet, P.; Deroo, L.; Albert, R.; Becue, J.; Aigouy, S.; Bourdarot, E.; Loudiere, D.; Kovarik, J. French Recommendations for Limit-State Analytical Review of Gravity Dam Stability. Eur. J. Environ. Civ. Eng. 2008, 12, 1137–1164. [Google Scholar] [CrossRef]
  12. Evaluation of Strength Test Results of Concrete; ACI 214R-02; American Concrete Institute: Farmington Hills, MI, USA, 2002.
Figure 1. Risk analysis.
Applsci 13 02903 g001
Figure 2. Design optimization of a diversion structure.
Applsci 13 02903 g002
Figure 3. Diversion structure.
Applsci 13 02903 g003
Figure 4. Headwater pressure when overflowing.
Applsci 13 02903 g004
Figure 5. Uplift pressure (a) without a zero-compression region and (b) with a zero-compression region.
Applsci 13 02903 g005aApplsci 13 02903 g005b
Figure 6. Failure probability.
Applsci 13 02903 g006
Figure 7. EMV of diversion structure according to the period of use (delay LD: 1.5%). (a) Period of use: 3 years. (b) Period of use: 4 years. (c) Period of use: 5 years.
Applsci 13 02903 g007aApplsci 13 02903 g007b
Table 1. Flood routing analysis.
Design FloodNo. of
Diversion Tunnels
Upstream Water Level
(EL. m)
[a]
Freeboard (m)
[b]
Dam Crest
(EL. m)
[a + b]
Cofferdam Height
(m)
YearsDischarge
(m3/s)
117612502.01.0503.031.5
241874507.61.0508.637.1
564994517.91.0518.947.4
1080844521.61.0522.651.1
Table 2. Loading conditions and combinations for the cofferdam.
ConditionDeadloadHeadwaterTailwaterUpliftSiltEarthquake
Unusual loading condition
(construction)
OXXXXX
Usual loading condition
(normal operating)
ONormal operating levelMinimumOO
(I.F.) *
X
Unusual loading condition
(flooding discharge)
OStandard project floodOOO
(I.F.)
X
Extreme loading condition
(construction with an OBE **)
OXXXXOBE
Unusual loading condition
(normal operation with an OBE)
ONormal operating levelMinimumAt pre-earthquake levelO
(I.F.)
OBE
* I.F.: If applicable. ** OBE: Operational Basis Earthquake, which has a 50% chance of being exceeded within 100 years (or a 144-year return period).
Table 3. Selected random variables.
Random VariableProbability
Distribution
Distribution Parameters
Mass density of concreteNormal
  • Mean: 2226 kg/m3
  • Standard deviation: 226 kg/m3
Friction angle of soilNormal
  • Mean: 45°
  • Standard deviation: 7.2°
Adhesion force of soilLog normal
  • Mean: 1.77 × 10⁶ Pa
  • Standard deviation: 1.24 × 10⁶ Pa
Height of deposit soilUniform
  • El.480.4–494.4 m
Mass density of deposit soilNormal
  • Mean: 2000 kg/m3
  • Standard deviation: 200 kg/m3
Friction coefficient of depositNormal
  • Mean: 30°
  • Standard deviation: 2.4°
Disclaimer/Publisher’s Note: The statements, opinions and data contained in all publications are solely those of the individual author(s) and contributor(s) and not of MDPI and/or the editor(s). MDPI and/or the editor(s) disclaim responsibility for any injury to people or property resulting from any ideas, methods, instructions or products referred to in the content.

