Article

Model-Based Approach for the Semi-Automatic Analysis of Collagen Birefringence in Polarized Light Microscopy

by
Alessandro Cristoforetti
1,
Michela Masè
1 and
Flavia Ravelli
1,2,*
1
Laboratory of Biophysics and Translational Cardiology, Department of Cellular, Computational and Integrative Biology—CIBIO, University of Trento, 38123 Trento, Italy
2
CISMed—Centre for Medical Sciences, University of Trento, 38122 Trento, Italy
*
Author to whom correspondence should be addressed.
Appl. Sci. 2023, 13(5), 2916; https://doi.org/10.3390/app13052916
Submission received: 30 December 2022 / Revised: 16 February 2023 / Accepted: 21 February 2023 / Published: 24 February 2023
(This article belongs to the Section Applied Biosciences and Bioengineering)

Abstract

:

Featured Application

The proposed model-based approach can support and quicken the analysis of collagen birefringence from a large set of polarized light microscopy images for medical applications in different tissue types in the presence of structural diseases.

Abstract

Collagen is a key determinant of physio-pathological processes in different tissues. Polarization light microscopy (PLM) of histological sections is the gold-standard for birefringence-based collagen quantification, but post-session image analysis can be time-consuming and subjective. We propose an efficient semi-automatic computational approach for the quantification of collagen content from the analysis of PLM images of birefringent histological sections. The method is based on a physical model of light-sample interaction and birefringence effect production. It combines the information of bright and dark-field PLM images to segment the luminal region and detect the birefringent signal associated with collagen in the tissue region. User input is limited to the selection of a threshold on an image subset and the supervision of the processing, enabling fast analysis of large datasets. Modeling of the birefringence signal compensates for variability factors related to sample processing and image acquisition, such as section thickness variability and nonuniform illumination and transmittance. As a proof-of-concept, the method was applied to human cardiac tissue PLM images, acquired in 14 cardiac surgery patients with different arrhythmic profiles. The method was able to detect a significantly larger amount and higher heterogeneity of fibrosis in the atrium of patients with as opposed to without atrial fibrillation (p < 0.05). The proposed method can be a valid aid to quicken and reinforce the analysis of large sets of PLM images for the quantification of collagen distribution in different tissues and pathologies.

1. Introduction

Collagen is the most abundant protein in mammals and the main component of connective tissue. It plays a crucial physiological role in sustaining and providing structural integrity to healthy tissues [1]. In pathological conditions associated with inflammatory responses, collagen production can become deregulated, resulting in fibrosis formation. Fibrosis is a pathological process characterized by fibroblast proliferation and remodeling of the extracellular matrix in composition and quality with the over-secretion of collagen [2,3]. Fibrotic remodeling can lead to distorted tissue architecture and impaired tissue function in several organ and tissue types. Accumulating evidence indicates myocardial fibrosis is a common pattern and an important player in different cardiac diseases, such as myocardial infarction, hypertensive heart disease, different types of cardiomyopathies, and cardiac arrhythmias [4,5]. Focusing on the last aspect, fibrosis can favor the onset and maintenance of cardiac arrhythmias by affecting conduction and impulse formation, where its effects depend not only on the amount, but also on the texture and spatial distribution of fibrosis [5,6,7]. A quantitative and detailed description of fibrosis/collagen spatial distribution in cardiac tissue is thus fundamental for a complete understanding of cardiac arrhythmia mechanisms and structure-function relation, and for the optimization of therapeutic approaches [5].
Histological morphometric evaluation of tissue samples remains the gold standard for cardiac tissue characterization and collagen assessment. Polarized light microscopy (PLM) is commonly used to analyze these samples, since collagen is optically anisotropic and intrinsically birefringent (i.e., its refractive index depends on the polarization and propagation direction of the incident light), appearing bright when viewed in polarized light [8,9,10]. The birefringence characteristics of collagen can be enhanced by specific staining procedures, such as picrosirius red staining. Picrosirius red is an anionic dye, which can stably bind along cationic collagen fibers and provide additional birefringence by virtue of its anisotropic molecular organization [11,12,13].
Subsequent quantification of collagen from PLM images is traditionally performed by manual stereology approaches [14], which are however strictly dependent on the skills of the operator and can be particularly time consuming when a large number of sections need to be processed. On the other hand, extrinsic variability factors, related to either the realization and processing of tissue slices or to limitation in the microscope set-up and imaging sessions can produce artifacts and further affect the quantification of collagen content.
Few methods for the semi-quantitative and/or semi-automatic estimation of collagen content in histological sections have been previously proposed [9,10,15,16,17,18,19], but there is still a lack of rigorous computational approaches, which should couple objective and fast quantification of collagen with control of confounding factors.
Based on these considerations, in this paper, we propose a model-based semi-automatic analysis framework for the quantification of collagen content from PLM images of histological tissue sections. The framework combines the information in bright-field and dark-field polarized light images to perform a semi-automatic segmentation of cardiac tissue from the background and of collagen from cardiac tissue, providing the collagen fraction as an output. The user tasks are limited to the initial choice of a segmentation threshold on a limited number of sections, the supervision of the processing, and the final check of segmentation results, with significant reduction of processing time. In addition, the framework is enforced by an underling physical model of polarized light–sample interaction and birefringence signal production, which reduces the effects of confounding factors, such as variability in tissue slice thickness, illumination spatial inhomogeneity, and temporal variability of the light source. As a proof-of-concept application, we applied our method to human cardiac tissue samples and showed its capability to point out differences in fibrosis content and distribution in patients with different cardiac rhythms, i.e., patients with and without atrial fibrillation (AF).

2. Materials and Methods

The analysis framework aims at the fast and accurate quantification of collagen content from the birefringent signal in samples imaged in polarized light. The framework is based on a physical model of polarized light–sample interaction for a microscope in polarizer–sample–analyzer configuration, which is described in Section 2.1.
The processing pipeline, schematized in Figure 1 and detailed in Section 2.2, Section 2.3, Section 2.4 and Section 2.5, received both bright-field and dark-field images as input and performed a semi-automatic extraction of collagen density in the tissue, independent from inter-plate experimental variability. The method addressed major variable factors, including sample tissue area and section thickness, variations of light source intensity and exposure time, and nonuniform field exposure in the captured image (i.e., vignetting effect), which can originate either from back illumination or transmission through the microscope optics. The illustrative application of the method to cardiac tissue samples is described in Section 2.6, where we tested the possibility of analyzing multiple sample batches acquired with the same protocol by imposing a common collagen-detection threshold, thus minimizing human input.

2.1. Birefringence Physical Model

Birefringent materials are characterized by optical anisotropy, since their refractive index varies depending on the direction of incident light with respect to the material main optical axes. The anisotropy of the refractive index can be represented by an ellipsoid named indicatrix. The intersection of the indicatrix with the plane perpendicular to the incident light is an elliptical section, which defines two polarization axes: one where the refractive index is larger (slow axis) and one where it is smaller (fast axis). The components of the electrical field along these axes undergo a relative phase shift:
δ = 2 π λ Δ n · L
where Δ n is the difference of the refractive indices and L is the light path, i.e., the sample thickness.
A common configuration to study the birefringence effect in microscopy is to place the sample between two linear polarizers (polarizer–sample–analyzer configuration, LP-S-LP). The polarized light emerging from the sample has its components along the birefringent axes with a phase shift δ . When the projections of these components on the transmission axis of the analyzer recombine, the phase shift causes an interference, which modulates the intensity of the light emerging from the analyzer. The light intensity collected from an LP-S-LP configuration for ideal polarizers is computed as in [20]:
I = I o 2 T s [ cos 2 χ sin 2 ϕ sin 2 ( ϕ χ ) sin 2 δ 2 ]
where I o is the intensity of the source unpolarized light, T s is the sample transmittance, χ is the angle between the polarizer and analyzer transmission axes, ϕ is the angle between the sample slow axis and the polarizer transmission axis. A Beer–Lambert–Bouguer linear attenuation model with attenuation coefficient μ can be assumed for the sample transmittance:
T s = e μ L
However, real polarizers are characterized by a transmittance along the transmitting axis T 1 smaller than unity and a transmittance along the extinction axis T 2 larger than zero [21]. The light contribution transmitted along any of the four possible combinations of principal axes of the analyzer and polarizer can be obtained from Equation (2) changing the angles χ and ϕ by π 2 accordingly. The total light intensity is then computed as:
I = I o 2 T s [ ( T 1 2 + T 2 2 ) cos 2 χ + 2 T 1 T 2 sin 2 χ ( T 1 2 + T 2 2 2 T 1 T 2 ) sin 2 ϕ sin 2 ( ϕ χ ) sin 2 δ 2 ] = I o T s [ T p cos 2 χ + T c sin 2 χ ( T p T c ) sin 2 ϕ sin 2 ( ϕ χ ) sin 2 δ 2 ]
where T p and T c are the transmittances of the polarizer pair in parallel and crossed configurations, respectively. In this model, T p and T c are considered images that include the inhomogeneous field illumination caused by the microscope filters and optics, while the light source I o is a scalar.
When the polarizer and the analyzer are parallel ( χ = 0 ) Equation (4) reduces to:
I p = I o T s [ T p ( T p T c ) sin 2 2 ϕ sin 2 δ 2 ] = I o T s [ T p ( T p T c ) K s sin 2 δ 2 ]
where the effect of sin 2 2 ϕ in a biological sample is expressed through the modulation image K s 1 , which is dependent on the local prevalent direction of the birefringent fibers in the tissue.
Similarly, when the polarizer and the analyzer are perpendicular ( χ = π 2 ), Equation (4) reduces to:
I c = I o T s [ T c + ( T p T c ) K s sin 2 δ 2 ]

2.2. Data Preprocessing

The analysis software was developed in Matlab programming language (The MathWorks, Inc., Natick, MA, USA). The structure of the analysis framework is depicted in the block diagram of Figure 1. The input data of the software consisted in picrosirius red stained tissue section images acquired in PLM, using a LP-S-LP configuration. For a batch of samples composed by N sections, bright-field images, A p i   i = 1 N , and the dark-field images, A c i   i = 1 N , were obtained setting the polarizers in parallel and crossed configurations, respectively. For each batch, two white images in parallel ( A p 0 ) and crossed ( A c 0 ) configurations were also acquired with a white plate inserted (i.e., without any sample). The images were saved as uncompressed 16 bit/channel TIFF files, in RGB photometric representation (i.e., each image corresponded to a mxnx3 matrix). The light intensity, or radiant flux, associated with the image files was obtained by converting the original RGB images into double precision, linearizing the pixel intensity by gamma correction, and normalizing for the exposure times, according to:
I p i = A p i γ t p , I c i = A c i γ t c                 i = 0 N
where t p and t c are the image exposures in the parallel and crossed configurations, respectively, and a camera gamma encoding of 1 γ was assumed. The use of the radiant flux, instead of the original images, allowed us to control for the variability related to variations in exposure time among different acquisition sessions (see Section 2.6). The linearized light intensity images I p i and I c i were subsequently processed to obtain a signal representative of collagen density in the tissue, independent from experimental confounding variables, such as spatial nonuniformity of illumination in each plate and variations of light source intensity, sample section thickness, and tissue area between different plates.
Figure 1. Block diagram of the model-based collagen segmentation framework. The framework input data are bright-field and dark-field tissue images. Both the bright- and dark-field images concur to compute the tissue mask (masktisi), the transmittance signal ( T s i ), the average optical thickness ( μ ( r ) L i ), and the grayscale collagen signal ( S c o l i ), which is thresholded to obtain the collagen mask (maskcoli). The tissue and collagen masks are combined to obtain the collagen fraction (ci) as output. See text for intermediate step details.
Applsci 13 02916 g001

2.3. Tissue Segmentation, Transmittance, and Optical Thickness Estimation

The first phase of the processing consisted in the segmentation of the image region corresponding to the tissue from the luminal space (or background), and the computation of the average optical thickness of the sample to be used for subsequent signal normalization.
The isolation of the tissue was obtained by an automatic single-threshold segmentation of a mxnx3 RGB image B i , which was proportional to the i -th sample transmittance image T s i . B i was obtained from both parallel and crossed polarized images by using Equations (5) and (6) to compensate for the effects of nonuniform illumination and birefringence. First, the nonuniform illumination was quantified for parallel and crossed configurations by interpolation of the corresponding linearized white images, I p 0 and I c 0 , acquired at the beginning of each microscopy imaging session. The interpolation yielded the mxnx3 smooth profiles P p 0 and P c 0 , representing the field illumination cleaned from high frequency noise and acquisition artifacts of the original white images. The interpolation was performed for each channel by least square regression with a base of two-dimensional Legendre polynomials up to order 8. The order of the polynomials was empirically chosen to capture the low-frequency trend of white-image illumination, while removing other artifacts. Legendre polynomials were preferred to the monomial base to avoid numerical overflow and allow convergence of the solver.
The image B i , corresponding to the i -th plate, was then defined for each RGB channel k by the following equation:
B i ( k ) = I o i ( k ) I o 0 ( k ) T s i ( k ) = I p i ( k ) + I c i ( k ) P p 0 ( k ) + P c 0 ( k )
where the second equality results from applying Equations (5) and (6) on the analyzed images I p i and I c i and the white profiles P p 0 and P c 0 (where δ = 0 and T s = 1 ). I o 0 and I o i are 1 × 3 vectors representing the RGB light intensity for the white and i-th plate acquisition, respectively. The element-by-element division by the profile matrices corrected the luminance nonuniformity and eliminated the dependence from the polarizer transmittances, so that B i resulted proportional to T s i minus variations of light source during the microscopy session.
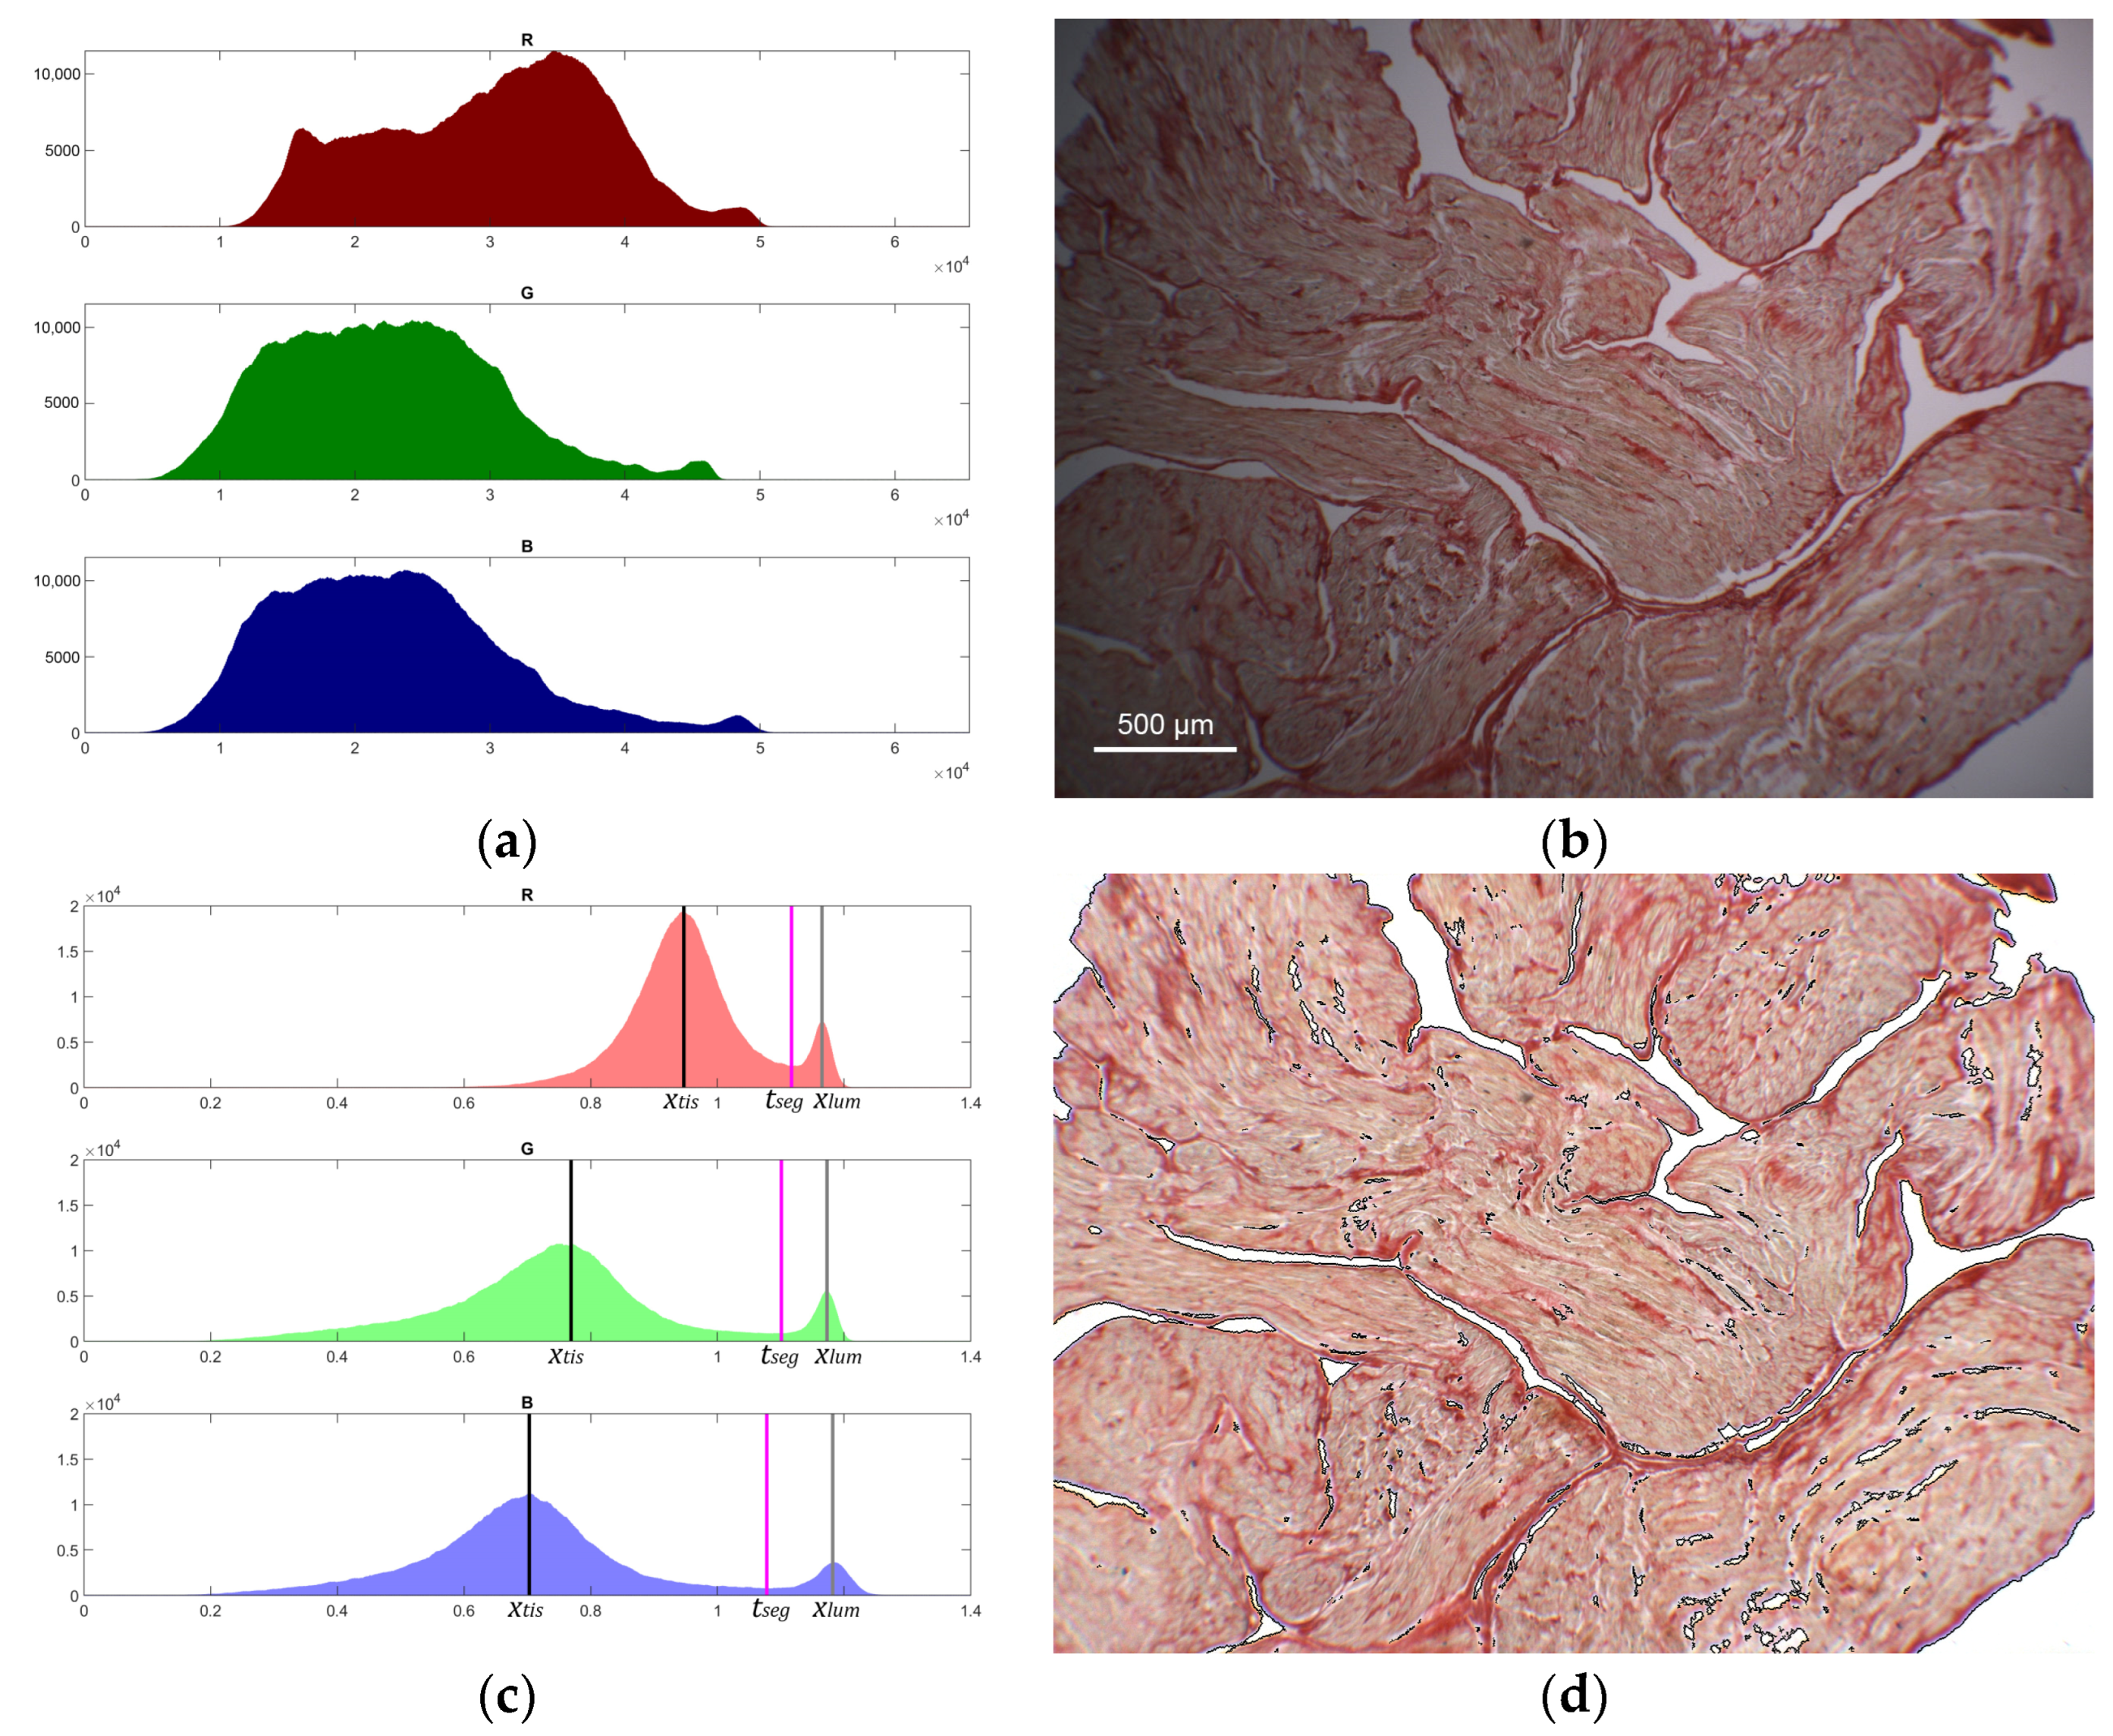
The segmentation of tissue from luminal space relied on a background/foreground separation method based on the histogram shape for each RGB channel of B i . The histogram function h ( x ) was reconstructed by binning the intensity values of each channel and applying a Gaussian smoothing kernel. A bin width of 0.001 and a Gaussian sigma of 0.005 were chosen as a compromise between location accuracy and robustness against noise. The analysis took advantage of the bimodal trend of the histogram function, where the first broader peak corresponded to the tissue and the second peak to the background. The threshold was detected in correspondence of the deepest valley between the two peaks of the histogram, as shown in Figure 2. Specifically, for each separating threshold candidate t in the histogram domain, the maxima m 1 and m 2 of the left and right histogram sides were detected at intensity values x 1 and x 2 , respectively:
m 1 = max x < t h ( x ) = h ( x 1 )             m 2 = max x t h ( x ) = h ( x 2 )
The optimal segmentation threshold t s e g ( k ) was determined for each channel k = r , g , b as the value of t that maximized the depth function:
d ( t ) = min ( m 1 , m 2 ) h ( t )
with the constraint x 2 0.8 · p 99 ( B i ) , where p 99 is the 99-th percentile of the distribution.
In correspondence of the threshold value t s e g , the positions of the tissue and lumen peaks were then set at x t i s = x 1 and x l u m = x 2 , respectively.
The automatic detection was supervised by an operator with the possibility of manual adjustment, if required. The binary tissue mask, m a s k t i s i , was finally defined for values of B i less than t s e g in all the three channels:
m a s k t i s i = k = r , g , b B i ( k ) t s e g ( k )
Since the sample transmittance is unitary in the lumen, T s i was calculated by white balancing B i according to the coordinates x l u m of the background peak, i.e., assuming I o i I o 0 = x l u m in Equation (8). Finally, the mean optical thickness in the tissue area was estimated using Equation (3) on the red channel of T s i :
μ ( r ) L i = ln T s i ( r ) m a s k t i s i
The optical thickness of the red channel was chosen as a good indicator of the section thickness, L i , since the red channel is minimally affected by picrosirius red staining.

2.4. Tissue Birefringence Quantification

The birefringence effect was separated from the effects of the source light intensity, the sample transmittance, and the microscope system transmittance, combining Equations (5) and (6) to obtain:
K s i sin 2 δ i 2 = T p + T c T p T c I c i I p i + I c i T c T p + T c I c i I p i + I c i T c T p = I c i I p i + I c i P c o P p o
where the approximation was justifiable for T c T p , and the ratio T c T p in the last equality was obtained from the regularized white images P c o and P p o , where no sample was present ( δ = 0 and T s = 1 ).
The expression in Equation (13) was then normalized with respect to the mean optical thickness μ ( r ) L i , calculated in Equation (12), to reduce the effects of sample thickness variations. The normalization led to the mxnx3 RGB birefringence image:
S b i r i = 1 ( μ ( r ) L i ) 2 ( I c i I p i + I c i P c o P p o ) K s i ( π μ ( r ) λ Δ n i ) 2
where the approximation used the first term of the Taylor expansion for sin 2 δ 2 ( δ 2 ) 2 . Under the assumptions that μ ( r ) varied minimally among plates and sin 2 δ 2 1 (see Section 3.3), the image S b i r i could be considered mainly dependent on the birefringent properties of the tissue (i.e., the anisotropy and orientation of the refraction index) for different visible wavelengths, minus a multiplicative constant unaffected by inter-plate experimental variability.

2.5. Collagen Content Quantification

The grayscale collagen signal was defined as the mean of the RGB channels of the birefringence signal S b i r i :
S c o l i = S b i r i ( r ) + S b i r i ( g ) + S b i r i ( b ) 3
where S c o l i is a mxnx1 matrix. The S c o l i images of a subset of plates were inspected by the operator to define a unique threshold, t c o l   , to be applied for the identification of the tissue with a significative collagen content (see Section 2.6). The threshold was then applied to all the S c o l i   i = 1 N , detecting the pixels of the tissue area considered rich in collagen:
m a s k c o l i = ( S c o l i t c o l ) m a s k t i s i
The percentage of collagen in the sample was finally computed as the ratio of the pixel count in the area of collagen tissue and the total tissue area:
c i = 100 m a s k c o l i m a s k t i s i

2.6. Proof of Concept Application of the Framework to Cardiac Histological Sections

As a proof-of-concept application, the analysis framework was applied to a database of bright-field/dark-field images of picrosirius red-stained atrial tissue sections, obtained in a group of 14 patients (age 69.1 ± 10.1 years, 3 female), who underwent a cardiac surgery intervention. The investigation was approved by the Ethical Committee for Clinical Experimentation of the Provincial Agency for Health Services of the Autonomous Province of Trento (N.6/2012) and conformed to the principles outlined in the declaration of Helsinki. All patients gave written informed consent. In each subject, atrial specimens of few mm2 area were excised from the right atrial appendage during heart cannulation for extracorporeal circulation (surgical waste) and embedded in paraffine. Epicardial and endocardial surfaces were identified, and the outmost and innermost layers (~200 um) of the samples were removed. 15 longitudinal sections of ~5 µm thickness were cut, in each patient, along the mid-wall using a rotary microtome (Leica RM2245; Leica Biosystems, Milan, Italy). Tissue sections were stained with 0.1% solution of Sirius Red F3BA (Direct Red 80, CI 35780; Sigma Aldrich, Milan, Italy) according to previously reported protocols [7], and mounted with a drop of mounting medium and a glass cover slip. Picrosirius red-stained sections were examined by light microscopy (DMIL microscope combined with DFC420 camera, Leica, Germany; 4× magnification, 0.1 numerical aperture). Images were acquired using a LP-S-LP setup, both in parallel (bright-field) and crossed (dark-field) filter configurations. For each tissue section, a single field (3.6 × 2.7 mm2) was randomly selected within the entire tissue area and acquired in both modalities, resulting in 15 bright-field and 15 dark-field images in each patient. A total of 420 images (210 in bright-field and 210 in dark-field) were acquired from the overall population and submitted to the proposed analysis framework. Information about the microscopy camera acquisition setting was obtained from the metadata of the image files. The exposure times were chosen in each session to obtain an optimal dynamic range and to avoid overexposure. The exposure times were 6.0 ± 0.9 [3.3–6.8] ms and 114.3 ± 12.7 [94.5–139.4] ms for the bright ( t p ) and dark-field images ( t c ), respectively. Gamma encoding was γ = 1. Original images had a resolution of 2592 × 1944 pixels, with a pixel size of 1.39 µm, and were subsequently downsized to 1296 × 972 pixels by 2 × 2 pixel binning for further processing. Before performing the overall analysis, the common threshold t c o l for collagen segmentation was determined based on the analysis of a subset of 56 images (2 sections per patient, yielding 28 bright-field and 28 dark-field images in the overall population). In each S c o l i image of the subset, the threshold value to identify collagen was manually defined by an expert biologist based on visual inspection. The appropriateness of high-collagen region segmentation was evaluated by the operator by comparing it with both the stained illumination-corrected bright-field image and the processed dark-field image and considering the visual appearance of myocardial fibrosis patterns. To avoid any prior-knowledge bias among the subsequent analysis of images, images were anonymized and randomized, with each selection blind with respect to the threshold numerical value. The common threshold t c o l was defined as the average of the threshold values. The range of threshold values assigned during the procedure was used for the sensitivity analysis described at the end of this Section.
The capability of the analysis framework to point out fibrotic content differences associated with the presence of different cardiac conditions was tested. To this aim, patients were classified based on their arrhythmic profile, as sinus rhythm (SR, age: 67.0 ± 13.0 years, 7 patients, 1 female) and atrial fibrillation (AF, age: 71.1 ± 6.7 years, 7 patients, 2 females), and the mid-wall content of fibrosis was compared in the two groups. Specifically, the amount of fibrosis in each subject was robustly estimated as the mean content over the 15 tissue sections (i.e., biological replicates). Fibrosis heterogeneity/variability among different sections in each patient was quantified by the standard deviation of the content over the 15 sections. A sensitivity analysis was performed to evaluate the effects of changes in the threshold t c o l on collagen values and collagen differences between groups. Threshold values were changed within the range assigned during the threshold optimization step, to reproduce potential differences in threshold assignment with different images and/or operators. Collagen distributions were recalculated for each threshold value for the complete image database.

2.7. Statistical Analysis

Categorical variables were expressed as numbers or percentages. Continuous variables were expressed as mean ± standard deviation (SD) or median [IQR] according to data normality (Shapiro–Wilk test). The presence of statistical differences between the amount and heterogeneity of fibrosis in the SR versus AF group was evaluated by a non-paired t-test or Mann–Whitney test, as pertinent. A p-value < 0.05 was considered statistically significant. All the analyses were performed in Matlab (The MathWorks, Inc., Natick, MA, USA).

3. Results

3.1. Illumination Profile, Tissue Segmentation, and Transmittance Computation

The initial step of the framework was the processing of the white images, acquired at the beginning of each acquisition session, which were interpolated to estimate the illumination profile of the sample. The light intensities of the acquired white images in bright-field ( I p 0 ) and dark-field ( I c 0 ) presented a relative standard deviation with respect to the mean >20% and >30%, respectively. The images P p 0 and P c 0 obtained after interpolation presented a reduced variability, with a relative residual standard deviation with respect to the mean of <0.5% and <10% for bright-field and dark-field images, respectively. The correlation coefficient between the original white images and the respective interpolated profiles was >0.99 and >0.90 for bright-field and dark-field cases, respectively. Thus, the interpolant function preserved the low-frequency trend of the illumination field, while reducing high-frequency noise and artifacts, which were especially relevant for the dark-field white images characterized by a lower signal-to-noise ratio.
Following the processing of the white images, the analysis proceeded with the processing of the histological images. The first step of the procedure is exemplified in Figure 3 for a single section image. The RGB histograms (Figure 3a) of the original image A p i (Figure 3b) had values spread across the whole intensity range because of the nonuniform field illumination, which manifested as a decrease in exposure in the periphery of the image (i.e., vignetting effect). In the histograms, the values corresponding to the luminal space formed a low and wide peak with overlap with tissue values, which hindered an automatic threshold-based separation between tissue and lumen values. The white-balanced image B i (Figure 3d) was obtained applying Equation (8), which reduced the non-uniform illumination of the lumen. Following white-balance correction, RGB histograms (Figure 3c) presented a bimodal distribution with a sharp lumen peak, suitable for automatic analysis. The correction reduced the variability of the lumen pixels for [R G B] channels (expressed as relative standard deviation with respect to the mean) from [25.3 23.9 24.9] % in A p i to [2.6 3.2 6.1] % in B i . The peaks corresponding to lumen and tissue areas were automatically detected (Figure 3c), allowing normalization of B i with respect to the lumen RGB levels. The white-balanced image represented the transmittance T s i of the sample (Figure 3d). The luminal space was segmented from the tissue area of the image by thresholding at the minimum level ( t s e g ) between the peaks. The obtained tissue mask m a s k t i s i is contoured in black in Figure 3d. In the shown case, the tissue area covered 90.1% of the image area. The automatic segmentation assumes that the lumen/background peak is separated by a valley from the tissue values, and this also requires a minimal lumen area in the image. In the analyzed database, the condition was met in all the images, which presented a luminal area > 5% in the field of view.

3.2. Birefringence Analysis and Collagen Fraction Quantification

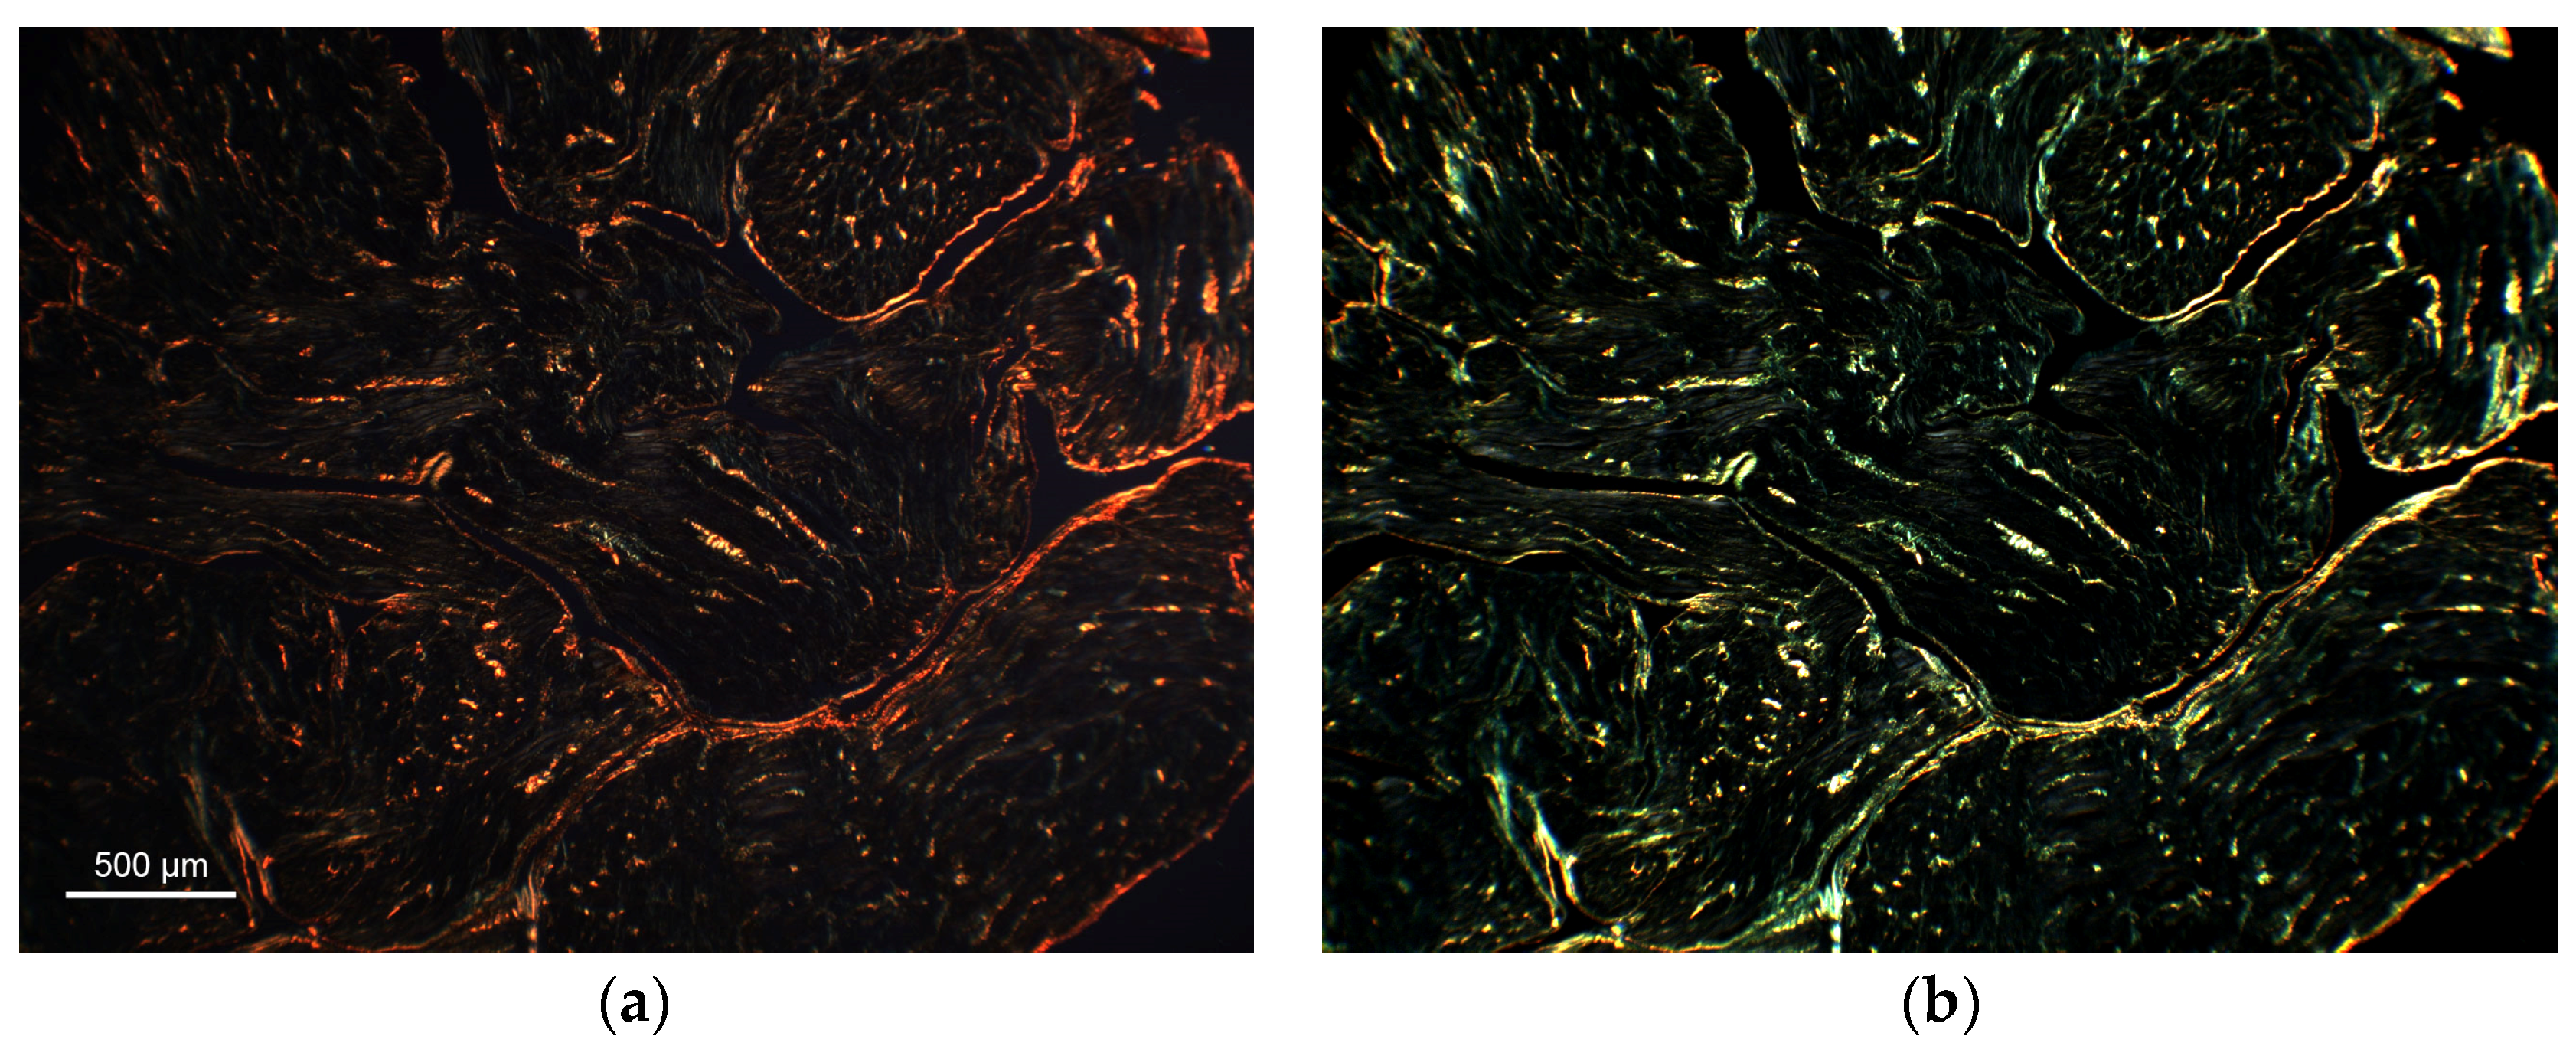
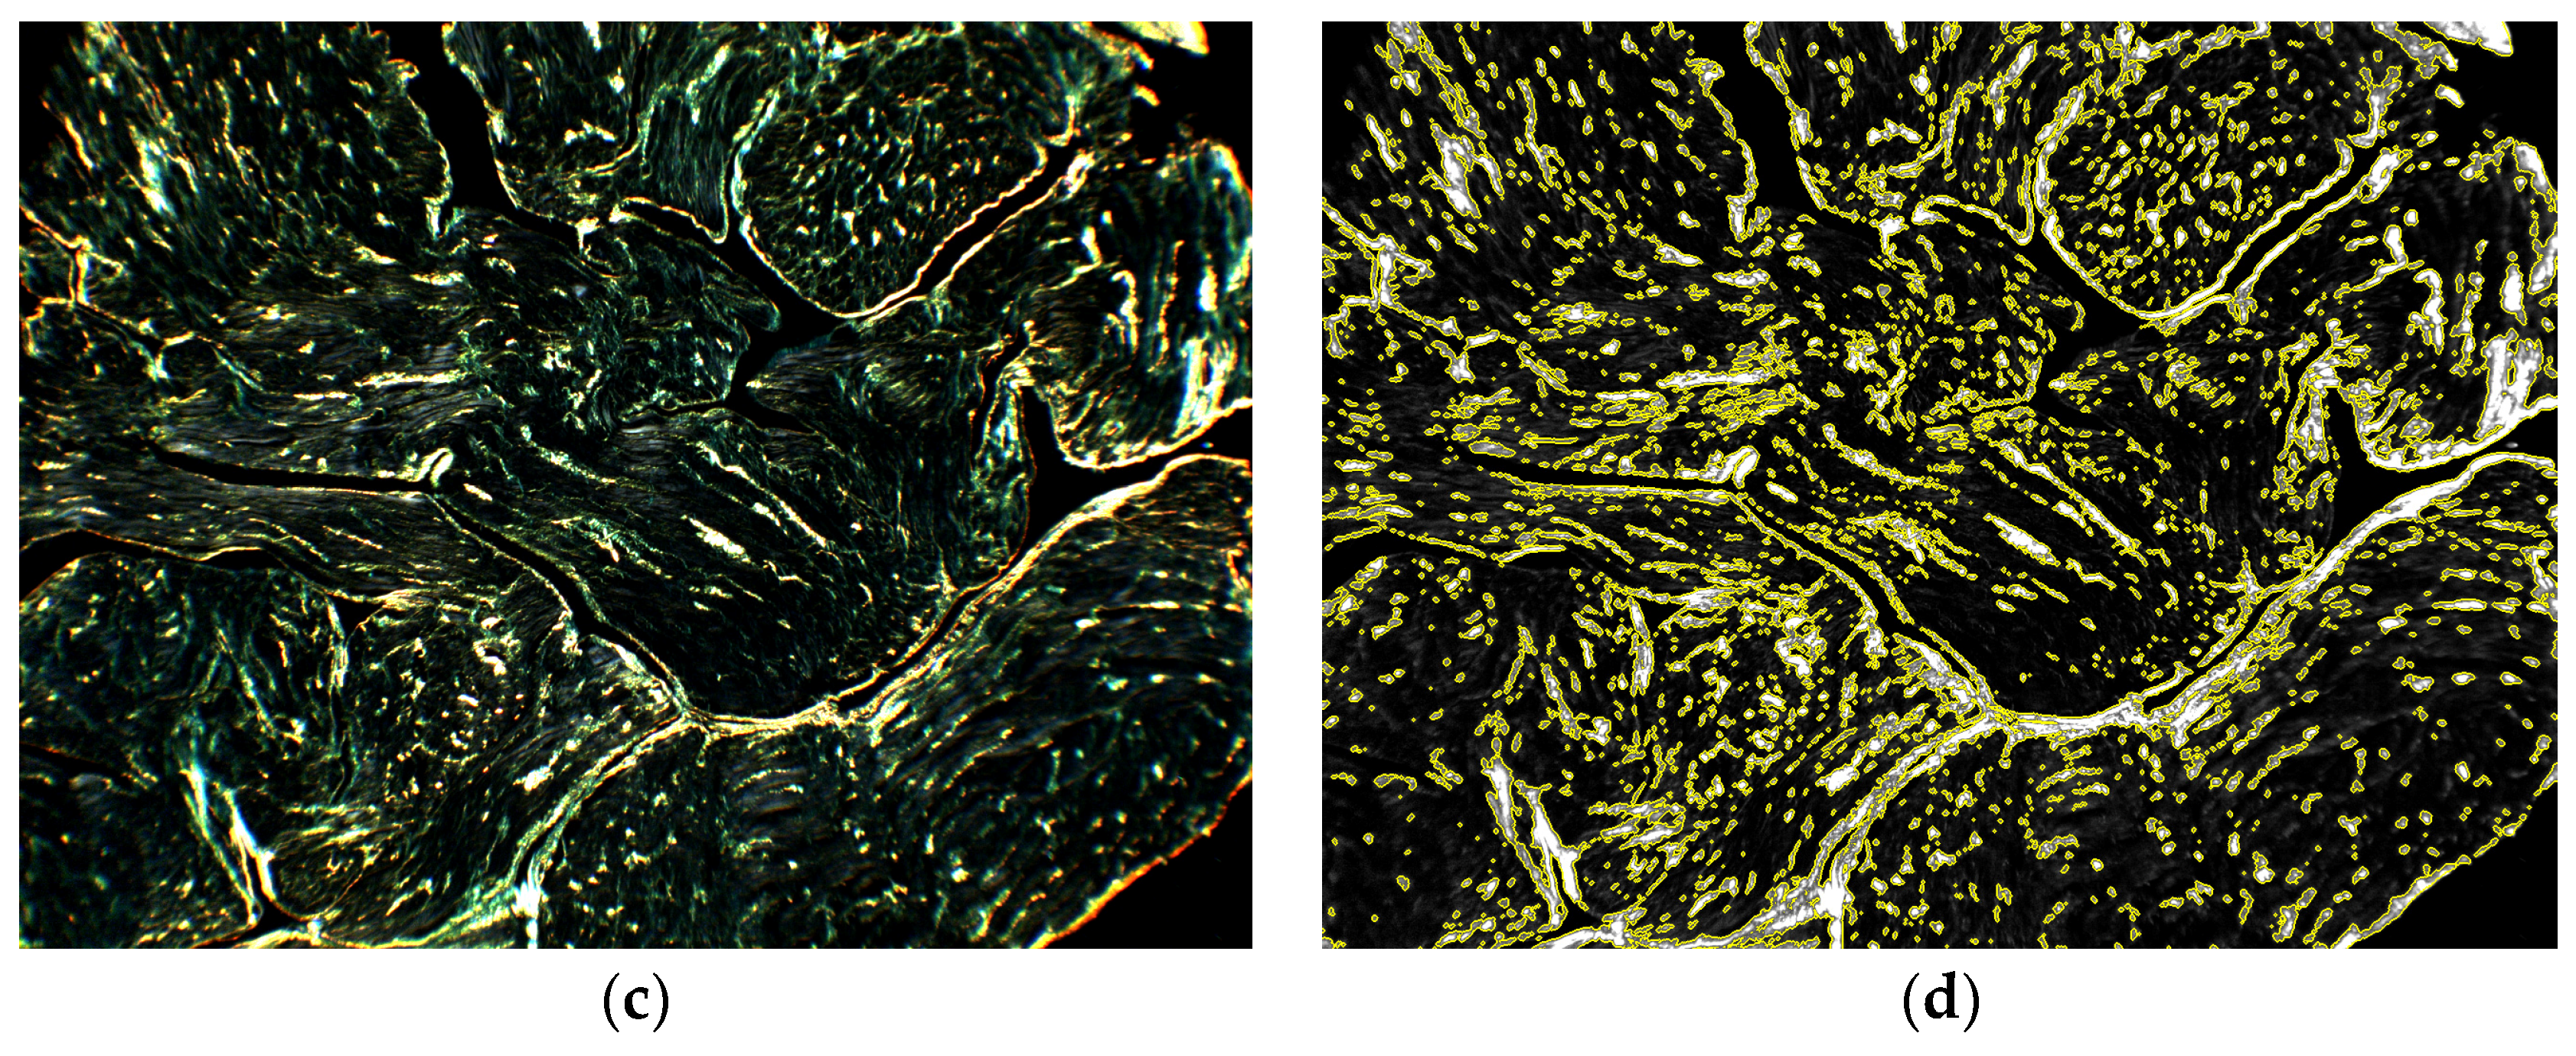
A representative example of the birefringence analysis is shown in Figure 4 for the same section shown in Figure 3. The intensity of the original dark-field image A c i (Figure 4a) is affected by source illumination, acquisition exposure, sample transmittance, and a nonzero transmittance T c of the crossed polarizers. These factors create a background illumination, which could interfere with birefringence detection. The corrections applied through the processing pipeline up to Equation (13) isolated the birefringence signal produced by the sample (Figure 4b), reducing the aforementioned artifacts. The subsequent application of Equation (14) compensated for the effects of section thickness variability. As shown in Figure 4c, the signal was normalized to unitary average optical thickness, producing the RGB image S b i r i , which was representative of collagen density in the tissue. The RGB collagen signal was transformed into a greyscale image S c o l i (Figure 4d), suitable for segmentation of the high-collagen tissue in the sample by thresholding according to t c o l . The collagen segmentation mask m a s k c o l i produced for the threshold t c o l = 0.152 (see next Section) is highlighted in yellow in Figure 4d. Combining the collagen mask with the tissue mask m a s k t i s i , the collagen fraction c i of the sample was computed according to Equation (17), giving a value of 14.3% for the shown example.
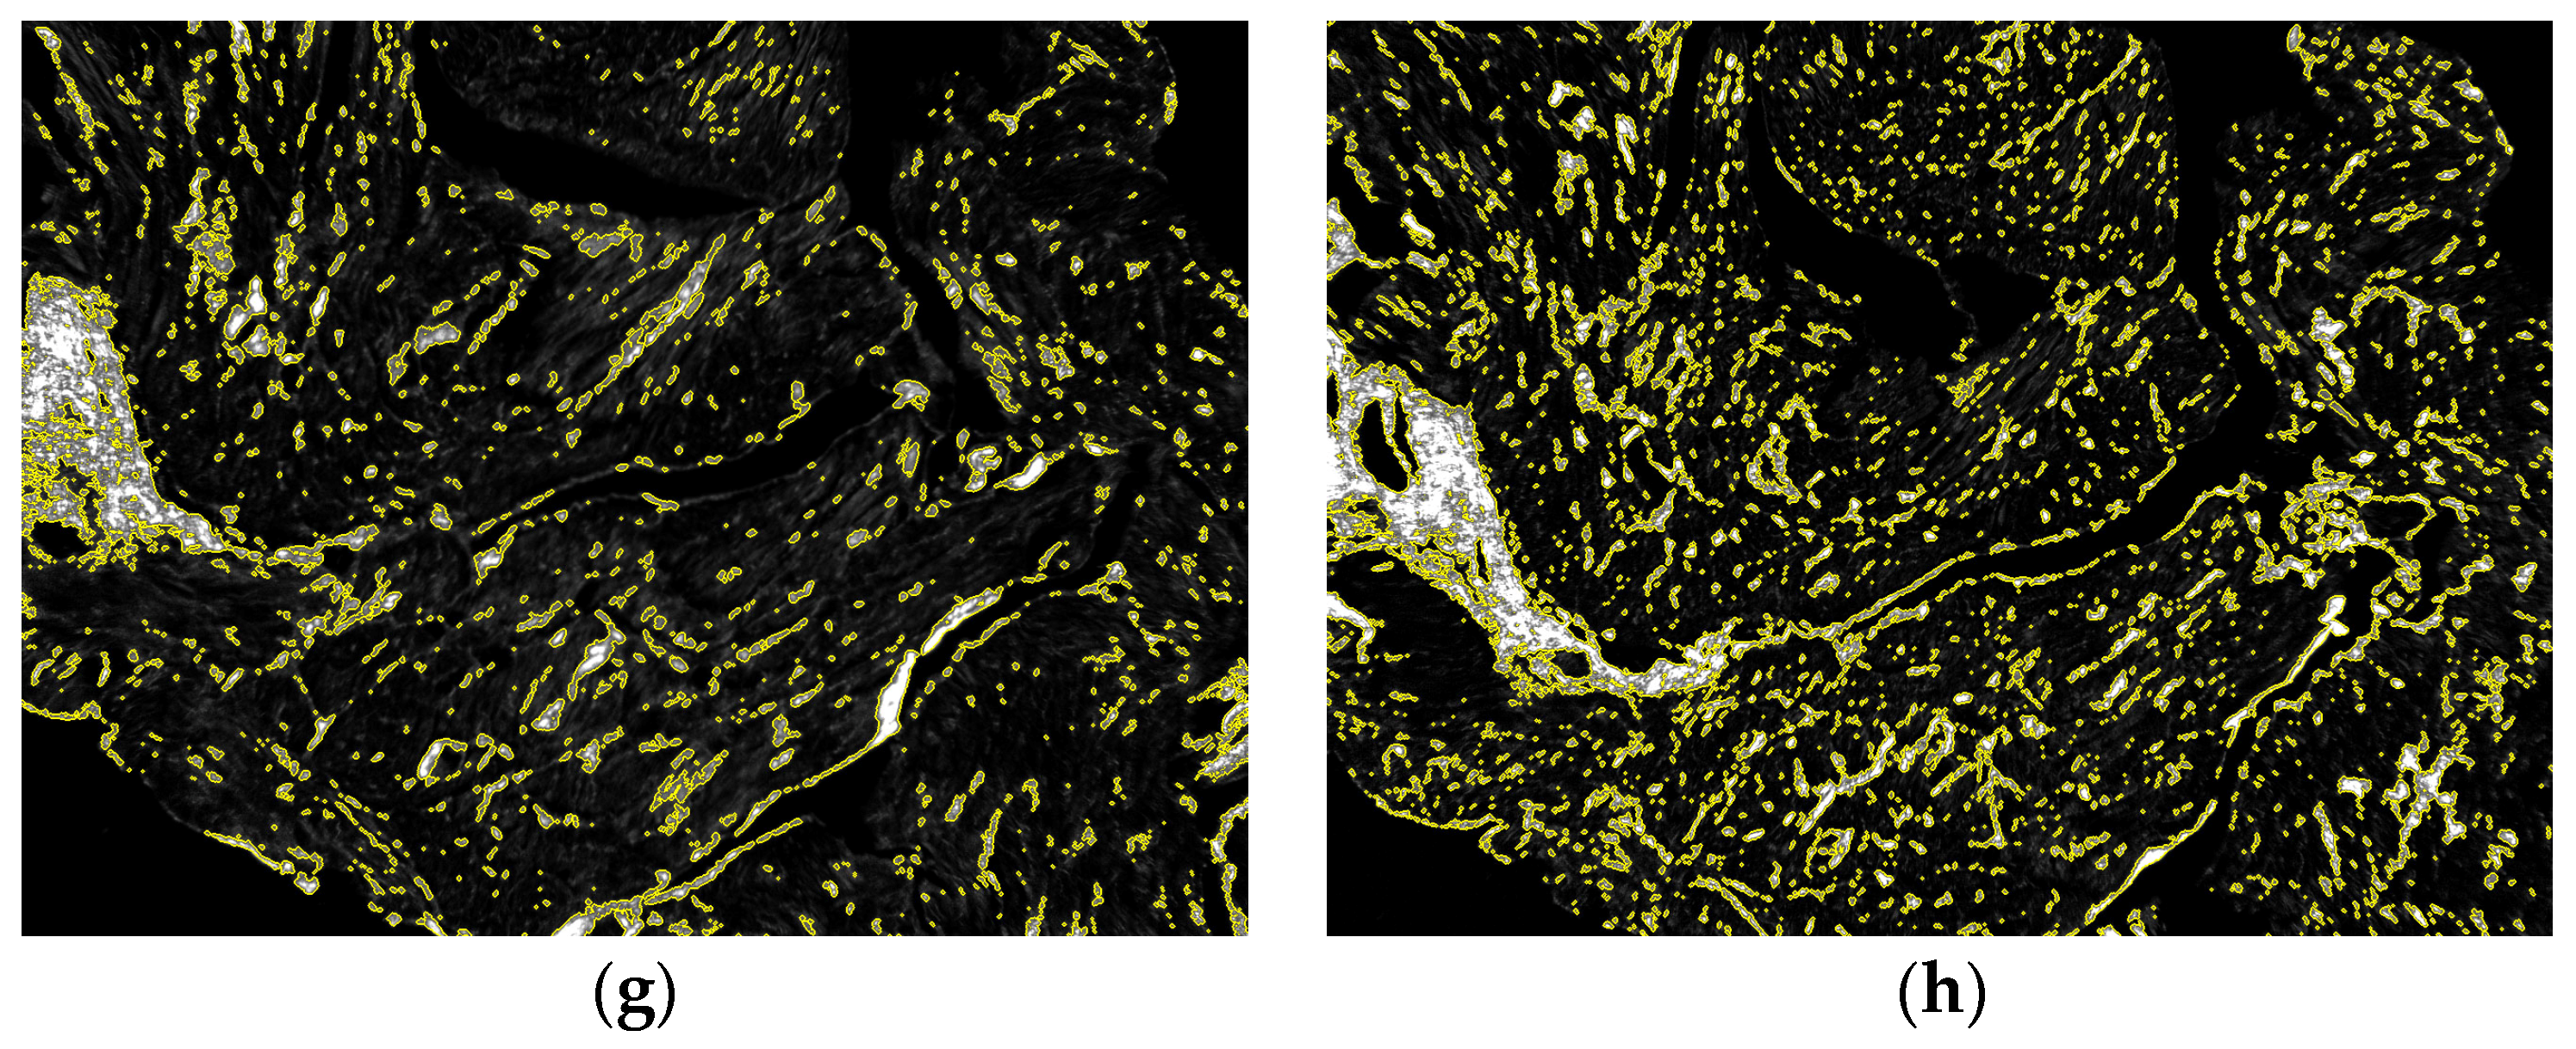
Figure 5 shows an example of the algorithm capability to compensate artifactual variability related to sample thickness. Two spatially close tissue sections, characterized by similar tissue composition but different thickness, were compared. At visual inspection, the tissue profile and the red stain distribution followed similar patterns, while the different section thickness affected the transmittance values (Figure 5a,b). In the original dark-field images, a difference in birefringent signal intensity was observed (Figure 5c,d), where the thicker section emitted a redder and more intense birefringent light. After thickness correction, the RGB birefringence images S b i r i (Figure 5e,f) were more balanced in terms of intensity and chroma. The threshold t c o l = 0.152 on the greyscale collagen signal (Figure 5g,h) produced comparable fractions of collagen content (8.1% and 11.1%, respectively). It is to notice that a more fragmented collagen distribution was present in the thinner section, while in the thicker one the signal formed larger clusters, probably owing to the additive effects of a larger number of myocardial tissue layers.

3.3. Proof of Concept Application of the Framework for the Quantification of Cardiac Fibrosis

The capability of the analysis framework to detect and distinguish different fibrosis patterns was showcased on a dataset of human cardiac tissue samples. The mean value and the standard deviation of the mean for the collagen-detection thresholds, manually set on a subgroup of cardiac sample images, were t c o l = 0.152 = ± 0.004. The standard deviation of the thresholds was 0.017, indicating a low dispersion of the selected threshold values and a general coherence of choice. The threshold t c o l was used for automatic processing of all the images in the dataset.
Over the dataset, the section optical thickness varied within the range 0.13–0.46. The validity of the approximation sin 2 δ 2 1 , used in Equation (14) for correcting against thickness variations, was checked for the threshold t c o l     = 0.152. For the unnormalized birefringence images in Equation (13), the threshold is given by t c o l ( μ ( r ) L i ) 2 , which yielded a maximum value of 0.032 ≪ 1 for the largest optical thickness of 0.46. The amplitude of the unnormalized signal was in general inferior to 0.1.
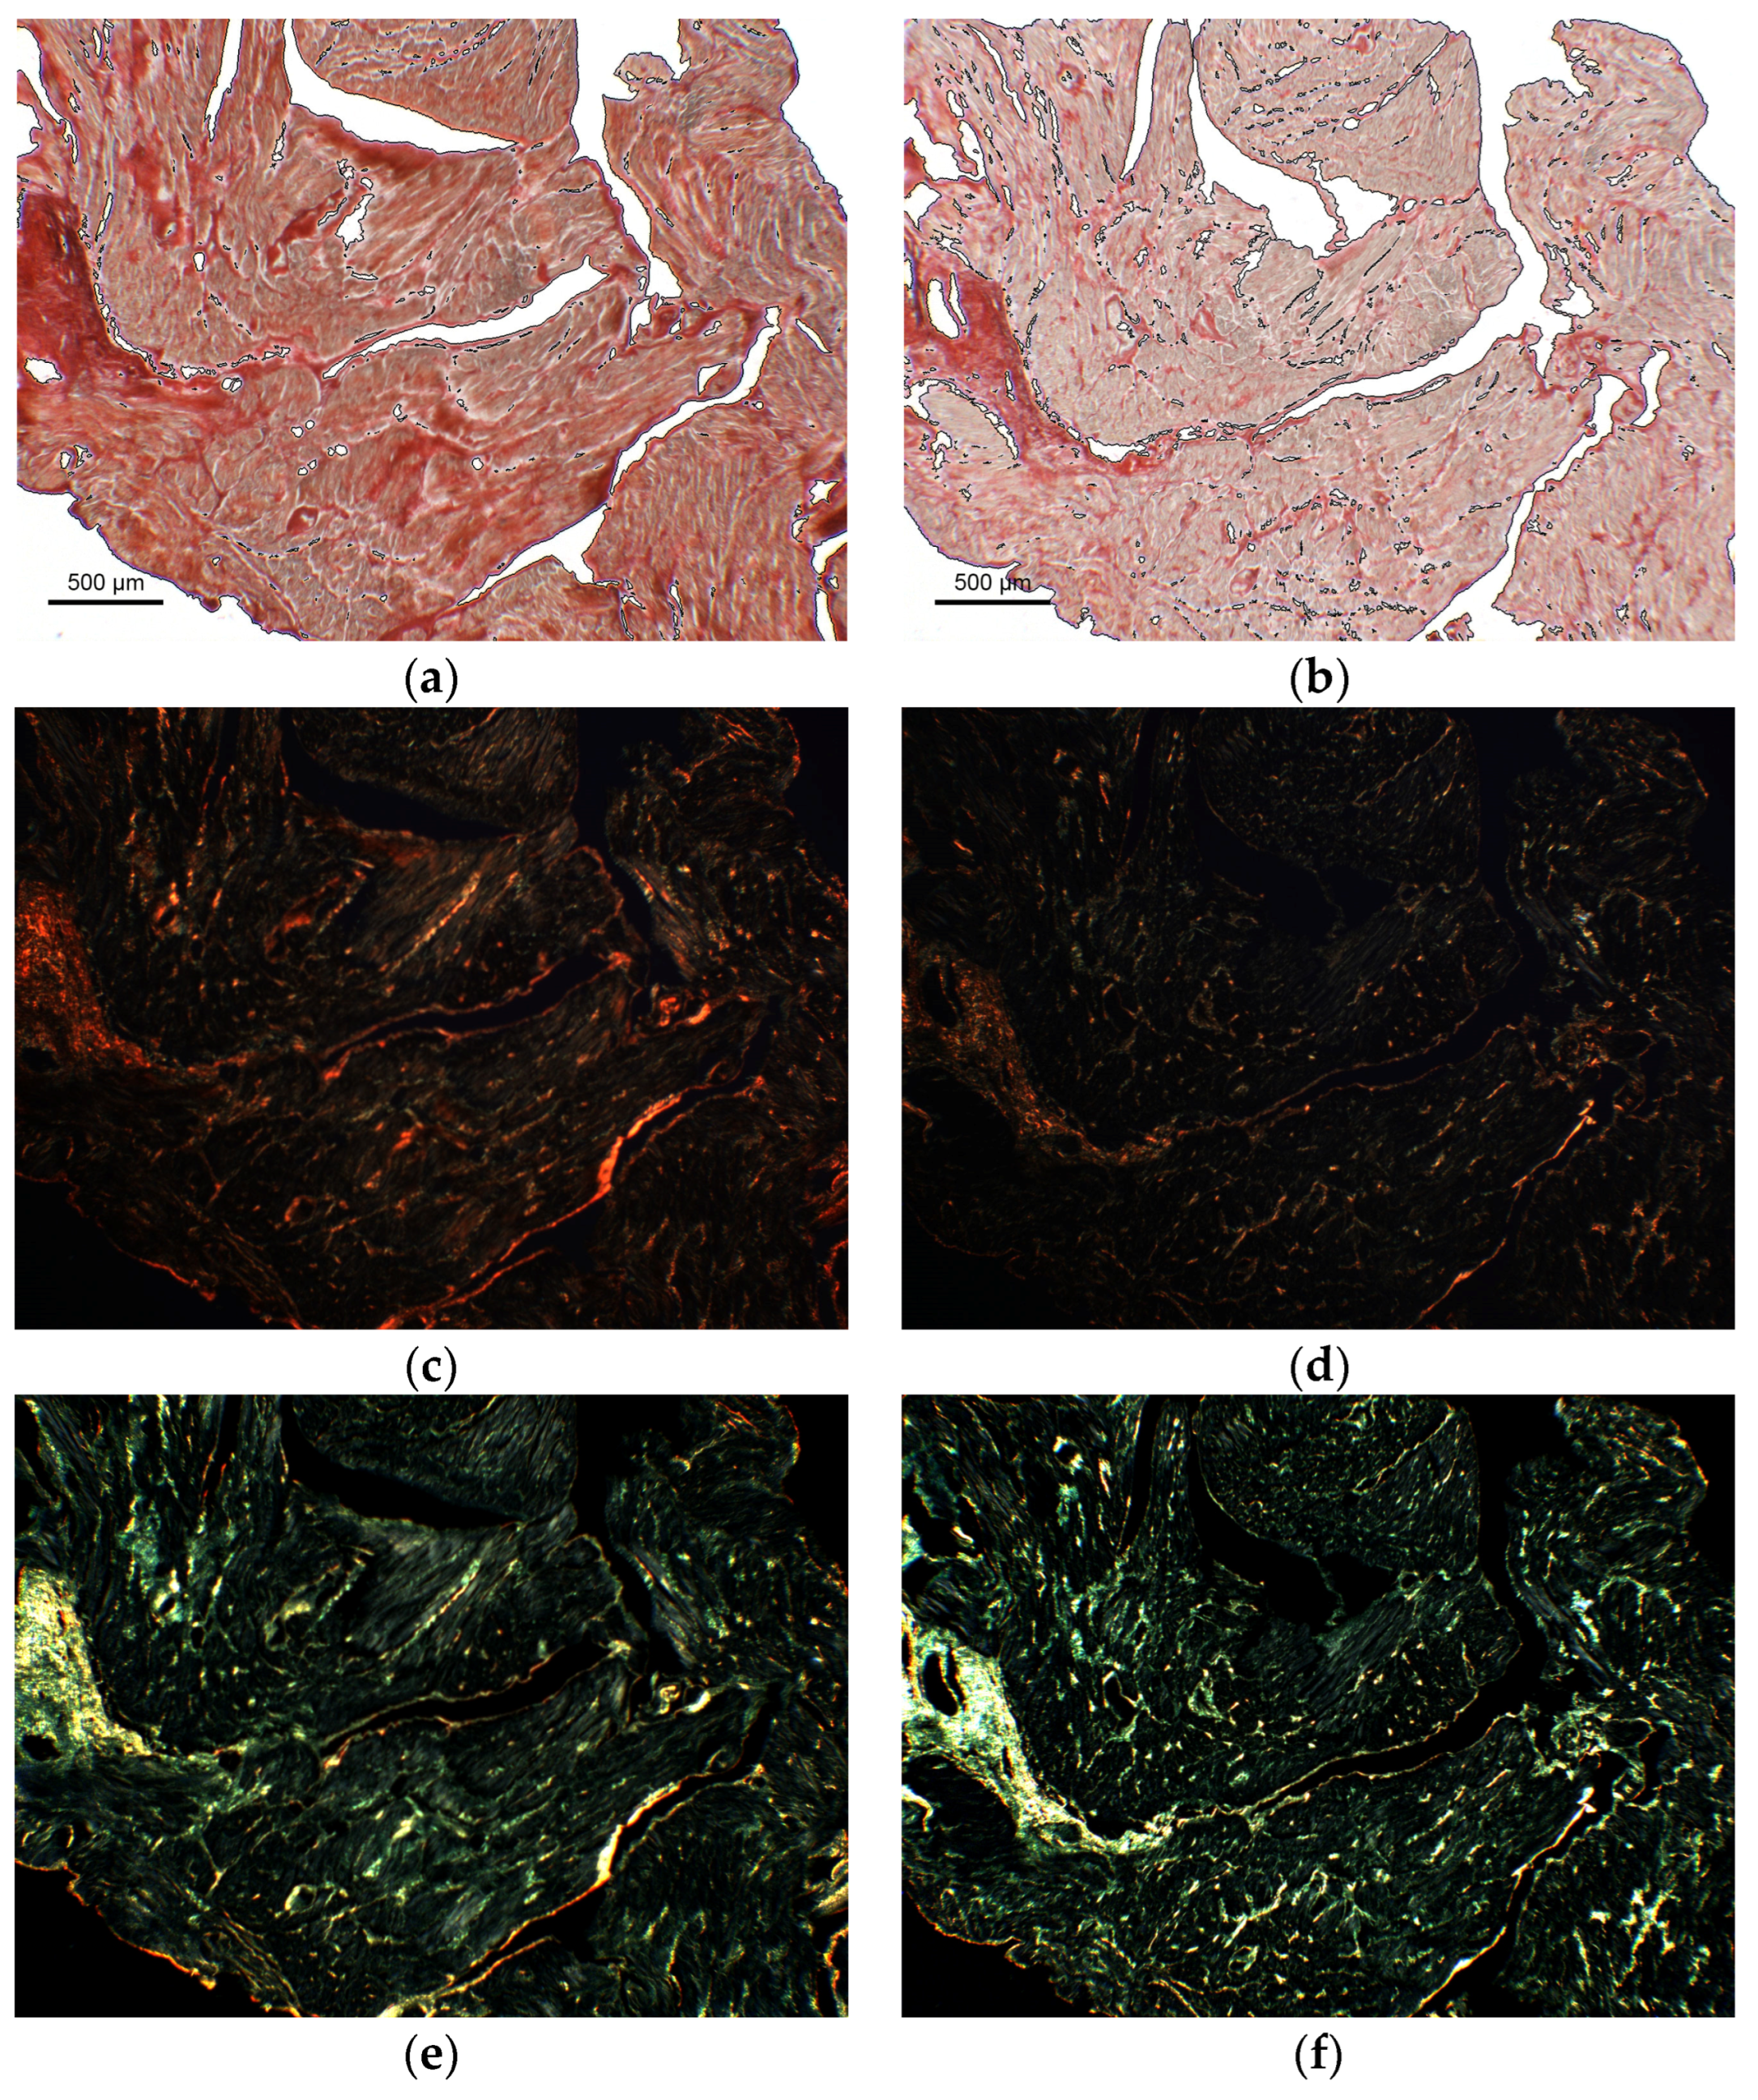
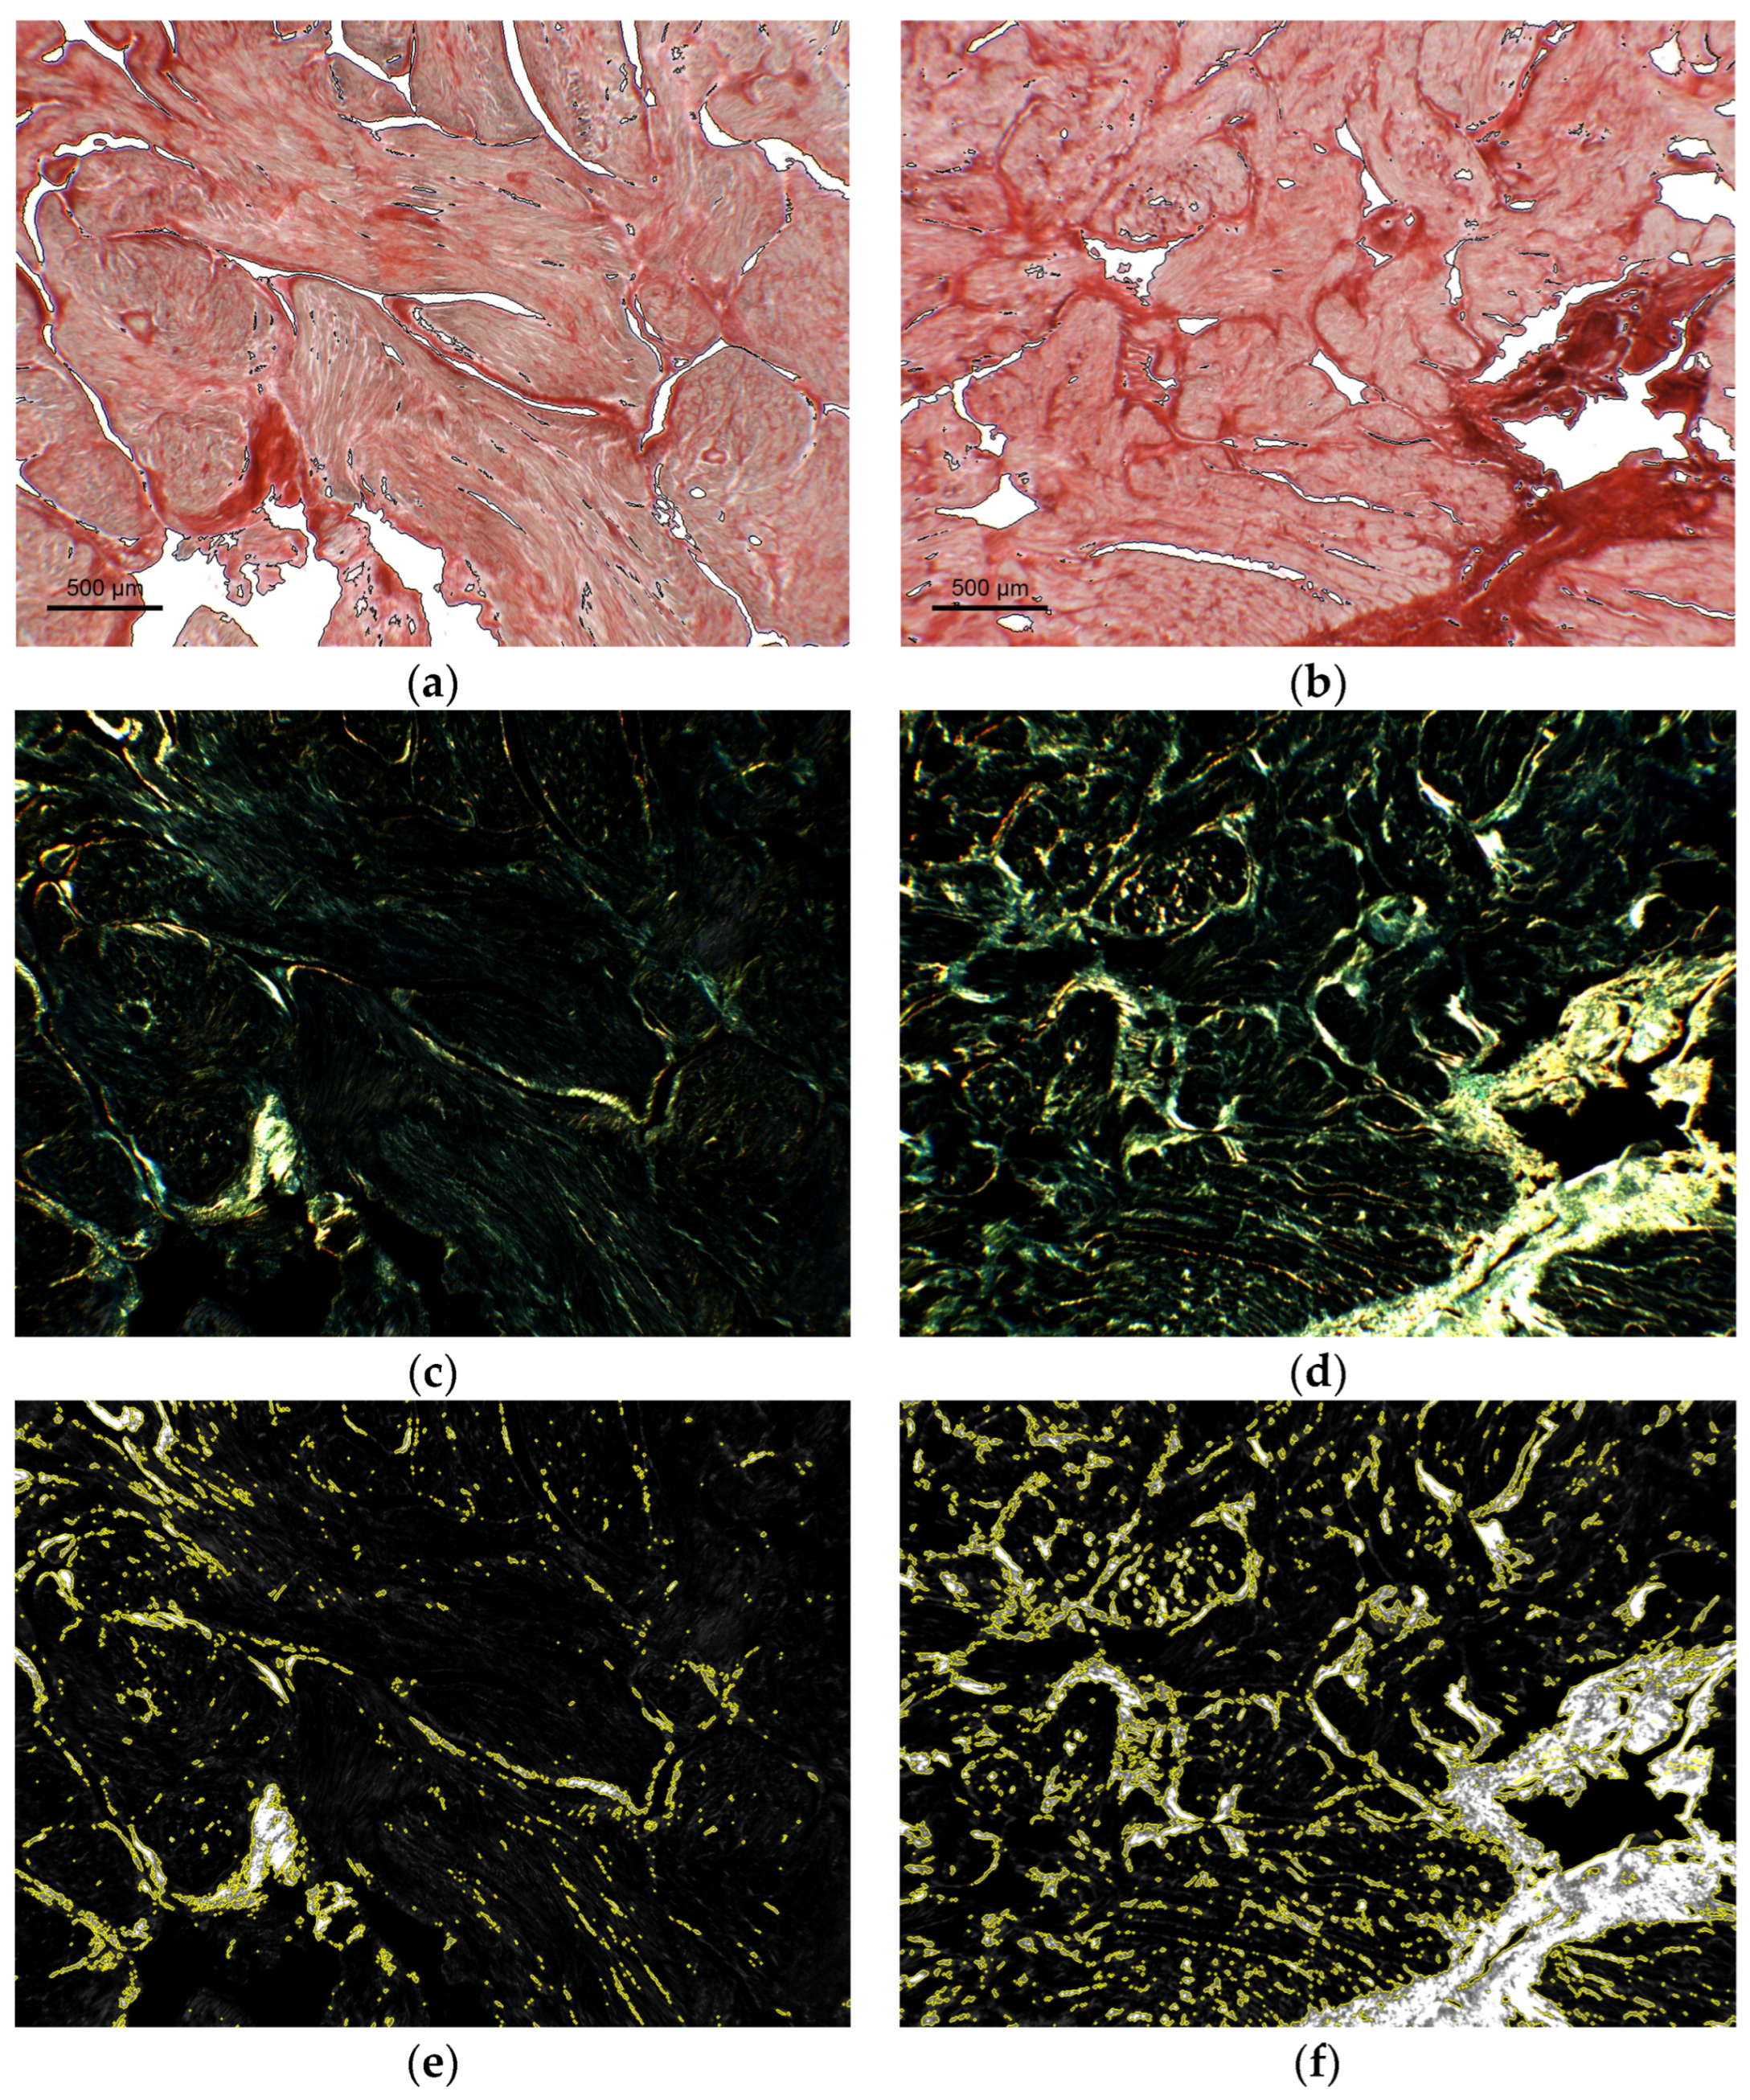
Figure 6 shows representative examples of the method application in two patients with different arrhythmic profiles. In the exemplary SR patient (left panels), the red stain in the bright-field image occupied limited areas (Figure 6a). This suggested the presence of a small amount of fibrosis, which was confirmed by the low intensity of the processed birefringence signal (Figure 6c). The binary classification performed by the algorithm on the birefringence signal yielded a value of 3.4% (Figure 6e). In the exemplary AF patient (right panels), both the red stain and the processed birefringence signal were much more intense and occupied a much larger area (Figure 6b,d), resulting in an estimated collagen fraction of 18.9% (Figure 6f).
The overall results of the application of the analysis framework to the cardiac sample database are shown in Figure 7. The method detected significant differences between the amount and heterogeneity of mid-wall fibrosis in patients characterized by different arrhythmic profiles. SR patients displayed low (fibrosis fraction of 7.8 ± 3.8 %) and almost stable (fibrosis heterogeneity of 2.1 [1.9; 2.5] %) fibrotic content in the mid-wall. Conversely, patients with AF displayed a significantly higher amount of fibrosis (14.5 ± 6.0 %, p < 0.05) and higher variability among slices (3.6 [2.4; 3.7] %, p < 0.05), which may be indicative of a structural remodeling of the atrial tissue.
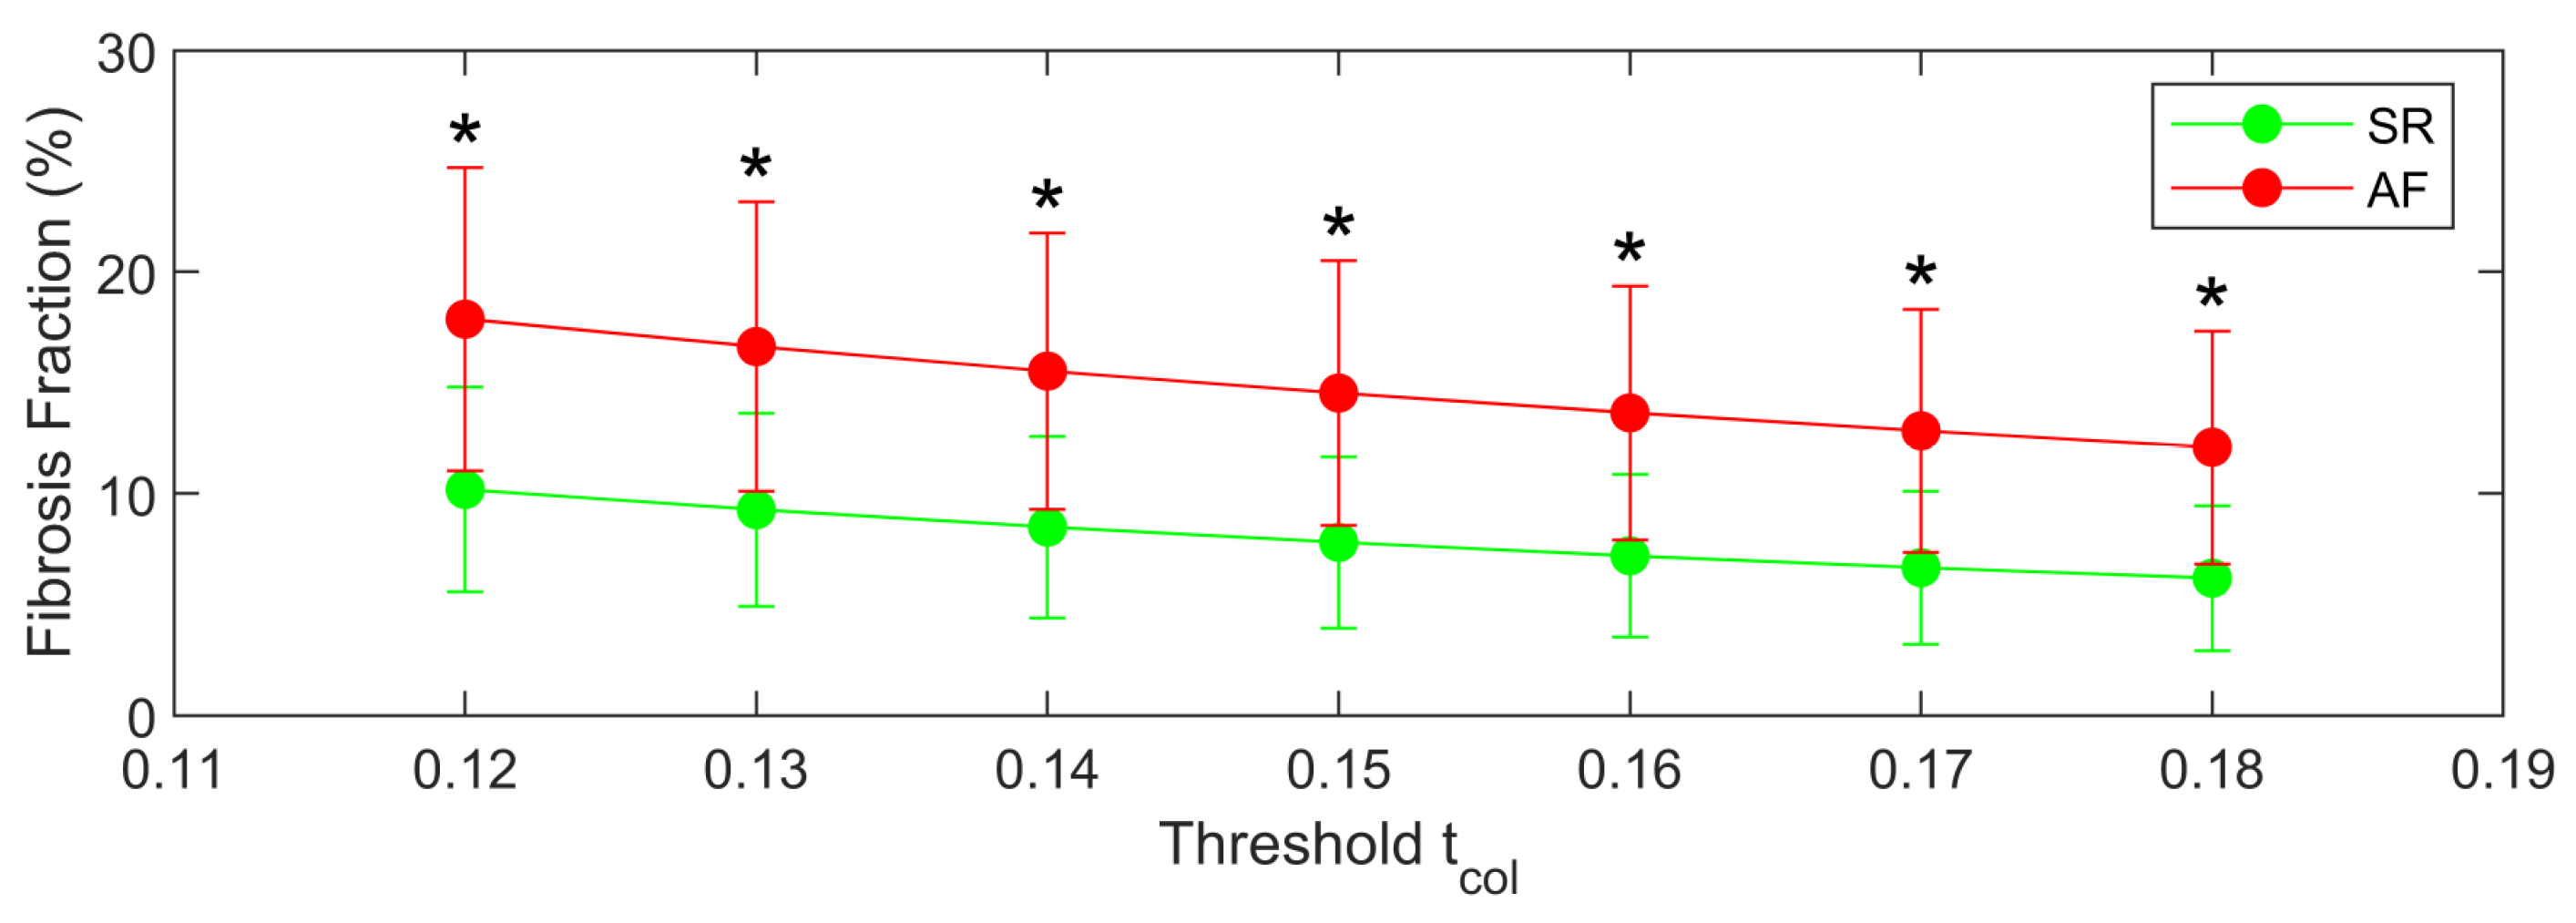
The results of the sensitivity analysis performed on the effects of threshold variations on fibrosis amount results are shown in Figure 8. As it can be appreciated, the progressive increase of the threshold from 0.12 to 0.18 made collagen detection more and more restrictive and a progressively smaller collagen amount was detected. However, the decrease was similar and consistent in the two patient groups, so that the relative difference in collagen content was maintained and remained statistically significant (p < 0.05) for all the considered thresholds. These results corroborated the method robustness and capability to distinguish relative differences in collagen properties associated with cardiac disease.

4. Discussion

We introduced a novel model-based approach for the semi-automatic analysis of collagen from histological samples analyzed in PLM. We showcased the capability of the method to provide an efficient quantification of collagen in human cardiac tissue samples and to distinguish fibrosis patterns associated with different arrhythmic profiles, such as SR and AF.

4.1. Technical Features of the Method

Our approach is based on a model of sample–light interaction, which reproduces the sources of origin of the birefringence signal of collagen, when it is imaged in a linear polarization setting.
The regular spacing of collagen fibrils into fibers provides them with positive intrinsic birefringence [8]. This intrinsic birefringence can be enhanced by a specific staining process to point out even thin collagen fibers. For instance, picrosirius red staining is usually the preferred staining, since its peculiar chemical properties results in higher specificity and selectivity for collagen and less fading problems with respect to other techniques, such as van Gieson and trichrome techniques [11,12,13]. The intrinsic and/or staining-induced birefringence results in collagen fibers appearing bright versus a dark background when illuminated in polarized light.
Based on a physical model of polarized light–sample interaction, we aimed to improve the estimation of collagen birefringence as an index of collagen amount by combining the information in both bright-field and dark-field images, and by reducing the effects of artifacts and confounding factors deriving from variability sources in sample preparation as well as in microscopy set-up.
The combination of bright-field and dark-field image information occurred at different levels of our algorithmic flow. Specifically, both bright-field and dark-field tissue images were used to construct a signal proportional to the transmittance, which was used for the automatic segmentation of the tissue from the background and for the estimation of sample thickness. Bright- and dark-field images of a white image were also entered in the signal construction to correct the field illumination nonuniformity and to improve tissue segmentation from the background. Both bright-field and dark-field images were combined in the construction of the birefringence signal, which was used for the semi-automatic segmentation of collagen. In particular, the birefringent signal was also corrected for variations in sample thickness according to the thickness estimation from the transmittance signal.
The combination of bright- and dark-field images for the segmentation of background and collagen is an original aspect of our algorithm with respect to the literature [9,10,15,22,23,24]. The majority of studies using picrosirius red staining in combination with polarized light employed bright-field illumination to detect collagen [15,22,23,24]. In the study by Hadi et al. [15], a semi-automatic threshold-based approach was applied to detect collagen from bright-field images. A color transformation from the RGB to the CIE LAB color space was performed and specific thresholds, associated with the staining, were applied to detect each specific tissue compartment (i.e., lumen, cardiomyocytes, or collagen fibers). However, the analysis of the sole bright-field images may be limited by the fact that neither collagen fiber color nor brightness are uniform (i.e., thicker fibers appear deep red and thin fibers appear bright pink and are more difficult to detect), which may hinder the proper definition of thresholds. An alternative approach was implemented by Rich et al. [10], who used color threshold analysis on dark-field images to reveal the structure of collagen fibers of different dimensions. Of note, the algorithm controlled for the mix in color associated with fiber density and classified the segmented collagen into its constituent parts (thick or thin fibers) for the resolution of complex collagen configurations and improved visualization. In our algorithm, we did not distinguish collagen densities, but combined the information of red, blue, and green colors by an average approach. Our approach quantified the overall content of different types of fibers, but not their distinction. In order to detect different collagen types, our approach may be slightly modified by converting the birefringent signal, given in RGB, to hue formulation and finding appropriate thresholds for different fibrosis population in the color spectrum. Alternatively, information on collagen patterns may be obtained post-detection, submitting the extracted mask to algorithm for spatial pattern extraction. In its seminal work, Whittaker et al. [9] used both dark-field and bright-field images for the quantification of collagen, but the approach implied hardware manipulation during image acquisition. Blue-filtered bright-field images were used to detect the muscle tissue, which was then subtracted from the polarized image, where both muscle and collagen appear bright. However, the brightness of muscle in the bright-field image needed to be adjusted by manual manipulation of the microscope lamp.
As concerns the correction of artifacts, previous algorithms introduced the possibility of manual corrections of staining artifacts by the user [15]. However, to our knowledge, our approach is the first that tried to correct, through a modeling framework, artifactual variability related to sample preparation and experimental set-up. In the case of sample thickness, the correction was directly performed by the software using transmittance information from the tissue images. In particular, the analysis was based on the transmittance of the red channel to limit the variability effects related to the picrosirius red stain. Picrosirius red stain may be differently absorbed by samples depending on experimental variability, tissue characteristics, and collagen content, which may result in variations of the attenuation coefficient μ ( r ) . Being the least affected by red stain, the red channel should be less exposed to these effects, although some residual variability may be present. In our test set, we showed our approach to work for optical thickness up to 0.5. It is worth to notice that the corrective term in our algorithm may not be able to compensate for very thick samples, where collagen spatial distribution may change across depth. In the presence of thick samples, the collagen signal may be intrinsically damped due to signal average across different layers and extrinsically reduced by the quadratic dependence in Equation (14), resulting in a less-detectable signal.
In the case of the non-uniform luminosity, an additional procedural step was required (i.e., the acquisition of a white image). The step was of limited impact for the whole acquisition chain, because it was performed only once at the beginning of the acquisition session of a full stack of images. However, as shown in the representative example of Figure 3, the correction for nonuniform illumination was relevant to grant the automatic segmentation of the tissue area from the background, since it significantly reduced the spread of the pixel values in the luminal space and their overlap with tissue values.
Consistent with most of the previously proposed computer-based approaches for collagen estimation, our approach is not fully automatic. The user input is however reduced to the definition of a common threshold on a subset of samples and the supervision of the processing, enabling fast analysis on large batches of samples. The optimal threshold was determined by analyzing a reduced set of images from the database. The method is thus time-efficient when a large number of sections acquired with the same protocol must be analyzed, and it reduces the dependence on the operator to a minimum. The determination of a common threshold on a limited number of images and its extension to a whole dataset is similar to the approach in [15] for bright-field images, where the color thresholds were also assessed on a subset of images. Differently, in other approaches, which operated on picrosirius red-stained bright-field images [17,18,19], the investigators had to set thresholds for every image that was analyzed, which made the approach laborious and sensitive to inter-observer variations. In general, it is worth noticing that the setting of a threshold needs to be adapted to the specific sample type, preparation, and acquisition protocol. In fact, the definition of the threshold depends on the contest and goal of the specific application, since the quantification from the birefringent signal provides only a relative assessment of collagen, suitable for comparative analysis, e.g., the comparison of different diagnostic profiles. As shown by our sensitivity analysis, differences in the setting of the threshold t c o l , e.g., arising from the analysis of different image subsets, determined changes in the absolute value of collagen detected. However, the observed changes were consistent throughout the database and the relative differences between patient groups were preserved in the considered threshold range.

4.2. Applications of the Method

In this study we showed a proof-of-concept application of our approach for the characterization of fibrosis distribution in the atria of cardiac surgery patients. Fibrosis is acknowledged as a crucial factor in the setting and maintenance of cardiac arrhythmias, promoting the emergence of triggers and the maintenance of reentrant activity [5]. In particular, the type, pattern, and spatial distribution of fibrosis have been connected to different arrhythmic substrates and arrhythmic risks, pointing out the importance of a precise and quantitative description of fibrosis features [5,6,7,25]. Our analysis on atrial samples in cardiac surgery patients pointed out a significantly higher amount of fibrosis in patients with AF (average 14.5%) than in patients without a history of arrhythmia (average fibrosis value of 7.8%). The amount of fibrosis detected in the two populations in our study are in line with values reported in previous histology studies in cardiac surgery [26,27,28] and autopsy settings [29], despite minor differences, which may be probably ascribed to differences in extraction sites, processing, staining, and analysis of the specimens. Similar to our results in the control patients, Goette et al. [26] found an average fibrosis content of 15.8% in a large population of open-heart surgery patients without a history of AF. Of note, a considerable variability was present in the population with values ranging from 4% to almost 33%. In patients without previous history of AF, Swatz et al. [27] found that the fraction of right atrial fibrosis was 5.3 ± 3.8% in patients, who developed post-operative AF, versus 4.3 ± 3% in patients who did not, without significant differences between the two populations. Consistently with our comparative results in controls versus AF patients, Platonov et al. [29] found that fibrosis extent in post-mortem atrial tissue from patients without significant valvular disease was two- to three-fold higher in patients with (range: 22–28%) than without a history of AF (5–8%). Nguyen et al. [28] reported greater amounts of interstitial fibrosis in atrial samples from chronic AF patients with respect to SR patients (37% versus 7%). Of note, we reported also a higher variability of fibrosis profile in AF patients, which may be indicative of the formation of a complex 3D substrate supporting wave propagation dynamics [6,30].
Besides the study of AF, the characterization of fibrosis is crucial in other cardiac diseases, such myocardial infarction and nonischemic cardiomyopathies, where the amount and pattern of fibrosis is associated with the risk of fatal ventricular arrhythmias and sudden cardiac death [5]. Our algorithm may facilitate and speed up histological analysis in animal models of cardiac disease, allowing for instance systematic assessment of fibrotic remodeling in models of ischemic and nonischemic cardiac disease, as well as the characterization of genotype-phenotype relationships in models of genetic cardiomyopathies [16]. Quantitative and accurate assessment of structural substrate formation may be important also in other pathophysiologic conditions, such as hypertension, diabetes, or obesity, where cardiac fibrosis is known to play a key role [2,3].
In translational research, our method may support the analysis of histological 3D datasets, obtained as series of 2D slices. Whole-heart 3D datasets have been obtained in the rabbit heart, where cardiac histoanatomical organization was shown as a major determinant of heart function [31]. In addition, adult human myocardial slices from small heart biopsies were proposed as a simple, reproducible, and relevant preparation for the study of human cardiac tissue at the multicellular level [32].
Moreover, the method may find application in the validation of noninvasive cardiac imaging techniques for fibrosis quantification, such as late gadolinium enhancement magnetic resonance imaging or T1 mapping [5], for which adequate correlation with the histological gold standard is required. Validation is usually done with a limited number of myocardial biopsies [33], but fast analysis may help to extend the analyzed datasets, thus enforcing the validation.
In principle, the method may be used on any kind of histological staining in any kind of tissue, finding applications also for the characterization of hepatic, renal, dermal, or pulmonary fibrosis, and cancer-related fibrosis [2,3], as well as for collagen quantification to characterize bone repairing processes [34]. This however requires that suitable thresholds are defined by tuning and re-adaptation to the new experimental setting and new batch of images.

5. Limitations

This work presents some limitations. First, our method was based on a microscopy set-up with linearly polarized light. Although linear polarization has been widely used for collagen fibers quantification [35], only collagen fibers oriented at a certain angle with respect to the polarizer can be enhanced, which leads to partial underestimation of collagen content. To overcome this limitation, acquisition of linearly polarized light images at different angles of rotation may be performed [36], or, alternatively, our framework may be adapted to model a circularly polarized light configuration [9,10]. Second, we did not assess the accuracy of our method in comparison with samples of known collagen content nor with respect to analytical methods for collagen assessment. Third, our proof-of-concept application was limited to cardiac samples of right atrial appendage specimens from cardiac surgery patients. In future studies, the validation of our approach should be extended to include the analysis of different tissue types and the comparison with other collagen estimation techniques.

6. Conclusions

We developed an innovative analysis framework for the efficient quantification of collagen from birefringence images in large databases of samples. Through the modeling of the birefringence signal, the method allowed to correct for variability sources related to tissue sample preparation and image acquisition. The proposed method can be a valid aid to quicken and reinforce the analysis of large sets of PLM images for the quantification of collagen distribution in different tissues and pathologies.

Author Contributions

Conceptualization, A.C., M.M. and F.R.; methodology, A.C.; software, A.C.; validation, A.C. and M.M.; formal analysis, A.C.; investigation, A.C., M.M. and F.R.; resources, F.R.; data curation, M.M. and F.R.; writing—original draft preparation, A.C. and M.M.; writing—review and editing, A.C., M.M. and F.R.; visualization, A.C. and M.M.; supervision, F.R.; project administration, F.R.; funding acquisition, F.R. All authors have read and agreed to the published version of the manuscript.

Funding

This work was supported by Fondazione Cassa di Risparmio di Trento e Rovereto (grant no. 2011.0194 to F.R.).

Institutional Review Board Statement

The investigation was approved by the Ethical Committee for Clinical Experimentation of the Provincial Agency for Health Services of the Autonomous Province of Trento and conformed to the principles outlined in the declaration of Helsinki.

Informed Consent Statement

Informed consent was obtained from all subjects involved in the study.

Data Availability Statement

The data underlying this article will be shared on reasonable request to the corresponding author.

Conflicts of Interest

The authors declare no conflict of interest.

References

  1. Ricard-Blum, S. The Collagen Family. Cold Spring Harb. Perspect. Biol. 2011, 3, a004978. [Google Scholar] [CrossRef] [PubMed] [Green Version]
  2. Wynn, T.A. Cellular and Molecular Mechanisms of Fibrosis. J. Pathol. 2008, 214, 199–210. [Google Scholar] [CrossRef] [PubMed] [Green Version]
  3. Henderson, N.C.; Rieder, F.; Wynn, T.A. Fibrosis: From Mechanisms to Medicines. Nature 2020, 587, 555–566. [Google Scholar] [CrossRef] [PubMed]
  4. Li, A.-H.; Liu, P.P.; Villarreal, F.J.; Garcia, R.A. Dynamic Changes in Myocardial Matrix and Relevance to Disease: Translational Perspectives. Circ. Res. 2014, 114, 916–927. [Google Scholar] [CrossRef] [PubMed] [Green Version]
  5. Disertori, M.; Masè, M.; Ravelli, F. Myocardial Fibrosis Predicts Ventricular Tachyarrhythmias. Trends Cardiovasc. Med. 2017, 27, 363–372. [Google Scholar] [CrossRef] [PubMed]
  6. Hansen, B.J.; Zhao, J.; Csepe, T.A.; Moore, B.T.; Li, N.; Jayne, L.A.; Kalyanasundaram, A.; Lim, P.; Bratasz, A.; Powell, K.A.; et al. Atrial Fibrillation Driven by Micro-Anatomic Intramural Re-Entry Revealed by Simultaneous Sub-Epicardial and Sub-Endocardial Optical Mapping in Explanted Human Hearts. Eur. Heart J. 2015, 36, 2390–2401. [Google Scholar] [CrossRef] [Green Version]
  7. Ravelli, F.; Masè, M.; Cristoforetti, A.; Avogaro, L.; D’Amato, E.; Tessarolo, F.; Piccoli, F.; Graffigna, A. Quantitative Assessment of Transmural Fibrosis Profile in the Human Atrium: Evidence for a Three-Dimensional Arrhythmic Substrate by Slice-to-Slice Histology. Europace 2022, 25, euac187. [Google Scholar] [CrossRef]
  8. Wolman, M.; Kasten, F.H. Polarized Light Microscopy in the Study of the Molecular Structure of Collagen and Reticulin. Histochemistry 1986, 85, 41–49. [Google Scholar] [CrossRef]
  9. Whittaker, P.; Kloner, R.A.; Boughner, D.R.; Pickering, J.G. Quantitative Assessment of Myocardial Collagen with Picrosirius Red Staining and Circularly Polarized Light. Basic Res. Cardiol. 1994, 89, 397–410. [Google Scholar] [CrossRef]
  10. Rich, L.; Whittaker, P. Collagen and Picrosirius Red Staining: A Polarized Light Assessment of Fibrillar Hue and Spatial Distribution. J. Morphol. Sci. 2005, 22, 97–104. [Google Scholar]
  11. Lattouf, R.; Younes, R.; Lutomski, D.; Naaman, N.; Godeau, G.; Senni, K.; Changotade, S. Picrosirius Red Staining: A Useful Tool to Appraise Collagen Networks in Normal and Pathological Tissues. J. Histochem. Cytochem. 2014, 62, 751–758. [Google Scholar] [CrossRef] [PubMed] [Green Version]
  12. Rittié, L. Method for Picrosirius Red-Polarization Detection of Collagen Fibers in Tissue Sections. Methods Mol. Biol. 2017, 1627, 395–407. [Google Scholar] [CrossRef] [PubMed]
  13. Liu, J.; Xu, M.-Y.; Wu, J.; Zhang, H.; Yang, L.; Lun, D.-X.; Hu, Y.-C.; Liu, B. Picrosirius-Polarization Method for Collagen Fiber Detection in Tendons: A Mini-Review. Orthop. Surg. 2021, 13, 701–707. [Google Scholar] [CrossRef] [PubMed]
  14. Daunoravicius, D.; Besusparis, J.; Zurauskas, E.; Laurinaviciene, A.; Bironaite, D.; Pankuweit, S.; Plancoulaine, B.; Herlin, P.; Bogomolovas, J.; Grabauskiene, V.; et al. Quantification of Myocardial Fibrosis by Digital Image Analysis and Interactive Stereology. Diagn. Pathol. 2014, 9, 114. [Google Scholar] [CrossRef] [Green Version]
  15. Hadi, A.M.; Mouchaers, K.T.B.; Schalij, I.; Grunberg, K.; Meijer, G.A.; Vonk-Noordegraaf, A.; van der Laarse, W.J.; Beliën, J.A.M. Rapid Quantification of Myocardial Fibrosis: A New Macro-Based Automated Analysis. Cell Oncol. 2011, 34, 343–354. [Google Scholar] [CrossRef] [Green Version]
  16. Gho, J.M.I.H.; van Es, R.; Stathonikos, N.; Harakalova, M.; Te Rijdt, W.P.; Suurmeijer, A.J.H.; van der Heijden, J.F.; de Jonge, N.; Chamuleau, S.A.J.; de Weger, R.A.; et al. High Resolution Systematic Digital Histological Quantification of Cardiac Fibrosis and Adipose Tissue in Phospholamban p.Arg14del Mutation Associated Cardiomyopathy. PLoS ONE 2014, 9, e94820. [Google Scholar] [CrossRef]
  17. Schipke, J.; Brandenberger, C.; Rajces, A.; Manninger, M.; Alogna, A.; Post, H.; Mühlfeld, C. Assessment of Cardiac Fibrosis: A Morphometric Method Comparison for Collagen Quantification. J. Appl. Physiol. 2017, 122, 1019–1030. [Google Scholar] [CrossRef]
  18. Gaspard, G.J.; Pasumarthi, K.B.S. Quantification of Cardiac Fibrosis by Colour-Subtractive Computer-Assisted Image Analysis. Clin. Exp. Pharmacol. Physiol. 2008, 35, 679–686. [Google Scholar] [CrossRef]
  19. Wülfers, E.M.; Greiner, J.; Giese, M.; Madl, J.; Kroll, J.; Stiller, B.; Kohl, P.; Rog-Zielinska, E.A.; Fürniss, H.E. Quantitative Collagen Assessment in Right Ventricular Myectomies from Patients with Tetralogy of Fallot. Europace 2021, 23, i38–i47. [Google Scholar] [CrossRef]
  20. Born, M.; Wolf, E. Principles of Optics, 6th ed.; Pergamon Press Ltd.: Oxford, UK, 1986. [Google Scholar]
  21. Bass, M. Handbook of Optics: Geometrical and Physical Optics, Polarized Light, Components and Instruments, 3rd ed.; The McGraw-Hill Companies, Inc.: London, UK, 2010. [Google Scholar]
  22. Moon, J.C.C.; Reed, E.; Sheppard, M.N.; Elkington, A.G.; Ho, S.Y.; Burke, M.; Petrou, M.; Pennell, D.J. The Histologic Basis of Late Gadolinium Enhancement Cardiovascular Magnetic Resonance in Hypertrophic Cardiomyopathy. J. Am. Coll. Cardiol. 2004, 43, 2260–2264. [Google Scholar] [CrossRef]
  23. Nart, P.; Williams, A.; Thompson, H.; Innocent, G.T. Morphometry of Bovine Dilated Cardiomyopathy. J. Comp. Pathol. 2004, 130, 235–245. [Google Scholar] [CrossRef] [PubMed]
  24. Ophof, R.; Maltha, J.C.; Von den Hoff, J.W.; Kuijpers-Jagtman, A.-M. Histologic Evaluation of Skin-Derived and Collagen-Based Substrates Implanted in Palatal Wounds. Wound Repair Regen. 2004, 12, 528–538. [Google Scholar] [CrossRef] [PubMed]
  25. Disertori, M.; Masè, M.; Marini, M.; Mazzola, S.; Cristoforetti, A.; Del Greco, M.; Kottkamp, H.; Arbustini, E.; Ravelli, F. Electroanatomic Mapping and Late Gadolinium Enhancement MRI in a Genetic Model of Arrhythmogenic Atrial Cardiomyopathy. J. Cardiovasc. Electrophysiol. 2014, 25, 964–970. [Google Scholar] [CrossRef] [PubMed]
  26. Goette, A.; Juenemann, G.; Peters, B.; Klein, H.U.; Roessner, A.; Huth, C.; Röcken, C. Determinants and Consequences of Atrial Fibrosis in Patients Undergoing Open Heart Surgery. Cardiovasc. Res. 2002, 54, 390–396. [Google Scholar] [CrossRef] [Green Version]
  27. Swartz, M.F.; Fink, G.W.; Lutz, C.J.; Taffet, S.M.; Berenfeld, O.; Vikstrom, K.L.; Kasprowicz, K.; Bhatta, L.; Puskas, F.; Kalifa, J.; et al. Left versus Right Atrial Difference in Dominant Frequency, K(+) Channel Transcripts, and Fibrosis in Patients Developing Atrial Fibrillation after Cardiac Surgery. Heart Rhythm 2009, 6, 1415–1422. [Google Scholar] [CrossRef] [Green Version]
  28. Nguyen, B.L.; Fishbein, M.C.; Chen, L.S.; Chen, P.-S.; Masroor, S. Histopathological Substrate for Chronic Atrial Fibrillation in Humans. Heart Rhythm 2009, 6, 454–460. [Google Scholar] [CrossRef] [Green Version]
  29. Platonov, P.G.; Mitrofanova, L.B.; Orshanskaya, V.; Ho, S.Y. Structural Abnormalities in Atrial Walls Are Associated with Presence and Persistency of Atrial Fibrillation but Not with Age. J. Am. Coll. Cardiol. 2011, 58, 2225–2232. [Google Scholar] [CrossRef] [Green Version]
  30. Eckstein, J.; Zeemering, S.; Linz, D.; Maesen, B.; Verheule, S.; van Hunnik, A.; Crijns, H.; Allessie, M.A.; Schotten, U. Transmural Conduction Is the Predominant Mechanism of Breakthrough during Atrial Fibrillation: Evidence from Simultaneous Endo-Epicardial High-Density Activation Mapping. Circ. Arrhythm. Electrophysiol. 2013, 6, 334–341. [Google Scholar] [CrossRef] [Green Version]
  31. Burton, R.A.B.; Lee, P.; Casero, R.; Garny, A.; Siedlecka, U.; Schneider, J.E.; Kohl, P.; Grau, V. Three-Dimensional Histology: Tools and Application to Quantitative Assessment of Cell-Type Distribution in Rabbit Heart. Europace 2014, 16 (Suppl. 4), iv86–iv95. [Google Scholar] [CrossRef]
  32. Camelliti, P.; Al-Saud, S.A.; Smolenski, R.T.; Al-Ayoubi, S.; Bussek, A.; Wettwer, E.; Banner, N.R.; Bowles, C.T.; Yacoub, M.H.; Terracciano, C.M. Adult Human Heart Slices Are a Multicellular System Suitable for Electrophysiological and Pharmacological Studies. J. Mol. Cell. Cardiol. 2011, 51, 390–398. [Google Scholar] [CrossRef]
  33. Schalla, S.; Bekkers, S.C.; Dennert, R.; van Suylen, R.J.; Waltenberger, J.; Leiner, T.; Wildberger, J.; Crijns, H.J.; Heymans, S. Replacement and Reactive Myocardial Fibrosis in Idiopathic Dilated Cardiomyopathy: Comparison of Magnetic Resonance Imaging with Right Ventricular Biopsy. Eur. J. Heart Fail. 2010, 12, 227–231. [Google Scholar] [CrossRef] [PubMed]
  34. Nogueira, D.M.B.; Figadoli, A.L.d.F.; Alcantara, P.L.; Pomini, K.T.; German, I.J.S.; Reis, C.H.B.; Júnior, G.M.R.; Rosso, M.P.d.O.; Santos, P.S.d.S.; Zangrando, M.S.R.; et al. Biological Behavior of Xenogenic Scaffolds in Alcohol-Induced Rats: Histomorphometric and Picrosirius Red Staining Analysis. Polymers 2022, 14, 584. [Google Scholar] [CrossRef] [PubMed]
  35. Grimm, P.C.; Nickerson, P.; Gough, J.; McKenna, R.; Stern, E.; Jeffery, J.; Rush, D.N. Computerized Image Analysis of Sirius Red-Stained Renal Allograft Biopsies as a Surrogate Marker to Predict Long-Term Allograft Function. J. Am. Soc. Nephrol. 2003, 14, 1662–1668. [Google Scholar] [CrossRef] [PubMed] [Green Version]
  36. Greiner, C.; Grainger, S.; Farrow, S.; Davis, A.; Su, J.L.; Saybolt, M.D.; Wilensky, R.; Madden, S.; Sum, S.T. Robust Quantitative Assessment of Collagen Fibers with Picrosirius Red Stain and Linearly Polarized Light as Demonstrated on Atherosclerotic Plaque Samples. PLoS ONE 2021, 16, e0248068. [Google Scholar] [CrossRef]
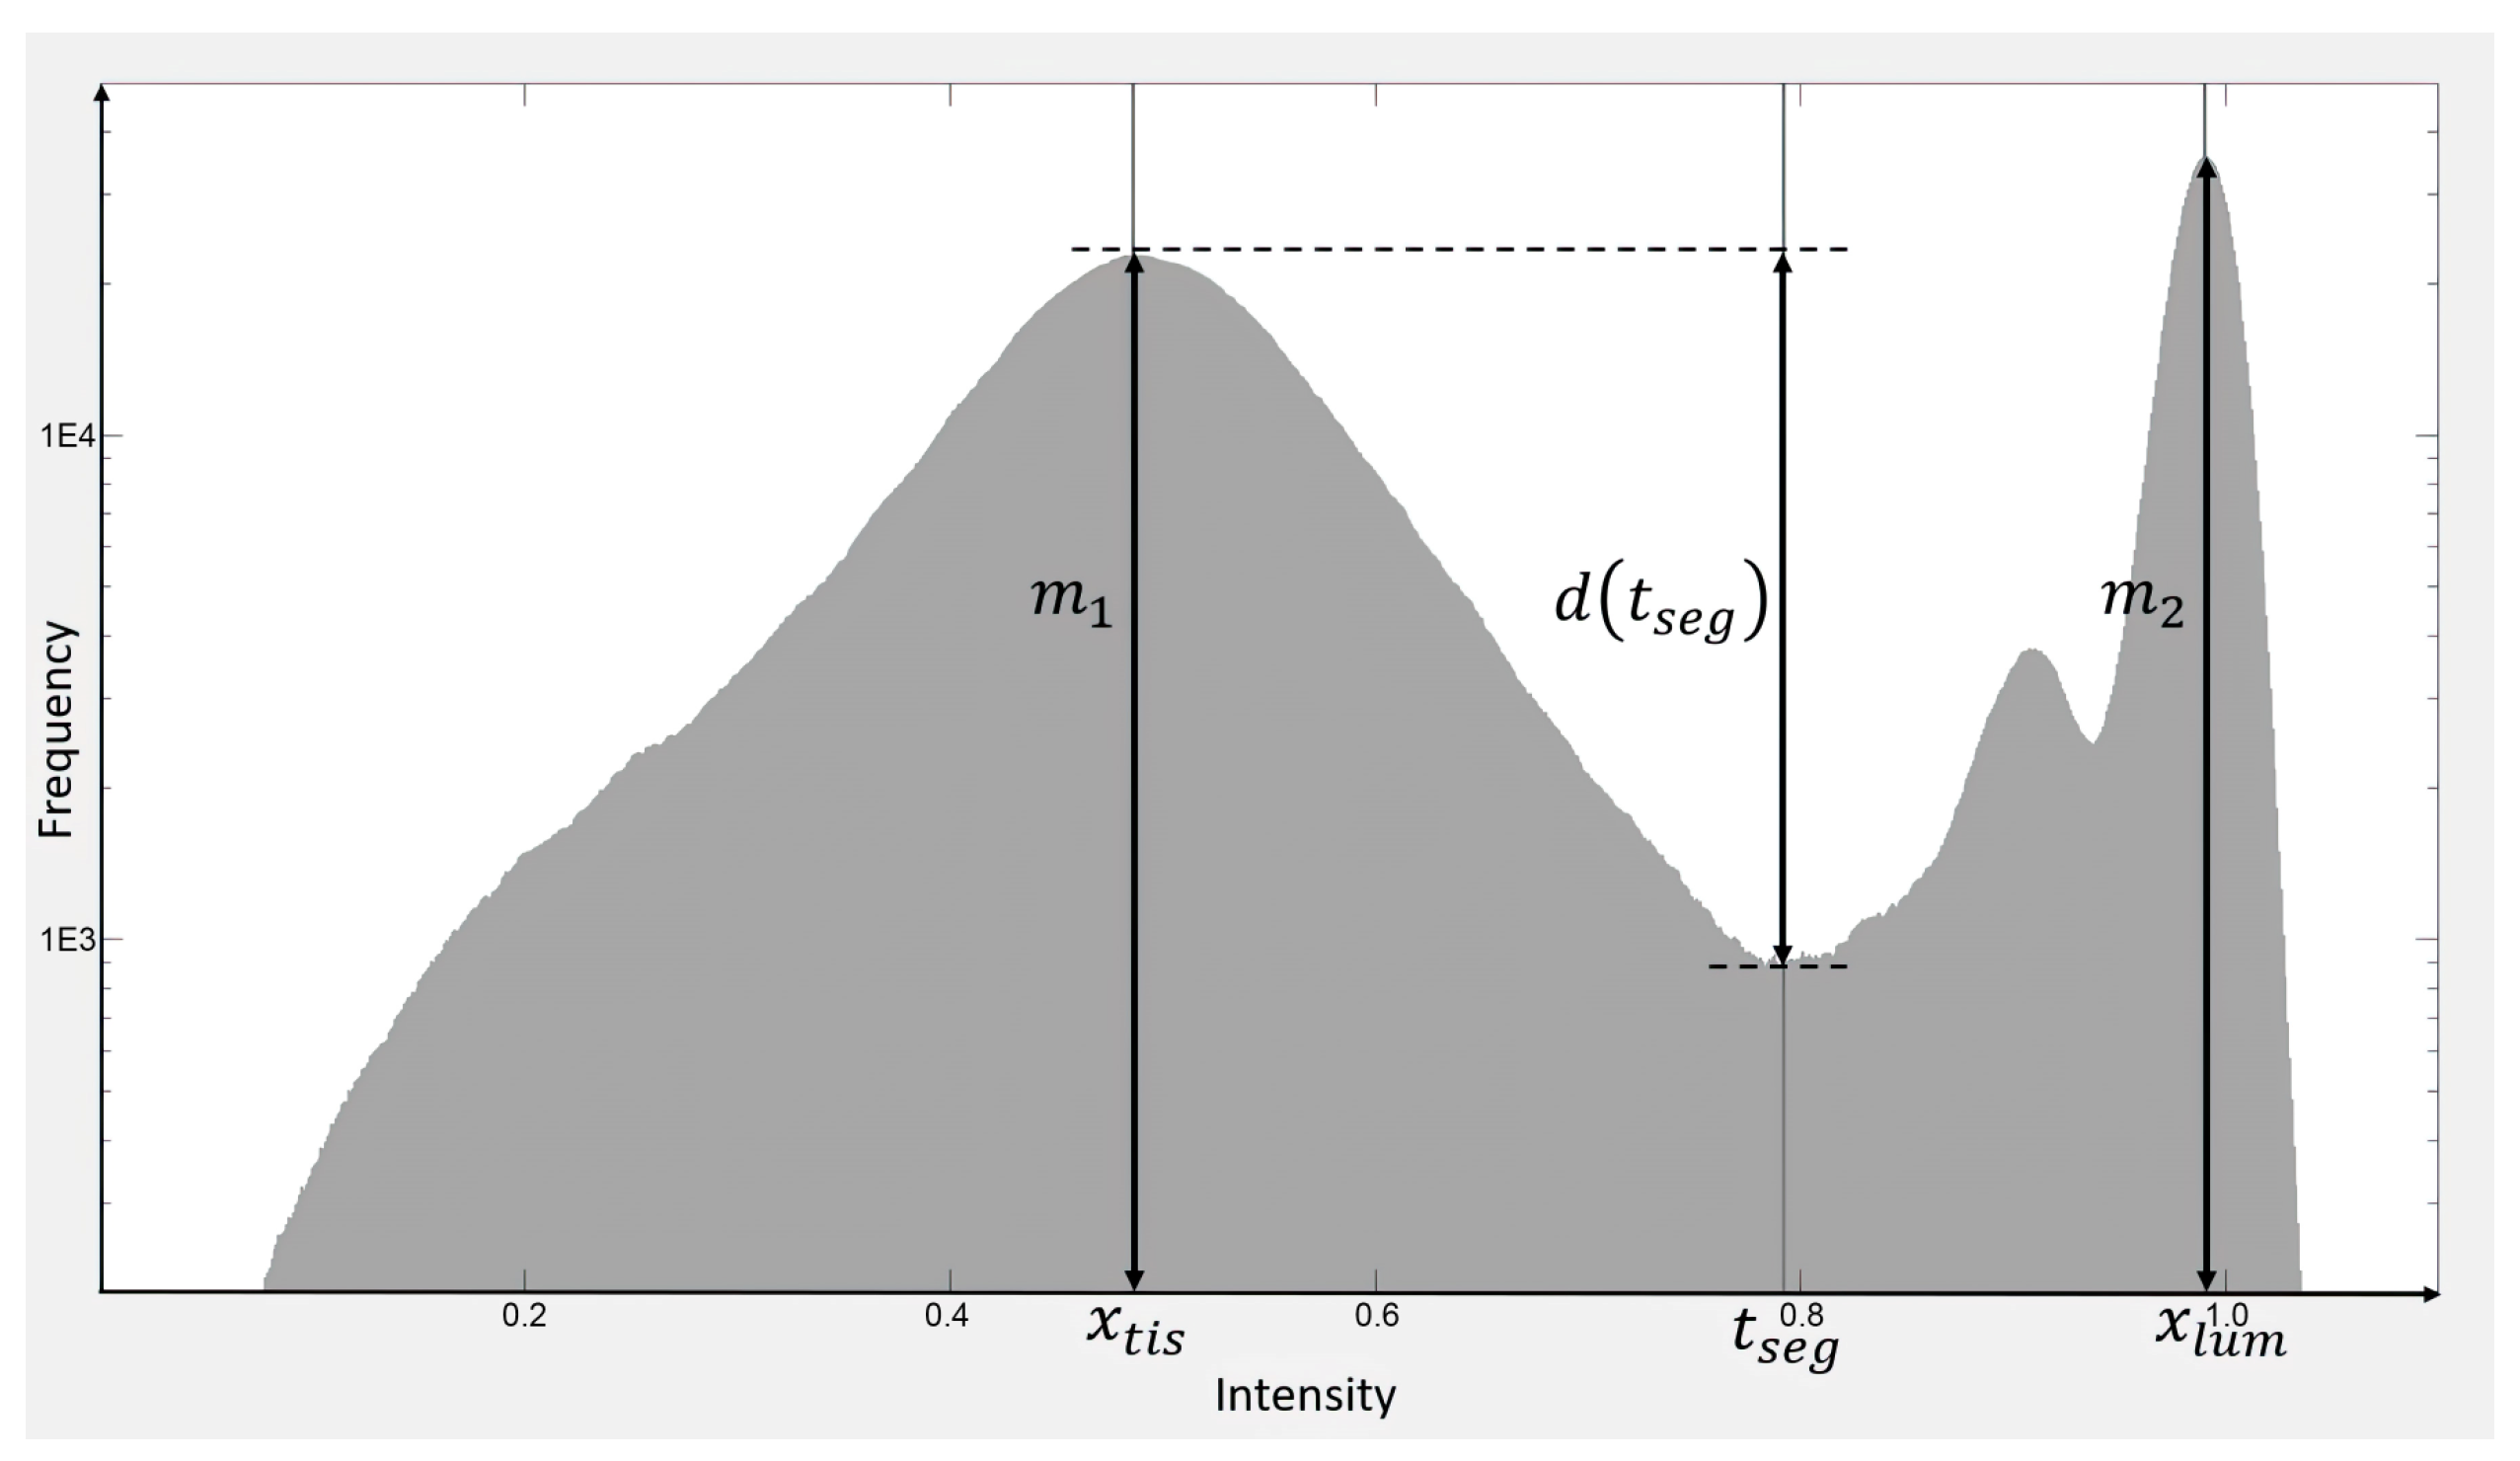
Figure 2. Automatic detection of the threshold ( t s e g ) for separating tissue from luminal area in each channel of the illuminance-corrected bright-field image B i . In the histogram (in grey), t s e g is placed at the minimum d ( t s e g ) between the tissue peak ( m 1 ) at position x t i s and the lumen peak ( m 2 ) at position x l u m . The histogram is shown in semi-logarithmic scale.
Applsci 13 02916 g002
Figure 3. Segmentation of tissue from luminal area and calculation of the transmittance in a representative tissue slice: (a) Smoothed histogram of the original bright-field image A p i separated in the red (R), green (G), and blue (B) channels. The nonuniform illumination causes the values of the luminal area to overlap with those corresponding to the tissue area; (b) Original bright-field image A p i (windowed 0–65,535), affected by nonuniform illumination; (c) Smoothed histogram of the bright-field image B i separated in the red (R), green (G), and blue (B) channels. For each channel, the corrected illumination allows the separation of the lumen peak at x l u m (grey line) from the tissue peak at x t i s (black line) by the threshold t s e g (magenta line); (d) Sample transmittance image T s i obtained by white-balancing B i according to the white point x l u m . The black contour indicates the border of m a s k t i s i , obtained by thresholding B i at t s e g . The threshold separates the luminal and tissue area, represented by the right and left portions of the histogram with respect to the magenta line in (c).
Applsci 13 02916 g003
Figure 4. Birefringence processing and collagen segmentation: (a) Original dark-field image A c i (windowed 0–32,768); (b) RGB birefringence signal in Equation (13) obtained after correcting for nonuniform illumination, transmittance of the sample, and crossed transmittance T c of the polarizers (windowed 0–0.05); (c) RGB birefringence signal S b i r i , obtained according to Equation (14) by normalizing the original optical thickness of 0.22 to unitary optical thickness (windowed 0–0.5); (d) Greyscale collagen signal S c o l i from Equation (15) (windowed 0–0.5). The collagen mask m a s k c o l i was obtained for a collagen threshold t c o l = 0.152. The high-collagen area, contoured in yellow, comprised a collagen fraction c i = 14.4%.
Applsci 13 02916 g004aApplsci 13 02916 g004b
Figure 5. Correction for sample thickness variability. The robustness of the algorithm against sample thickness variability is examined comparing a slice of average optical thickness = 0.36 (left column) with a nearby slice of average optical thickness = 0.21 (right column): (a,b) The sample transmittances T s i evidences the different tissue thickness between the two samples; (c,d) Original dark-field images A c i (windowed 0–32,768); (e,f) RGB birefringence signal images S b i r i (windowed 0–0.5); (g,h) Greyscale collagen signal images S c o l i (windowed 0–0.5). The collagen mask for a threshold t c o l = 0.152 is contoured in yellow. The estimated collagen fractions were c i = 8.1% and 11.1%, respectively.
Applsci 13 02916 g005aApplsci 13 02916 g005b
Figure 6. Representative sections in a sinus rhythm representative patient (left column) and in an atrial fibrillation patient (right column): (a,b) Section transmittances T s i ; (c,d) RGB birefringence signal S b i r i (windowed 0–0.5); (e,f) Greyscale collagen signal images S c o l i (windowed 0–0.5). The collagen mask for the collagen threshold t c o l = 0.152 is contoured in yellow. Measured collagen fractions c i were 3.4% and 18.9%, respectively.
Applsci 13 02916 g006
Figure 7. Proof of concept application of the algorithm to cardiac sample image database. Algorithm-estimated values for the amount (left panel) and heterogeneity (right panel) of mid-wall fibrosis are compared in patients with sinus rhythm (SR) and in patients with atrial fibrillation (AF). AF patients displayed larger and more heterogeneous fibrosis content. In boxplots, red lines are median values, blue boxes indicate interquartile ranges (IQR) and black whiskers 1.5*IQR. Individual values are superimposed as black dots. *, p < 0.05. N = 14.
Applsci 13 02916 g007
Figure 8. Sensitivity analysis on the effects of collagen threshold t c o l on fibrosis detection. Fibrosis fraction for the sinus rhythm (SR, green) and atrial fibrillation (AF, red) groups are displayed as a function of the threshold t c o l . Both parameters displayed a progressive decrease at the increase of the threshold, but differences between the two groups remained statistically significant at all threshold values. Data are expressed as mean (dot) ± standard deviation (whiskers) over the two subgroups. *, p < 0.05. N = 14.
Applsci 13 02916 g008
Disclaimer/Publisher’s Note: The statements, opinions and data contained in all publications are solely those of the individual author(s) and contributor(s) and not of MDPI and/or the editor(s). MDPI and/or the editor(s) disclaim responsibility for any injury to people or property resulting from any ideas, methods, instructions or products referred to in the content.