Article

Differential Expression Analysis of Blood MicroRNA in Identifying Potential Genes Relevant to Alzheimer’s Disease Pathogenesis, Using an Integrated Bioinformatics and Machine Learning Approach

1
Bioinformatics Programme, Institute of Biological Sciences, Faculty of Science, Universiti Malaya, Kuala Lumpur 50603, Malaysia
2
Department of Pathology, Faculty of Medicine, Universiti Malaya, Kuala Lumpur 50603, Malaysia
3
Department of Medicine, Faculty of Medicine, Universiti Malaya, Kuala Lumpur 50603, Malaysia
4
Centre of Research in System Biology, Structural, Bioinformatics and Human Digital Imaging (CRYSTAL), Universiti Malaya, Kuala Lumpur 50603, Malaysia
*
Author to whom correspondence should be addressed.
Appl. Sci. 2023, 13(5), 3071; https://doi.org/10.3390/app13053071
Submission received: 7 February 2023 / Revised: 24 February 2023 / Accepted: 24 February 2023 / Published: 27 February 2023

Abstract

:
Alzheimer’s disease (AD) is a neurodegenerative disease characterized by cognitive and functional impairment. Recent research has focused on the deregulation of microRNAs (miRNAs) in blood as the potential biomarkers for AD. As such, a differential expression analysis of miRNAs was conducted in this study using an integrated framework that utilized the advantages of statistical and machine learning approaches. Three miRNA candidates that showed the strongest significance and correlation with each other, namely hsa-miR-6501-5p, hsa-miR-4433b-5p, and hsa-miR-143-3p, were identified. The roles and functions of the identified differentiated miRNA candidates with AD development were verified by predicting their target mRNAs, and their networks of interaction in AD pathogenesis were investigated. Pathway analysis showed that the pathways involved in contributing to the development of AD included oxidative phosphorylation, mitochondrial dysfunction, and calcium-mediated signalling. This study supports evidence that the miRNA expression changes in AD and indicates the need for further study in this area.

1. Introduction

Alzheimer’s disease (AD) is the most common neurodegenerative disease that causes a dementing syndrome. It is clinically recognized by cognitive dysfunction, such as memory loss and behavioural changes that significantly impact functional ability [1]. AD is characterized pathologically by the abnormal accumulation of extracellular amyloid-β peptide () plaques and intraneuronal neurofibrillary tangles (NFTs) composed of hyperphosphorylated tau protein in the brain [2,3]. The abnormal accumulation of these proteins is thought to lead sequentially to neuroinflammation, neuronal cell death, synaptic dysfunction, and finally, cognitive impairment [2]. AD appears to be genetically dichotomous, with rare mutations in amyloid precursor protein (APP), presenilin 1 (PSEN1), and presenilin 2 (PSEN2) associated with early-onset familial AD, and apolipoprotein E4 (APOE4) polymorphism associated with an increased risk of late-onset AD [4].
The diagnostic accuracy for AD has increased with the use of new neuroimaging modalities, such as amyloid or tau positron emission tomography (PET) scans, and the evaluation of biomarkers in cerebrospinal fluid (CSF), obtained via lumbar puncture [5]. However, these procedures are not suitable for the screening of normal populations as they are prohibitively expensive or invasive [5]. Hence, attention has been drawn to the application of blood-based biomarkers, which is comparably more accessible and well-tolerated in regular clinical practice, to investigate and identify AD [5,6].
MicroRNAs (miRNAs), which circulate in the peripheral blood system, may be potential biomarkers for AD. The emergence of next-generation sequencing (NGS) technology, such as RNA sequencing (RNA-seq), of small RNAs enables the reading of thousands or millions of miRNA molecules, lending an understanding of their roles in neurodegenerative diseases for investigation. miRNAs are small (approx. 18–25 nucleotides long), non-coding RNA molecules that regulate posttranscriptional gene expression by binding to the 3′- untranslated regions of messenger RNAs (mRNAs). The changes in expression of a miRNA can repress the translation of many mRNAs (gene silencing), influencing the amounts and functions of numerous proteins. A miRNA can target multiple mRNAs, including mRNAs that exert contradicting effects within the same molecular pathway [7]. Several miRNAs that regulate the synthesis of activity-mediated proteins, affecting the underlying processes of cognitive function and disease risk/progression in AD, have previously been identified. miRNAs are abundant and stable in human bodily fluids, including the blood and the CSF, as compared to mRNAs, making miRNAs easier to evaluate and study [8].
Studies investigating the possibility of miRNAs as biomarkers for AD suggested that the dysregulation of miRNAs in blood may be able to reflect the pathological process of neuronal impairment that occurs in AD [5,6,9]. Aberrant expressions of miRNAs have been identified in AD, such as miR-101, miR-20a, and miR-17, which appear to negatively regulate the expression of APP [10,11]. Others, such as miR-22-3p and miR-340, were found to significantly alleviate levels in AD [11], whereas miR-107 levels were found to be negatively correlated with APOE4 [10,11,12,13]. The suppression of miR-203 was also found to downregulate APOE4 and tau in mice [11].
The analysis of complex and highly heterogeneous AD expression data requires strong computational power to untangle the network of interactions between the miRNAs and to select the most likely candidates with the highest sensitivity and specificity in relation to AD [14]. The “curse of dimensionality”, caused by the presence of large variables but a small sample size in a dataset, often poses the biggest challenge in the analysis of AD data [15]. The unbalanced ratio of the variables to the number of samples gives rise to the problem of overfitting and can increase false-positive results [14]. Although some statistical methods have been reported to perform well with such data comprising smaller sample sizes and high biological replicates [16,17], machine learning methods are deemed to be more reliable in solving data overfitting problems [18]. Feature-selection methods and cross-validation steps carried out during the analysis reportedly perform well at removing noise and outliers in the dataset, while avoiding overfitting caused by the high dimensionality of gene expression data [19].
In most conventional studies, the genes of interest are evaluated through their expression values in a case–control study, where a set of genes with expression that varied in one class, as compared to others, is selected. Numerous statistical models and tests have been developed with the aim of identifying the most significant set of candidates. However, statistical methods only focus on univariate comparison, and the importance of the gene–gene relationship is often neglected. On the contrary, other than predicting outcomes for classes to improve the performance of a model, machine learning can be used to select relevant features by looking into the intrinsic intervariable relationships of the genes.
In AD studies, machine learning methods have been applied to select differential miRNA biomarkers that exhibit similar structural and functional patterns [20]. The recent trend of machine learning in miRNA expression studies in AD mainly focuses on selecting a small set of miRNAs from a group of differentiated miRNAs to obtain more precise and reliable results of association [20,21].
The present case–control study focuses on investigating the differential miRNAs in the peripheral blood of Malaysian AD patients. The population in Malaysia is multi-ethnic and exposed to multicultural environments. Hence, this may result in differences not seen in the findings of studies on monoethnic populations, such as Caucasian, African, and Chinese. The present study started with a data-integration framework that applied statistical and machine learning techniques to identifying potential miRNA candidates that demonstrate differential expression in AD patients as compared with controls. Problems caused by the high dimensionality of the dataset were minimized by conducting a two-step machine learning method in which supervised feature-selection and unsupervised clustering were carried out. In addition, the potential roles of the miRNA candidates in AD pathogenesis were correlated with the functions of their respective targeted mRNAs (genes) by carrying out miRNA target gene prediction. The pathways involved with the identified miRNAs and genes, together with their roles in AD, were discussed in an attempt to reach a more complete understanding of AD development.
The remainder of this paper is structured as follows: Section 2 discusses the existing methods used in the study of AD and the research gaps that need to be filled. Section 3 explains the materials used and the integration framework proposed in this study. Section 4 presents the results, and the findings are discussed in Section 5. Finally, conclusions are drawn and the challenges of this study are highlighted in Section 6.

2. Related Works

Previous studies have proposed the application of integrated statistical and machine learning models for the identification of potential miRNA candidates. Lugli et al. (2015) carried out a series of statistical and machine learning analyses to measure differential miRNAs and successfully identified seven miRNAs that showed significant differences in AD. The study compared the performance of several machine learning algorithms; however, the machine learning approaches were not used as a part of the differential miRNA expression analysis, but rather to evaluate how robust each algorithm is [22]. Furthermore, a study of 14 miRNAs with differential expression in an AD group, as compared to normal controls, was conducted [23]. Similar to aforementioned studies, the proposed methods of statistical and machine learning approaches were applied here to carry out different tasks in our study: statistical methods for differential miRNA expression and machine learning for prediction performance.
The lack of the utilization of machine learning techniques in the analysis of differential miRNA expression data, especially in AD-related fields, represents a research gap that needs to be addressed.

3. Methods and Materials

3.1. Subjects

A total of 12 subjects were recruited from the Memory Clinic and the Geriatric Clinic, University of Malaya Medical Centre (UMMC), Kuala Lumpur, Malaysia, for the present study. Blood samples were collected from the subjects, including eight patients diagnosed with AD and four normal controls. All of the subjects were over 65 years of age at the time of recruitment and had been assessed by a geriatrician with experience in dementia care. The selection criteria used in recruiting the subjects are included in the Supplementary Materials, Table S1. The subjects’ details and the corresponding sample IDs used in this study are included in the Supplementary Materials, Table S2. The study protocol was approved by the Medical Research Ethics Committee, UMMC, with the approval number 2020114-9193.
The study was carried out according to the framework illustrated in Figure 1.

3.2. Sample Preparation

A quantity of 6 ml of blood was collected from each subject in a BD Vacutainer EDTA blood collection tube. A series of routine investigations, extraction, and centrifuging were conducted, and the samples were stored at −80 °C until further processing. The details of the procedure are listed in the Supplementary Materials. The DNA and other blood contaminants in the samples were eliminated, and the quantity and purity of the RNA samples were measured using Nanodrop.

3.3. Small RNA-Sequencing Analysis

Small RNA libraries were constructed from the RNA samples using a NEXTflex Illumina Small RNA-seq Kit v3 (Bioo Scientific, Austin, TX, USA), following the manufacturer’s protocol. The libraries were loaded and sequenced on the Illumina NovaSeq 6000, and more than 10 M (1.5 Gb) reads were obtained from each library. The raw reads were first quality-checked, and low-quality bases were trimmed from the 3′ end. Subsequently, the reads were dynamically trimmed for an adapter sequence by using cutadapt [24]. Clean reads were then mapped against the reference genome (H_sapien) using Bowtie [25]. The matched reads were aligned to identify mature miRNAs in miRbase v22. The count data were used for further bioinformatics analysis.

3.4. Integrative Statistical and Machine Learning Analysis

3.4.1. Differential Expression Analysis

(i)
Statistical approach: EdgeR
Raw counts from the miRNA sequencing dataset were filtered to exclude miRNAs with low expressed counts (<10 counts for every sample). The resulting counts were first scaled according to the library size, followed by normalization using a method known as the trimmed mean of M-values (TMM) [26]. The normalization was based on the log-expression ratio of the read count data [26]. Differential miRNA expression analysis was carried out to compare the AD and control groups, based on a linear model generalized by negative binomial distribution in edgeR [27]. A p-value of <0.05 was considered significant and was applied as the threshold for selecting the top differentially expressed miRNA (DEMi) candidates. DEMi candidates with log2 fold-change (FC) values that were >0.5 were considered as upregulated, and those with log2FC < −0.5 were considered as downregulated.
(ii)
Machine learning approach
Step 1: Hybrid carss-SVMRFE feature-selection
Feature-selection was performed using the normalized miRNA dataset (with low-quality reads filtered out) so as to filter out the uninformative genes and to select a subset of genes with the most relevant features. The input expression data were first normalized and log2-transformed according to the trimmed mean of M-values (TMM) in edgeR, which minimized the difference in the miRNAs with low expression counts, creating a fitted dispersion with a weaker bias effect.
The present study implemented supervised feature-selection using a hybrid filter-wrapper approach based on the absolute correlation-adjusted regression survival scores (carss) and multiple support vector machine recursive feature elimination (MSVM-RFE) in packages mlr3 and e1071, R [28,29].
First, the filter method carss was used to select informative variables based on the measurements of the correlation between the “decorrelated” variables, while considering the target outcome (AD/normal control). Subsequently, MSVM-RFE was conducted as the wrapper method to select miRNA subsets that could improve the results for subsequent analysis. A sequential backward elimination procedure was applied in MSVM-RFE recursively (k = 5), and feature-ranking scores were calculated in each fold. The average ranking was computed for each feature, and the best feature subset was selected. At the end of this step, the top 50 ranked features (miRNAs) were selected, and those proceeded to the next step.
Step 2: Principal component analysis (PCA) with self-organizing map (SOM)
Next, SOM [30] was performed using the top 50 miRNAs that were selected in Step 1. SOM is an unsupervised clustering method of neural networks which groups and captures the input pattern of the gene expression data in terms of learning rules and then organizes it to reflect the clustering in the final layer [31]. Therefore, the output of a SOM contains clusters, with each cluster containing features of similar characteristics, and the high dimensionality of the data is reduced. In this study, a SOM with a map size of 2 × 2, with hexagonal topology, was applied. Hierarchical clustering (HC) was then applied to the resulting SOM cluster to further define the clusters. The miRNAs were clustered according to their expression values, without the predefined knowledge of the dependent class labels [32]. The outcomes were visualized using PCA to observe the gene expression patterns of the clusters resulting from the SOM. PCA is a method that has the ability to reduce the dimensionality of the data while compressing the complexity of the data [33,34]. This technique was applied in this study to improve the interpretability of the SOM results.

3.4.2. miRNA Target Gene Prediction

miRNA target gene prediction was performed using DIANA-microT-CDS v5.0 [35]. The prediction threshold was set to 0.7 (sensitive), and the keyword “Alzheimer” was inserted into the queries to identify potential gene targets that are related to AD.

3.4.3. miRNA Pathway and Gene Ontology (GO) Analysis

By utilizing the target genes predicted in the previous step, DIANA-miRPath v3.0 [36] was used to carry out miRNA pathway analysis to discover the possible pathways involved in AD pathogenesis. The target genes were enriched with KEGG pathway [37] and GO analysis [38]. GO terms, including the biological process, the molecular functions, and the cellular functions, were investigated. The significant threshold of p-value <0.05 was corrected according to the false discovery rate (FDR). Additionally, the species “Human” was specified in the query. Significant and common pathways were selected using gene union tools. Furthermore, networks showing the interactions between the miRNAs and the target genes in specific pathways were depicted using Cytoscape [39].

4. Results

Unfortunately, one sample (AD 8) failed during the construction of the small RNA libraries and had to be excluded as analysis of the miRNA concentration of this sample by the Small RNA bioanalyzer produced an inconclusive outcome, thus leaving a total of 11 samples to be entered into the study. As a result, a total of 420 mature miRNAs were included in the analysis after reads of a low quality were removed.

4.1. Statistical Approach: edgeR

In the differential miRNA analysis using edgeR, 12 DEMi candidates (5 upregulated and 7 downregulated) were identified between the AD and normal control groups, with a significant threshold p-value of <0.05 (Table 1).

4.2. Machine Learning Approach

The original, mature miRNAs (n = 420) were first filtered using a supervised hybrid filter-wrapper approach as the feature-selection method. As the result, top 50 ranked miRNAs were identified, and an unsupervised machine learning approach using SOM was performed.
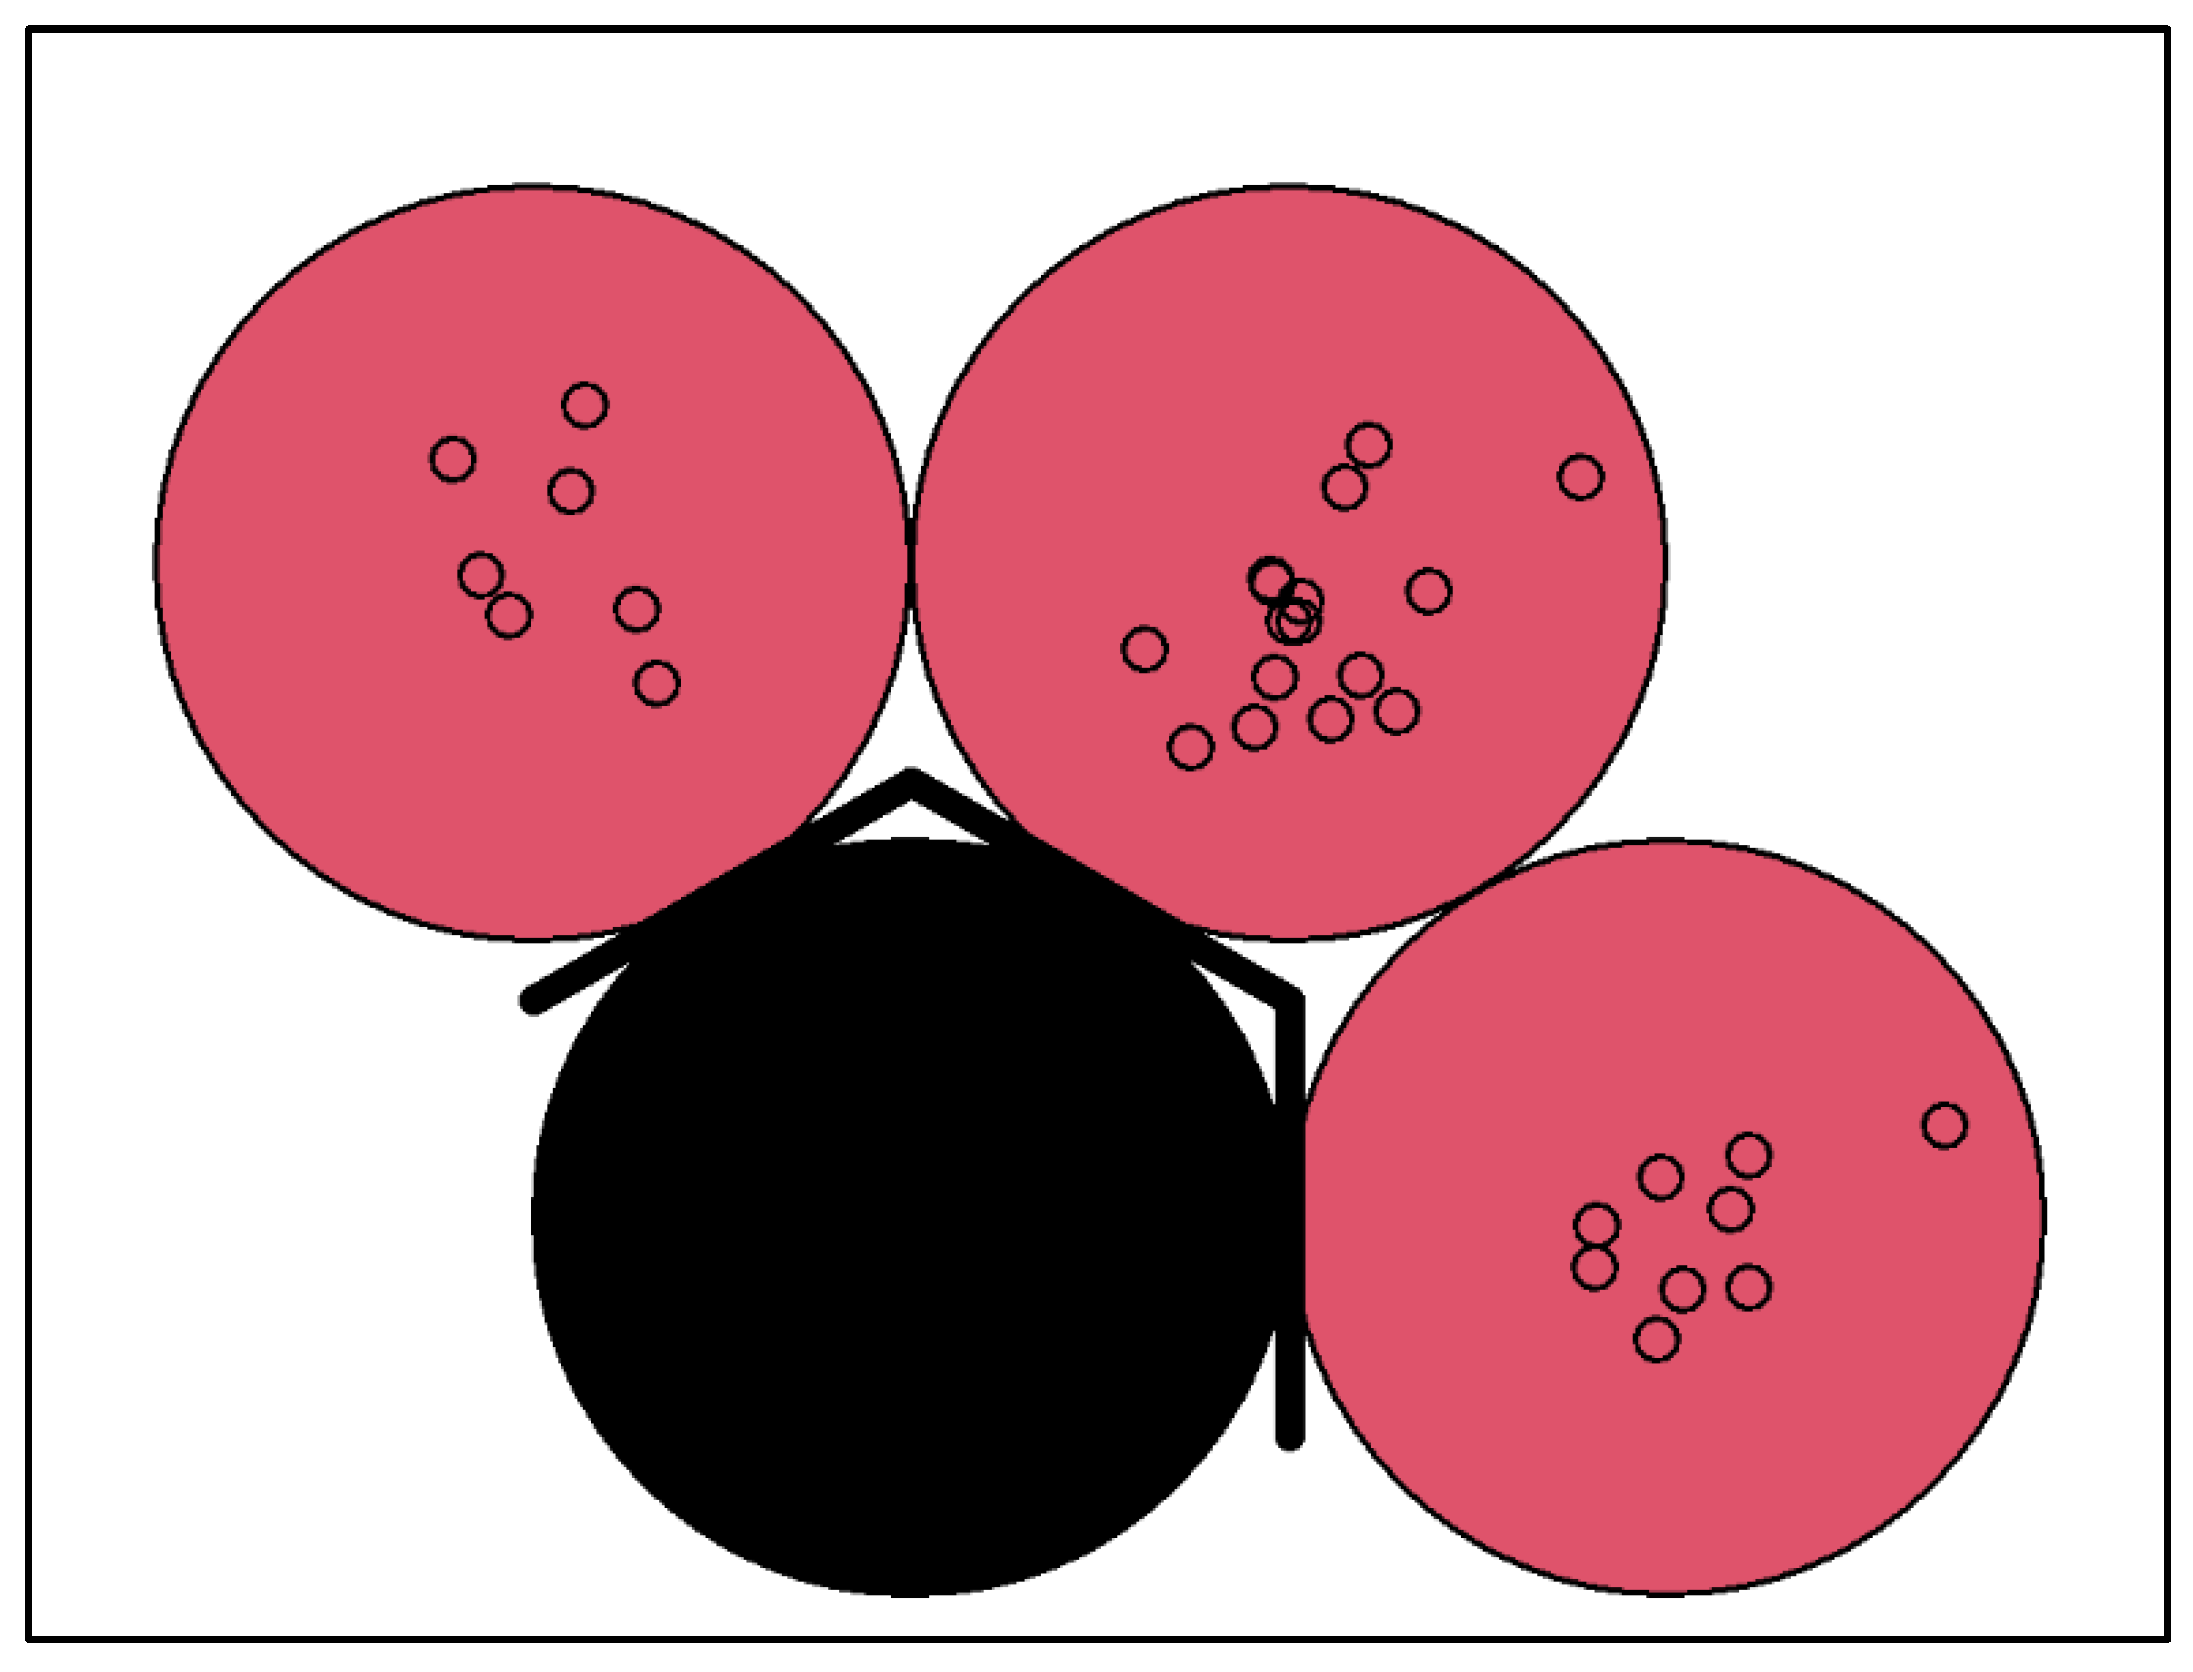
The input data were presented in the 2 × 2 feature output space, which consisted of four neurons in total. A total of 50 features of the data were clustered into 4 neurons. The mean distance was calculated based on the position of each neuron. Following that, additional subclustering was subsequently carried out, using HC on the 2 × 2 feature output space to split the four neurons into two clusters, as shown in Figure 2.
Figure 2 illustrates the subclusters of the four neurons generated in SOM. Of the four neurons, three had higher connectivity with one another (pink), which indicated that these neurons were located in the same cluster. In contrast, the remaining cluster contained only one neuron (black).
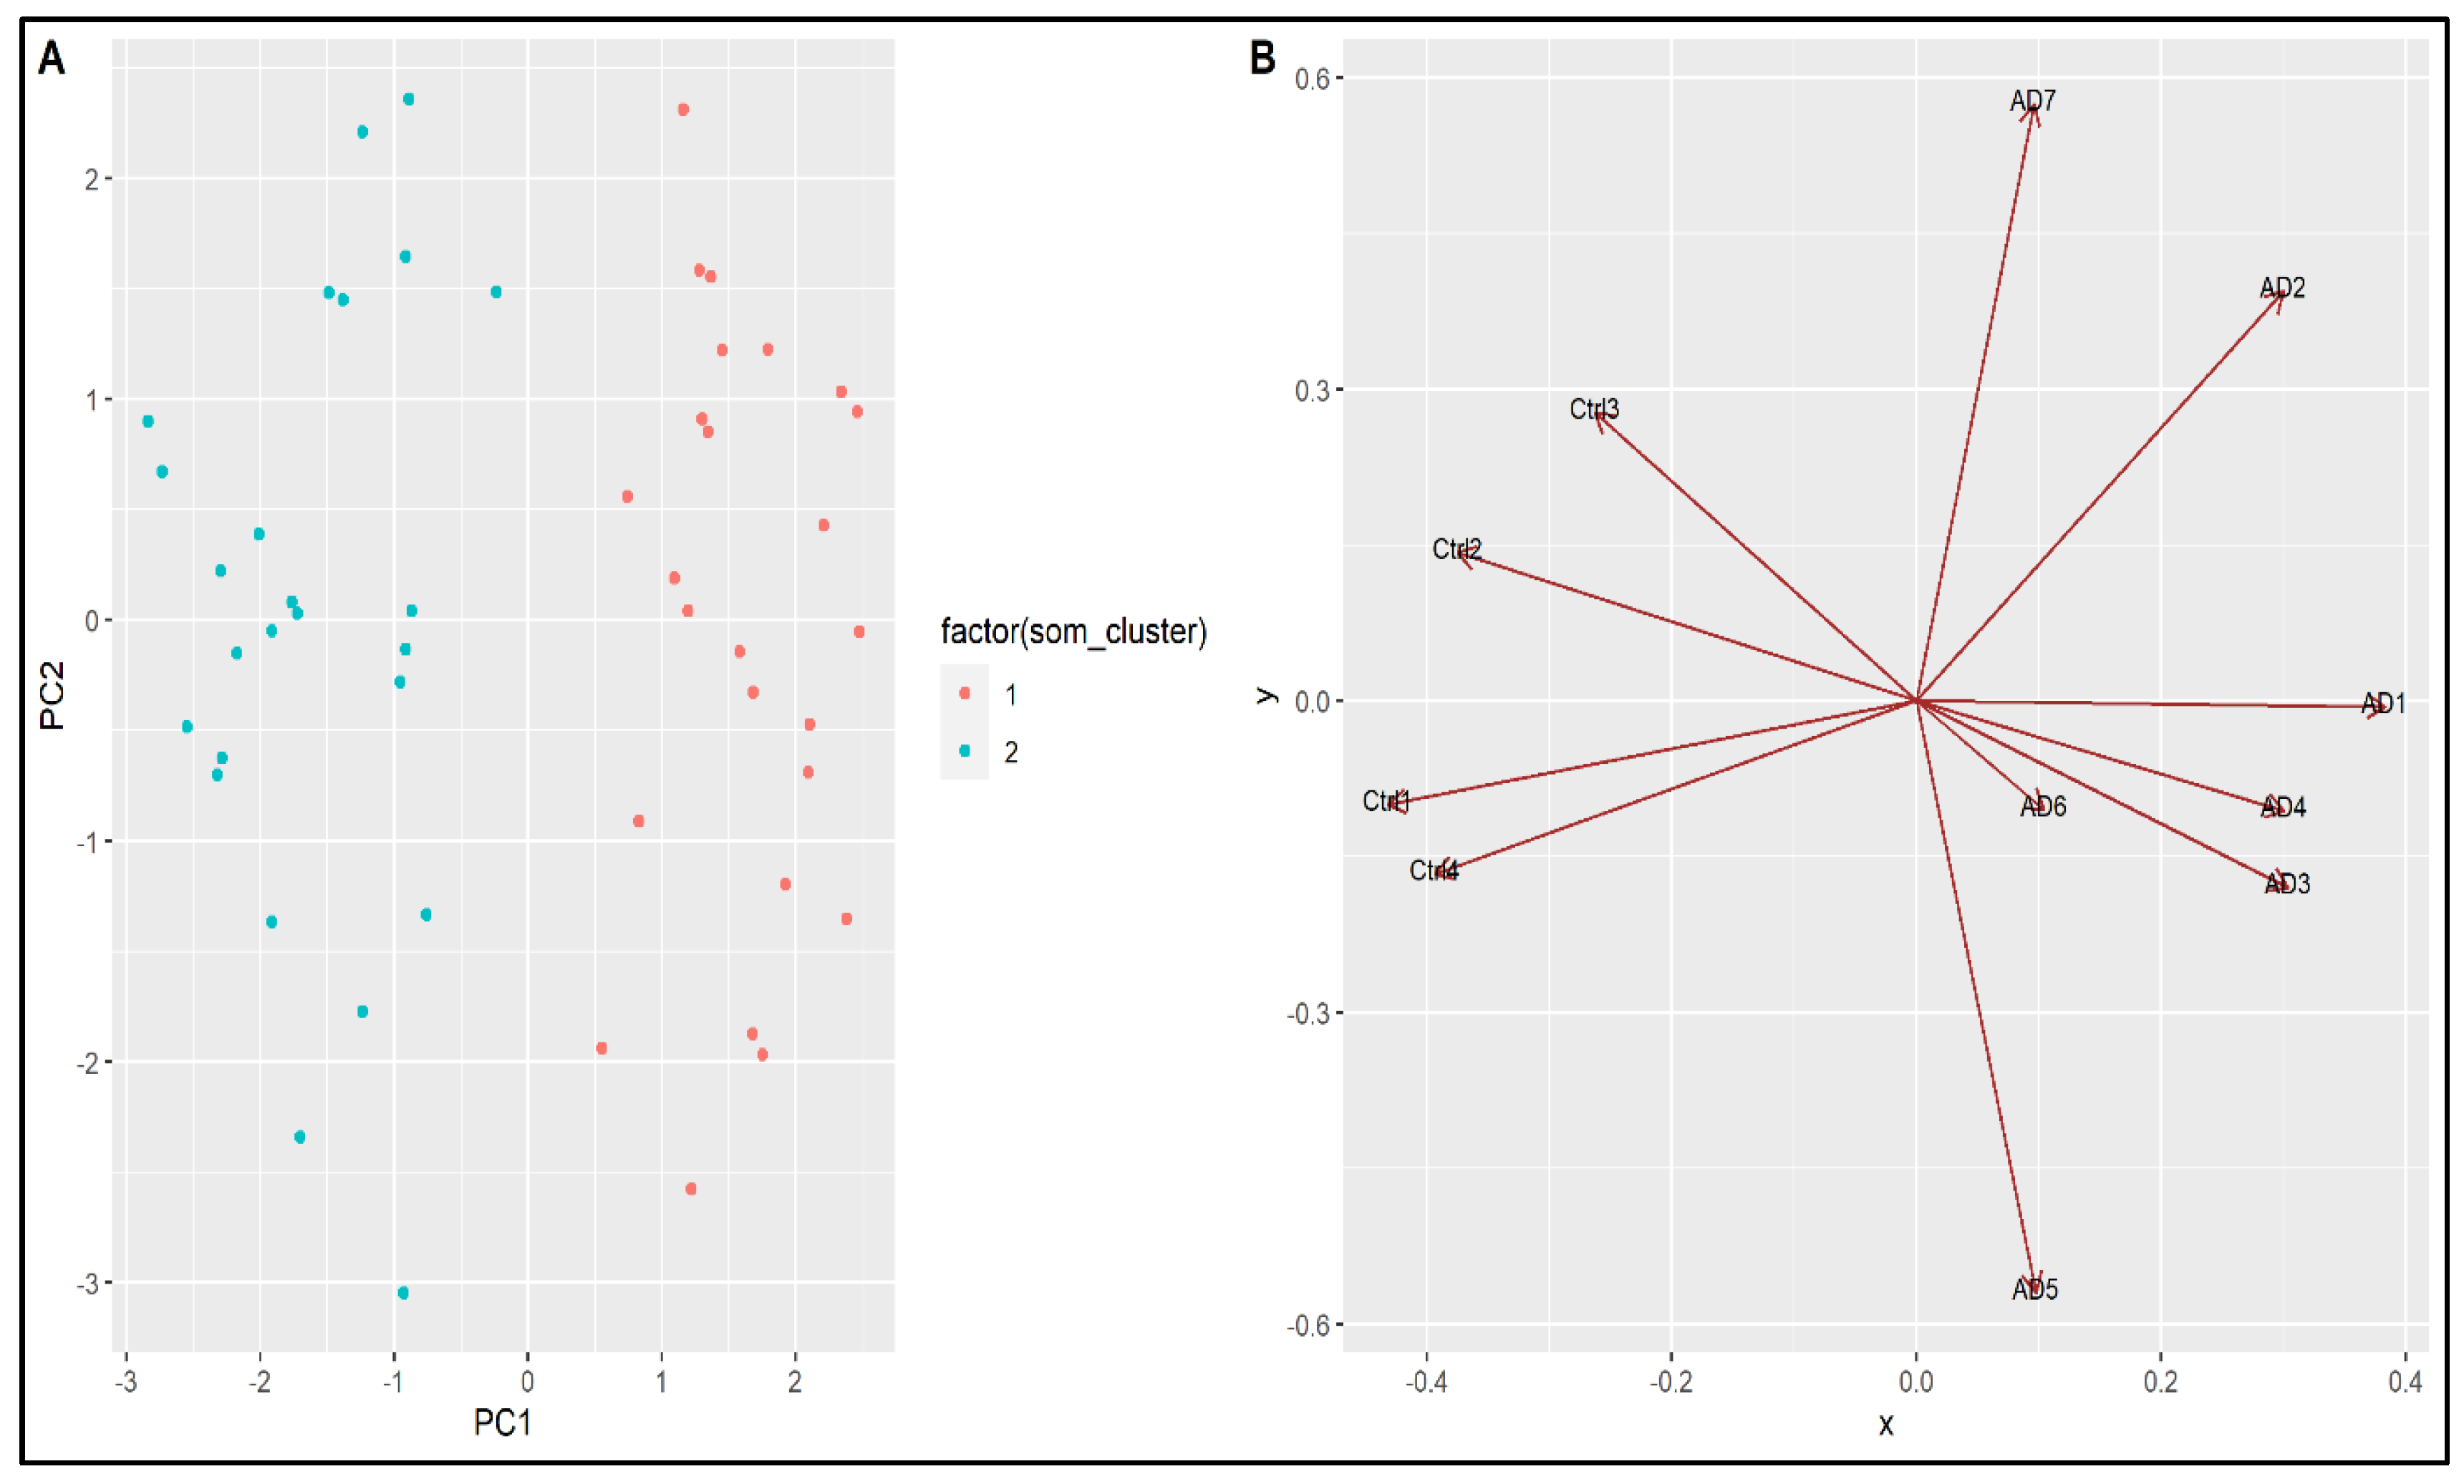
Next, the result was visualized using PCA to produce a more interpretable view of the miRNA clustering. Figure 3A shows the distribution of the miRNAs in the two clusters, as extended from Figure 2. Figure 3B shows the distribution pattern of the samples, indicated by the pointing of the arrows that originate from the centre point. All of the AD samples were located on the right side of the plot, indicating higher values in these samples. Corresponding to the pattern of miRNA clustering in Figure 3A, the miRNAs in SOM cluster 1 (red dots) showed a similar distribution to the AD cohorts in Figure 3B. Hence, the member miRNAs in SOM cluster 1 in Figure 3A were identified, and 24 miRNAs were selected as DEMi candidates.

4.3. Integrated Bioinformatics and Machine Learning Approach

The DEMi candidates identified using the machine learning approach were compared with the DEMi candidates identified using edgeR so as to identify common DEMis. A Venn diagram of this comparison is shown in Figure 4.
Five common DEMis (hsa-miR-6501-5p, hsa-miR-1296-5p, hsa-miR-1307-3p, hsa-miR-4433b-5p, and hsa-miR-143-3p) were identified in this study.

4.4. Target Gene Prediction

Target gene prediction, which was carried out subsequently, identified the mRNAs associated with the five common DEMis. Notably, only three DEMis, hsa-miR-6501-5p, hsa-miR-4433b-5p, and hsa-miR-143-3p, were predicted to be related to AD and thus were selected as the DEMi signatures for this study (Table 2).

4.5. miRNA Pathway and Gene Ontology (GO) Analysis

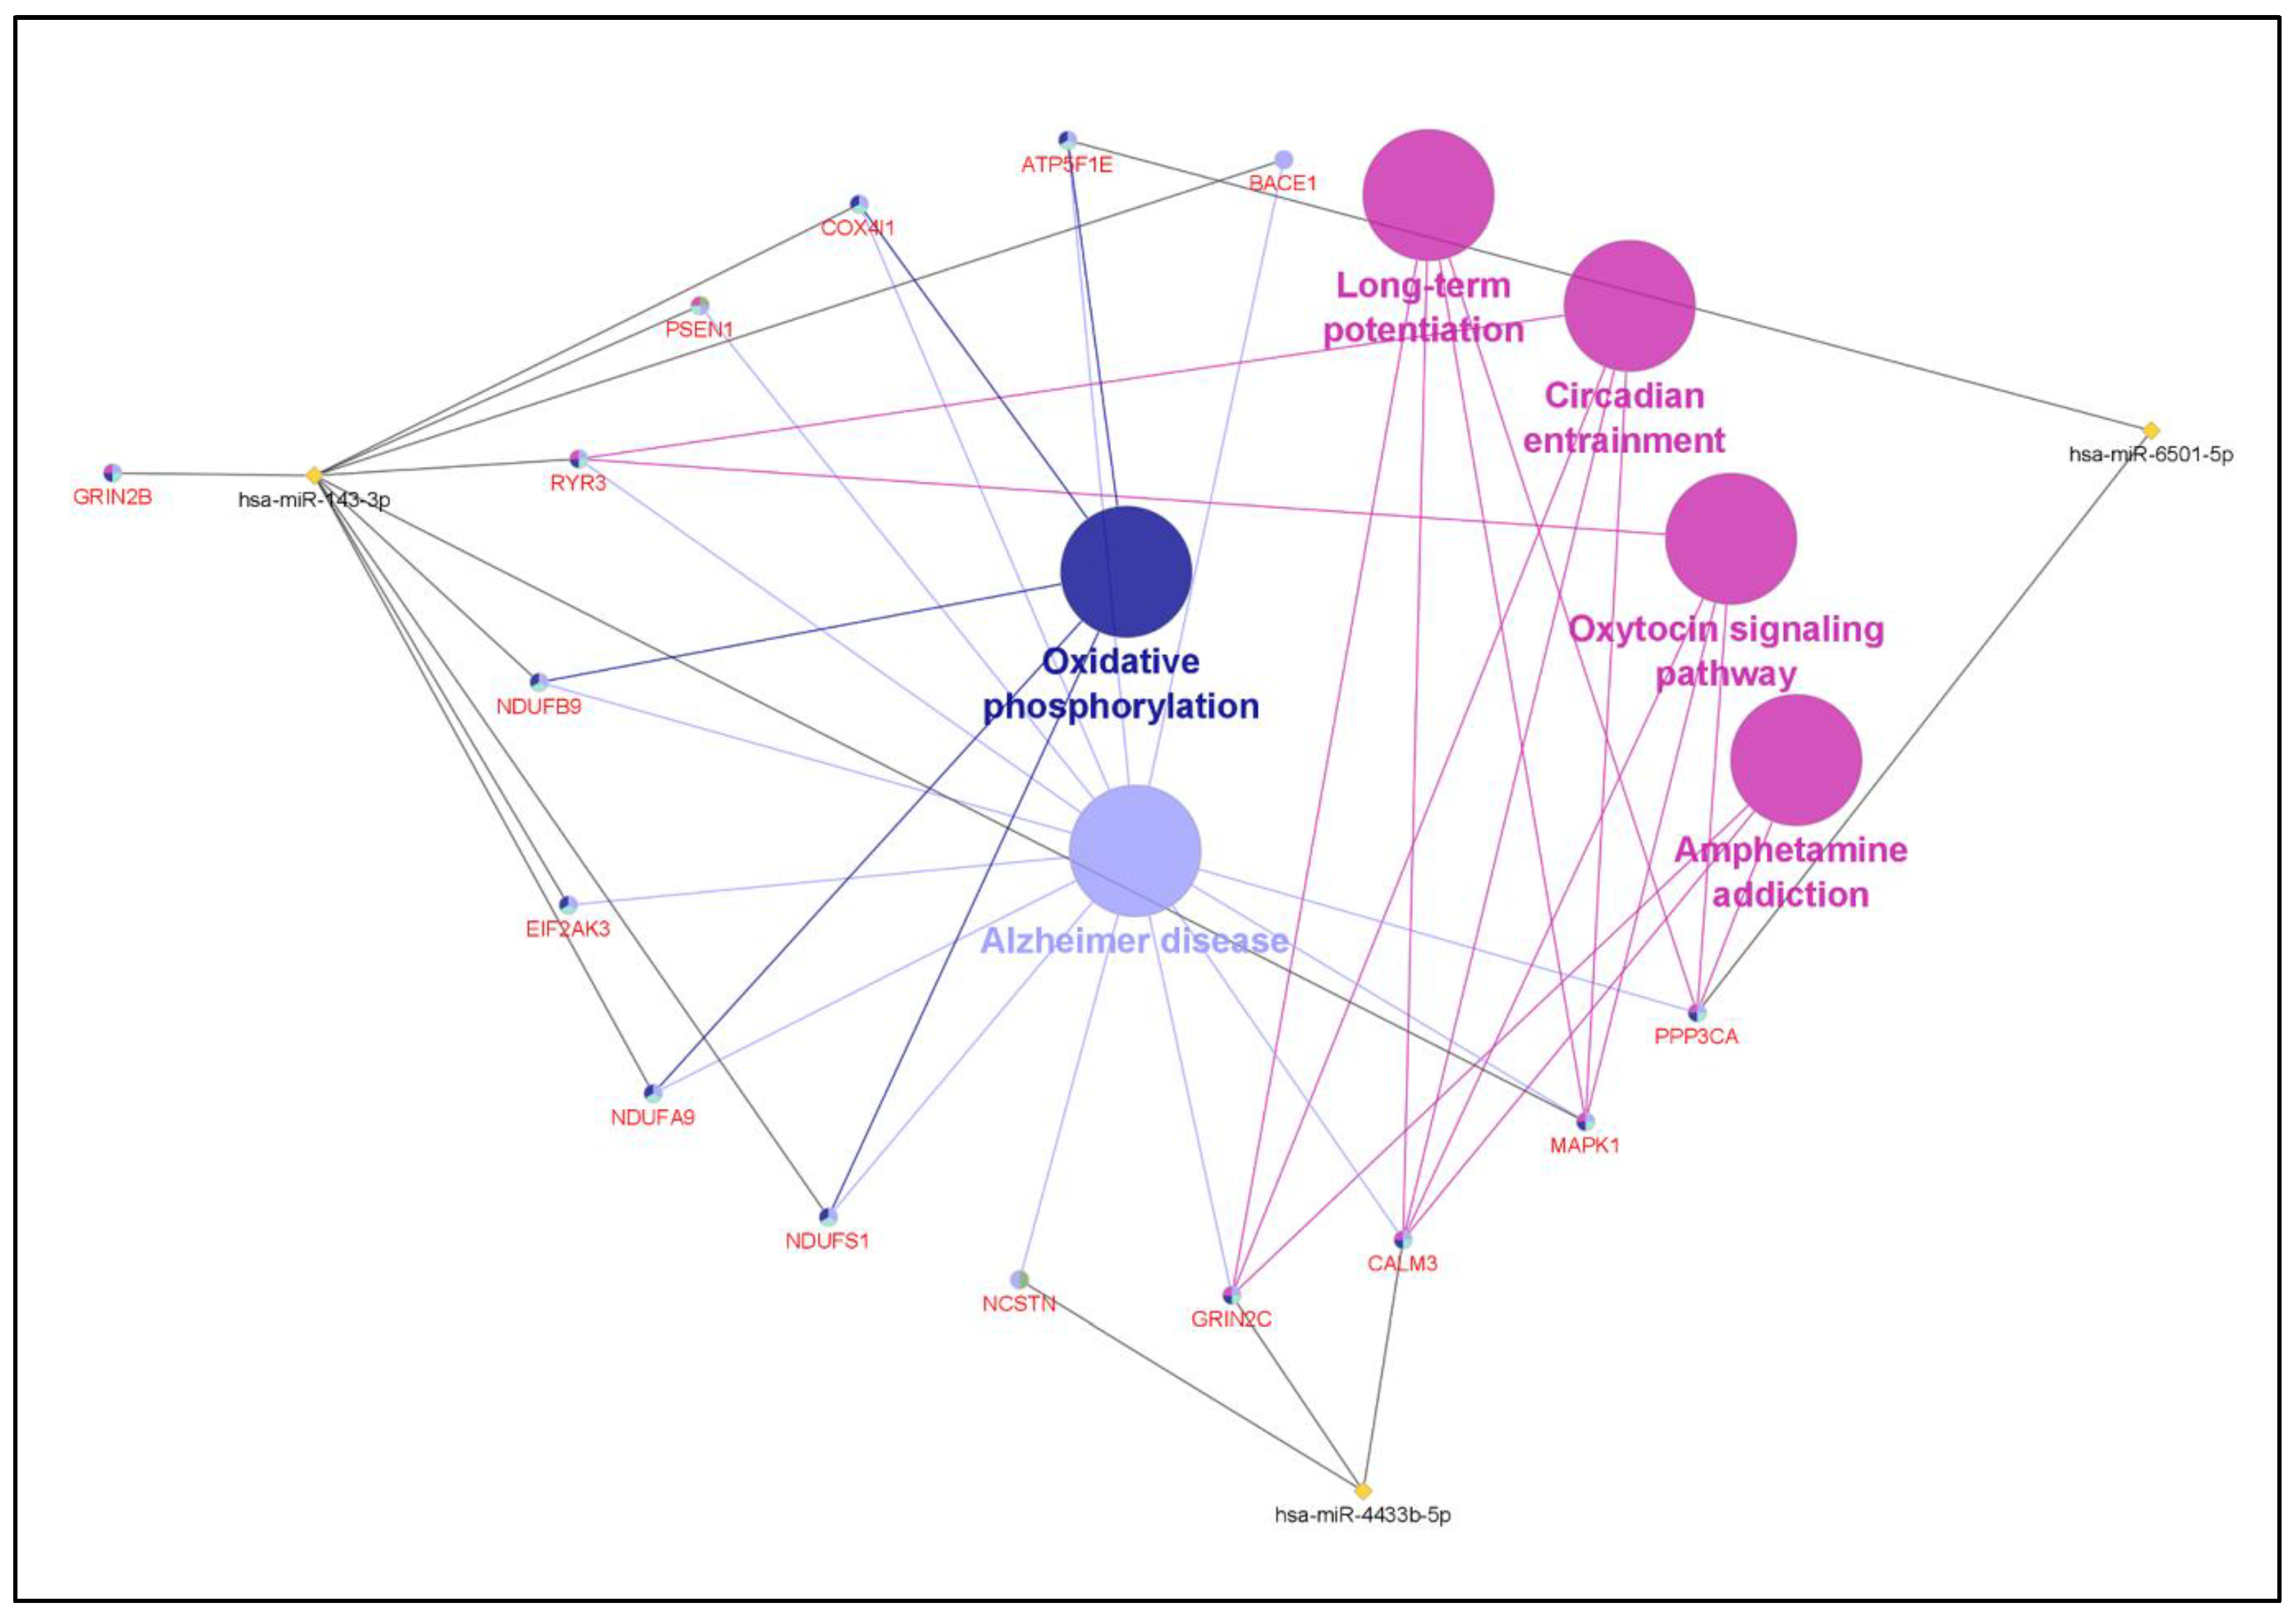
Next, KEGG pathways involved with the identified AD-related target genes were identified (Table 3). Interaction networks of the three identified DEMi signatures with the target genes and their corresponding pathways are illustrated in Figure 5. The results indicate that the significantly enriched pathways of the three DEMi signatures and their respective target genes are involved in six pathways, which are the AD, oxidative phosphorylation, circadian entrainment, amphetamine addiction, long-term potentiation, and oxytocin pathways.
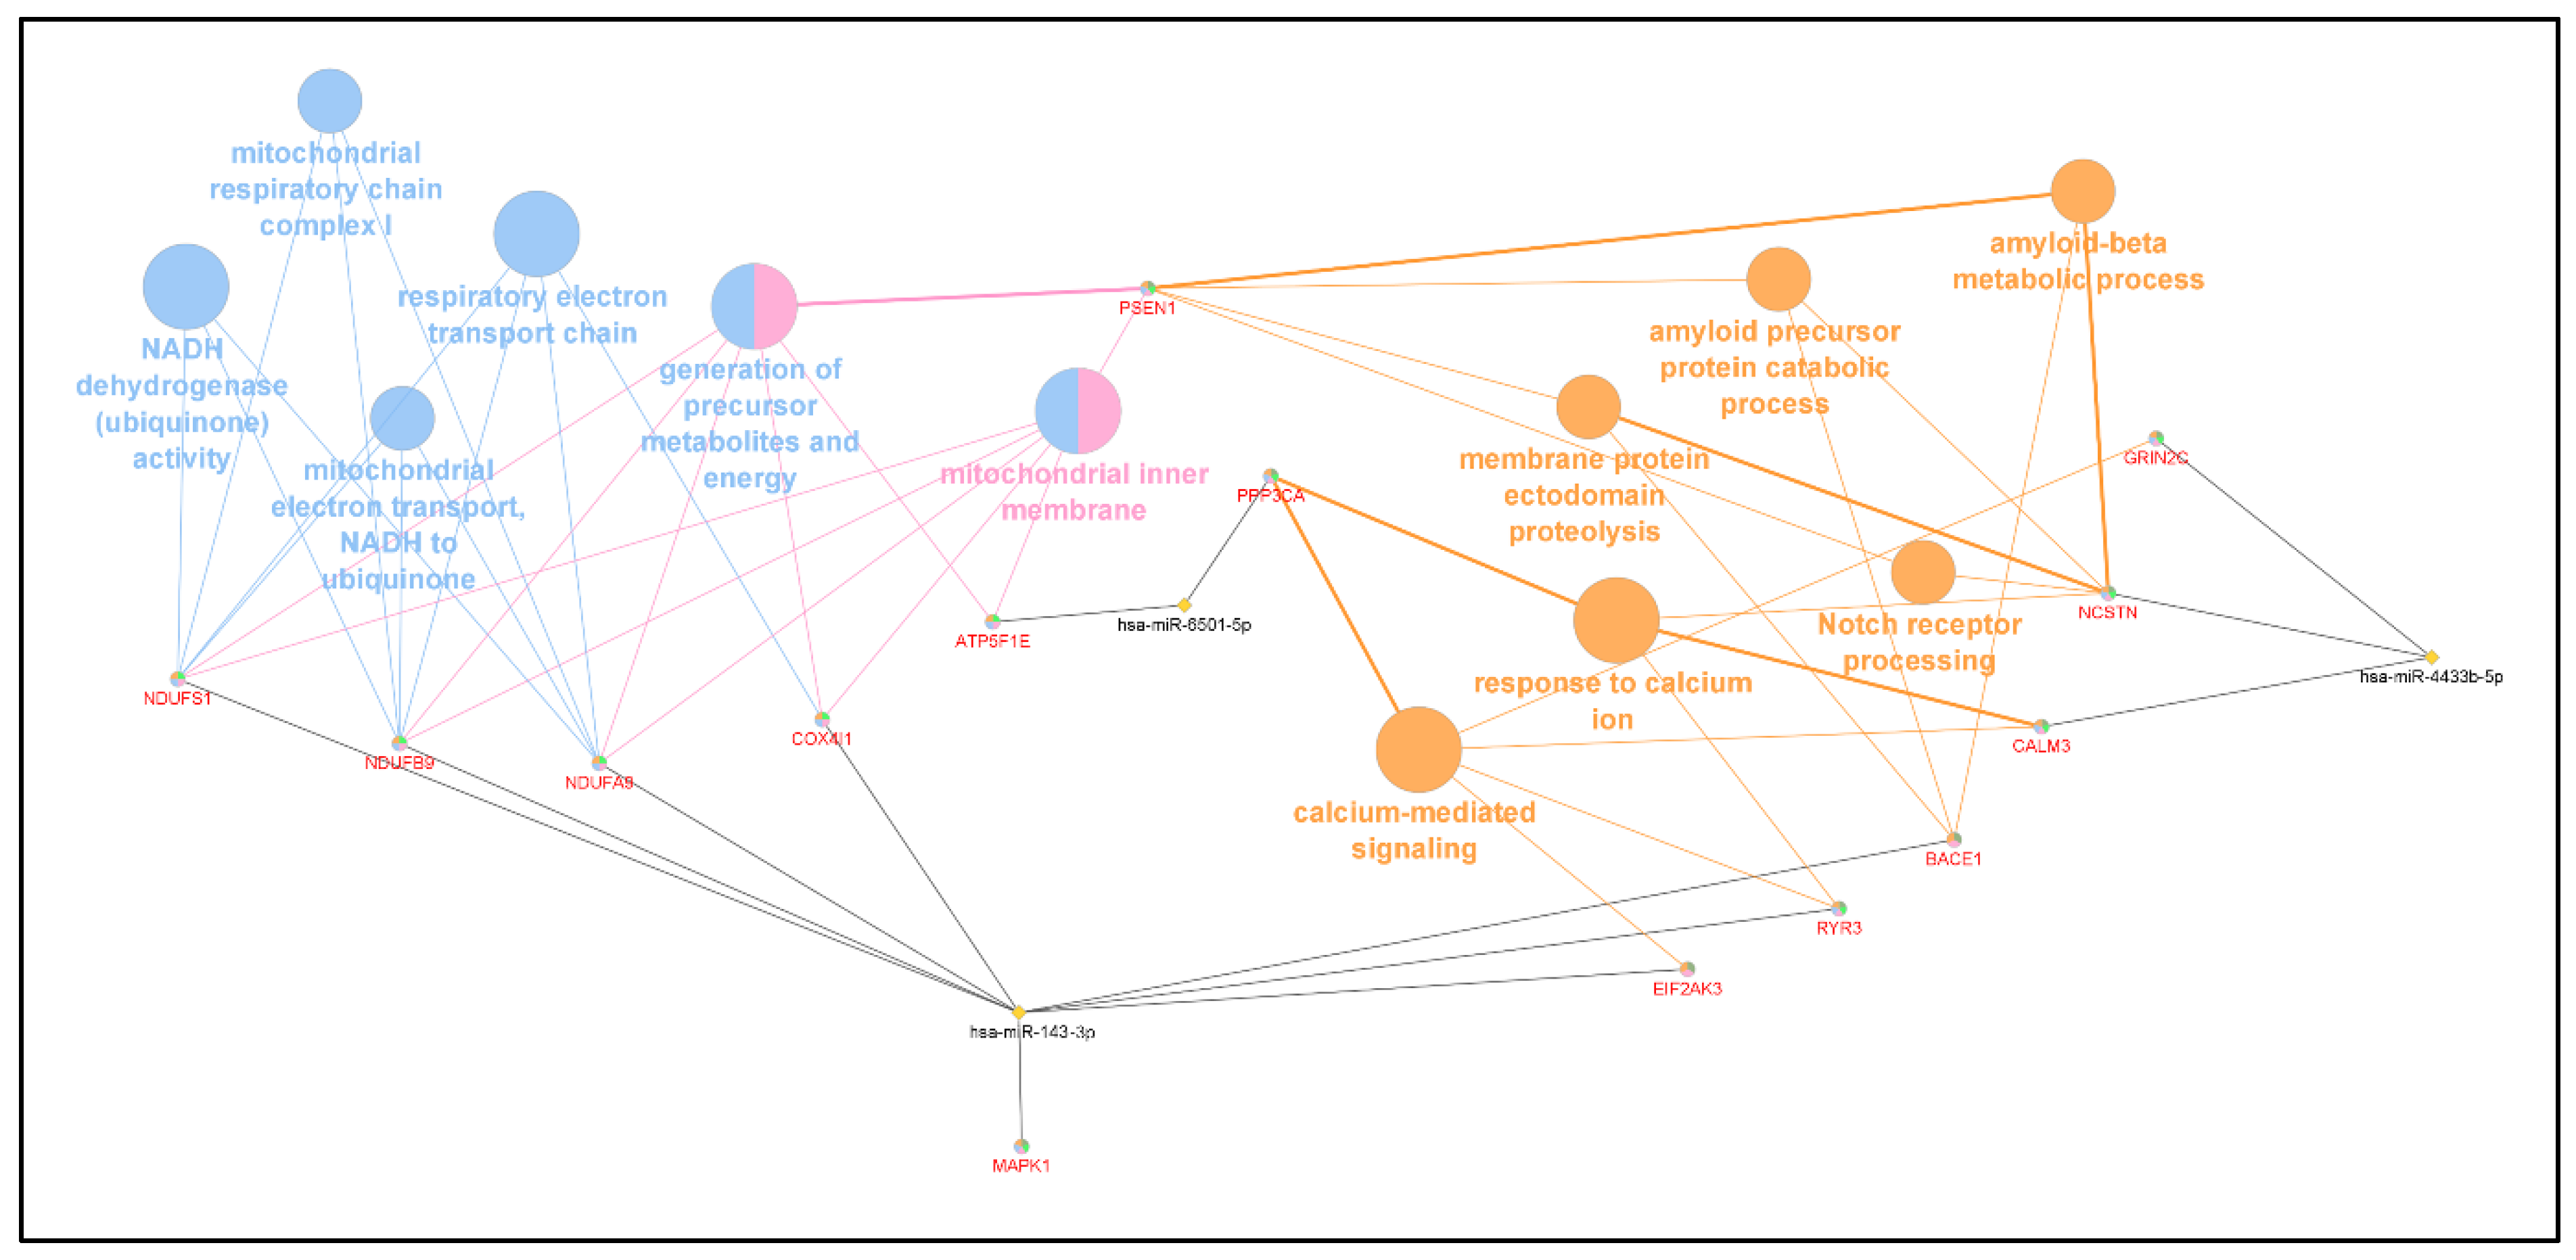
In the GO analysis, 12 significant enriched GO terms were identified (Table 4), with the suggestion that the DEMi signatures and target genes were mainly related to the generation of precursor metabolites and energy, mitochondrion, calcium-mediated signalling, and protein metabolic processes. Notably, hsa-miR-4433b-5p and hsa-miR143-3p showed common enrichment to the terms relating to , which is one of the important pathological indicators for AD. The interaction networks of the three identified DEMi signatures with the target genes and their corresponding pathways are illustrated in Figure 6.
Although gene GRIN2B was selected as one of the target genes for hsa-miR-143-3p in relation to AD, it was identified as being involved in neither the pathways, nor in the GO analysis. Similarly, a family member of GRIN2B, named GRIN2C, was identified in the KEGG pathway analysis but not in the GO analysis.

5. Discussion

The present study aimed to provide new insight into AD by studying miRNAs in Malaysians. Although AD is the most common type of dementia and is known to have a strong association with the accumulation of and phosphorylated tau protein, the mechanisms involved in the pathogenesis of this disease are still uncertain and may be related to environmental, genetic, cultural, and other factors [2,4].
The five common miRNAs identified (hsa-miR-6501-5p, hsa-miR-1296-5p, hsa-miR-1307-3p, hsa-miR-4433b-5p, and hsa-miR-143-3p), when the DEMis, using statistical (edgeR) and machine learning approaches were compared, were downregulated DEMis in edgeR (Table 1). Downregulated miRNAs often cause the upregulation of target genes, and vice versa, and as such, this finding may be related to the roles played by the miRNAs in suppressing mRNA expression [26].
Among these five commonly identified DEMis, only three DEMis (hsa-miR-6501-5p, hsa-miR-4433b-5p, and hsa-miR-143-3p) were predicted to have target genes related to AD (see Table 2). Although the role of hsa-miR-6501-5p in AD is ambiguous, two target genes, ATP5E and PPP3CA, were predicted to be involved in AD-related pathways.
Hsa-miR-4433, of which hsa-miR-4433b-5p is a member, has been identified as regulating glial cells and neuroimmune systems, indicating the participation of this miRNA in neurodegenerative disease [40]. Hsa-miR-4433b-5p has also previously been associated with neurodegenerative diseases such as AD, Parkinson’s disease (PD), and frontotemporal dementia (FTD) [41]. It is negatively correlated with lipids, where the formation of is involved in the cholesterol-metabolism regulation pathway [42]. In relation to AD, GRIN2C, CALM3, and NCSTN are downstream target genes of hsa-miR-4433b-5p.
Hsa-miR-143-3p has been suggested as a possible AD biomarker in review studies [43,44]. In our study, hsa-miR-143-3p was downregulated in the plasma of AD patients, which is consistent with the findings seen in another study using an AD cell-culturing model [45]. The overexpression of hsa-miR-143-3p has been observed to attenuate tau phosphorylation, decrease APP levels, and reduce accumulation [45]. Another AD cell model, however, found that the inhibition of hsa-miR-143-3p fostered neuronal survival and indirectly slowed down AD progression, which was an upregulated expression in the serum of AD patients [43]. That finding was contradictory to that of the present study, which is probably due to the different sample types used. Several genes that are related to AD, those being GRIN2B, EIF2AK3, NDUFB9, NDUFA9, PSEN1, MAPK1, NDUFS1, RYR3, BACE1, and COX4I1, have been identified as the target genes for hsa-miR-143-3p.
The roles and functions of the target genes in AD pathogenesis are summarized in Table 5.
The roles and functions of the DEMi signatures and their respective target genes further corroborate the results of the KEGG pathway and GO analysis (see Table 3 and Table 4). Pathways related to oxidative phosphorylation, mitochondrial dysfunction, and calcium-mediated signalling are particularly highlighted in the present study. The interaction of the genes is demonstrated in Figure 7.
Defects in oxidative phosphorylation, mitochondrial mechanisms, and calcium signalling are interconnected in a cascade sequence and ultimately lead to neurodegeneration in AD. Failure in oxidative phosphorylation causes the deregulation of ATP-synthase activities in mitochondria and contributes to the elevation of oxidative stress and cell death of neuronal mechanisms [74,75]. Damage to mitochondrial function has been postulated as being the fundamental feature of AD pathogenesis. The alteration of mitochondrial mechanisms causes the impairment of energy metabolism in AD, especially in the brain, which consumes a high level of energy, and eventually leads to neuronal cell death [76,77]. Dysregulation of calcium homeostasis is closely connected to in AD. has been reported to trigger intracellular calcium deregulation, which probably elevates reactive oxygen species (ROS), suppresses ATP production in mitochondria, and finally contributes to neurodegeneration in AD [74,78,79]. Hence, the accumulation of intracellular calcium leads to neuronal death, and subsequent learning and memory impairment has been proposed [80].
The major limitation of this study is the sample size, which was unfortunately limited by budgetary constraints. Difficulties in the persuasion of patients or their caregivers to consent to the study were also occasionally encountered. With the limitation of the sample size in this study, it is clear that further investigation is required as there appear to be important revelations that may, in the future, provide much needed insight into AD. Nevertheless, the study has addressed technical concerns regarding the problem of overfitting in the analysis of a limited sample size through cross-validation in MSVM-RFE.

6. Conclusions

This study presents preliminary findings on the differential miRNA expression in AD patients against normal controls in Malaysian subjects, providing some insight into the complex AD pathogenetic pathway. An integrative approach that combined a statistical approach, edgeR, and a two-step machine learning framework was conducted to support the analysis of data in this study. Three miRNAs, hsa-miR-6501-5p, hsa-miR-4433b-5p, and hsa-miR-143-3p, were identified as showing correlations between each other. Their biological roles in AD were indicated by predicting the target mRNAs of each respective miRNA, and pathway analysis suggested their relationships in the disease pathogenesis. Overall, the identified miRNAs, together with the target genes, were identified as being involved in pathways related to oxidative phosphorylation, mitochondrial dysfunction, and calcium-mediated signalling. Although the findings are consistent with the literature, they nonetheless represent the miRNA expression changes within a dataset characterized by a small sample size, and thus require further validation. This study provides further insight related to AD pathogenesis from the miRNA perspective, collected from the Malaysian population, which may potentially help in improving the diagnosis and treatment of this disease in the future.

Supplementary Materials

The following supporting information can be downloaded at: https://www.mdpi.com/article/10.3390/app13053071/s1, Table S1: Inclusion and exclusion criteria of selecting AD patients and normal controls; Table S2: Subject details and their corresponding ID used in this study; Sample preparation; Kits information.

Author Contributions

M.S.T.: Conceptualization; data curation; formal analysis, methodology; writing—original draft; writing—review and editing. P.-L.C.: Conceptualization; data curation; supervision; writing—review and editing. A.-V.C.: Conceptualization; data curation; supervision; writing—review and editing. L.-M.L.: Conceptualization; data curation; supervision; writing—review and editing. S.-W.C.: Conceptualization; data curation; methodology, supervision; writing—review and editing. All authors have read and agreed to the published version of the manuscript.

Funding

This work was supported in part by the Fundamental Research Grant Scheme (FRGS), Ministry of Higher Education Malaysia, project number FRGS/1/2019/SKK06/UM/02/5, and a UM International Collaboration Grant, project number ST041-2022. The funders had no role in study, design, data collection and analysis, decision to publish, or preparation of the manuscript.

Institutional Review Board Statement

The study protocol was approved by the Medical Research Ethics Committee, UMMC, with the approval number 2020114-9193.

Informed Consent Statement

Informed consent was obtained from all subjects involved in the study.

Data Availability Statement

All raw and processed sequencing data generated in this study have been submitted to the NCBI Gene Expression Omnibus (GEO) under accession number GSE224443 https://www.ncbi.nlm.nih.gov/geo/query/acc.cgi?acc=GSE224443 (access on 2 February 2023).

Conflicts of Interest

The authors declare no conflict of interest.

References

  1. Wolk, D.A.; Dickerson, B.C. Clinical Features and Diagnosis of Alzheimer Disease; UpToDate: Waltham, MA, USA, 2016. [Google Scholar]
  2. Abuelezz, N.Z.; Nasr, F.E.; AbdulKader, M.A.; Bassiouny, A.R.; Zaky, A. MicroRNAs as Potential Orchestrators of Alzheimer’s Disease-Related Pathologies: Insights on Current Status and Future Possibilities. Front. Aging Neurosci. 2021, 653, 743573. [Google Scholar] [CrossRef] [PubMed]
  3. Miya Shaik, M.; Tamargo, I.A.; Abubakar, M.B.; Kamal, M.A.; Greig, N.H.; Gan, S.H. The role of microRNAs in Alzheimer’s disease and their therapeutic potentials. Genes 2018, 9, 174. [Google Scholar] [CrossRef] [PubMed] [Green Version]
  4. Liu, Y.; Xu, Y.; Yu, M. MicroRNA-4722-5p and microRNA-615-3p serve as potential biomarkers for Alzheimer’s disease. Exp. Ther. Med. 2022, 23, 1–10. [Google Scholar] [CrossRef] [PubMed]
  5. Guévremont, D.; Tsui, H.; Knight, R.; Fowler, C.J.; Masters, C.L.; Martins, R.N.; Abraham, W.C.; Tate, W.P.; Cutfield, N.J.; Williams, J.M. Plasma microRNA vary in association with the progression of Alzheimer’s disease. Alzheimer’s Dement. Diagn. Assess. Dis. Monit. 2022, 14, e12251. [Google Scholar]
  6. Zhang, W.; Zhang, G.; Gao, S. The potential diagnostic accuracy of circulating microRNAs for Alzheimer’s disease: A meta-analysis. Neurologia, 2021; in press. [Google Scholar] [CrossRef]
  7. Walgrave, H.; Zhou, L.; De Strooper, B.; Salta, E. The promise of microRNA-based therapies in Alzheimer’s disease: Challenges and perspectives. Mol. Neurodegener. 2021, 16, 1–16. [Google Scholar] [CrossRef]
  8. Angelucci, F.; Cechova, K.; Valis, M.; Kuca, K.; Zhang, B.; Hort, J. MicroRNAs in Alzheimer’s disease: Diagnostic markers or therapeutic agents? Front. Pharmacol. 2019, 10, 665. [Google Scholar] [CrossRef]
  9. Wu, H.Z.Y.; Thalamuthu, A.; Cheng, L.; Fowler, C.; Masters, C.L.; Sachdev, P.; Mather, K.A. Differential blood miRNA expression in brain amyloid imaging-defined Alzheimer’s disease and controls. Alzheimer’s Res. Ther. 2020, 12, 1–11. [Google Scholar] [CrossRef]
  10. Kumar, S.; Reddy, P.H. Are circulating microRNAs peripheral biomarkers for Alzheimer’s disease? Biochim. Biophys. Acta (BBA)-Mol. Basis Dis. 2016, 1862, 1617–1627. [Google Scholar] [CrossRef]
  11. Liu, S.; Fan, M.; Zheng, Q.; Hao, S.; Yang, L.; Qi, C.; Ge, J.; Xia, Q. MicroRNAs in Alzheimer’s disease: Potential diagnostic markers and therapeutic targets. Biomed. Pharmacother. 2022, 148, 112681. [Google Scholar] [CrossRef]
  12. Fransquet, P.D.; Ryan, J. Micro RNA as a potential blood-based epigenetic biomarker for Alzheimer’s disease. Clin. Biochem. 2018, 58, 5–14. [Google Scholar] [CrossRef] [PubMed]
  13. Takousis, P.; Sadlon, A.; Schulz, J.; Wohlers, I.; Dobricic, V.; Middleton, L.; Lill, C.M.; Perneczky, R.; Bertram, L. Differential expression of microRNAs in Alzheimer’s disease brain, blood, and cerebrospinal fluid. Alzheimer’s Dement. 2019, 15, 1468–1477. [Google Scholar] [CrossRef] [PubMed]
  14. Mahendran, N.; Vincent, P.D.R.; Srinivasan, K.; Chang, C.-Y. Improving the classification of alzheimer’s disease using hybrid gene selection pipeline and deep learning. Front. Genet. 2021, 12. [Google Scholar] [CrossRef]
  15. Tan, M.S.; Cheah, P.-L.; Chin, A.-V.; Looi, L.-M.; Chang, S.-W. A review on omics-based biomarkers discovery for Alzheimer’s disease from the bioinformatics perspectives: Statistical approach vs machine learning approach. Comput. Biol. Med. 2021, 139, 104947. [Google Scholar] [CrossRef] [PubMed]
  16. Robles, J.A.; Qureshi, S.E.; Stephen, S.J.; Wilson, S.R.; Burden, C.J.; Taylor, J.M. Efficient experimental design and analysis strategies for the detection of differential expression using RNA-Sequencing. BMC Genom. 2012, 13, 484. [Google Scholar] [CrossRef] [PubMed] [Green Version]
  17. Ziats, M.N.; Rennert, O.M. Identification of differentially expressed microRNAs across the developing human brain. Mol. Psychiatry 2014, 19, 848–852. [Google Scholar] [CrossRef] [PubMed] [Green Version]
  18. Takahashi, Y.; Ueki, M.; Tamiya, G.; Ogishima, S.; Kinoshita, K.; Hozawa, A.; Minegishi, N.; Nagami, F.; Fukumoto, K.; Otsuka, K. Machine learning for effectively avoiding overfitting is a crucial strategy for the genetic prediction of polygenic psychiatric phenotypes. Transl. Psychiatry 2020, 10, 294. [Google Scholar] [CrossRef]
  19. Bommert, A.; Welchowski, T.; Schmid, M.; Rahnenführer, J. Benchmark of filter methods for feature selection in high-dimensional gene expression survival data. Brief. Bioinform. 2022, 23, bbab354. [Google Scholar] [CrossRef]
  20. Yuen, S.C.; Liang, X.; Zhu, H.; Jia, Y.; Leung, S.-w. Prediction of differentially expressed microRNAs in blood as potential biomarkers for Alzheimer’s disease by meta-analysis and adaptive boosting ensemble learning. Alzheimer’s Res. Ther. 2021, 13, 126. [Google Scholar] [CrossRef]
  21. Zhao, Y.; Chen, X.; Yin, J. Adaptive boosting-based computational model for predicting potential miRNA-disease associations. Bioinformatics 2019, 35, 4730–4738. [Google Scholar] [CrossRef]
  22. Lugli, G.; Cohen, A.M.; Bennett, D.A.; Shah, R.C.; Fields, C.J.; Hernandez, A.G.; Smalheiser, N.R. Plasma exosomal miRNAs in persons with and without Alzheimer disease: Altered expression and prospects for biomarkers. PLoS ONE 2015, 10, e0139233. [Google Scholar] [CrossRef] [PubMed] [Green Version]
  23. Ludwig, N.; Fehlmann, T.; Kern, F.; Gogol, M.; Maetzler, W.; Deutscher, S.; Gurlit, S.; Schulte, C.; Von Thaler, A.-K.; Deuschle, C. Machine learning to detect Alzheimer’s disease from circulating non-coding RNAs. Genom. Proteom. Bioinform. 2019, 17, 430–440. [Google Scholar] [CrossRef] [PubMed]
  24. Martin, M. Cutadapt removes adapter sequences from high-throughput sequencing reads. EMBnet J. 2011, 17, 10–12. [Google Scholar] [CrossRef]
  25. Langmead, B.; Salzberg, S.L. Fast gapped-read alignment with Bowtie 2. Nat. Methods 2012, 9, 357–359. [Google Scholar] [CrossRef] [Green Version]
  26. Metpally, R.P.R.; Nasser, S.; Malenica, I.; Courtright, A.; Carlson, E.; Ghaffari, L.; Villa, S.; Tembe, W.; Van Keuren-Jensen, K. Comparison of analysis tools for miRNA high throughput sequencing using nerve crush as a model. Front. Genet. 2013, 4, 20. [Google Scholar] [CrossRef] [PubMed] [Green Version]
  27. Robinson, M.D.; McCarthy, D.J.; Smyth, G.K. edgeR: A Bioconductor package for differential expression analysis of digital gene expression data. Bioinformatics 2010, 26, 139–140. [Google Scholar] [CrossRef] [Green Version]
  28. Lang, M.; Binder, M.; Richter, J.; Schratz, P.; Pfisterer, F.; Coors, S.; Au, Q.; Casalicchio, G.; Kotthoff, L.; Bischl, B. mlr3: A modern object-oriented machine learning framework in R. J. Open Source Softw. 2019, 4, 1903. [Google Scholar] [CrossRef] [Green Version]
  29. Zhou, X.; Tuck, D.P. MSVM-RFE: Extensions of SVM-RFE for multiclass gene selection on DNA microarray data. Bioinformatics 2007, 23, 1106–1114. [Google Scholar] [CrossRef] [Green Version]
  30. Kohonen, T. Self-Organizing Maps; Springer Science & Business Media: Heidelberg, Germany, 2012; Volume 30. [Google Scholar]
  31. Anke, Z.; Xinjian, Q.; Guojian, C. Clustering analysis of gene data based on PCA and SOM neural networks. In Proceedings of the 2014 Fifth International Conference on Intelligent Systems Design and Engineering Applications, Hunan, China, 15–16 June 2014; pp. 284–287. [Google Scholar]
  32. Wehrens, R.; Buydens, L.M. Self-and super-organizing maps in R: The Kohonen package. J. Stat. Softw. 2007, 21, 1–19. [Google Scholar] [CrossRef] [Green Version]
  33. Bro, R.; Smilde, A.K. Principal component analysis. Anal. Methods 2014, 6, 2812–2831. [Google Scholar] [CrossRef] [Green Version]
  34. Jolliffe, I.T.; Cadima, J. Principal component analysis: A review and recent developments. Philos. Trans. R. Soc. A Math. Phys. Eng. Sci. 2016, 374, 20150202. [Google Scholar] [CrossRef] [PubMed] [Green Version]
  35. Paraskevopoulou, M.D.; Georgakilas, G.; Kostoulas, N.; Vlachos, I.S.; Vergoulis, T.; Reczko, M.; Filippidis, C.; Dalamagas, T.; Hatzigeorgiou, A.G. DIANA-microT web server v5. 0: Service integration into miRNA functional analysis workflows. Nucleic Acids Res. 2013, 41, W169–W173. [Google Scholar] [CrossRef] [PubMed] [Green Version]
  36. Vlachos, I.S.; Zagganas, K.; Paraskevopoulou, M.D.; Georgakilas, G.; Karagkouni, D.; Vergoulis, T.; Dalamagas, T.; Hatzigeorgiou, A.G. DIANA-miRPath v3. 0: Deciphering microRNA function with experimental support. Nucleic Acids Res. 2015, 43, W460–W466. [Google Scholar] [CrossRef] [PubMed]
  37. Kanehisa, M.; Goto, S. KEGG: Kyoto encyclopedia of genes and genomes. Nucleic Acids Res. 2000, 28, 27–30. [Google Scholar] [CrossRef] [PubMed]
  38. Young, M.D.; Wakefield, M.J.; Smyth, G.K.; Oshlack, A. Gene ontology analysis for RNA-seq: Accounting for selection bias. Genome Biol. 2010, 11, R14. [Google Scholar] [CrossRef] [Green Version]
  39. Shannon, P.; Markiel, A.; Ozier, O.; Baliga, N.S.; Wang, J.T.; Ramage, D.; Amin, N.; Schwikowski, B.; Ideker, T. Cytoscape: A software environment for integrated models of biomolecular interaction networks. Genome Res. 2003, 13, 2498–2504. [Google Scholar] [CrossRef]
  40. Ge, X.; Yao, T.; Zhang, C.; Wang, Q.; Wang, X.; Xu, L.-C. Human microRNA-4433 (hsa-miR-4443) Targets 18 Genes to be a Risk Factor of Neurodegenerative Diseases. Curr. Alzheimer Res. 2022, 19, 511–522. [Google Scholar]
  41. Sproviero, D.; Gagliardi, S.; Zucca, S.; Arigoni, M.; Giannini, M.; Garofalo, M.; Olivero, M.; Dell’Orco, M.; Pansarasa, O.; Bernuzzi, S. Different miRNA profiles in plasma derived small and large extracellular vesicles from patients with neurodegenerative diseases. Int. J. Mol. Sci. 2021, 22, 2737. [Google Scholar] [CrossRef]
  42. Peña-Bautista, C.; Álvarez-Sánchez, L.; Cañada-Martínez, A.J.; Baquero, M.; Cháfer-Pericás, C. Epigenomics and Lipidomics Integration in Alzheimer Disease: Pathways Involved in Early Stages. Biomedicines 2021, 9, 1812. [Google Scholar] [CrossRef]
  43. Cheng, á.; Doecke, J.D.; Sharples, R.; Villemagne, V.L.; Fowler, C.J.; Rembach, A.; Martins, R.N.; Rowe, C.C.; Macaulay, S.L.; Masters, C.L. Prognostic serum miRNA biomarkers associated with Alzheimer’s disease shows concordance with neuropsychological and neuroimaging assessment. Mol. Psychiatry 2015, 20, 1188–1196. [Google Scholar] [CrossRef] [Green Version]
  44. Hara, N.; Kikuchi, M.; Miyashita, A.; Hatsuta, H.; Saito, Y.; Kasuga, K.; Murayama, S.; Ikeuchi, T.; Kuwano, R. Serum microRNA miR-501-3p as a potential biomarker related to the progression of Alzheimer’s disease. Acta Neuropathol. Commun. 2017, 5, 10. [Google Scholar] [CrossRef] [Green Version]
  45. Wang, L.; Shui, X.; Mei, Y.; Xia, Y.; Lan, G.; Hu, L.; Zhang, M.; Gan, C.-L.; Li, R.; Tian, Y. miR-143-3p Inhibits Aberrant Tau Phosphorylation and Amyloidogenic Processing of APP by Directly Targeting DAPK1 in Alzheimer’s Disease. Int. J. Mol. Sci. 2022, 23, 7992. [Google Scholar] [CrossRef] [PubMed]
  46. Mayr, J.A.; Havlíčková, V.; Zimmermann, F.; Magler, I.; Kaplanova, V.; Ješina, P.; Pecinová, A.; Nůsková, H.; Koch, J.; Sperl, W. Mitochondrial ATP synthase deficiency due to a mutation in the ATP5E gene for the F1 ε subunit. Hum. Mol. Genet. 2010, 19, 3430–3439. [Google Scholar] [CrossRef] [PubMed] [Green Version]
  47. Lunnon, K.; Keohane, A.; Pidsley, R.; Newhouse, S.; Riddoch-Contreras, J.; Thubron, E.B.; Devall, M.; Soininen, H.; Kłoszewska, I.; Mecocci, P. Mitochondrial genes are altered in blood early in Alzheimer’s disease. Neurobiol. Aging 2017, 53, 36–47. [Google Scholar] [CrossRef] [PubMed] [Green Version]
  48. Chowdhury, U.N.; Islam, M.B.; Ahmad, S.; Moni, M.A. Network-based identification of genetic factors in ageing, lifestyle and type 2 diabetes that influence to the progression of Alzheimer’s disease. Inform. Med. Unlocked 2020, 19, 100309. [Google Scholar] [CrossRef]
  49. Chiocco, M.J.; Zhu, X.; Walther, D.; Pletnikova, O.; Troncoso, J.C.; Uhl, G.R.; Liu, Q.-R. Fine mapping of calcineurin (PPP3CA) gene reveals novel alternative splicing patterns, association of 5′ UTR trinucleotide repeat with addiction vulnerability, and differential isoform expression in Alzheimer’s disease. Subst. Use Misuse 2010, 45, 1809–1826. [Google Scholar] [CrossRef] [Green Version]
  50. Sadick, J.S.; Liddelow, S.A. Don’t forget astrocytes when targeting Alzheimer’s disease. Br. J. Pharmacol. 2019, 176, 3585–3598. [Google Scholar] [CrossRef]
  51. Griswold, A.J.; Celis, K.; Bussies, P.L.; Rajabli, F.; Whitehead, P.L.; Hamilton-Nelson, K.L.; Beecham, G.W.; Dykxhoorn, D.M.; Nuytemans, K.; Wang, L. Increased APOE ε4 expression is associated with the difference in Alzheimer’s disease risk from diverse ancestral backgrounds. Alzheimer’s Dement. 2021, 17, 1179–1188. [Google Scholar] [CrossRef]
  52. Morabito, S.; Miyoshi, E.; Michael, N.; Swarup, V. Integrative genomics approach identifies conserved transcriptomic networks in Alzheimer’s disease. Hum. Mol. Genet. 2020, 29, 2899–2919. [Google Scholar] [CrossRef]
  53. Sesele, K.; Thanopoulou, K.; Paouri, E.; Tsefou, E.; Klinakis, A.; Georgopoulos, S. Conditional inactivation of nicastrin restricts amyloid deposition in an Alzheimer’s disease mouse model. Aging Cell 2013, 12, 1032–1040. [Google Scholar] [CrossRef]
  54. Herrera-Rivero, M.; Hernández-Aguilar, M.E.; Aranda-Abreu, G.E. A strategy focused on MAPT, APP, NCSTN and BACE1 to build blood classifiers for Alzheimer׳ s disease. J. Theor. Biol. 2015, 376, 32–38. [Google Scholar] [CrossRef] [PubMed]
  55. Andreoli, V.; De Marco, E.V.; Trecroci, F.; Cittadella, R.; Di Palma, G.; Gambardella, A. Potential involvement of GRIN2B encoding the NMDA receptor subunit NR2B in the spectrum of Alzheimer’s disease. J. Neural Transm. 2014, 121, 533–542. [Google Scholar] [CrossRef]
  56. Wong, T.H.; van der Lee, S.J.; van Rooij, J.G.; Meeter, L.H.; Frick, P.; Melhem, S.; Seelaar, H.; Ikram, M.A.; Rozemuller, A.J.; Holstege, H. EIF2AK3 variants in Dutch patients with Alzheimer’s disease. Neurobiol. Aging 2019, 73, 229.e11–229.e18. [Google Scholar] [CrossRef] [PubMed]
  57. Liu, Q.-Y.; Yu, J.-T.; Miao, D.; Ma, X.-Y.; Wang, H.-F.; Wang, W.; Tan, L. An exploratory study on STX6, MOBP, MAPT, and EIF2AK3 and late-onset Alzheimer’s disease. Neurobiol. Aging 2013, 34, 1519.e13–1519.e17. [Google Scholar] [CrossRef] [PubMed]
  58. Cheng, J.; Liu, H.-P.; Lin, W.-Y.; Tsai, F.-J. Machine learning compensates fold-change method and highlights oxidative phosphorylation in the brain transcriptome of Alzheimer’s disease. Sci. Rep. 2021, 11, 13704. [Google Scholar] [CrossRef]
  59. Pinto, M.; Pickrell, A.M.; Fukui, H.; Moraes, C.T. Mitochondrial DNA damage in a mouse model of Alzheimer’s disease decreases amyloid beta plaque formation. Neurobiol. Aging 2013, 34, 2399–2407. [Google Scholar] [CrossRef] [PubMed] [Green Version]
  60. Randa, N.; Bora, E.; Ataman, E.; Öz, O.; Yener, G. Identification of PSEN1 and PSEN2 Gene Variants and Clinical Findings with the Literature. Int. J. Neurodegener. Dis. 2019, 2, 7. [Google Scholar]
  61. Raut, S.; Patel, R.; Al-Ahmad, A.J. Presence of a mutation in PSEN1 or PSEN2 gene is associated with an impaired brain endothelial cell phenotype in vitro. Fluids Barriers CNS 2021, 18, 3. [Google Scholar] [CrossRef]
  62. Du, Y.; Du, Y.; Zhang, Y.; Huang, Z.; Fu, M.; Li, J.; Pang, Y.; Lei, P.; Wang, Y.T.; Song, W. MKP-1 reduces Aβ generation and alleviates cognitive impairments in Alzheimer’s disease models. Signal Transduct. Target. Ther. 2019, 4, 58. [Google Scholar] [CrossRef] [Green Version]
  63. Gee, M.S.; Son, S.H.; Jeon, S.H.; Do, J.; Kim, N.; Ju, Y.-J.; Lee, S.J.; Chung, E.K.; Inn, K.-S.; Kim, N.-J. A selective p38α/β MAPK inhibitor alleviates neuropathology and cognitive impairment, and modulates microglia function in 5XFAD mouse. Alzheimer’s Res. Ther. 2020, 12, 1–18. [Google Scholar] [CrossRef] [Green Version]
  64. Chen, C.; Liu, P.; Wang, J.; Yu, H.; Zhang, Z.; Liu, J.; Chen, X.; Zhu, F.; Yang, X. Dauricine attenuates spatial memory impairment and alzheimer-like pathologies by enhancing mitochondrial function in a mouse model of Alzheimer’s disease. Front. Cell Dev. Biol. 2021, 8, 624339. [Google Scholar] [CrossRef] [PubMed]
  65. Adav, S.S.; Park, J.E.; Sze, S.K. Quantitative profiling brain proteomes revealed mitochondrial dysfunction in Alzheimer’s disease. Mol. Brain 2019, 12, 8. [Google Scholar] [CrossRef] [Green Version]
  66. Gong, S.; Su, B.B.; Tovar, H.; Mao, C.; Gonzalez, V.; Liu, Y.; Lu, Y.; Wang, K.-S.; Xu, C. Polymorphisms within RYR3 gene are associated with risk and age at onset of hypertension, diabetes, and Alzheimer’s disease. Am. J. Hypertens. 2018, 31, 818–826. [Google Scholar] [CrossRef] [PubMed] [Green Version]
  67. Del Prete, D.; Checler, F.; Chami, M. Ryanodine receptors: Physiological function and deregulation in Alzheimer disease. Mol. Neurodegener. 2014, 9, 21. [Google Scholar] [CrossRef] [PubMed] [Green Version]
  68. Supnet, C.; Noonan, C.; Richard, K.; Bradley, J.; Mayne, M. Up-regulation of the type 3 ryanodine receptor is neuroprotective in the TgCRND8 mouse model of Alzheimer’s disease. J. Neurochem. 2010, 112, 356–365. [Google Scholar] [CrossRef]
  69. Das, B.; Yan, R. Role of BACE1 in Alzheimer’s synaptic function. Transl. Neurodegener. 2017, 6, 1–8. [Google Scholar] [CrossRef]
  70. Cervellati, C.; Valacchi, G.; Zuliani, G. BACE1 role in Alzheimer’s disease and other dementias: From the theory to the practice. Neural Regen. Res. 2021, 16, 2407. [Google Scholar] [CrossRef]
  71. McDade, E.; Voytyuk, I.; Aisen, P.; Bateman, R.J.; Carrillo, M.C.; De Strooper, B.; Haass, C.; Reiman, E.M.; Sperling, R.; Tariot, P.N. The case for low-level BACE1 inhibition for the prevention of Alzheimer disease. Nat. Rev. Neurol. 2021, 17, 703–714. [Google Scholar] [CrossRef]
  72. Bi, R.; Zhang, W.; Zhang, D.-F.; Xu, M.; Fan, Y.; Hu, Q.-X.; Jiang, H.-Y.; Tan, L.; Li, T.; Fang, Y. Genetic association of the cytochrome c oxidase-related genes with Alzheimer’s disease in Han Chinese. Neuropsychopharmacology 2018, 43, 2264–2276. [Google Scholar] [CrossRef] [Green Version]
  73. Wilkins, H.M.; Koppel, S.J.; Bothwell, R.; Mahnken, J.; Burns, J.M.; Swerdlow, R.H. Platelet cytochrome oxidase and citrate synthase activities in APOE ε4 carrier and non-carrier Alzheimer’s disease patients. Redox Biol. 2017, 12, 828–832. [Google Scholar] [CrossRef]
  74. Alldred, M.J.; Lee, S.H.; Stutzmann, G.E.; Ginsberg, S.D. Oxidative phosphorylation is dysregulated within the basocortical circuit in a 6-month old mouse model of down syndrome and alzheimer’s disease. Front. Aging Neurosci. 2021, 13, 484. [Google Scholar] [CrossRef]
  75. Misrani, A.; Tabassum, S.; Yang, L. Mitochondrial dysfunction and oxidative stress in Alzheimer’s disease. Front. Aging Neurosci. 2021, 13, 617588. [Google Scholar] [CrossRef] [PubMed]
  76. Bell, S.M.; Barnes, K.; De Marco, M.; Shaw, P.J.; Ferraiuolo, L.; Blackburn, D.J.; Venneri, A.; Mortiboys, H. Mitochondrial dysfunction in Alzheimer’s disease: A biomarker of the future? Biomedicines 2021, 9, 63. [Google Scholar] [CrossRef] [PubMed]
  77. Wang, W.; Zhao, F.; Ma, X.; Perry, G.; Zhu, X. Mitochondria dysfunction in the pathogenesis of Alzheimer’s disease: Recent advances. Mol. Neurodegener. 2020, 15, 1–22. [Google Scholar] [CrossRef] [PubMed]
  78. Liu, L.; Gao, H.; Zaikin, A.; Chen, S. Unraveling Aβ-mediated multi-pathway calcium dynamics in astrocytes: Implications for Alzheimer’s disease treatment from simulations. Front. Physiol. 2021, 12, 1918. [Google Scholar] [CrossRef]
  79. Popugaeva, E.; Pchitskaya, E.; Bezprozvanny, I. Dysregulation of intracellular calcium signaling in Alzheimer’s disease. Antioxid. Redox Signal. 2018, 29, 1176–1188. [Google Scholar] [CrossRef]
  80. Workgroup, A.s.A.C.H.; Khachaturian, Z.S. Calcium hypothesis of Alzheimer’s disease and brain aging: A framework for integrating new evidence into a comprehensive theory of pathogenesis. Alzheimer’s Dement. 2017, 13, 178–182.e17. [Google Scholar]
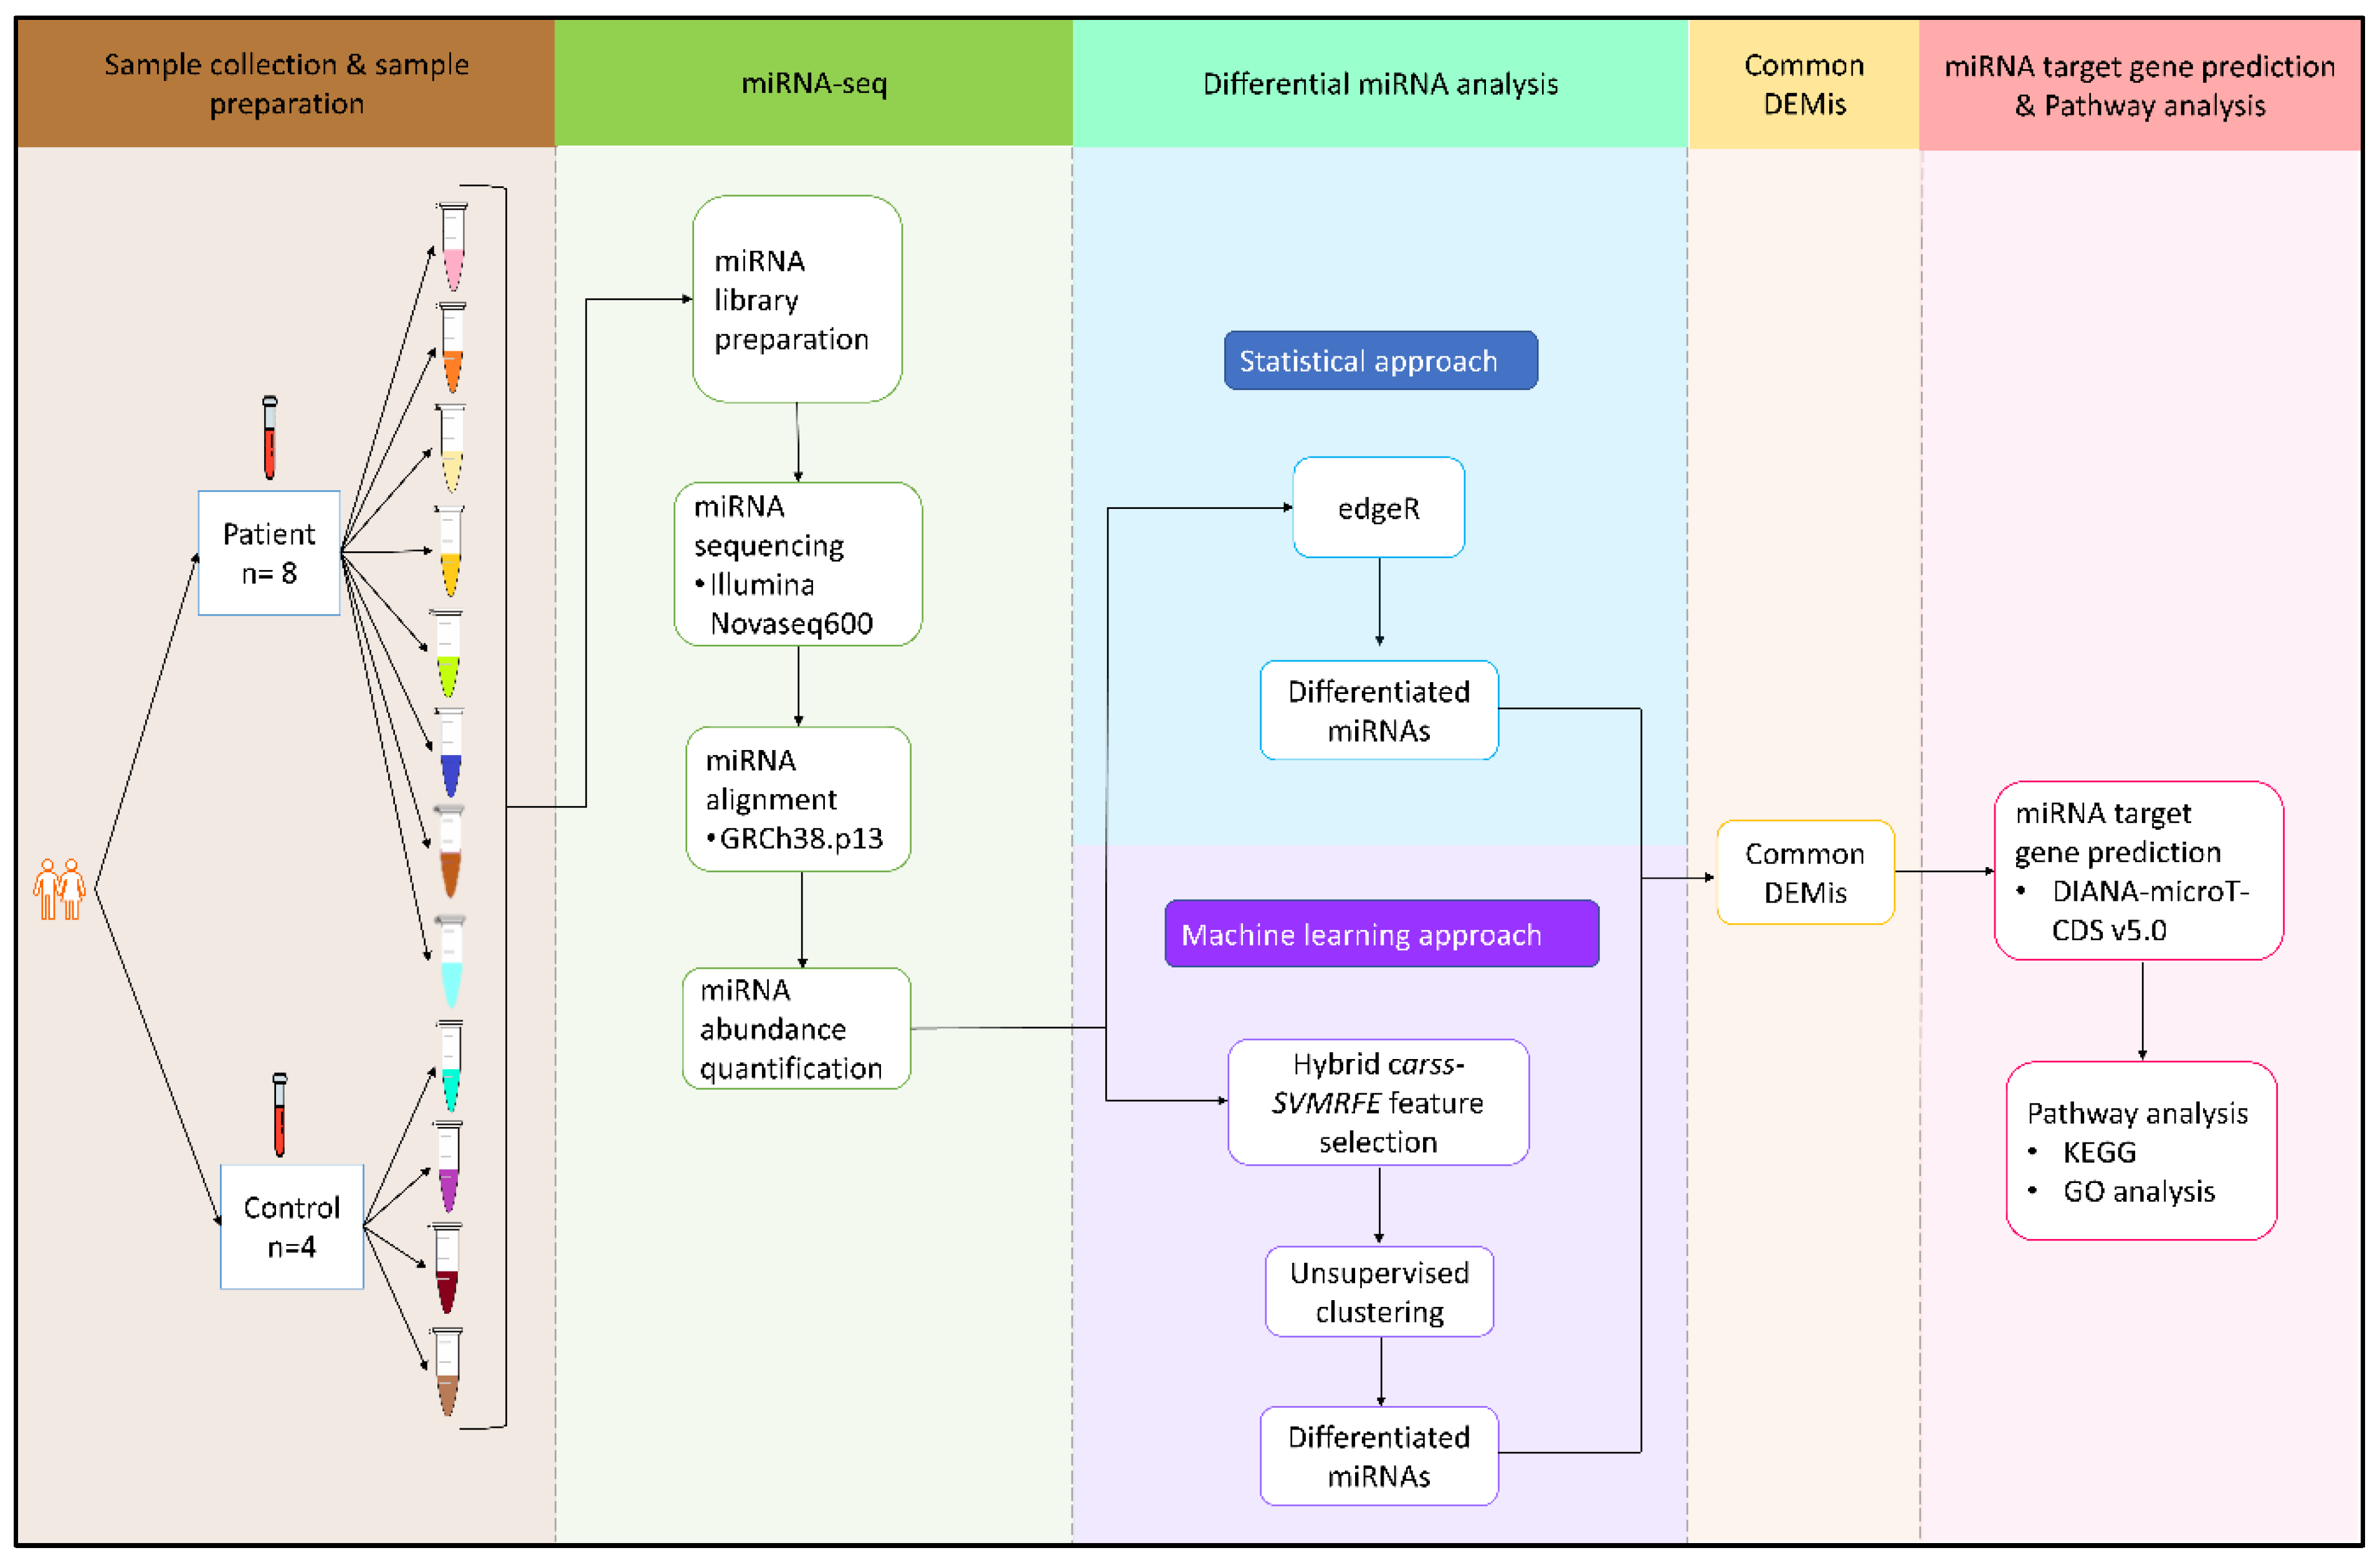
Figure 1. The framework for the differential expression analysis of miRNA in the blood of AD patients and that of normal controls. miRNA sequencing was conducted on the samples after appropriate preparation. The raw count data were analysed using bioinformatics. Differential miRNA expression analysis was carried out using two independent approaches, i.e., statistical and machine learning. Differentially expressed miRNAs (DEMis) were subjected to miRNA target gene prediction, followed by the evaluation of enriched pathways.
Applsci 13 03071 g001
Figure 2. Clustering of SOM neurons using HC.
Applsci 13 03071 g002
Figure 3. PCA plot of (A) clusters of top 50 ranked miRNAs based on SOM; (B) sample distribution corresponding to PCA: x-axis = PC1, y-axis = PC2.
Applsci 13 03071 g003
Figure 4. Venn diagram of the DEMi candidates identified using edgeR and the machine learning approach.
Applsci 13 03071 g004
Figure 5. DEMi signatures and target genes enriched in KEGG pathways. Enriched pathways are indicated by the nodes, and the interactions between the pathways and genes are represented by lines. The different colours of the nodes depict the different functional groups of the pathways.
Applsci 13 03071 g005
Figure 6. DEMi signatures and target genes enriched with GO terms. Enriched GO terms are indicated by the nodes, and the interactions between the terms and genes are represented using lines. The different colours of the nodes depict the different functional groups of the GO terms.
Applsci 13 03071 g006
Figure 7. KEGG Alzheimer’s disease pathway (hsa05010): The selected target genes are highlighted by yellow boxes. The genes involved in oxidative phosphorylation, mitochondrial dysfunction, and the calcium signalling pathways are indicated by purple boxes. The gene GRIN2B was not identified as being involved in this pathway and is therefore excluded from the figure.
Applsci 13 03071 g007
Table 1. DEMi candidates selected using edgeR.
DEMiLog2FCp-ValueRegulation
hsa-miR-9410.7528910.020286Up
hsa-miR-1273c0.728720.016058Up
hsa-miR-150-5p0.6856250.049536Up
hsa-miR-10a-5p0.5979250.023684Up
hsa-miR-9-5p0.5639540.011416Up
hsa-miR-1307-3p−0.598030.024833Down
hsa-miR-877-5p−0.616710.048433Down
hsa-miR-4433b-5p−0.670390.036891Down
hsa-miR-143-3p−0.694040.048802Down
hsa-miR-1296-5p−0.858250.018019Down
hsa-miR-5100−1.217250.046714Down
hsa-miR-6501-5p−1.341590.003957Down
Table 2. DEMis and the predicted target genes related to AD.
DEMiGene IDGene NamemiTG Score
hsa-miR-6501-5pENSG00000124172ATP5E0.824031785
ENSG00000138814PPP3CA0.793189081
hsa-miR-4433b-5pENSG00000161509GRIN2C0.754847813
ENSG00000160014CALM30.746931533
ENSG00000162736NCSTN0.720055687
hsa-miR-143-3pENSG00000273079GRIN2B0.932644441
ENSG00000172071EIF2AK30.898086248
ENSG00000147684NDUFB90.852775513
ENSG00000139180NDUFA90.84781014
ENSG00000080815PSEN10.825585469
ENSG00000100030MAPK10.756048436
ENSG00000023228NDUFS10.751173742
ENSG00000198838RYR30.744614559
ENSG00000186318BACE10.739327029
ENSG00000131143COX4I0.736374347
Table 3. KEGG pathways associated with the DEMi signatures and the respective target genes.
KEGG Pathwayp-ValueDEMi InvolvedGene Involved
Alzheimer’s disease1.58 × 10−10hsa-miR-6501-5pATP5E
PPP3CA
hsa-miR-4433b-5pGRIN2C
CALM3
NCSTN
hsa-miR-143-3pEIF2AK3
NDUFB9
NDUFA9
PSEN1
MAPK1
NDUFS1
RYR3
BACE1
COX4I1
Oxidative phosphorylation9.67 × 10−6hsa-miR-6501-5pATP5E
NDUFB9
hsa-miR-143-3pNDUFA9
NDUFS1
COX4I1
Circadian entrainment0.023972099hsa-miR-4433b-5pGRIN2C
CALM3
hsa-miR-143-3pMAPK1
RYR3
Amphetamine addiction0.023972099hsa-miR-6501-5pPPP3CA
hsa-miR-4433b-5pGRIN2C
CALM3
Long-term potentiation0.023972099hsa-miR-6501-5pPPP3CA
hsa-miR-4433b-5pGRIN2C
CALM3
hsa-miR-143-3pMAPK1
Oxytocin signalling pathway0.023972099hsa-miR-6501-5pPPP3CA
hsa-miR-4433b-5pCALM3
hsa-miR-143-3pMAPK1
RYR3
Table 4. GO terms associated with the miRNAs and the respective target genes.
GO Categoryp-ValueDEMi InvolvedGenes Involved
respiratory electron transport chain1.19 × 10−5hsa-miR-6501-5pATP5E
NDUFB9
NDUFA9
NDUFS1
hsa-miR-143-3pCOX4I1
generation of precursor metabolites and energy3.03 × 10−5hsa-miR-6501-5pATP5E
hsa-miR-4433b-5pCALM3
hsa-miR-143-3pNDUFB9
NDUFA9
NDUFS1
COX4I1
beta-amyloid metabolic process0.001017955hsa-miR-4433b-5pNCSTN
hsa-miR-143-3pPSEN1
BACE1
calcium-mediated signalling0.001521237hsa-miR-6501-5pPPP3CA
hsa-miR-4433b-5pCALM3
hsa-miR-143-3pEIF2AK3
membrane protein ectodomain proteolysis0.002220614hsa-miR-143-3pPSEN1
BACE1
hsa-miR-4433b-5pNCSTN
mitochondrial inner membrane0.005473536hsa-miR-143-3pNDUFB9
NDUFA9
PSEN1
NDUFS1
COX4I1
mitochondrial electron transport, NADH to ubiquinone0.005473536hsa-miR-143-3pNDUFB9
NDUFA9
NDUFS1
NADH dehydrogenase (ubiquinone) activity0.01130008hsa-miR-143-3pNDUFB9
NDUFA9
NDUFS1
mitochondrial respiratory chain complex I0.01133565hsa-miR-143-3pNDUFB9
NDUFA9
NDUFS1
amyloid precursor protein catabolic process0.0124875hsa-miR-4433b-5pNCSTN
hsa-miR-143-3pPSEN1
Notch-receptor processing0.01577116hsa-miR-4433b-5pNCSTN
hsa-miR-143-3pPSEN1
response to calcium ion0.01746326hsa-miR-6501-5pPPP3CA
hsa-miR-4433b-5pCALM3
Table 5. List of target genes and their roles and functions as related to AD.
GeneRoles and Functions as Related to AD
ATP synthase F1 subunit epsilon (ATP5E)
  • A mitochondrial-encoded oxidative phosphorylation (OXPHOS) gene [46].
  • OXPHOS dysfunction increases the level of reactive oxygen species (ROS) and oxidative stress, which subsequently leads to neuronal damage in the AD brain [47].
Protein phosphatase 3 catalytic subunit alpha (PPP3CA)
  • A catalytic subunit of calcineurin, which is involved in the calcium signalling and inflammatory pathways related to AD [48].
  • Dysregulation of PPP3CA was observed in the AD brain through its involvement with oxidative stress and pathological cellular dysfunction losses [48,49].
Glutamate Ionotropic Receptor NMDA Type Subunit 2C (GRIN2C)
  • Takes part in glutamate-mediated neurotoxicity, which stimulates the progressive decline of cognitive function in AD patients [50].
Calmodulin 3 (CALM3)
  • An indicator for calcium signalling dysfunction, where lower expressions were detected in AD patients as compared to normal controls [51,52].
Nicastrin (NCSTN)
  • Nicastrin is one of the subunits of γ- secretase that plays an important role in the amyloidogenic pathways of AD pathogenesis [53].
  • The inactivation of NCSSTN restricts production and subsequently inhibits neurodegeneration [53,54].
Glutamate Ionotropic Receptor NMDA Type Subunit 2B (GRIN2B)
  • Expresses in the brain regions that are predominantly affected in AD [55].
  • Involved in synaptic functioning, where its dysfunction leads to neuronal damage and cognitive impairment [55].
Eukaryotic translation initiation factor 2 alpha kinase 3 (EIF2AK3)
  • Encodes for PERK protein, which is involved in cognitive activities such as learning and memory [56].
  • Overexpression of EIF2AK3 induces tau phosphorylation and promotes amyloidogenesis [56].
  • Interacts with the strongest genetic factor of AD, APOE4 [56,57].
NADH:ubiquinone oxidoreductase subunit B9 (NDUFB9)
  • An OXPHOS gene [46].
  • Involved in the oxidative phosphorylation pathway in AD [58].
NADH:ubiquinone oxidoreductase subunit A9 (NDUFA9)
  • An OXPHOS gene [46].
  • Involved in mitochondrial failure, leading to accumulation [59].
Presenilin 1 (PSEN1)
  • Most prevalent genetic variant of AD [59,60].
  • Encodes protein presenilin 1, which is one of the subunits of γ- secretase that plays an important role in the amyloidogenic pathway of AD pathogenesis [60,61].
  • Exacerbates the production of in AD pathogenesis [61].
Mitogen-activated protein kinase 1 (MAPK1)
  • Takes part in cellular signal transduction [62].
  • induces the elevation of MAPK1 expression, elevates tau phosphorylation, exacerbates the amyloidogenic pathway, and aggravates AD development [62,63].
NADH:ubiquinone oxidoreductase subunit S1 (NDUFS1)
  • An OXPHOS gene [46,64].
  • Involved in mitochondrial energy metabolism; however, its main function remains unknown [64,65].
Ryanodine receptor 3 (RYR3)
  • Releases stored calcium ions into the extracellular space [66].
  • The deposition of causes the increase of RYR3 expression [66].
  • The upregulation of RYR3 may form a protection for the neurons and against the impact of in the late stage of AD [67,68].
β-secretase cleaving enzyme 1 (BACE1)
  • Responsible for β-secretase activity in the amyloidogenic pathway, which initiates the generation of [69].
  • Shows high expression in AD patients as compared to normal controls, including in the plasma [70].
  • The inhibition of BACE1 serves as the target for the study of AD drug candidates [71].
Cytochrome c oxidase subunit 4I1 (COX4I1)
  • Involved in the mitochondrion electron transport chain, a crucial mechanism in cellular metabolism and the electron transport chain [72].
  • The cleavage of APOEε4 inhibits the COX gene, leading to mitochondrial dysfunction [73].
  • COX4I1 showed significant downregulation in AD patients [72].
Disclaimer/Publisher’s Note: The statements, opinions and data contained in all publications are solely those of the individual author(s) and contributor(s) and not of MDPI and/or the editor(s). MDPI and/or the editor(s) disclaim responsibility for any injury to people or property resulting from any ideas, methods, instructions or products referred to in the content.