Abstract
Nanomaterials have been widely used for improving the physicochemical properties of geomaterials. However, quantitative interpretation of the microscopic mechanisms is still not well understood. In this study, a statistical principle was applied to study the microscopic characteristics of nano-silica (NS) modified silty clay. We use mercury intrusion porosimetry (MIP) to measure the micro-pore parameters (median pore diameter and cumulative volume of pore diameters smaller than 0.1 µm) based on various NS-modified silty clays (NS mass contents 0, 0.25%, 1%, and 3%). The test results indicate two micro-pore parameters have significant randomness and uncertainty, and soil pores become smaller and more compacted. Furthermore, four potential probability distributions were selected to compare with measured data. All distributions agree excellently with the experimental data, and three distributions satisfy the hypothesis testing, except the Weibull distribution. Finally, according to the information spread estimation method and chi-square test effect evaluation indexes, the normal distribution was proposed because it has the optimal described effect for the statistical characteristics of NS-modified silty clay. These results have important implications for understanding the randomness and evolution of microstructures of NS geomaterials, which are helpful to guide the evaluation of freezing process and water transport in modified soils.
1. Introduction
As a new additive material, nanomaterials have been widely used in the fields of information, materials, energy, environment, medical equipment, biology and agriculture, electronic equipment, coatings, and other industries [1,2,3]. Size, quantum, surface, and interface effects can be produced by nanomaterials. For example, the NS will increase the density of microstructure and reduce the pore permeability [4]. NS improves the stability of soils significantly by the hydration products that fill the pores between soil particles [5]. Meanwhile, the Atterberg limits can be modified by the formed permanent silicide in the surface and interior of the soil–water system [6]. The microparticle reactions in the soil–water system will be accelerated due to nanoparticles with a high specific surface area [7].
The microscopic characteristics and modified mechanisms of the soil–water system with nanomaterials have been widely studied, especially the micro-physicochemical and mechanical properties. Nanomaterials as an additive can fill the interspace of a soil–water system, and ion exchange and the hydration reaction can be promoted by nanomaterials. These result in the change of physicochemical and mechanical properties. For instance, the gel structure can compact the soil–water system, which is formed upon the soil particle surface. The dry density of nanomaterials modified soil increases and hydraulic conductivity reduces significantly because nano-particles fill the pores of the soil–water system and bond the soil particles together [5,8,9]. The hydration reaction and ion exchange are promoted by the nanostructured palm beam ash, and stabilizers flocculation effect is increased [10]. Because of the filling and nucleation effects of nanoparticles, the smaller the nanoparticles’ diameters are the larger the pores of loess [6,11]. The stability of loess will be enhanced effectively in the generation of hydrates due to the chemical reactions between NS and soil particles. In civil engineering, many researchers point out that mechanical characteristics can be enhanced by nanomaterials to meet the requirements of design and construction. For example, with the addition of nanomaterials, the expansion ratio of expansive clay, expansion pressure, and coefficient of permeability reduce, while the California bearing ratio (CBR), stiffness, shear strength, plasticity, and unconfined compressive strength increase [6,12,13,14,15,16]. In short, the mechanical properties of a soil–water system can be enhanced by nanomaterials, and it varies with soil texture, nanomaterial type, additive content, and so on.
In essence, nanomaterials affect the physicochemical and mechanical properties of modified soil by mainly optimizing the micro-pore structure of the soil–water system. SEM, computerized tomography, and MIP are the three common methods to study the microstructure of the soil–water system [17,18]. For instance, it was found that NS fills the pores and aggregates with nanomaterials and soil particles by SEM [7]. The tensile strength of clay can be improved by nano-clay, and the mechanism is summarized as follows: a viscous gel material is produced when nano-clay particles contact with pore water, and the friction between soil particles increases. Nanoparticles fill the pores of a soil–water system, and the interfacial bond strength is improved as the contact acreage of soil particles increases. Following this, the mechanical properties of clay with viscous gel fibers around soil particles are improved effectively [12,19,20,21]. The pozzolanic reaction is promoted by nanomaterials under wetting conditions, then improving the durability of stabilized soils [22]. As shown in SEM images of modified clay, the micro-pore structure becomes more uniform and denser, large pores at the surface of the particles reduce, and the pores are filled by nanoparticles [23]. Although the mechanical and physicochemical properties of a soil–water system can be improved by nanomaterials, the agglomeration phenomenon and modification mechanism of the nanomaterials remain to be imperfect when nanomaterials are applied in the practical engineering.
A large number of researchers have studied the mechanical, physicochemical properties and micro characteristics of geomaterials improved by nanoparticles. Moreover, the mechanical properties can be described as quantificationally combined with the relevant mechanical experiments. However, the research for the physicochemical properties and microscopic characteristics is basically qualitative, and quantitative analysis is scarce. In this study, the micro-pore characteristics of the NS-modified Qinghai–Tibet Plateau silty clay were analyzed on the basis of statistical principle. The median pore diameter and cumulative volume of the pore diameters smaller than 0.1μm () were measured at four NS additions (0, 0.25%, 1%, and 3%) by means of SEM and MIP. In order to meet the requirements of statistically large samples, the sample number under each experimental condition was 50 according to [24]. The effect of NS on the micro-pore characteristics of the silty clay samples was explained in detail. Then, four potential distributions were selected (including normal, lognormal, Weibull, and Gamma) to analyze the statistical characteristics of the microstructure parameters of the NS-modified silty clay. Finally, the most likely probability distribution was theoretically chosen according to the results of the hypothesis testing. The results of these studies can provide a theoretical foundation and reference for the statistical characterization of the microscopic features of NS-modified porous media.
2. Material and Method
2.1. Experimental Materials
In this study, we selected the silty clay from the Qinghai–Tibet Plateau, China (34°54.2′ N and 92°56.4′ E). To eliminate the effect of salt on experiment results, the natural saline soils were washed by deionized water salts over 10 times [25]. Then, the non-saline soils were dried, pulverized, and sieved with a 2 mm sieve. The particle size (R) distribution of the experimental soil was analyzed by a Master Sizer-2000 Laser particle size analyzer (Figure 1). It was found that the silty clay consisted of 30.14% clay (R < 0.005 mm), 61.53% silt (0.005 < R < 0.05 mm), and 8.33% sand (0.05 < R < 2 mm). The uniformity coefficient and curvature coefficient of the silty clay were 8.49 and 2.96, respectively. The physical properties of Qinghai–Tibet Plateau silty clays are summarized in Table 1.
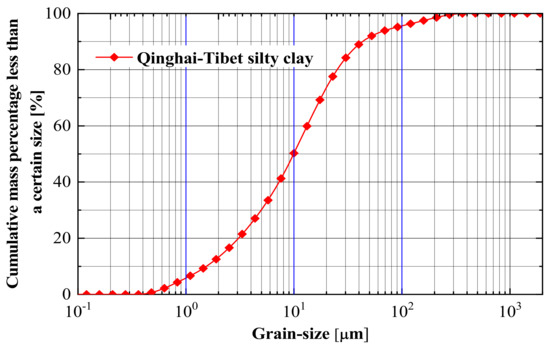
Figure 1.
The grain size distribution measured curve of silty clay samples.

Table 1.
Physical properties of Qinghai-Tibet Plateau silty clay.
X-ray diffractometer (XRD) tests were conducted using a D/Max-3B X-ray diffractometer (Tokyo, Japan), with a scanning rate of 4°/min. According to mineral component identification experiments by XRD, the mineral composition of silty clay mainly included illite, kaolinite, quartz, potash feldspar, plagioclase, calcite, and hematite. Their contents were 18.6, 5.3, 42, 7.0, 11.3, 13.4, and 2.4 percent, respectively.
In this study, the additive NS particle used was spherical, the diameter was about 15 nm, the purity was 99.5%, the specific gravity was 200 m2/g, and the bulk density was 0.05 g/cm3.
2.2. Experimental Methods
The NS (procured commercially) suspended on the surface when the mixed sample was obtained by the ordinary mechanical stirring and mixing method. In order to obtain the uniform soil sample, in addition to the mechanical mixing method, the mixed soil sample passed through a 2.5 mm sieve many times (Figure 2) [26]. The specific operation process was: (1) a certain amount of soil samples and NS were placed in a container and mixed with a mechanical method (Figure 2a); (2) the mixture of soil samples and NS (NS particles still suspended on the surface of soil samples) was split and placed in a 2.5 mm sieve (Figure 2b); (3) the mixed samples were sieved according to the normal sieving process until no small particles were left in the sieve, and the aggregates were crushed until no white powder was visible (Figure 2c); (4) coarse and fine particles were re-mixed in another container, and the above steps (2) and (3) were repeated until all soil samples were mixed; (5) the mixed soils from step (4) were passed through a 2 mm sieve; (6) steps (2)–(5) were repeated until the white powder was no longer present in the soil sample, and a uniform mixed sample was obtained (Figure 2d). In this study, four NS contents were added to modify Qinghai–Tibet Plateau silty clay, namely 0, 0.25, 1, and 3 percent.
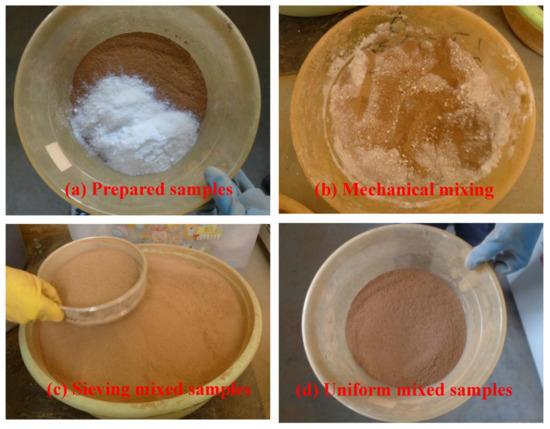
Figure 2.
The mixing process of NS-modified silty clay.
In order to maintain the pore structure of the modified silty clay samples in the drying process, the natural air-drying method was used instead of the oven drying method. For each of the NS contents, three specimens from the center of samples were selected. Then, we cleaned the particles adhering to the surface, and the specimens were polished with sandpaper. The microscopic features of the NS-modified silty clay were studied using a SEM and MIP (AutoPore IV 9500, Micromeritics Instrument Corporation, Norcross, GA, USA). The pore diameter range was 0.003~1000 m in the MIP test.
If we assume that pores in a soil–water system are cylindrical, then mercury will infiltrate the soil–water system when the external force starts. When the external pressure (Pa) was applied, the pores with a radius of less than or equal to (m) were filled with mercury solution.
The relationship between pore diameter and external pressure can be described by the Washburn equation [27]:
where is the mercury solution surface tension (N/m), which is 0.483 N/m at 20 °C, and is the contact angle between the soil particles and the liquid mercury.
By Equation (1), the mercury intrusion curve can be obtained by the combination of the total volume of injected mercury and corresponding pressure change during the process of mercury intrusion. The pore diameter distribution can be obtained by differentiating the incoming mercury volume function, which depends on the independent variable of pore radius .
where is the accumulation of mercury influx (mL/g), and is the density function.
The following relationship can be obtained if approaches zero:
where and are the particle-specific gravity and pore ratios, respectively.
3. Density Functions and Probability Distributions
A probability distribution is the law of probability used to describe the value of a random variable. The probability of an event occurring represents the probability that the outcome of an experiment occurs. To fully understand a trial, it is necessary to know all possible outcomes of the trial and the probability of each possible outcome, i.e., the probability distribution of a randomized trial. If the outcome of the test is expressed by the value of the variable X, then the probability distribution of the random trial is the probability distribution of the random variable, i.e., the possible values of the random variable and the corresponding probabilities. Depending on the differences of the random variable types, the probability distribution takes different forms [28,29].
In this study, four potential distribution types were selected to describe the micro-pore structure characteristics of NS-modified Qinghai–Tibet silty clays, including normal, lognormal, Gamma, and Weibull distributions. The density functions of the four probability distributions are shown in Table 2.
Table 2.
The density functions of probability distributions.
4. Results and Discussions
4.1. Microscopic Characteristics of NS-Modified Silty Clay
As a basic soil property, pore size distribution (PoSD) is used to analyse soil–water characteristic curves [30]. The pore size density distributions of NS-modified Qinghai–Tibet silty clay with various NS additions are demonstrated in Figure 3. The results showed that the pore size density curves of NS-modified silty clay varied in the left direction with the increase of NS content. For the corresponding pore diameter of the peak pore size density, compared to the plain silty clay, the NS additions of 0.25%, 1%, and 3% decreased the peak point by 19.18%, 34.49%, and 66.04%, respectively. This indicates that the pore diameters in the soil–water system become smaller. This is because nanoparticles fill the pore space between soil particles, making the soil pores become smaller, and the soil becomes more compacted. In Figure 3, the modified silty clays with 1% and 3% additions show a bimodal distribution, with a secondary peak for pore diameters greater than 1000 nm. The most probable causes are: ① the NS addition of less than 1% was insufficient to fill the pore directly; ② NS had strong water absorption, the clay aggregates took NS as the core in the modified soil; and ③ the original pores connected with the closed pores and formed a local bigger pore. The formation of these large pores was random and non-uniform.
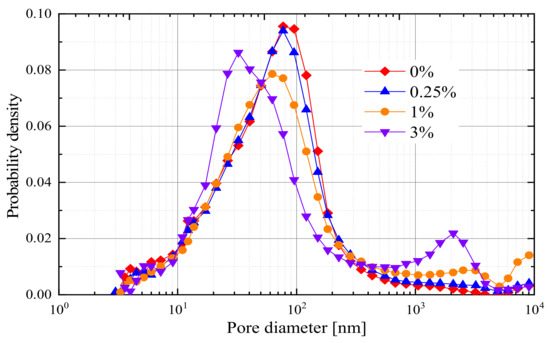
Figure 3.
Pore radius density curves of NS-modified silty clay samples.
Figure 4 shows the accumulated pore radius distribution curves of NS-modified Qinghai–Tibet silty clay. According to the average pore diameter classification standard from the International Union of Pure and Applied Chemistry (IUPAC) [31], the boundary diameter of meso- and macro-pores is 50 nm. Meanwhile, the size of the NS particles used in this study was about 15 nm. Therefore, 50 nm and 150 nm were selected as the boundary diameters of small pores, medium pores, and larger pores. From Figure 5, the volume content of larger pores was 52.53%, and the medium and smaller pores of the plain silty clay were 29.93% and 17.54%, respectively. The volumetric content of the medium pores increased to 31.59%, 35.83%, and 46.59% for the NS additions of 0.25%, 1%, and 3%, respectively. The volume of the macro-pores, on the other hand, decreased from 52.53% to 33.10% when the NS particle content increased from 0 to 3%, and the volumetric content of the smaller pores had little change with the addition of NS. In general, a small quantity of addition was not enough to fill the void of soil–water systems directly. However, due to the strong water absorption of NS, the voids may be filled by small clay clusters formed with NS as the core.
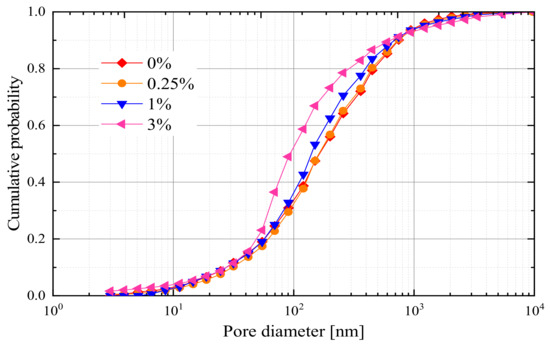
Figure 4.
The accumulated pore diameter distribution curves of NS-modified silty clay samples.
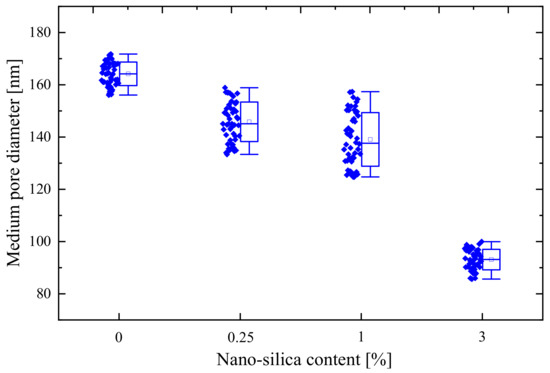
Figure 5.
Determination of median pore size of soil samples with different NS contents.
4.2. Measured Median Pore Diameters and Cumulative Volume of Pore Diameters Smaller Than 0.1 m
As a porous medium, the soil–water system consists of soil particles, a pore solution, and air, making a four-component medium with the incorporation of NS. The four components are approximately arranged according to a certain regularity (the center to outer layers are the soil particles, NS particles, or pore solution, and air, respectively) [32,33]. However, the sizes, shapes, and mineral components of the soil particles are various due to geological and environmental processes [34]. The surface of soil particles or the voids of soil–water systems are randomly filled with water, NS particles, and air. Therefore, even at the same NS addition, the microstructures of fifty NS-modified Qinghai–Tibet silty clay specimens show significant randomness and variability (Figure 5 and Figure 6). For instance, compared to the minimum median pore diameter of each NS addition, the range abilities for NS contents of 0, 0.25%, 1%, and 3% are 10.05%, 19.14%, 26.17%, and 16.69%, respectively. Similarly, the range abilities of for NS contents of 0, 0.25%, 1%, and 3% are 21.89%, 16.72%, 25.28%, and 14.50%, respectively.
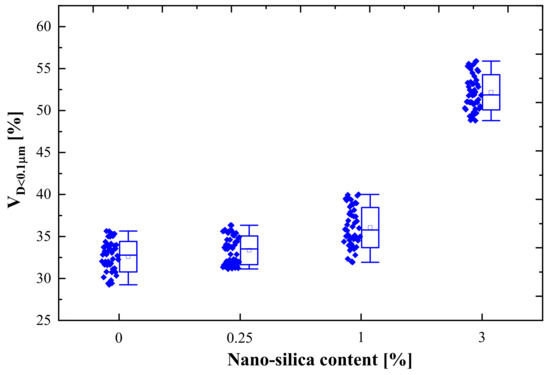
Figure 6.
Determination of of soil samples with various NS contents.
As indicated in Figure 5, the values of median pore size of all NS-modified Qinghai–Tibet silty clay are smaller than that of the plain silty clay. For instance, the median pore diameter of NS-modified Qinghai–Tibet silty clay ranges from 124.72 nm to 157.35 nm when the addition is 1%. The standard deviation and mean value are 10.25 nm and 139.10 nm, respectively. Box plots were used to reflect the variability of the median pore size of NS-modified Qinghai–Tibet silty clay (Figure 5b). Because the micro-pores of a soil–water system are filled by nano-material, the pore filling rate increases with the increase of the NS addition amount, and the median pore diameter decreases. It is very interesting to find that the addition of NS distinctly decreases the median pore diameter; the addition of 0.25%, 1%, and 3% decreases the median pore diameter by 11.20%, 15.29%, and 43.30%, respectively. Therefore, it is essential to study the variability of the median pore size of soil modified by NS.
As observed from Figure 6, the addition of NS slightly increases the when the NS addition ranges from 0 to 1%. For example, the incorporation of 0.25% and 1% NS increases the values by 2.32% and 10.63%, respectively, compared to the plain Qinghai–Tibet silty clay. However, the mean has a sharp increase from 36.07% to 52.17% when NS content increases from 1% to 3%. In addition, it is more noticeable that the maximum difference reaches 8.07% in the variability of the with an NS content of 1% while the mean value of is only 36.07%. Meanwhile, the values of NS-modified silty clay with NS contents of 0, 0.25%, and 3% varies distinctly, with values ranging from 29.25% to 35.65%, 31.13% to 36.34%, and 48.81% to 55.89%, respectively. Hence, it cannot be determined precisely by limited specimen tests that the of NS-modified Qinghai–Tibet silty clay.
4.3. SEM Images of NS-Modified Silty Clay
To examine the effect of NS on the microstructure of modified Qinghai–Tibet silty clay, four addition contents were selected for SEM imaging at various magnifications (×35, ×500, ×2000, ×5000) (Figure 7). Figure 7 shows that the microstructure is quite loose and some large voids are in the soil–water system in the plain silty clay without NS. It can be seen that the microstructures become intact by adding only a small amount of NS, but there are many median voids forming. Moreover, as shown in Figure 7, the microstructures become compact and dense with the increment in NS addition. The micro-pore changes show that the NS could effectively densify the microstructure, compared to the plain silty clay. Microstructure densification may be attributed to the voids between the soil grains filled successively. These SEM research results agree with the conclusion of the aforementioned void analysis.
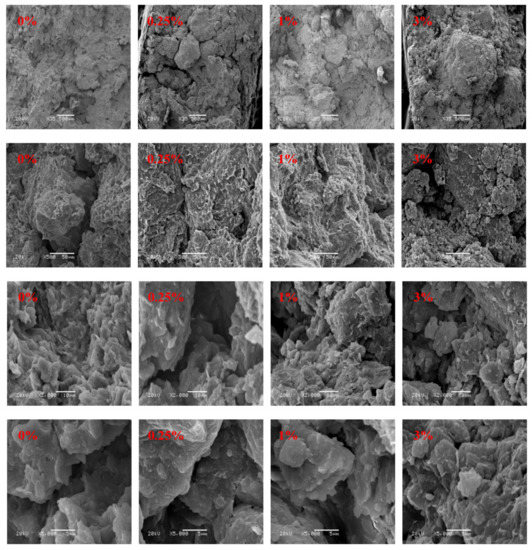
Figure 7.
SEM images of soil samples with various NS contents (from above to below, magnification times: ×35, ×500, ×2000, ×5000).
The reason is that small clay agglomerates are formed with a NS core that fills the voids in the soil–water system. The larger pores in a soil–water system will be filled by the small clay clusters. Comparing the SEM images of NS additions from 0 to 3%, the aggregation of clay particles can be seen in the voids, which increases with NS addition. As the NS addition increases, the pore diameter and number decrease. The result tallies with that obtained by MIP test. Obviously, the surface properties remain unchanged and soil particles are still flaky when the NS is added to the soil–water system from the 2000-fold SEM images. Hence, the surface shape effects caused by NS can be overlooked. Altogether, combining the MIP and SEM test data, it can be found that the total pores and larger pores in a soil–water system decrease with the mix of NS, and this trend will grow with the increase of NS addition.
4.4. Possible Probability Distributions for Micro-Pore Parameters of NS-Modified Silty Clay
In this study, the microscopic characteristics of NS-modified Qinghai–Tibet silty clay were described using two microporous parameters, including median pore diameter and . Figure 8 shows the probability differences between the potential probability distributions and the measured median pore radii at four NS contents (the additions with 0.25%, 1%, and 3% are in Figure S1). These probability differences have small values, indicating that the measured data are similar in shape to the four potential probability distribution curves. Nevertheless, 13.45% is the largest probability difference of the median pore size for the Weibull distribution without addition, which deviates from the measured results (Figure 8).
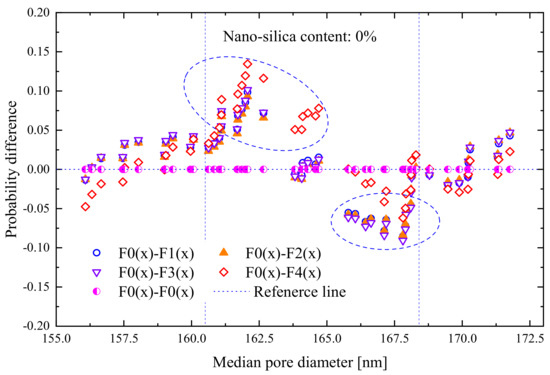
Figure 8.
The probability difference between distributions and experimental median pore diameters (, i = 0, 1, 2, 3, and 4 represent the measured, normal, lognormal, Gamma, and Weibull distributions, respectively).
From the large difference, it is indicated that the actual median pore size probability distribution cannot be described well by the Weibull distribution. The others are in good agreement with the experimental results. In particular, the predicted values from normal and lognormal distributions are approximately equal to the measured ones, with a maximum probability difference of 9.85%. Therefore, the three distributions can visually describe the probability distribution of the median pore size of NS Qinghai–Tibet silty clay.
The measured mean curves at four NS contents are compared with the four distributions, and the probability differences between the probability distributions and experimental are shown in Figure 9. Similarly, the largest of the probability difference of for the Weibull distribution reaches 0.1827 with the addition of 0.25%, which deviates relatively from the measured results (Figure S2). The comparison results indicate that the probability law of mean cannot be reflected through the Weibull distribution. However, the other three types of distribution and measured results are in good agreement, the largest probability difference between the three distributions and measured results are smaller than 10.32%, except for the addition of 1%. The comparison results indicate that the randomness and variability are significant for the microstructure characteristics of modified Qinghai–Tibet silty clay. Therefore, the mean of NS-modified Qinghai–Tibet silty clay follows normal, lognormal, or Gamma distributions.
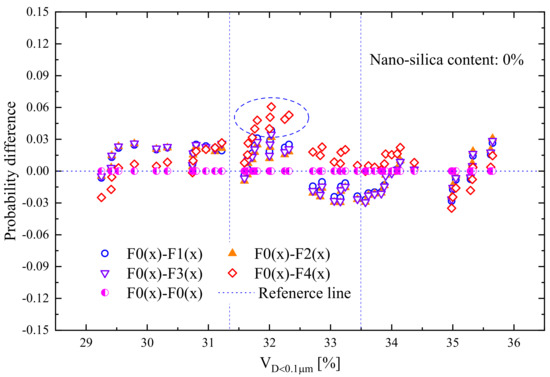
Figure 9.
The probability difference between the four distributions and experimental .
The statistical characteristics (mean value, variance, and standard deviation) of the probability differences between these distributions and the experimental results at four NS contents are shown in Table 3 (for in Table S1). It can be found that the Weibull distribution has the maximum mean probability differences at four NS contents. For the median pore diameter, the maximum mean probability difference is 2.52% with the addition of 1%, and that is 2.89% with the addition of 3% for . The statistical characteristics show that the predicted results from Weibull distribution deviate from the experimental ones. The mean and variance of the other three distributions are relatively small, indicating that the other three distributions perform better than the Weibull distribution on the prediction of the microstructure properties of the modified Qinghai–Tibet silty clay.
Table 3.
The statistical characteristics of probability differences between potential probability distribution and measured median pore diameter.
4.5. Distribution Laws of Possible Probability Distributions
For random variables, each value corresponds to a probability of what happens in the trial. To show the distribution law of potential distribution intuitively, the possible value range of the median pore diameters is divided into eight intervals. Figure 10 shows the distribution laws of potential probability distributions and measured median pore size at four NS contents. In general, the probability value of the middle segment is greater than that of the boundary segment, and the probability values of the two boundary segments are equal approximately. As presented in Figure 10, normal and lognormal distributions generally maintain similar distribution laws with sample distribution, while Gamma and Weibull distributions differ greatly from sample distribution, especially Weibull distribution. However, the partial distribution law of the lognormal distribution at an NS content of 1% and 3% is the opposite of the sample distribution law. From the perspective of the median pore diameters, normal distribution is the best effect to describe the statistical characteristics of the median pore diameters of NS-modified silty clay.
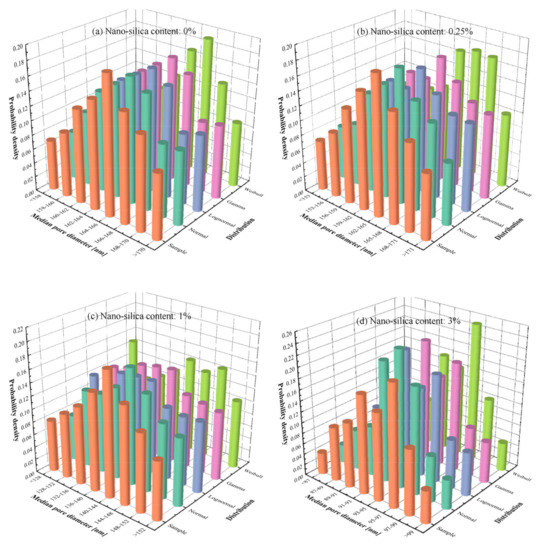
Figure 10.
The distribution laws of four distributions and measured median pore radius.
In this part, the possible value range of the cumulative volume of pore size smaller than 0.1m is divided into seven or eight intervals. The distribution laws of potential probability distributions and measured at four NS additions are shown in Figure 11. When the NS additions are 0, 0.25%, 1%, and 3%, the corresponding maximum probabilities of measured are in the intervals of 33~34%, 34~35%, 35~36%, and 51~52%, respectively. Additionally, the probabilities are 0.21, 0.17, 0.18, and 0.20, respectively. In general, for the , the distribution law of normal distribution has a high similarity with the sample distribution. However, the lognormal, Gamma, and Weibull distributions are different from the sample distribution law, especially the Weibull distribution.
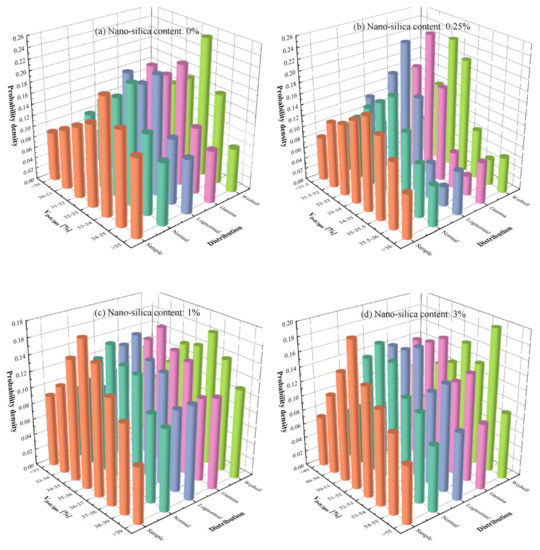
Figure 11.
The distribution laws of potential probability distributions and measured .
4.6. Assumption Testing for Statistical Analysis
Based on the above analysis, we hypothesize that the probability distribution of the microstructure of NS-modified silty clay can be described by the four distribution functions. In this study, the hypothesis is assessed by the chi-square test as follows:
where is the random variable and follows a distribution; we divide the possible values under into disjoint subsets ; is the number of the observation data that fall into ; based on the hypothetical distribution in , we can calculate the probability of event ; is the amount of observation categories; and is the distribution parameters amount of the distribution , respectively. If the following inequality is true, we accept the hypothesis; in other words, these observations agree well with the distribution .
where is the statistical significance level, and it is 5%, generally. In addition, we determine the acceptable level of hypothetical use with a chi-square test effect evaluation index (CEI).
Hypothesis H1:
The observations obey a probability distribution and the following statistical methods can be used (Sheng et al., 2008) [29].
Obviously, if the statistical effect is better, the value of CEI will be smaller. By the chi-square test, Weibull distribution of microstructure parameters with . However, the others are less than 1, which satisfies Equation (5). Hence, the hypothesis of Weibull distribution should not be accepted. The CEI values of the probability distributions of median pore diameters are shown in Figure 12. The CEI values of the normal, lognormal, and Gamma distributions are almost the same when the NS is added at 1%.
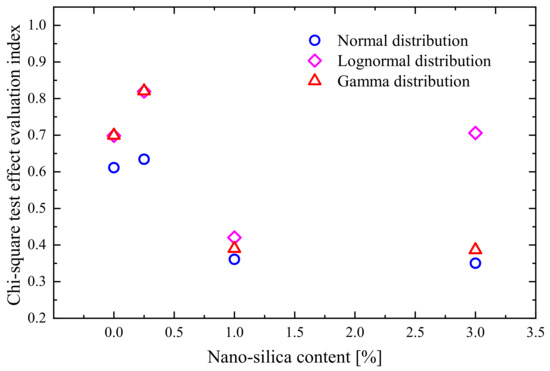
Figure 12.
CEI results for the normal, lognormal, and Gamma distributions of the median pore diameters.
However, at other NS levels, the CEI results of lognormal and Gamma distributions are bigger than those of the normal distribution, meaning that the normal distribution has a better effect to describing the statistical characteristic of the median pore diameter of NS-modified Qinghai–Tibet silty clay.
Especially, for the NS addition of 0.25%, the CEI results of lognormal and Gamma distributions are far more than that of normal distribution. Therefore, the normal distribution is most consistent with the median pore radius probability distribution of the NS-modified Qinghai–Tibet silty clay.
The CEI results of the normal, lognormal, and Gamma distributions of are denoted in Figure 13. The CEI points of Gamma and lognormal distributions are bigger than those of normal distribution when 0.25% and 1% NS is added. In general, the normal distribution has the smallest CEI values among the three distributions. Consequently, it can be modeled well by the normal distribution that the measured results of the .
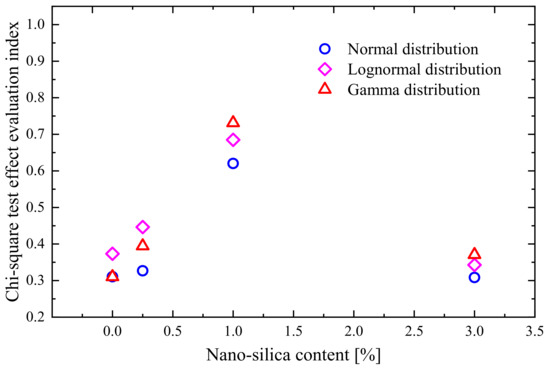
Figure 13.
CEI results of the normal, lognormal, and Gamma distributions of the average .
4.7. Information Spread Estimation
Information spread is a method to make up for the lack of information by optimizing the sample information to carry out set-valued fuzzy processing on samples. The method can transform single-valued samples into set-valued samples and improve the accuracy of population distribution [35].
In the information spread theoretical model, let X be the sample set of actual observed values:
where is the sample observed value, and is the number of observed samples.
Assumed U is the information spread range of in X set:
where represents the discrete real values in the interval [,] after discretization at a fixed interval, and is the number of discrete values.
In general, the information carried by each single-valued observation sample in the set X can be spread to all points in the index domain U according to normal distributions:
where is the information spread function of normal distribution, and is the information spread coefficient, i.e.,
where is the maximum value of sample observations, is the minimum value, and when .
where, is the accumulation of normal spread information of the observed sample . Then, the normalized information distribution of sample point can be expressed by
Figure 14 and Figure 15 show the residual plot of microstructure parameters estimated by the normal distribution and information spread estimation (from left to right: the plots of 1 to 8, 9 to 16, 17 to 24, and 25 to 32 were from silty clays with NS contents of 0, 0.25%, 1%, and 3%, respectively). From Figure 14a, the 20th residual plot of normal distribution is singularity, and the residuals of normal distribution are greater than those of the information spread estimation in Figure 15. Therefore, the information spread estimation has a better fitting effect than the normal distribution for the NS-modified silty clay, because it has combined the normal distribution information of each observation. Meanwhile, the information spread estimation fits with all observations with the nonlinear regression method.
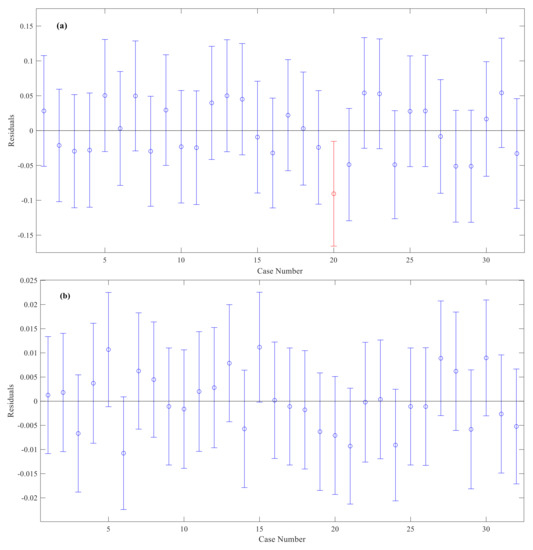
Figure 14.
The residual plot of (a) normal and (b) information spread distributions for the .
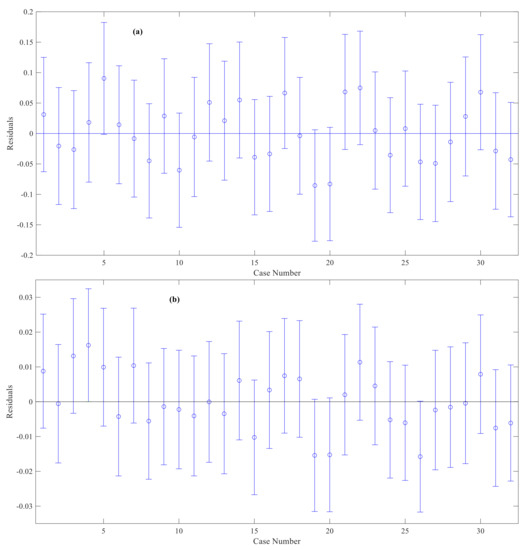
Figure 15.
The residual plot of (a) normal and (b) information spread distributions for the median pore diameter.
As a result, even for the unsmooth parts of the observations, the normal diffusion estimation in combination with the statistical features has a better prediction than the normal distribution. However, the normal diffusion estimation still has many limits because of the complex expression and operating process, especially in practical applications [36]. Furthermore, the superiority of the normal diffusion estimation is not shown in large samples. In general, for the Qinghai–Tibet Plateau silty clay, the pore size distribution of soil samples is regular whether nanomaterials are added or not. The Gaussian distribution is more representative than other statistical distributions.
5. Conclusions
As two typical microstructure parameters of porous medium, the median pore size and are used to analyse the micro-pore characteristics of NS-modified Qinghai–Tibet Plateau silty clay. Four common distributions are employed to estimate the distribution characteristics of microstructure parameters. Furthermore, the information spread distribution is introduced to compare with the normal distribution. The main conclusions of this study can be summarized as:
- Nanoparticles fill the pore space between soil particles, making the soil pores smaller and the soil more compacted. The microstructure parameters of the silty clay samples exhibit apparent randomness and uncertainty. Furthermore, the lower the NS content, the more pronounced the stochastic effect.
- The mean median pore diameters of NS-modified silty clay samples are smaller than those without addition, and decrease with increasing NS content. Nevertheless, the average cumulative volume of pore sizes smaller than 0.1 shows the opposite trend.
- The normal, lognormal, Weibull, and Gamma distributions can be potentially used to describe the microscopic features of NS silty clay, and three distributions satisfy hypothesis testing, except for the Weibull distribution. The normal distribution has the best described effect in comparison to the others.
- The information spread estimation has a better fitting effect than the normal distribution, but it is complicated. Therefore, the normal distribution has the most excellent evaluation effect to describe the statistical characteristics of the microstructure parameters of NS-modified silty clay.
Supplementary Materials
The following supporting information can be downloaded at: https://www.mdpi.com/article/10.3390/app13053074/s1, Figure S1. The probability difference between the potential probability distributions and measured median pore diameters; Figure S2. The probability difference between the potential probability distributions and measured ; Table S1. The statistical characteristics of probability differences between potential probability distribution and measured .
Author Contributions
Conceptualization, K.L. and C.W.; methodology, K.L. and C.W.; validation, J.L. and L.X.; data curation, C.W.; writing—original draft preparation, K.L. and C.W.; writing—review and editing, K.L., C.W. and Y.W.; supervision, J.L. and Y.W.; funding acquisition, C.W and S.L. All authors have read and agreed to the published version of the manuscript.
Funding
This work was supported by the Distinguished Youth Foundation of Gansu Province (22JR5RA392), the National Natural Science Foundation of China (41902267), the Construction of Science and Technology Project of Gansu Province (JK2022-09), the Fundamental Research Foundations for the Central Universities (lzujbky-2020-2), and the Foundation of State Key Laboratory of Frozen Soil Engineering (SKLFSE201904).
Institutional Review Board Statement
Not applicable.
Informed Consent Statement
Not applicable.
Data Availability Statement
Not applicable.
Conflicts of Interest
The authors declare no conflict of interest.
References
- Alvarez, J.I.; Fernández, J.M.; Navarro-Blasco, I.; Duran, A.; Sirera, R. Microstructural consequences of nanosilica addition on aerial lime binding materials: Influence of different drying conditions. Mater. Charact. 2013, 80, 36–49. [Google Scholar] [CrossRef]
- Tsardaka, E.C.; Stefanidou, M. Application of an alternative way for silica fume dispersion in cement pastes without ultrasonication. Cem. Concr. Res. 2019, 115, 59–69. [Google Scholar] [CrossRef]
- Wilson, M.A.; Tran, N.H.; Milev, A.S.; Kannangara, G.S.K.; Volk, H. Nanomaterials in soils. Geoderma 2008, 146, 291–302. [Google Scholar] [CrossRef]
- Jaya, R.P.; Yusak, M.I.M.; Hainin, M.R.; Ibrahim, M.H.W. A review of microstructure properties of porous concrete pavement incorporating nano silica. J. Eng. Appl. Sci. 2016, 11, 11832–11835. [Google Scholar]
- Lin, D.F.; Luo, H.L.; Hsiao, D.H.; Chen, C.T.; Cai, D. Enhancing soft subgrade soil with a sewage sludge ash/cement mixture and nano-silicon dioxide. Environ. Earth Sci. 2016, 75, 619. [Google Scholar] [CrossRef]
- Polat, R.; Demirboga, R.; Karagol, F. The effect of nano-MgO on the setting time, autogenous shrinkage, microstructure and mechanical properties of high performance cement paste and mortar. Constr. Build. Mater 2017, 156, 208–218. [Google Scholar] [CrossRef]
- Majeed, Z.H.; Taha, M.R. A Review of Stabilization of Soils by using Nanomaterials. Aust. J. Basic Appl. Sci. 2013, 7, 576–581. [Google Scholar]
- Taha, M.R.; Alsharef, J.M.A. Performance of soil stabilized with carbon nanomaterials. Chem. Eng. Trans. 2018, 63, 757–762. [Google Scholar] [CrossRef]
- Taha, M.R.; Taha, O.M.E. Influence of nano-material on the expansive and shrinkage soil behavior. J. Nanopart. Res. 2012, 14, 1190. [Google Scholar] [CrossRef]
- Onyelowe, K.; Van, D.B. Predicting Subgrade Stiffness of Nanostructured Palm Bunch Ash Stabilized Lateritic Soil for Transport Geotechnics Purposes. J. Geoeng. 2018, 13, 167–175. [Google Scholar] [CrossRef]
- Lv, Q.F.; Chang, C.R.; Zhao, B.H.; Ma, B. Loess Soil Stabilization by Means of SiO2 Nanoparticles. Soil Mech. Found. Eng. 2018, 54, 409–413. [Google Scholar] [CrossRef]
- Meng, T.; Qiang, Y.J.; Hu, A.F.; Xu, C.T.; Lin, L. Effect of compound nano-CaCO3 addition on strength development and microstructure of cement-stabilized soil in the marine environment. Constr. Build. Mater. 2017, 151, 775–781. [Google Scholar] [CrossRef]
- Zeng, Q.; Zhang, D.D.; Sun, H.; Li, K.F. Characterizing pore structure of cement blend pastes using water vapor sorption analysis. Mater. Character. 2014, 95, 72–84. [Google Scholar] [CrossRef]
- Zhang, P.; Sha, D.H.; Li, Q.F.; Zhao, S.K.; Ling, Y.F. Effect of Nano Silica Particles on Impact Resistance and Durability of Concrete Containing Coal Fly Ash. Nanomaterials 2021, 11, 1296. [Google Scholar] [CrossRef]
- Onyelowe, K.C.; Onuoha, I.C.; Ikpemo, O.; Okafor, F.O.; Maduabuchi, M.; Judith, K.N. Nanostructured Clay (NC) and the Stabilization of Lateritic Soil for Construction Purposes. Electron. J. Geotech. Eng. 2017, 22, 4177–4196. [Google Scholar]
- Akhtar, N.; Syakir Ishak, M.I.; Bhawani, S.A.; Umar, K. Various Natural and Anthropogenic Factors Responsible for Water Quality Degradation: A Review. Water 2021, 13, 2660. [Google Scholar] [CrossRef]
- Sun, Y.F.; Zhao, Y.X.; Yuan, L. Quantifying nano-pore heterogeneity and anisotropy in gas shale by synchrotron radiation nano-CT. Microporous. Mesoporous. Mater. 2018, 258, 8–16. [Google Scholar] [CrossRef]
- Zhao, Y.X.; Sun, Y.F.; Liu, S.M.; Chen, Z.W.; Liang, Y. Pore structure characterization of coal by synchrotron radiation nano-CT. Fuel 2017, 215, 102–110. [Google Scholar] [CrossRef]
- Guo, Z.; Ma, Y.; Wang, L.; Zhang, J.; Harik, I.E. Corrosion Fatigue Crack Propagation Mechanism of High-Strength Steel Bar in Various Environments. J. Mater. Civ. Eng. 2020, 32, 04020115. [Google Scholar] [CrossRef]
- Macleod, A.J.N.; Collins, F.G.; Duan, W.H.; Gates, W.P. Quantitative microstructural characterisation of Portland cement-carbon nanotube composites using electron and X-ray microscopy. Cem. Concr. Res. 2019, 123, 105767. [Google Scholar] [CrossRef]
- Akhtar, N.; Ishak, M.I.S.; Ahmad, M.I.; Umar, K.; Md Yusuff, M.S.; Anees, M.T.; Qadir, A.; Ali Almanasir, Y.K. Modification of the Water Quality Index (WQI) Process for Simple Calculation Using the Multi-Criteria Decision-Making (MCDM) Method: A Review. Water 2021, 13, 905. [Google Scholar] [CrossRef]
- Anggraini, V.; Asadi, A.; Farzadnia, N.; Jahangirian, H.; Huat, B.B.K. Reinforcement Benefits of Nanomodified Coir Fiber in Lime-Treated Marine Clay. J. Mater. Civ. Eng. 2016, 28, 06016005. [Google Scholar] [CrossRef]
- Ghasabkolaei, N.; Janalizadeh, A.; Jahanshahi, M.; Roshan, N.; Ghasemi, S.E. Physical and geotechnical properties of cement-treated clayey soil using silica nanoparticles: An experimental study. Eur. Phys. J. Plus 2016, 131, 134. [Google Scholar] [CrossRef]
- Lai, Y.M.; Li, S.Y.; Qi, J.L.; Gao, Z.H.; Chang, X.X. Strength distributions of warm frozen clay and its stochastic damage constitutive model. Cold Reg. Sci. Technol. 2008, 53, 200–215. [Google Scholar] [CrossRef]
- Wang, C.; Lai, Y.M.; Yu, F.; Li, S.Y. Estimating the freezing-thawing hysteresis of chloride saline soils based on the phase transition theory. Appl. Therm. Eng. 2018, 135, 22–33. [Google Scholar] [CrossRef]
- Arif Ali, B.M.; Sanaulla, P.F.; Syed Abu, S.M.; Romana, M.R. Leaching Test Protocols to Evaluate Contaminant Response of Nano-Calcium Silicate–Treated Tropical Soils. J. Hazard. Toxic Radioact. Waste 2023, 27, 04023002. [Google Scholar] [CrossRef]
- Washburn, E.W. The Dynamics of Capillary Flow. Phys. Rev. Lett. 1921, 17, 273–283. [Google Scholar] [CrossRef]
- Li, S.Y.; Wang, C.; Xu, X.X.; Shi, L.H.; Yin, N. Experimental and statistical studies on the thermal properties of frozen clay in Qinghai-Tibet Plateau. Appl. Clay Sci. 2019, 177, 1–11. [Google Scholar] [CrossRef]
- Sheng, Z.; Xie, S.Q.; Pan, C.Y. Probability and Mathematical Statistics, 4th ed.; Higher Education Press: Beijing, China, 2008. [Google Scholar]
- Fredlund, M.D.; Wilson, G.W.; Fredlund, D.G. Use of the grain-size distribution for estimation of the soil-water characteristic curve. Can. Geotech. J. 2002, 39, 1103–1117. [Google Scholar] [CrossRef]
- Gregg, S.J.; Sing, K.S.W. Adsorption, Surface Area and Porosity; Academic Press: London, UK, 1969. [Google Scholar]
- Kleinberg, R.L.; Griffin, D.D. NMR measurements of permafrost: Unfrozen water assay, pore-scale distribution of ice, and hydraulic permeability of sediments. Cold Reg. Sci. Technol. 2005, 42, 63–77. [Google Scholar] [CrossRef]
- Wang, C.; Lai, Y.M.; Zhang, M.Y.; Li, S.Y. A generalized thermal conductivity model of geomaterials based on micro-structures. Acta Geotech. 2019, 14, 1423–1436. [Google Scholar] [CrossRef]
- Ying, Z.; Cui, Y.J.; Benahmed, N.; Duc, M. Changes in microstructure and water retention property of a lime-treated saline soil during curing. Acta Geotech. 2022, 17, 319–326. [Google Scholar] [CrossRef]
- Zhao, H.R.; Wang, D.; Zhu, B.T.; Jin, X. Evaluation of heavy metal pollution of soil in the Dabaoshan mining area based on the information diffusion theory. J. Agro-Environ. Sci. 2019, 38, 79–86. [Google Scholar] [CrossRef]
- Huang, C.F.; Shi, Y. Towards Efficient Fuzzy Information Processing; Normal Diffusion: Heidelberg, Germany, 2002. [Google Scholar] [CrossRef]


Disclaimer/Publisher’s Note: The statements, opinions and data contained in all publications are solely those of the individual author(s) and contributor(s) and not of MDPI and/or the editor(s). MDPI and/or the editor(s) disclaim responsibility for any injury to people or property resulting from any ideas, methods, instructions or products referred to in the content. |
© 2023 by the authors. Licensee MDPI, Basel, Switzerland. This article is an open access article distributed under the terms and conditions of the Creative Commons Attribution (CC BY) license (https://creativecommons.org/licenses/by/4.0/).