Article

Thermocatalytic Decomposition of Dimethyl Methylphosphonate Based on CeO2 Catalysts with Different Morphologies

1
Key Laboratory of Superlight Materials and Surface Technology, Ministry of Education, College of Material Sciences and Chemical Engineering, Harbin Engineering University, Harbin 150001, China
2
State Key Laboratory of NBC Protection for Civilian, Beijing 102205, China
*
Authors to whom correspondence should be addressed.
Appl. Sci. 2023, 13(5), 3093; https://doi.org/10.3390/app13053093
Submission received: 6 January 2023 / Revised: 23 February 2023 / Accepted: 24 February 2023 / Published: 27 February 2023

Abstract

:
The catalytic performances of the catalysts and decomposition mechanisms of dimethyl methylphosphonate (DMMP), a commonly used nerve agent simulant, are well understood based on previous studies. However, the effects of the morphology of the catalyst on DMMP decomposition performance and mechanisms remain unexplored. Thus, in this work, experimental studies were conducted on the thermocatalytic decomposition of DMMP on CeO2 nanomaterials with different morphologies, e.g., irregular nanoparticles, nanorods, and nanocubes. From the performance evaluation, CeO2 nanorods exhibited higher DMMP thermocatalytic decomposition performance as compared to irregular nanoparticles and nanocubes. The primary reaction pathways were the same on all three morphologies of materials, according to in situ diffuse reflectance infrared Fourier transform spectroscopy (DRIFTS) study, whereas side reaction paths showed variable behaviors. According to the catalytic reaction mechanism study, the surface lattice oxygen played a vital role in the thermocatalytic decomposition of DMMP and the accumulation of phosphates, carbonates, and formates were the main factors for deactivation of the catalyst. The behavior of CeO2 catalyst with different morphologies in the thermocatalytic decomposition of DMMP was revealed in this work, and this will be useful for the future design of high-performing catalysts for the efficient degradation of chemical toxicant.

1. Introduction

Sarin is a nerve agent that caused massive casualties during World War I and II [1]. Since the Chemical Weapon Convention entered into force, the safe disposal of chemical warfare agents (CWAs) stockpiles has become a major challenge. In an attempt to dispose of the CWAs, various methods, e.g., incineration [2], hydrolysis [3,4,5], chemical reaction [6,7,8,9], photolysis [10,11,12], etc., have been used. Among the commonly used disposal methods, thermocatalytic decomposition is one of the more efficient and low-cost approaches. During the thermocatalytic decomposition of CWAs, a catalyst must be used to enhance the removal efficiency. Thus, from the perspective of CWAs disposal, the lifetime of a catalyst is one of the most important parameters used in the evaluation of a catalyst’s performance. It is customary to refer to the protection time as the catalyst’s lifetime when 100% conversion is accomplished [13,14].
It is worth noting that in laboratory research, dimethyl methylphosphonate (DMMP) is often used as a simulation of sarin, it exhibits low toxicity while possessing a similar structure with sarin. Among the various catalysts, metal oxides are commonly applied as catalysts for the thermocatalytic decomposition of DMMP, whereby they cleave the P−OCH3 and P−CH3 bonds [15,16,17]. Generally, P−OCH3 could be easily broken by single valent metal oxides, such as Al2O3 [18], MgO [19], ZnO [20], Y2O3 [21], etc. For instance, the research on the thermocatalytic decomposition of DMMP on Al2O3 [18] has shown that one of the methoxy bonds in DMMP was removed at approximately 200 °C, while the other methoxy bond was removed at 300 °C. However, the P−CH3 bond remained intact on the surface of Al2O3 even at temperatures above 400 °C. Such an observation was expected since the P−CH3 bond is typically resistant to cleavage during thermocatalytic decomposition, which also happened for other single valent metal oxide catalysts, such as magnesium oxide and lanthanum oxide. As such, based on the literature, utilizing single valent metal oxide catalysts in the thermocatalytic decomposition process is inadequate to achieve full decomposition of DMMP. In contrast, it was recently shown that multivalent metal oxide catalysts are more favorable in the decomposition of DMMP, especially in the cleavage of P−CH3 bond. Iron oxides have the unique ability to activate the P−CH3 bond at room temperature. This phenomenon was attributed to the existence of a low energy pathway for the oxidative cleavage of P−CH3 bond due to Fe(III)/Fe(II) redox couple [16,22]. Similarly, multivalent manganese oxide [14] and copper oxide catalysts [15,23] show scission of P−OCH3 and P−CH3 bonds.
Being an important rare-earth metal oxide material, multivalent CeO2 possesses an outstanding oxygen storage/release capacity with reversible redox variations between Ce3+/Ce4+, as well as the formation and removal of oxygen vacancies [24], which makes it appealing in various applications such as catalysis, sensing, electrochemistry, optics, and biomedical applications [25,26,27,28,29]. Mitchell et al. studied the room temperature decomposition of DMMP based on a series of alumina-supported cerium and iron oxide catalysts, and the optimal impregnation ratio of these two metals was obtained at the maximum decomposition degree of DMMP [30]. Based on further research, the incomplete decomposition mechanism of DMMP at room temperature based on alumina-supported cerium catalyst was revealed [31]. Chen et al. reported DMMP decomposition on fully oxidized and partially reduced ceria films and reaction mechanism for DMMP decomposition on CeO2 [32]. Maija et al. calculated the DMMP adsorption and decomposition on (110) and (111) CeO2 surfaces with density functional theory modeling. Two possible reaction pathways were proposed [33]. The current studies on the catalytic decomposition of DMMP by CeO2 are focused on elucidating the catalytic performance and mechanism. Despite the significant advancements in the development of CeO2 in the thermocatalytic decomposition of DMMP, it is worth noting that the morphology, size, and surface properties of CeO2 nanomaterials have an important influence on their catalytic performances [34]. For instance, Laura et al. investigated the complete oxidation of toluene based on CeO2 nanomaterials with different morphologies [35]. According to their results, CeO2 nanorods exhibited a higher concentration of defects associated with their exposed crystalline planes, which led to their high oxidative catalytic activity. Moreover, CeO2 nanoparticles have shown maximum catalytic decomposition activity for naphthalene [36], which is related to the high Ce3+/Ce4+ ratio and the oxygen vacancy on the surface of CeO2. When the particle diameter is less than the Bohr radius, the quantum confinement leads to an increase in the effective band gap of the material by decreasing the particle size [37,38]. Currently, there is still a lack of research on the thermal catalytic decomposition of sarin simulant, i.e., DMMP, by CeO2 with different morphologies and sizes. As such, it is crucial to have a systematic and deep exploration into the effects of physicochemical and surface properties on the catalytic performance of CeO2 with different morphologies so as to design CeO2 catalysts with high thermocatalytic DMMP decomposition performance.
Herein, CeO2 with different morphologies and sizes, e.g., irregular nanoparticles, nanorods, and nanocubes, were prepared via a hydrothermal synthesis method by adjusting the hydrothermal reaction temperature and the concentration of NaOH. The effects of the different physicochemical and surface properties of CeO2 nanomaterials with different morphologies and sizes on their thermocatalytic decomposition of DMMP were investigated in this work. Finally, the DMMP decomposition mechanism based on CeO2 nanomaterials was studied and proposed.

2. Materials and Methods

2.1. Synthesis of CeO2 Nanomaterials

Ce(NO3)3·6H2O (99.9%) and NaOH (99.9%) were purchased from Macklin, Shanghai, China. All the chemicals and reagents were used without further purification. In a typical procedure, solution A was prepared by dissolving 2.60 g Ce(NO3)3·6H2O in 10 mL deionized water. Then, 24 g NaOH was dissolved in 50 mL deionized water to prepare solution B (6 mol/L NaOH solution). After which, solution A was dripped into solution B with continuous stirring at room temperature for 30 min. The mixture was placed in a 100 mL Teflon-lined autoclave and it was hydrothermally treated for 24 h at 100 °C (which resulted in the sample with rod-shaped morphology) and another batch at 180 °C (which resulted in cube-shaped morphology). After cooling down to room temperature naturally, the precipitates were centrifuged and repeatedly rinsed in ethanol and deionized water. The precipitates were then dried at 100 °C for eight hours and calcined for four hours at 300 °C. After the calcination process, CeO2 nanorods (CeO2nr) and CeO2 nanocubes (CeO2nc) were obtained. CeO2 nanomaterials with different sizes were prepared by changing the concentration of NaOH. In this work, two variations of CeO2 nanorods were prepared with 6 mol/L and 12 mol/L NaOH, and they were denoted as 6MCeO2nr and 12MCeO2nr, respectively. Two variations of CeO2 nanocubes were prepared with 6 mol/L and 12 mol/L NaOH, and they were denoted as 6MCeO2nc and 12MCeO2nc, respectively. One variation of irregular nanoparticle was prepared with solution B (2 mol/L NaOH solution). The mixture was placed in a 100 mL Teflon-lined autoclave and it was hydrothermally treated for 24 h at 100 °C. After cooling down to room temperature naturally, the precipitates were centrifuged and repeatedly rinsed in ethanol and deionized water. The precipitates were then dried at 100 °C for eight hours and calcined for four hours at 300 °C. It was denoted as 2MCeO2np.

2.2. Characterization of CeO2 Nanomaterials

In order to record the X-ray diffraction (XRD) patterns, a SmartLab (Rigaku, Saitama, Japan) with Cu Kα radiation (λ = 1.5418) was used. Utilizing a Nova 4200e (Quantachrome Instruments, Boynton Beach, FL, USA) and the Brunauer–Emmett–Teller (BET) model, the sample’s specific surface area was determined at 77 K in nitrogen. The sizes and morphologies of all samples were examined by a JEM 2100 high-resolution transmission electron microscope (JEOL, Tokyo, Japan). H2−temperature-programmed reduction (H2−TPR) was carried out using an AutoChem II 2920 (Micromeritics, Norcross, GA, USA). The samples (100 mg) were heated 3 h at 300 °C with He flowing at 50 mL/min, and cooled to 50 °C. In order to execute H2−TPR, the sample was heated at a rate of 10 °C/min from room temperature to 900 °C in the presence of 10% H2/Ar mixture (40 mL/min). X-ray photoelectron spectroscopy (XPS) studies were carried out utilizing an Al-K radiation-powered Thermo Fisher ESCALAB 250Xi (Thermo Fisher Scientific, Waltham, MA, USA) equipment. Based on the carbon deposit C (1s) binding energy (BE) of 284.8 eV, the measurement was calibrated. The Avantage program version 5.976 (Thermo Fisher Scientific, USA) was used to evaluate XPS data. All recorded peaks of the corrected spectra were all fitted with a Gaussian–Lorentzian shape function. Raman spectroscopy was conducted using a HORIBA LabRam HR Evolution (Longjumeau, France). A Thermo Scientific ICS-5000 was used for ion chromatography (Thermo Fisher Scientific, USA). Aqua regia and hydrofluoric acid were used to dissolve the used catalyst. The colorless gelatinous materials on the wall at the end of the reaction tube were collected using 0.2 M NaOH solution. The eluent used was 15 mM KOH buffer. The in situ DRIFTS was conducted using a Nicolet iS 50 (Thermo Fisher Scientific, Waltham, MA, USA) during the reaction process to monitor the thermocatalytic decomposition of DMMP. During the reaction, in situ DRIFTS was conducted with 64 scans at a resolution of 8 cm−1 (to minimize the collection time).

2.3. Evaluation of Thermocatalytic Decomposition Performance

The catalyst’s capability for thermocatalytic degradation was assessed using a fixed-bed reactor with an inner diameter of 4 mm. The DMMP steam was produced by passing compressed air through a bubbler containing DMMP at a flow rate of 50 mL/min. The temperature of the bubbler was 30 °C. The gas line was heated at 80 °C to prevent the condensation of DMMP vapor. The initial DMMP content into the fixed-bed reactor was 5.32 g/m3. The DMMP content in the reaction tail gas were detected by Gas chromatograph (Agilent 6890N, Agilent Technologies, Inc, chromatographic column DB−1701, Santa Clara, CA, USA) outfitted with FID detector. To verify the thermal stability of DMMP at 300 °C, the decomposition experiment of blank DMMP was carried out in an empty reactor. For this, 0.66 g CeO2 nanocubes, 0.42 g CeO2 irregular nanoparticles, and 0.42 g CeO2 nanorods (20−40 mesh) were loaded onto the fixed bed which was heated at 300 °C and gave a gas hourly space velocity (GHSV) of 10,000 h−1. Protection time was used to evaluate of the catalytic decomposition performance (duration needed to achieve DMMP conversion 100%). DMMP conversion rate can be defined based on Equation (1).
DMMP   conversion = 1 C o u t C i n × 100 %
(Cin is the initial DMMP content into the fixed-bed reactor, Cout is the DMMP content in the reaction tail gas).

2.4. Thermocatalytic Decomposition Reaction Tail Gases Analysis

A CATLAB microreactor (HIDEN ANALYTICAL, Warrington, UK) was used to carry out a thermocatalytic decomposition micro-reaction. The reaction tube was filled with 0.05 g CeO2 nanomaterials, then heated at 300 °C for 2 h under a helium atmosphere (with a flow rate of 100 mL/min). The sample was naturally cooled to room temperature under a helium flow and subsequently heated from room temperature to 300 °C at 10 °C/min. DMMP vapor is brought into the reaction tube with a mixture of 80% argon and 20% oxygen as the carrier gas. The carrier gas (50 mL/min) bubbled in a flask containing DMMP at 10 °C. Mass spectrometry (HIDEN ANALYTICAL, Warrington, UK) was used to monitor the reaction tail gas.

3. Results and Discussion

3.1. Characteristics of CeO2 Nanomaterials

The crystallographic information of the as-prepared samples was determined using XRD, and the result is depicted in Figure 1. Based on the recorded XRD spectra for each sample, the detected peaks corresponded well with the characteristic peaks in the XRD spectrum of fluorite structure CeO2 (JCPDS 34−0394, Space Group Fm3m), which indicates that CeO2 with different morphologies were successfully prepared. By employing Scherrer’s equation, the crystallite sizes of 2MCeO2np, 6MCeO2nr, 12MCeO2nr, 6MCeO2nc, and 12MCeO2nc could be calculated to be 6.86 nm, 7.50 nm, 9.61 nm, 39.56 nm, and 49.46 nm, respectively (Table 1). The specific surface areas (SBET) of the as-prepared CeO2 nanomaterials were obtained with N2 adsorption-desorption measurements. In Table 1, irregular CeO2 nanoparticles and nanorods possessed significantly larger SBET as compared to the CeO2 nanocubes. Furthermore, from the BET results, the SBET of CeO2 nanomaterials with the same morphology increased with the reduction in size.
Figure 2 shows the TEM images of the five as-prepared CeO2 nanomaterials prepared via the hydrothermal method. Based on the results, it can be observed that the hydrothermal temperature and NaOH concentration used in the preparation process could result in significant differences in the morphologies of the samples. The formation mechanism of the CeO2 nanomaterials with different morphologies can be attributed to the well-known dissolution/recrystallization process [39]. Figure 2e shows the TEM image of the irregular CeO2 nanoparticles prepared with 2 M NaOH at 100 °C. It can be observed that as the concentration of NaOH increased beyond 2 M NaOH (Figure 2a,b), the as-obtained CeO2 gradually exhibited a change in its morphology into nanorods due to the anisotropic growth of Ce(OH)3 nuclei along the (110) direction. However, as the hydrothermal reaction temperature increased to 180 °C, Ce(OH)3 would become unstable and it could oxidize to form CeO2 nanocubes (Figure 2c,d). The CeO2 nanocubes grew along each edge length direction with increasing NaOH concentrations. According to the TEM results, the average lengths of 6MCeO2nr, 12MCeO2nr, 6MCeO2nc, 12MCeO2nc, and 2MCeO2np were 38.72 nm, 133.83 nm, 18.78 nm, 57.95 nm, and 5.02 nm, respectively, and this result is summarized in Figure 2f and Table 1.
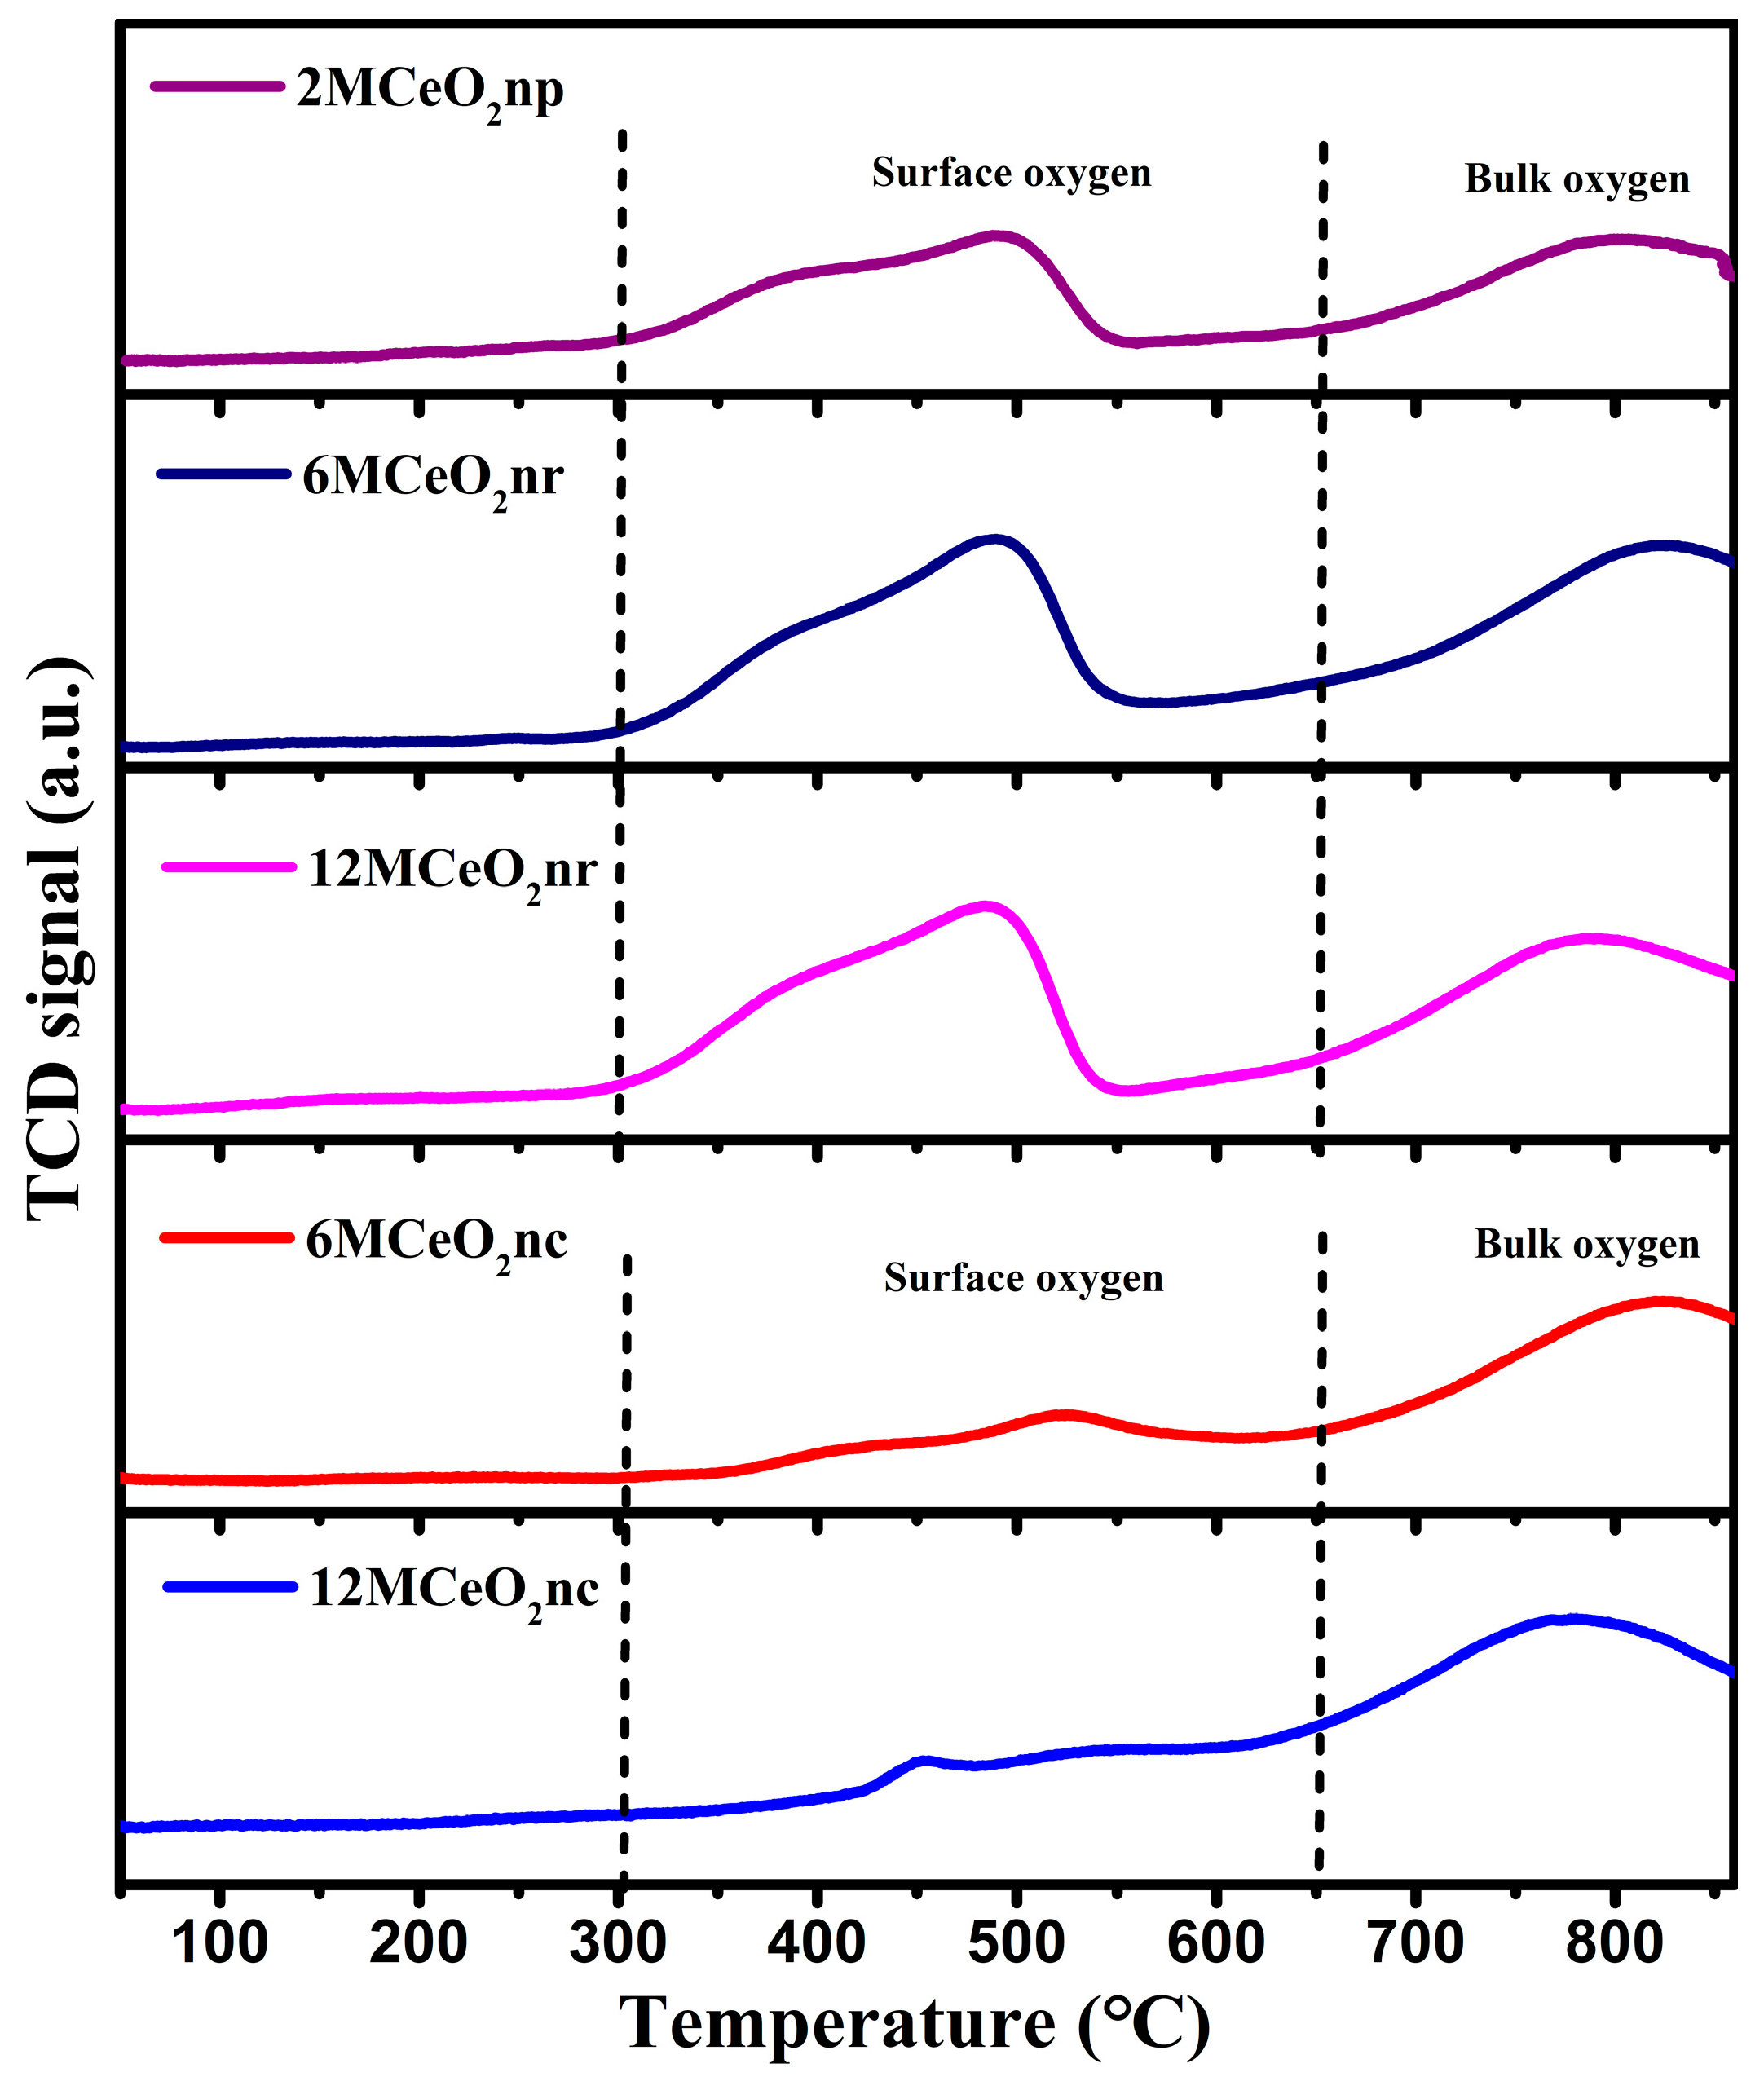
H2−TPR was used to examine the reducibility of the surface oxygen and bulk phase oxygen in the CeO2 nanomaterial (Figure 3). The low temperature reduction peaks located between 300 °C and 650 °C correspond to the reduction of surface oxygen species, while the high temperature reduction peak located above 650 °C relates to the reduction of bulk phase oxygen species [40]. The surface oxygen reduction temperatures of the irregular nanoparticles and nanorods were significantly lower than that of the nanocubes. Such a result indicates that the irregular nanoparticles and nanorods possessed better activity at low temperatures as compared to the nanocubes. Furthermore, a very small amount of H2 was consumed during the surface oxygen reduction for the nanocubes, which may be due to the extremely small surface areas exhibited by the nanocubes that resulted in the smaller amount of surface adsorbed oxygen. Interestingly, 12MCeO2nr and 12MCeO2nc possessed more active bulk oxygen due to their lower bulk oxygen reduction temperature than the same morphologies of 6MCeO2nr and 6MCeO2nc samples, respectively, which makes them more promising as DMMP thermocatalytic catalysts. This is confirmed later in the mechanism discussion section that DMMP is decomposed on CeO2 mainly by the recycling between consuming surface oxygen and replenishment of bulk oxygen and the external oxygen. Therefore, the more active the bulk oxygen is, the more beneficial it is to the transfer of oxygen on CeO2.
Oxidation state of Ce and the nature of the surface oxygen species were characterized by X-ray photoelectron spectroscopy (Figure 4). The Ce 3d XPS spectra of the as-prepared CeO2 nanomaterials consisted of two main peaks (V0, V) and three satellite peaks (V`, V``, V```) that can be ascribed to Ce3d5/2, and the remaining two main peaks (U0, U) and three satellite peaks (U`, U``, U```) that can be ascribed to Ce3d3/2. The binding energy peaks of V (882.14 eV), V`` (888.51 eV), V``` (898.05 eV), U (900.63 eV), U`` (907.32 eV), and U``` (916.45 eV) are attributed to Ce4+, whereas Ce3+ is linked to the photoelectron excitations of V0 (880.2 eV), V` (884.7 eV), U0 (898.65 eV), and U` (903.09 eV) [35]. The presence of Ce3+ indicates the presence of non-stoichiometric CeO2−X on the surface of CeO2 nanomaterials. Oxygen vacancies could be formed during the transformation of Ce4+ into Ce3+ by the following defect reaction: OOX↔VO`` + 2e + 1 2 O(g), where OOX, VO``, and e are oxide ions in the lattice, doubly charged oxygen vacancies, and electrons in the conduction band made up of Ce 4f energy states, respectively [41]. It indicates the presence of oxygen vacancies on the surface of CeO2 nanomaterials. Oxygen vacancies can play a critical role in the redox mechanism and oxygen migration toward the surface of CeO2 nanomaterials. According to the previously reported methods [35,42], Ce 3d spectra of the samples were fitted to calculate the content of Ce3+ (Table 2). Based on the fitted result, the content of Ce3+ in nanorods was higher than those in the irregular nanoparticles and nanocubes. Such a result may be due to the different oxygen vacancy formation energy at different exposed crystal planes for CeO2 with different morphologies [43]. The O1s spectra of the as-prepared CeO2 nanomaterials could be deconvoluted into two different peaks [44] as shown in Figure 5. The binding energy peak located at 528.5 eV–529.5 eV (labeled as Oα) was attributed to superficial lattice oxygen. The peak located at 530 eV–531.5 eV (labeled as Oβ) is assigned to oxygen vacancies, surface adsorbed O2−/O, surface adsorbed O2, hydroxyl groups, and carbonates. The ratios of Oα and Oβ were calculated based on the area of the deconvoluted peaks. As shown in Table 2, the Oα/Oall and Oβ/Oall of all five samples were different, which may be due to the various surface structures of CeO2 materials.
To investigate the presence of oxygen vacancy, Raman spectroscopy was performed for all samples. As shown in Figure 6, a strong band located around 460 cm−1 could be detected, which can be attributed to the symmetric stretch F2g mode of CeO2. Furthermore, the broad peak located at about 600 cm−1 (inset of Figure 6) was attributed to the defect-induced (D) mode due to the oxygen vacancy [35,45]. The intensity ratio of the two peaks located at 600 cm−1 and 460 cm−1 (I600/I460) can be used to quantify the relative concentration of oxygen vacancy (Table 2). In Table 2, CeO2 nanorods exhibited the highest oxygen vacancy concentration among all three morphologies. The content of Ce in different CeO2 nanomaterials was obtained by ICP-OES as shown in Table 1. This result indicates that the content of Ce in each CeO2 nanomaterial is less than the theoretical calculation of Ce. The variation trend of the calculated value obtained after multiplying the ratio of Ce3+ by the content of Ce was consistent with that of I600/I460, although the distribution of Ce elements on the surface may be different from the ICP data.

3.2. Catalytic Performance Testing

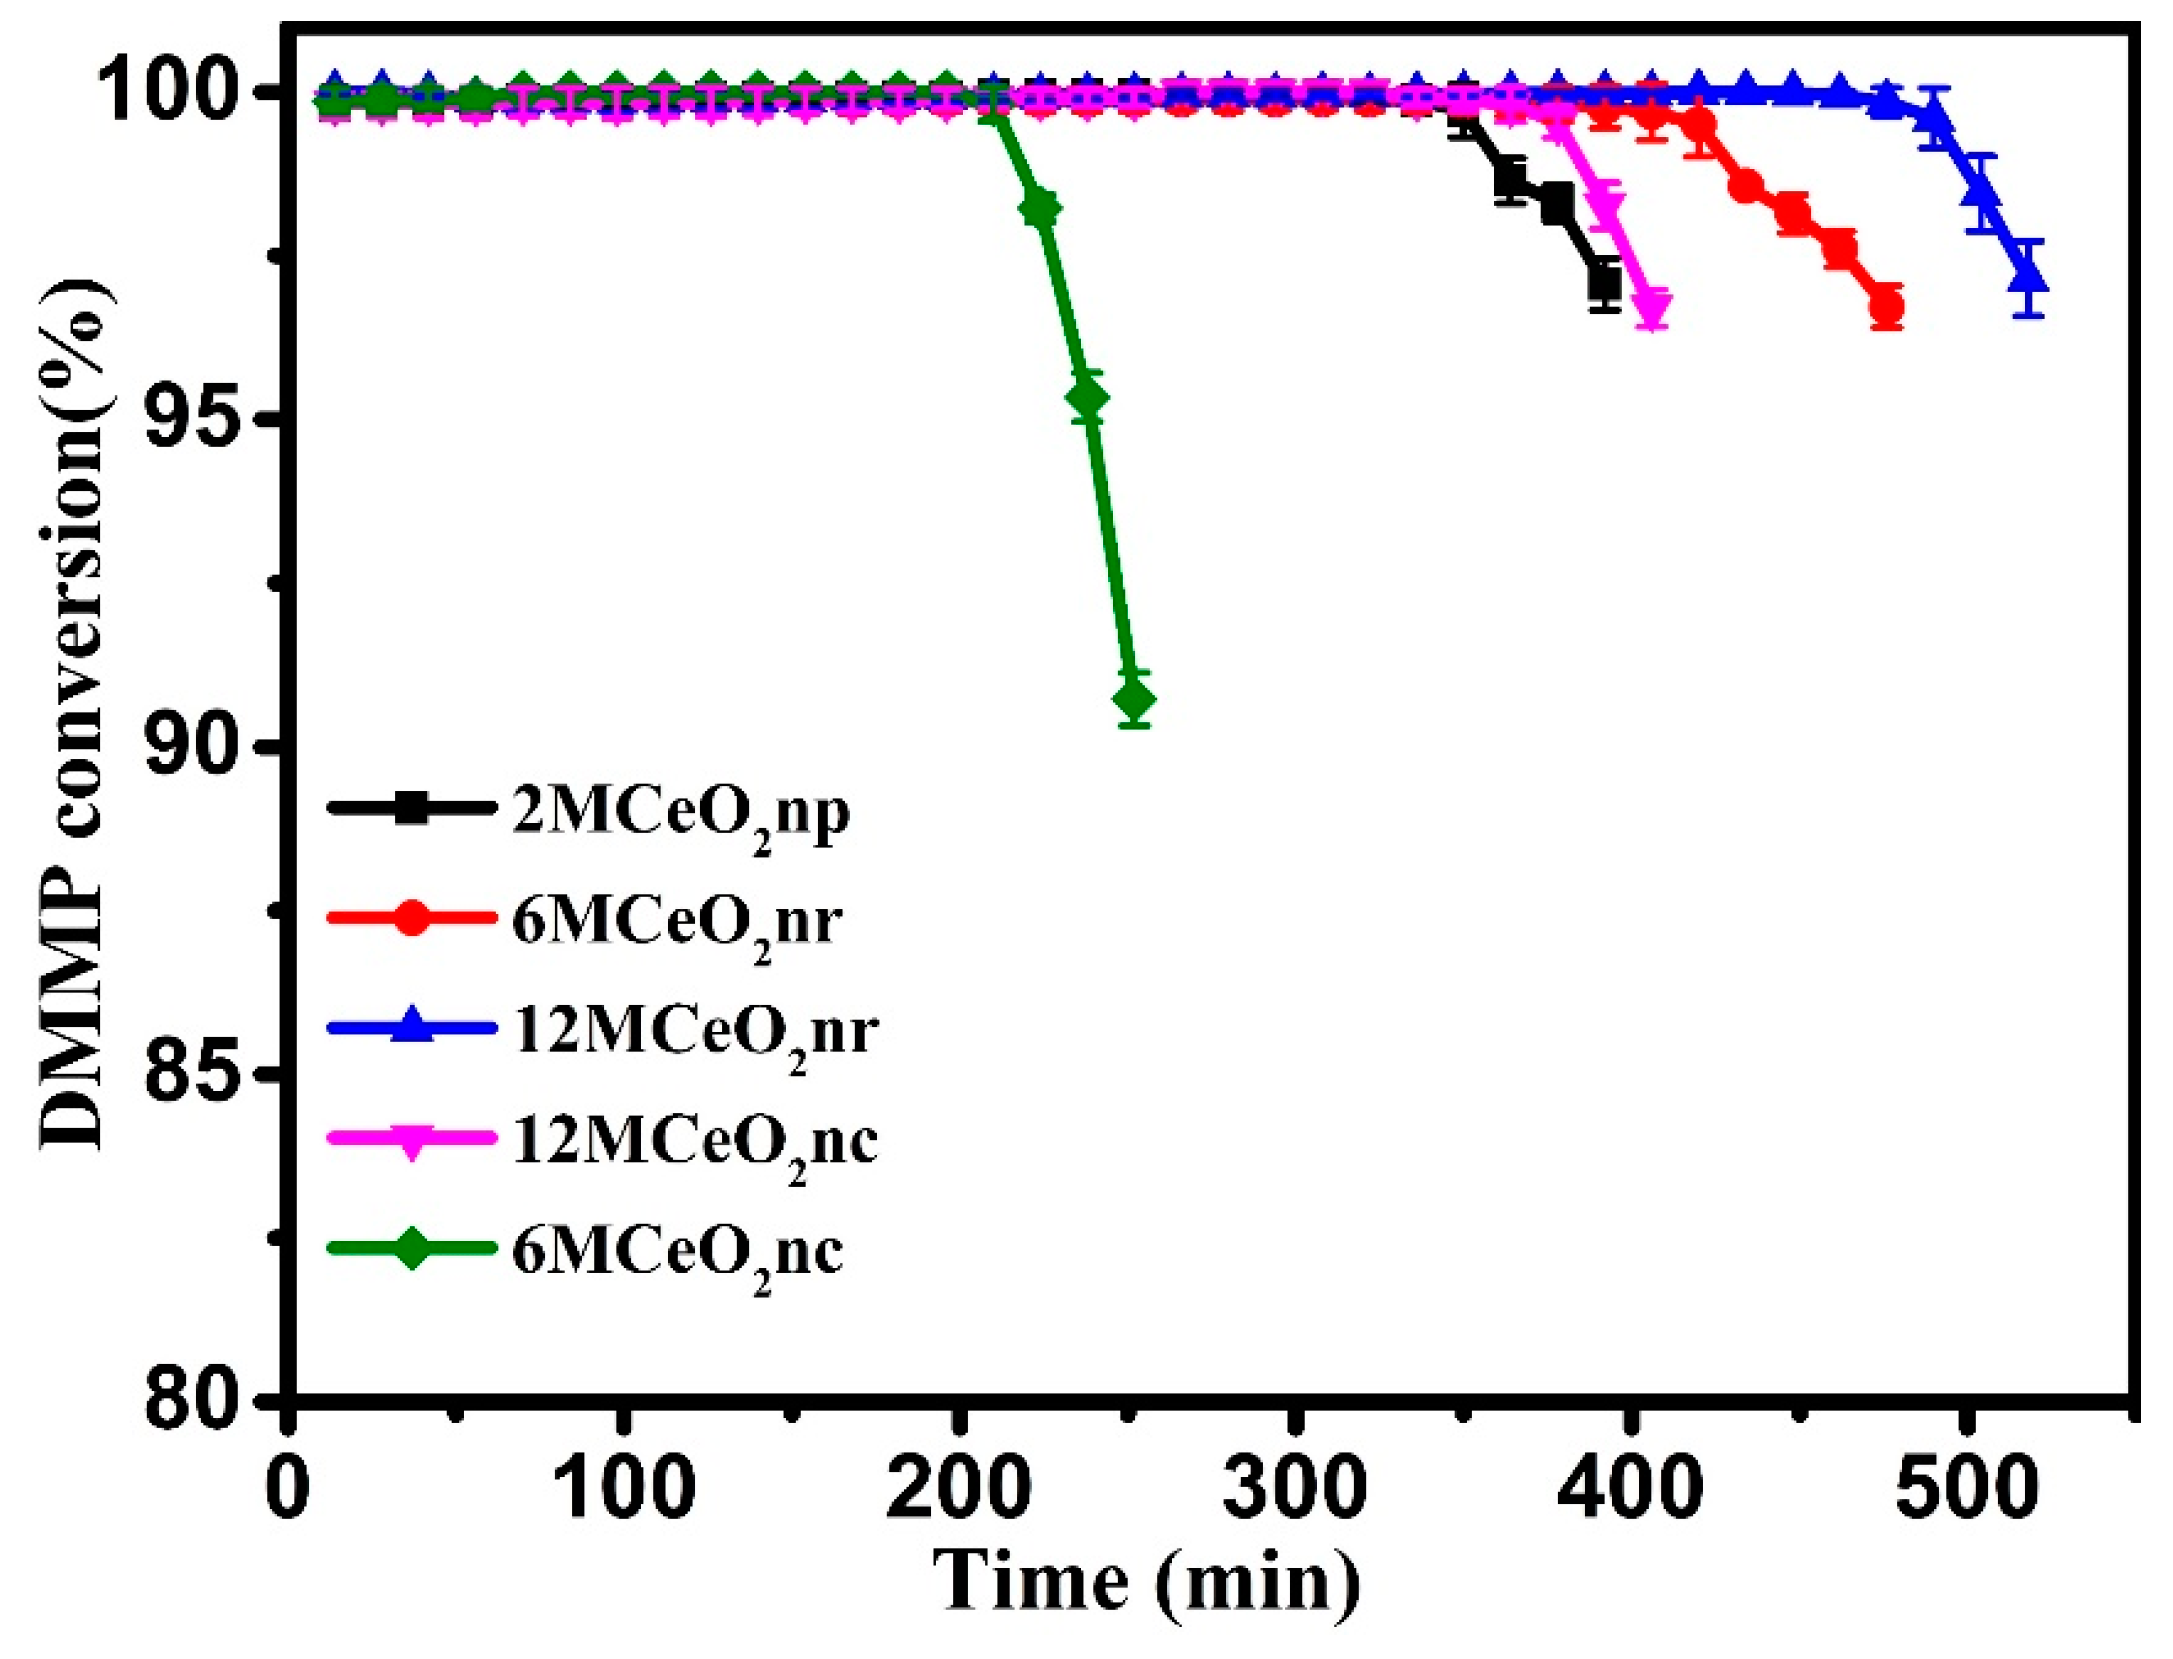
In order to evaluate the performance of a catalyst, the protection time is a crucial fac-tor [13]. Figure 7 shows the protection times of various CeO2 catalysts, and no distinct regularity in the protection time for samples with different morphologies was observed. This result may be due to the difference in the filling weight for CeO2 nanomaterials with different morphologies to achieve the same bed volume. Therefore, in order to avoid the influence of catalyst loading quantity on the protection time, the mass specific treatment capacity (MSTC) of the catalyst towards DMMP was calculated and shown in Table 2. Based on the result, the MSTCs of catalysts can be arranged in the following order; 12MCeO2nr (0.310 gDMMP/gcat) > 6MCeO2nr (0.266 gDMMP/gcat) > 2MCeO2np (0.222 gDMMP/gcat) > 12MCeO2nc (0.152 gDMMP/gcat) > 6MCeO2nc (0.085 gDMMP/gcat). As such, according to the trend, CeO2 nanorods exhibited superior MSTC as compared to the irregular nanoparticles and nanocubes. Furthermore, the surface area specific treatment capacity (SSTC) of the catalyst towards DMMP was also calculated and the corresponding results are summarized in Table 2. Interestingly, the SSTC of CeO2 nanocubes was higher than those of CeO2 nanorods and irregular nanoparticles. This result is due to the extremely low specific surface area of CeO2 nanocubes as compared to the other two morphologies. When comparing CeO2 nanomaterials with the same morphology, 12MCeO2nr and 12MCeO2nc with larger crystal sizes possessed larger MSTC and SSTC. Thus, based on these results, the morphology and crystal size of CeO2 can significantly affect its catalytic performance. Table 3 provided a brief summary of the protection times for various catalysts reported in the literature.

3.3. Reaction Mechanism for Thermocatalytic Decomposition of DMMP

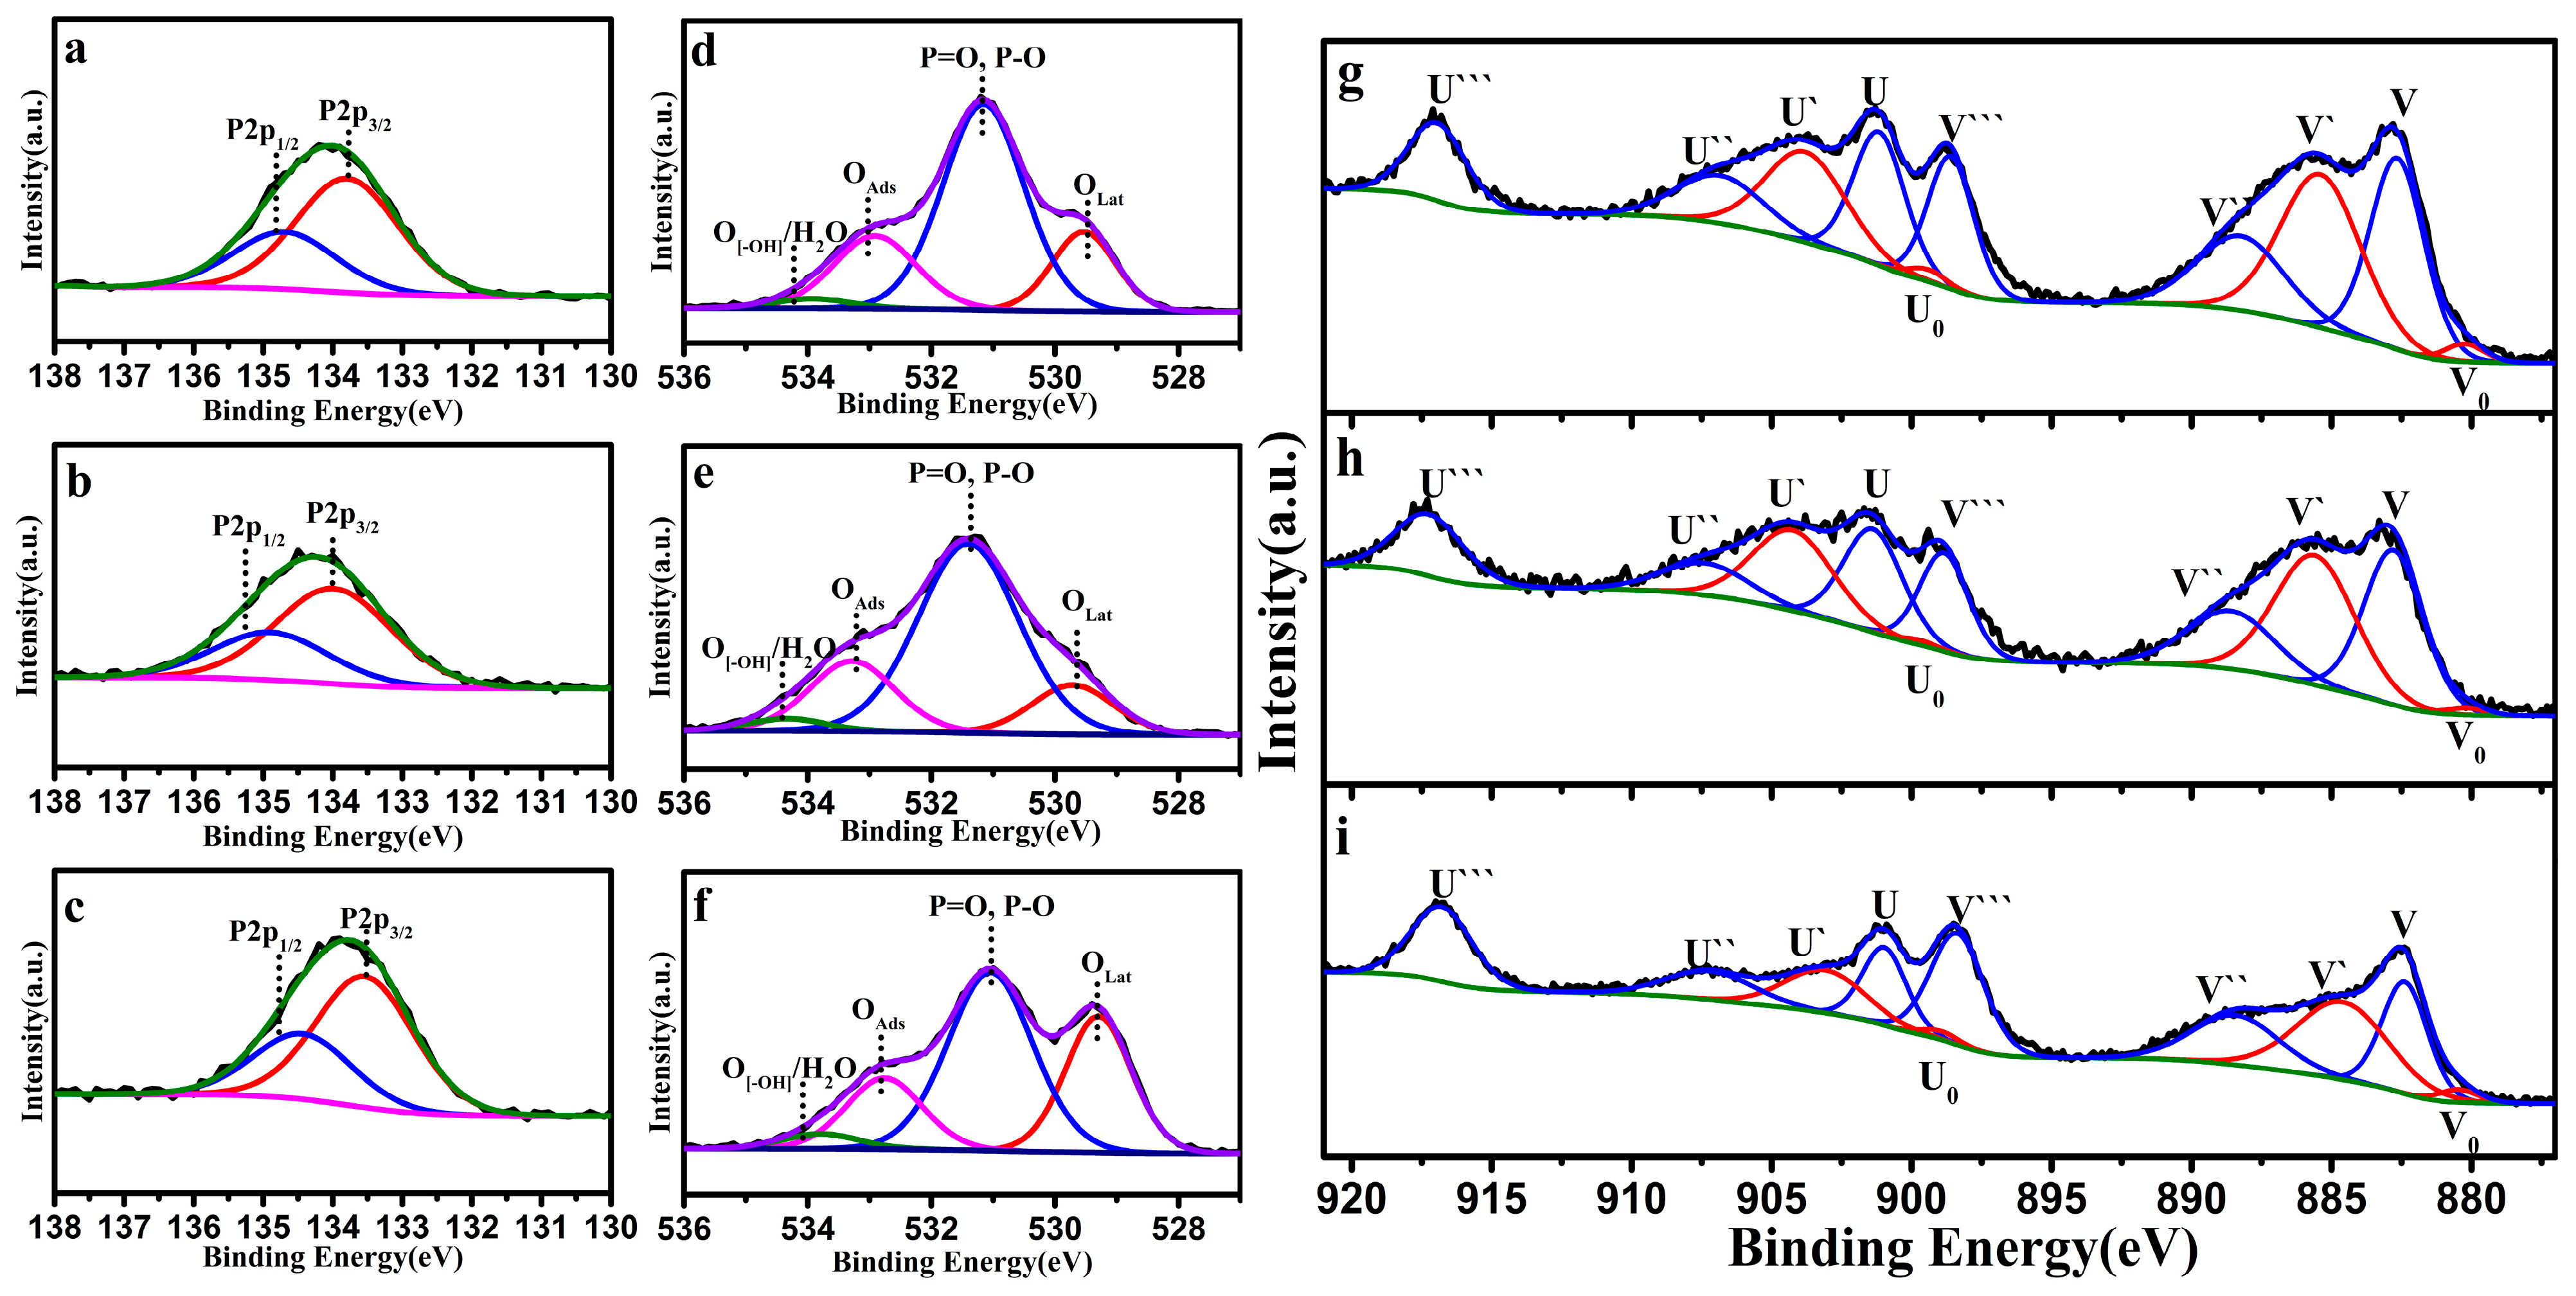
12MCeO2nr and 12MCeO2nc with superior catalytic performances and 2MCeO2np were selected for the study on the mechanism of thermocatalytic decomposition of DMMP. After the protection tests, the severely deactivated catalyst collected at the front end of the bed was analyzed using XPS in Figure 8. Based on Figure 8a–c, distinct P2p peaks were observed for all samples, which suggests that the surface of CeO2 is covered by phosphorus species. The O1s spectra presented in Figure 8d–f could be deconvoluted into four peaks, i.e., surface lattice oxygen (OLat), phosphorus oxygen, adsorbed oxygen (OAds), and adsorbed water/hydroxyl oxygen [50].
The presence of phosphorus oxygen species further indicates the accumulation of P-containing byproducts on the surface of CeO2, which essentially suppress the decomposition of DMMP. Meanwhile, the Ce3+ content in the sample after the reaction was also calculated from the fitted XPS spectra (Figure 8g–i). Variation of Ce3+ content in clean and deactivated catalysts are summarized in Table 4. Ce3+ content in the spent sample as compared to that in the unused sample (ΔCe3+) increased obviously (Table 4). Combined with the mechanism analysis of CeO2 in the reaction pathway inference (Scheme 1), the surface oxygen of CeO2 participates in the catalytic DMMP decomposition reaction, and the lattice oxygen migrates onto the surface, causing the formation of oxygen vacancies, and extra electrons are transferred to Ce4+, eventually, Ce4+ cations are reduced to Ce3+. However, the accumulation of the byproducts on the surface of the catalyst can inhibit the replenishment of external oxygen into the CeO2 lattice, and Ce3+ could not be oxidized to Ce4+, this will increase the Ce3+ content. Therefore, it is speculated that the change in Ce3+ content may be related with the life of the catalysts (protection time). As such, the variation of Ce3+ content before and after catalytic decomposition reaction per unit protection time (ΔCe3+/Time) of three catalyst materials was calculated (Table 4). Based on the result, the ΔCe3+/Time value was inversely proportional to the protection time, which further confirms our previous speculation. Among all samples, 12MCeO2nr possessed the smallest ΔCe3+/Time and the longest protection time, which indicates its superior catalytic performance.
Ion chromatography is used to qualitative analysis of P-containing byproducts on the surface of the spent CeO2 catalysts and the colorless gelatinous species at the end of the catalytic reaction tube. The results of ion chromatograph indicate the presence of PO43− at both sites as shown in Table 5. Therefore, the byproduct on the surface of CeO2 is CePO4. The colorless gelatinous PO43−-containing species is soluble in water, so it is not CePO4. We speculate the colorless gelatinous species is H3PO4. For the reason that the boiling point of H3PO4 is lower than the catalytic reaction temperature, the weak adsorption of H3PO4 on the catalyst results in the desorption of H3PO4 from the catalyst bed by air flow. H3PO4 should form steam getting into the air; on the contrary, it was found on the wall at the end of the reaction tube. This phenomenon occurs because the catalytic reaction tube has a constant temperature zone, where the catalyst bed is in, and the temperature at the end of the reaction tube is lower than that in the constant temperature zone, so H3PO4 steam was condensed on the tube wall.
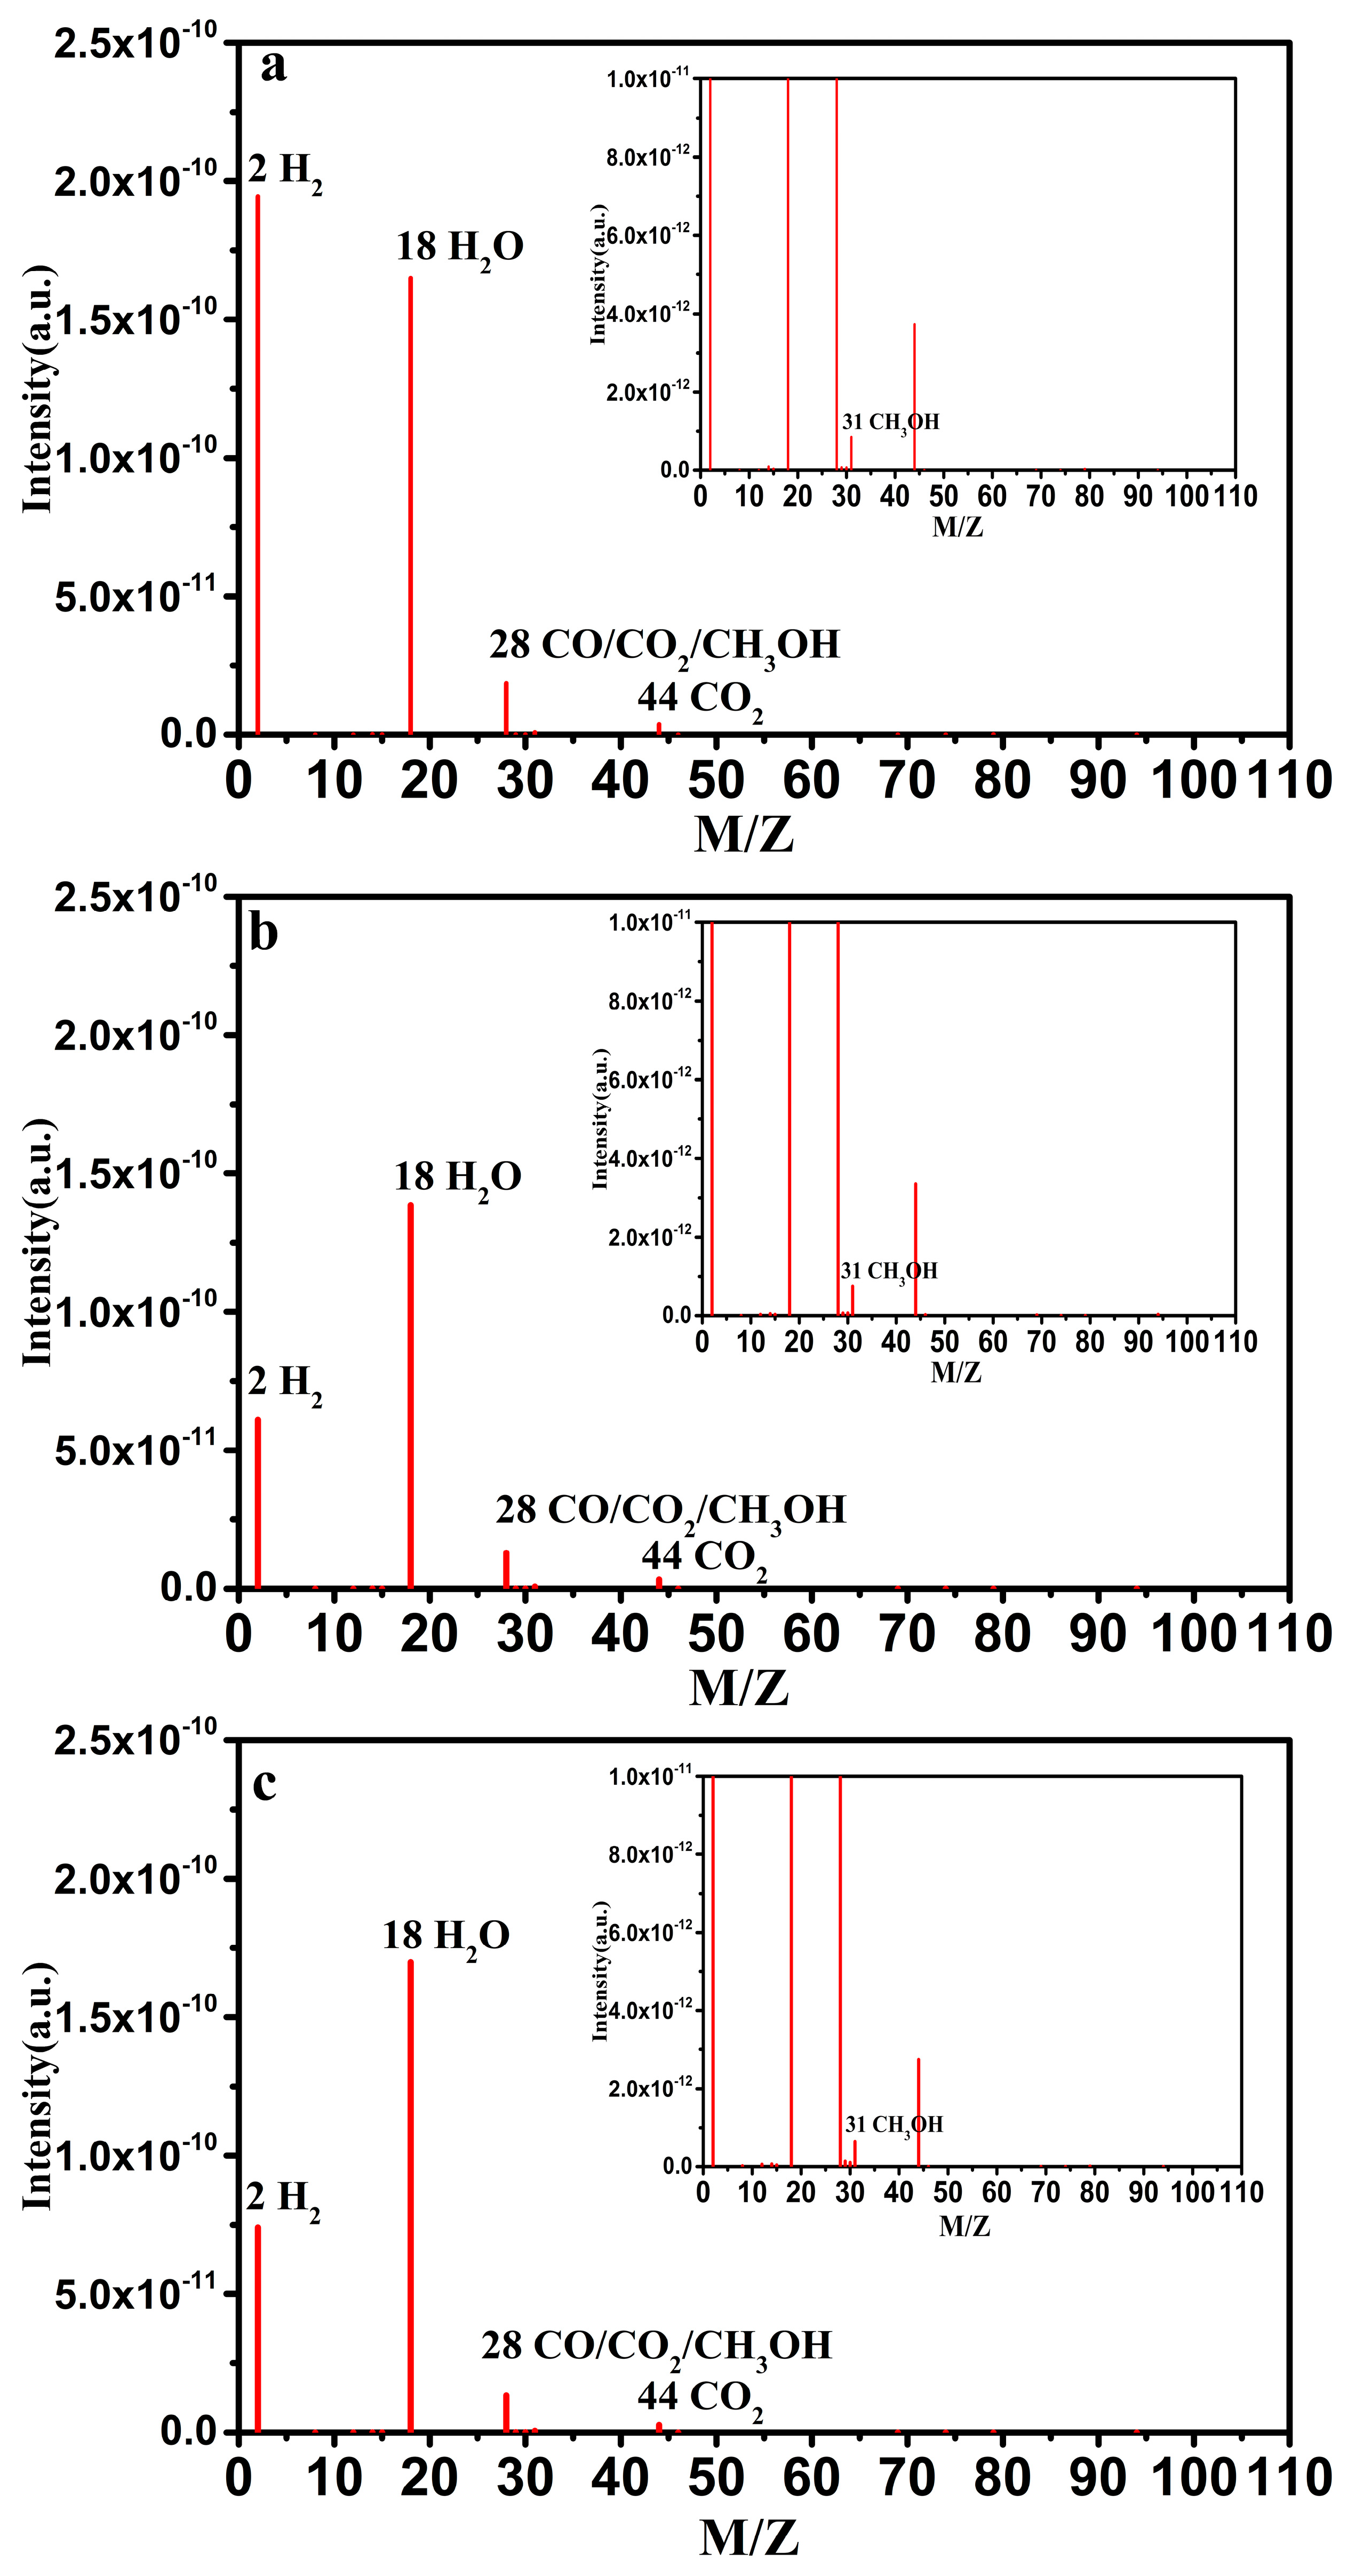
The tail gas produced during the catalytic decomposition of DMMP on 2MCeO2np, 12MCeO2nr, and 12MCeO2nc were qualitatively analyzed by mass spectrometry to determine its components. The mass spectra of the tail gas produced by 2MCeO2np, 12MCeO2nr, and 12MCeO2nc are displayed in Figure 9. According to the results, signals belonging to methanol, CO2, H2O, and H2 were observed. Moreover, the mass-to-charge ratio of CO was also 28 in addition to the fragment signals of methanol and CO2. As such, gas chromatography was employed to confirm the presence of CO in the produced tail gas.
The variations in the surface species were identified by employing time-resolved in situ DRIFTS over 2MCeO2np, 12MCeO2nr, and 12MCeO2nc at 300 °C (Figure 10). The corresponding functional groups in accordance with the literature [51,52] are shown in Table 6 and Table 7. According to Figure 10, the peaks from 3500 cm−1 to 3800 cm−1, could be associated with the vibration mode of the surface hydroxyl on CeO2 [53,54]. With longer reaction durations, the vibration intensity of partial surface hydroxyl increased negatively, which indicates the participation of surface hydroxyl during the decomposition of DMMP. The disappearance of ν(P−O) vibrational modes, i.e., 821 cm−1 and 788 cm−1, and ν(P−C) vibrational mode, i.e., 713 cm−1, implies the removal of −OCH3 and −CH3 groups from the DMMP molecule. The νa(O−CH3), δa(O−CH3), ρ‖(O−CH3), νa(C−O), νs(C−O), νa(P−CH3), and ρ‖(P−CH3) vibration modes that are ascribed to −OCH3 and P−CH3 groups disappeared. However, with prolonged testing duration, the peaks belonging to νs(P−CH3), νs(O−CH3), and δs(P−CH3) still exist and are inferred to be the peaks of intermediate products. The peak at 2813 cm−1 could be assigned to ν(Ce−O−CH3). As Morris et al. reported, due to the P−OCH3 cleavage, −OCH3 combined with Ti ion to form surface methoxy. Compared to DMMP, the vibrational peak of surface methoxy will shift to a lower frequency [55]. It is worth noting that the intense peak belonging to ν(P=O) at 1257 cm−1 vibrational mode shifted to 1262 cm−1, 1279 cm−1, and 1272 cm−1 for CeO2np, CeO2nr, and CeO2nc, respectively. This observation indicates that the DMMP chemisorbed to the Lewis acid sites of CeO2, and/or bonded with the surface hydroxyl group of CeO2 via H bond [32,52]. New distinct peaks located at 1208–1050 could be detected, which corresponds to P−O stretching in POx [32,55]; 2716 cm−1 and 1365 cm−1 belong to 2δ(C−H) and δ(C−H) of bidentate formate [54]; 1615 cm−1 and 1620 cm−1 belong to νa(OCO) in monodentate formate bonded with Ce3+; 1535 cm−1 belongs to νa(OCO) of bidentate formate bonded with Ce4+ [56] (Figure 10a,b). Moreover, 1396 cm−1 and 1294 cm−1 that belong to ν(CO3) in monodentate and bidentate carbonate could be detected, respectively (Figure 10a) [57]. In Figure 10b,c, δs(P−CH3) vibration mode of products coincided with that of ν(CO3) in bridged carbonate at 1318 cm−1 [57], indicating that bridged carbonate may exist on the surface of CeO2nr and CeO2nc. In addition, 1236 cm−1 that belongs to ν(CO3) of bridged carbonate could be detected (Figure 10c) [57]. According to the above in situ DRIFTS analysis, the difference of surface products between the three morphologies lies in the carbon containing byproducts. Monodentate formate, bidentate formate, monodentate carbonate, and bidentate carbonate were observed on 2MCeO2np. Monodentate formate and possibly bridged carbonate are considered to be the main carbon-containing byproducts of 12MCeO2nr. The main carbon-containing byproduct on 12MCeO2nc was bridged carbonate. The accumulation of phosphate, formate, and carbonate species causes the masking of the active site, which ultimately deactivates the catalyst.
Based on the mass spectroscopy, ion chromatography, and in situ DRIFTS studies, the catalytic decomposition of DMMP pathways based on 2MCeO2np, 12MCeO2nr, and 12MCeO2nc are proposed. The 3D model schematics of CeO2np, CeO2nr, and CeO2np were depicted based on different morphologically exposed crystal plane [58]. From the in situ DRIFTS analysis, the main reaction pathways based on the CeO2 samples with three different morphologies are the same (Scheme 1Ⅰ). Firstly, the electron-rich P=O in DMMP adsorbs onto the Lewis acid active site of CeO2, and/or bonded with the surface hydroxyl group of CeO2 via H bond [33,59]. Then, the surface hydroxyl group provides the nucleophilic attack to the phosphorus, and the methoxy group combines with the surface hydrogen to produce gaseous methanol. Cerium methyl phosphate is then formed by further losing the methoxy group (Scheme 1a) [15,17,22,32]. The scission of the P−CH3 bond through the surface lattice oxygen of the CeO2 nucleophilic attack leads to the formation of CePO4 and a transient methoxy intermediate that contains lattice oxygen (Scheme 1b). After sacrificing the C−H bond of the transient methoxy intermediate, CO and H2 are generated on the oxygen-deficient surface of CeO2 [60]. However, based on the tail gas analysis, the formation of CO, H2, CO2, and H2O were confirmed (Figure 9), which implies that a part of CO and H2 were oxidized to CO2 and H2O under an oxygenated environment. The methanol generated via the main reaction can continue to react with the surface lattice oxygen in CeO2, which produces a variety of products (Scheme 1Ⅱ–Ⅳ). Such a process is complex, and it is similar to the reports by Overbury and Foster group [54,56]. Combined with the different types of carbon containing byproducts via further methanol reaction, the side reaction pathways of 2MCeO2np, 12MCeO2nr, and 12MCeO2nc are different. According to Scheme 1Ⅱ, The lattice oxygen and methanol initially interact to produce an adsorbed methoxy and a hydroxyl group adsorbed on the surface (Scheme 1d) [54]. Then, the methoxyl group reacts with hydroxyl or surface lattice oxygen, whereby CO, H2, CO2, and H2O are formed during a complete dehydrogenation (Scheme 1e), while monodentate formates are formed during partial dehydrogenation (Scheme 1f) [54]. In addition, the methoxyl group reacts with hydroxyl and it dehydrates to form a bidentate coordinated methoxyl group (Scheme 1g) [56]. This is then further dehydrogenated by reacting with two adjacent hydroxyl groups to form a bidentate coordinated formate and hydroxyl group (Scheme 1h) [56]. Moreover, CO2 adsorption on surface oxygen could result in monodentate carbonate and bidentate carbonate (Scheme 1i) [57,61]. When compared to the side reaction pathway of 2MCeO2np (Scheme 1Ⅱ), the reactions of Scheme 1d–g on 12MCeO2nr (Scheme 1Ⅲ) are the same as that on 2MCeO2np. In addition, based on in situ DRIFTS analysis, the bridging carbonate may exist on 12MCeO2nr, which is formed via the complete dehydrogenation of the surface methyl group (Scheme 1j) [60]. Based on in situ DRIFTS analysis, no formate is formed on the surface of 12MCeO2nc, therefore, no reaction pathway of Scheme 1f occurred on 12MCeO2nc (Scheme 1Ⅳ); the other reaction pathways are the same as 12MCeO2nr. According to the proposed reaction path, surface oxygen (surface lattice oxygen or adsorbed oxygen) participates in the oxidative decomposition of DMMP. It is well known that CeO2 possesses an excellent oxygen storage and release capacity. In higher temperature reactions, the mechanism of CeO2 is primarily the Mars–van Krevelen mechanism [62]. Thus, when the surface oxygen is consumed, the bulk oxygen and the external oxygen (such as oxygen, water molecules) will replenish the oxygen vacancy for the next catalytic DMMP decomposition cycle (Scheme 1k) [53]. The catalyst will eventually become completely deactivated when the byproducts fully cover the active sites on its surface.

4. Conclusions

In this work, various CeO2 catalysts with three different morphologies, i.e., irregular nanoparticles, nanorods, and nanocubes, were synthesized via a modified preparation method, and they were investigated for their thermocatalytic performance in DMMP decomposition. Based on the results, the as-prepared CeO2 nanorods exhibited superior MSTC as compared to the irregular CeO2 nanoparticles and nanocubes. For the CeO2 nanomaterials with the same morphology, i.e., 12MCeO2nr and 6MCeO2nr, it is noted that 12MCeO2nr with larger crystal sizes exhibited higher protection time, MSTC, and SSTC than 6MCeO2nr with smaller crystal sizes. This same conclusion exists for CeO2 nanocubes. These results indicated that the morphologies and crystal sizes of the CeO2 nanomaterial could significantly affect the catalytic performance. The various CeO2 nanomaterials with different morphologies and particle sizes possessed different redox activity (H2−TPR), surface oxygen species (XPS), relative oxygen vacancy concentration (Raman), and the ability of the catalyst to resist poisoning. However, these properties did not show direct relationships with the catalytic performance of the material, which indicates that the catalytic performance of CeO2 nanomaterials is not only affected by a single factor, instead it may be a result of a set of factors, and it will be an interesting work in our future study. It is speculated that the change in the Ce3+ content before and after the protection test could be due to the poisoning of the catalyst, therefore affecting the protection time. Based on the storage and release characteristics of CeO2, the catalytic decomposition of DMMP was performed through the cyclic process that involved the consumption of surface lattice oxygen and adsorbed oxygen, and the timely replenishment of bulk and external oxygen. The main reaction path of the catalytic DMMP decomposition was similar for all three morphologies samples, the gas products were methanol, CO, H2, CO2, and H2O, and the surface byproduct was phosphates. However, during the side reaction that involved methanol, the reaction paths of three morphologies samples are different. On the surface of CeO2 irregular nanoparticles, carbonate and formate were produced, while formate and possibly carbonate were produced on the surface of CeO2 nanorods, only carbonate was formed on the surface CeO2 nanocubes. The CeO2 catalyst was inactivated due to the accumulation of phosphorus oxygen species and carbon oxygen species on the surface of CeO2. Thus, based on the collective results, a basic understanding of the catalytic DMMP decomposition based on CeO2 with different morphologies was attained, and this understanding will contribute to the future design and preparation of high-performing catalysts for the degradation of chemical toxicants.

Author Contributions

W.K. completed the main experimental work and wrote the initial draft; K.W., X.W. and Q.H. assisted in data collection; S.Z., P.Y. and Y.D. provided evolution of overarching research goals and revised pre-publication stages as the corresponding author. All authors have read and agreed to the published version of the manuscript.

Funding

This work was financially supported by the National Natural Science Foundation of China (No. 21701186) and the Fundamental Research Funds from State Key Laboratory of NBC Protection for Civilian (SKLNBC 2019−04), China.

Informed Consent Statement

Not applicable.

Data Availability Statement

Not applicable.

Conflicts of Interest

The authors declare no conflict of interest.

References

  1. Jang, Y.J.; Kim, K.; Tsay, O.G.; Atwood, D.A.; Churchill, D.G. Update 1 of: Destruction and Detection of Chemical Warfare Agents. Chem. Rev. 2015, 115, PR1-76. [Google Scholar] [CrossRef] [PubMed]
  2. Council, N.R. Review and Evaluation of Alternative Chemical Disposal Technologies; National Academy Press: Washington, DC, USA, 1996. [Google Scholar]
  3. Farquharson, S.; Inscore, F.E.; Christesen, S. Detecting Chemical Agents and Their Hydrolysis Products in Water. Surf. Enhanc. Raman Scatt. Phys. Appl. 2006, 103, 447–460. [Google Scholar] [CrossRef]
  4. Gustafson, R.L.; Martell, A.E. A Kinetic Study of the Copper(II) Chelate-catalyzed Hydrolysis of Isopropyl Methylphosphon-ofluoridate (Sarin). J. Am. Chem. Soc. 1962, 84, 2309–2316. [Google Scholar] [CrossRef]
  5. Ward, J.R.; Yang, Y.-C.; Wilson, R.B.; Burrows, W.D.; Ackerman, L.L. Base-catalyzed hydrolysis of 1,2,2-trimethylpropyl methylphosphonofluoridate—An examination of the saturation effect. Bioorg. Chem. 1988, 16, 12–16. [Google Scholar] [CrossRef]
  6. Yang, Y.C.; Baker, J.A.; Ward, J.R. Decontamination of chemical warfare agents. Chem. Rev. 1992, 92, 1729–1743. [Google Scholar] [CrossRef]
  7. Yang, Y.-C. Chemical Detoxification of Nerve Agent VX. Acc. Chem. Res. 1998, 32, 109–115. [Google Scholar] [CrossRef]
  8. Li, Y.X.; Schlup, J.R.; Klabunde, K.J. Fourier transform infrared photoacoustic spectroscopy study of the adsorption of or-ganophosphorus compounds on heat-treated magnesium oxide. Langmuir 1991, 7, 1394–1399. [Google Scholar] [CrossRef]
  9. Lin, S.T.; Klabunde, K.J. Thermally activated magnesium oxide surface chemistry. Adsorption and decomposition of phosphorus compounds. Langmuir 1985, 1, 600–605. [Google Scholar] [CrossRef]
  10. Nakamura, M.; Shi, M.; Okamoto, Y.; Takamuku, S. Photolysis of bis(methoxyphenyl) methylphosphonates. J. Photochem. Photobiol. A Chem. 1995, 85, 111–118. [Google Scholar] [CrossRef]
  11. O’Shea, K.E.; Beightol, S.; Garcia, I.; Aguilar, M.; Kalen, D.V.; Cooper, W.J. Photocatalytic decomposition of organophospho-nates in irradiated TiO2 suspensions. J. Photochem. Photobiol. A Chem. 1997, 107, 221–226. [Google Scholar] [CrossRef]
  12. Segal, S.R.; Suib, S.L.; Tang, X.; Satyapal, S. Photoassisted Decomposition of Dimethyl Methylphosphonate over Amorphous Manganese Oxide Catalysts. Chem. Mater. 1999, 11, 1687–1695. [Google Scholar] [CrossRef]
  13. Cao, L.; Segal, S.R.; Suib, S.L.; Tang, X.; Satyapal, S. Thermocatalytic Oxidation of Dimethyl Methylphosphonate on Supported Metal Oxides. J. Catal. 2000, 194, 61–70. [Google Scholar] [CrossRef]
  14. Segal, S.R.; Cao, L.; Suib, S.L.; Tang, X.; Satyapal, S. Thermal Decomposition of Dimethyl Methylphosphonate over Manganese Oxide Catalysts. J. Catal. 2001, 198, 66–76. [Google Scholar] [CrossRef]
  15. Wang, L.; Denchy, M.; Blando, N.; Hansen, L.; Bilik, B.; Tang, X.; Hicks, Z.; Bowen, K.H. Thermal Decomposition of Dimethyl Methylphosphonate on Size-Selected Clusters: A Comparative Study between Copper Metal and Cupric Oxide Clusters. J. Phys. Chem. C 2021, 125, 11348–11358. [Google Scholar] [CrossRef]
  16. Walenta, C.A.; Xu, F.; Tesvara, C.; O’Connor, C.R.; Sautet, P.; Friend, C.M. Facile Decomposition of Organophosphonates by Dual Lewis Sites on a Fe3O4(111) Film. J. Phys. Chem. C 2020, 124, 12432–12441. [Google Scholar] [CrossRef]
  17. Mukhopadhyay, S.; Schoenitz, M.; Dreizin, E.L. Vapor-phase decomposition of dimethyl methylphosphonate (DMMP), a sarin surrogate, in presence of metal oxides. Def. Technol. 2020, 17, 1095–1114. [Google Scholar] [CrossRef]
  18. Sheinker, V.N.; Mitchell, M.B. Quantitative Study of the Decomposition of Dimethyl Methylphosphonate (DMMP) on Metal Oxides at Room Temperature and Above. Chem. Mater. 2002, 14, 1257–1268. [Google Scholar] [CrossRef]
  19. Zhanpeisov, N.U.; Zhidomirov, G.M.; Yudanov, I.V.; Klabunde, K.J. Cluster Quantum Chemical Study of the Interaction of Dimethyl Methylphosphonate with Magnesium Oxide. J. Phys. Chem. 1994, 98, 10032–10035. [Google Scholar] [CrossRef]
  20. Holdren, S.; Tsyshevsky, R.; Fears, K.; Owrutsky, J.; Wu, T.; Wang, X.; Eichhorn, B.W.; Kuklja, M.M.; Zachariah, M.R. Adsorption and Destruction of the G-Series Nerve Agent Simulant Dimethyl Methylphosphonate on Zinc Oxide. ACS Catal. 2018, 9, 902–911. [Google Scholar] [CrossRef]
  21. Gordon, W.O.; Tissue, B.M.; Morris, J.R. Adsorption and decomposition of dimethyl methylphosphonate on Y2O3 nano-particles. J. Phys. Chem. C 2007, 111, 3233–3240. [Google Scholar] [CrossRef]
  22. Mitchell, M.B.; Sheinker, V.N.; Mintz, E.A. Adsorption and Decomposition of Dimethyl Methylphosphonate on Metal Oxides. J. Phys. Chem. B 1997, 101, 11192–11203. [Google Scholar] [CrossRef]
  23. Trotochaud, L.; Head, A.R.; Büchner, C.; Yu, Y.; Karslıoğlu, O.; Tsyshevsky, R.; Holdren, S.; Eichhorn, B.; Kuklja, M.M.; Bluhm, H. Room temperature decomposition of dimethyl methylphosphonate on cuprous oxide yields atomic phosphorus. Surf. Sci. 2019, 680, 75–87. [Google Scholar] [CrossRef]
  24. Montini, T.; Melchionna, M.; Monai, M.; Fornasiero, P. Fundamentals and Catalytic Applications of CeO2-Based Materials. Chem. Rev. 2016, 116, 5987–6041. [Google Scholar] [CrossRef]
  25. Tuller, H. Ionic conduction in nanocrystalline materials. Solid State Ionics 2000, 131, 143–157. [Google Scholar] [CrossRef] [Green Version]
  26. Powell, B.R.; Bloink, R.L.; Eickel, C.C. Preparation of Cerium Dioxide Powders for Catalyst Supports. J. Am. Ceram. Soc. 1988, 71, C-104. [Google Scholar] [CrossRef]
  27. Fu, Q.; Saltsburg, H.; Flytzani-Stephanopoulos, M. Active Nonmetallic Au and Pt Species on Ceria-Based Water-Gas Shift Catalysts. Science 2003, 301, 935–938. [Google Scholar] [CrossRef] [PubMed]
  28. Jasinski, P.; Suzuki, T.; Anderson, H.U. Nanocrystalline undoped ceria oxygen sensor. Sens. Actuators B Chem. 2003, 95, 73–77. [Google Scholar] [CrossRef]
  29. Si, R.; Zhang, Y.-W.; Li, S.-J.; Lin, B.-X.; Yan, C.-H. Urea-Based Hydrothermally Derived Homogeneous Nanostructured Ce1−xZrxO2 (x = 0–0.8) Solid Solutions:  A Strong Correlation between Oxygen Storage Capacity and Lattice Strain. J. Phys. Chem. B 2004, 108, 12481–12488. [Google Scholar] [CrossRef]
  30. Mitchell, M.B.; Sheinker, V.N.; Tesfamichael, A.B.; Gatimu, E.N.; Nunley, M. Decomposition of Dimethyl Methylphosphonate (DMMP) on Supported Cerium and Iron Co-Impregnated Oxides at Room Temperature. J. Phys. Chem. B 2002, 107, 580–586. [Google Scholar] [CrossRef]
  31. Mitchell, M.B.; Sheinker, V.N.; Cox, W.W.; Gatimu, E.N.; Tesfamichael, A.B. The Room Temperature Decomposition Mechanism of Dimethyl Methylphosphonate (DMMP) on Alumina-Supported Cerium Oxide − Participation of Nano-Sized Cerium Oxide Domains. J. Phys. Chem. B 2004, 108, 1634–1645. [Google Scholar] [CrossRef]
  32. Chen, D.A.; Ratliff, J.S.; Hu, X.; Gordon, W.O.; Senanayake, S.D.; Mullins, D.R. Dimethyl methylphosphonate decomposition on fully oxidized and partially reduced ceria thin films. Surf. Sci. 2010, 604, 574–587. [Google Scholar] [CrossRef]
  33. Li, T.; Tsyshevsky, R.; Algrim, L.; McEntee, M.; Durke, E.M.; Eichhorn, B.; Karwacki, C.; Zachariah, M.R.; Kuklja, M.M.; Rodriguez, E.E. Understanding Dimethyl Methylphosphonate Adsorption and Decomposition on Mesoporous CeO2. ACS Appl. Mater. Interfaces 2021, 13, 54597–54609. [Google Scholar] [CrossRef]
  34. Qiao, Z.-A.; Wu, Z.; Dai, S. Shape-Controlled Ceria-based Nanostructures for Catalysis Applications. Chemsuschem 2013, 6, 1821–1833. [Google Scholar] [CrossRef]
  35. López, J.M.; Gilbank, A.L.; García, T.; Solsona, B.; Agouram, S.; Torrente-Murciano, L. The prevalence of surface oxygen vacancies over the mobility of bulk oxygen in nanostructured ceria for the total toluene oxidation. Appl. Catal. B Environ. 2015, 174–175, 403–412. [Google Scholar] [CrossRef] [Green Version]
  36. Torrente-Murciano, L.; Gilbank, A.; Puertolas, B.; Garcia, T.; Solsona, B.; Chadwick, D. Shape-dependency activity of nanostructured CeO2 in the total oxidation of polycyclic aromatic hydrocarbons. Appl. Catal. B Environ. 2013, 132–133, 116–122. [Google Scholar] [CrossRef] [Green Version]
  37. Arul, N.S.; Mangalaraj, D.; Chen, P.C.; Ponpandian, N.; Viswanathan, C. Strong quantum confinement effect in nano-crystalline cerium oxide. Mater. Lett. 2011, 65, 2635–2638. [Google Scholar] [CrossRef]
  38. Pouretedal, H.; Kadkhodaie, A. Synthetic CeO2 Nanoparticle Catalysis of Methylene Blue Photodegradation: Kinetics and Mechanism. Chin. J. Catal. 2010, 31, 1328–1334. [Google Scholar] [CrossRef]
  39. Mai, H.-X.; Sun, L.-D.; Zhang, Y.-W.; Si, R.; Feng, W.; Zhang, H.-P.; Liu, H.-C.; Yan, C.-H. Shape-Selective Synthesis and Oxygen Storage Behavior of Ceria Nanopolyhedra, Nanorods, and Nanocubes. J. Phys. Chem. B 2005, 109, 24380–24385. [Google Scholar] [CrossRef]
  40. Xu, J.; Harmer, J.; Li, G.; Chapman, T.; Collier, P.; Longworth, S.; Tsang, S.C. Size dependent oxygen buffering capacity of ceria nanocrystals. Chem. Commun. 2010, 46, 1887–1889. [Google Scholar] [CrossRef]
  41. Zhang, D.; Du, X.; Shi, L.; Gao, R. Shape-controlled synthesis and catalytic application of ceria nanomaterials. Dalton Trans. 2012, 41, 14455–14475. [Google Scholar] [CrossRef] [PubMed]
  42. Zhang, Y.; Liang, L.; Chen, Z.; Wen, J.; Zhong, W.; Zou, S.; Fu, M.; Chen, L.; Ye, D. Highly efficient Cu/CeO2-hollow nanospheres catalyst for the reverse water-gas shift reaction: Investigation on the role of oxygen vacancies through in situ UV-Raman and DRIFTS. Appl. Surf. Sci. 2020, 516, 146035. [Google Scholar] [CrossRef]
  43. Trovarelli, A.; Llorca, J. Ceria Catalysts at Nanoscale: How Do Crystal Shapes Shape Catalysis? ACS Catal. 2017, 7, 4716–4735. [Google Scholar] [CrossRef]
  44. Liao, Y.; Fu, M.; Chen, L.; Wu, J.; Huang, B.; Ye, D. Catalytic oxidation of toluene over nanorod-structured Mn–Ce mixed oxides. Catal. Today 2013, 216, 220–228. [Google Scholar] [CrossRef]
  45. Popović, Z.V.; Dohčević-Mitrović, Z.; Konstantinović, M.J.; Šćepanović, M. Raman scattering characterization of na-nopowders and nanowires (rods). J. Raman Spectrosc. 2007, 38, 750–755. [Google Scholar] [CrossRef]
  46. Graven, W.M.; Weller, S.W.; Peters, D.L. Catalytic Conversion of Organophosphate Vapor over Platinum-Alumina. Ind. Eng. Chem. Process. Des. Dev. 1966, 5, 183–189. [Google Scholar] [CrossRef]
  47. Lee, K.; Houalla, M.; Hercules, D.; Hall, W. Catalytic Oxidative Decomposition of Dimethyl Methylphosphonate over Cu-Substituted Hydroxyapatite. J. Catal. 1994, 145, 223–231. [Google Scholar] [CrossRef]
  48. Gao, H.; Kong, W.; Zhou, S.; Wang, X.; He, Q.; Dong, Y. Thermal Catalytic Decomposition of Dimethyl Methyl Phosphonate Using CuO-CeO2/γ-Al2O3. Appl. Sci. 2022, 12, 10101. [Google Scholar] [CrossRef]
  49. Kong, W.; Zhou, S.; Wang, X.; He, Q.; Yang, P.; Yuan, Y.; Dong, Y. Catalytic Oxidative Decomposition of Dimethyl Methyl Phosphonate over CuO/CeO2 Catalysts Prepared Using a Secondary Alkaline Hydrothermal Method. Catalysts 2022, 12, 1277. [Google Scholar] [CrossRef]
  50. Wang, Y.; Xie, X.; Chen, X.; Huang, C.; Yang, S. Biochar-loaded Ce3+-enriched ultra-fine ceria nanoparticles for phosphate adsorption. J. Hazard. Mater. 2020, 396, 122626. [Google Scholar] [CrossRef]
  51. Moravie, R.M.; Froment, F.; Corset, J. Vibrational spectra and possible conformers of dimethylmethylphosphonate by normal mode analysis. Spectrochim. Acta Part A Mol. Spectrosc. 1989, 45A, 1015–1024. [Google Scholar] [CrossRef]
  52. Rusu, C.N.; Yates, J.J.T. Adsorption and Decomposition of Dimethyl Methylphosphonate on TiO2. J. Phys. Chem. B 2000, 104, 12292–12298. [Google Scholar] [CrossRef]
  53. Binet, C.; Daturi, M.; Lavalley, J.-C. IR study of polycrystalline ceria properties in oxidised and reduced states. Catal. Today 1999, 50, 207–225. [Google Scholar] [CrossRef]
  54. Wu, Z.; Li, M.; Mullins, D.R.; Overbury, S.H. Probing the Surface Sites of CeO2 Nanocrystals with Well-Defined Surface Planes via Methanol Adsorption and Desorption. ACS Catal. 2012, 2, 2224–2234. [Google Scholar] [CrossRef]
  55. Panayotov, D.A.; Morris, J.R. Thermal Decomposition of a Chemical Warfare Agent Simulant (DMMP) on TiO2: Adsorbate Reactions with Lattice Oxygen as Studied by Infrared Spectroscopy. J. Phys. Chem. C 2009, 113, 15684–15691. [Google Scholar] [CrossRef]
  56. Huttunen, P.K.; Labadini, D.; Hafiz, S.S.; Gokalp, S.; Wolff, E.P.; Martell, S.M.; Foster, M. DRIFTS investigation of methanol oxidation on CeO2 nanoparticles. Appl. Surf. Sci. 2021, 554, 149518. [Google Scholar] [CrossRef]
  57. Wu, Z.; Mann, A.K.P.; Li, M.; Overbury, S.H. Spectroscopic Investigation of Surface-Dependent Acid–Base Property of Ceria Nanoshapes. J. Phys. Chem. C 2015, 119, 7340–7350. [Google Scholar] [CrossRef]
  58. Wu, Q.; Zhang, F.; Xiao, P.; Tao, H.; Wang, X.; Hu, Z.; Lü, Y. Great Influence of Anions for Controllable Synthesis of CeO2 Nanostructures: From Nanorods to Nanocubes. J. Phys. Chem. C 2008, 112, 17076–17080. [Google Scholar] [CrossRef]
  59. Bermudez, V.M. Quantum-Chemical Study of the Adsorption of DMMP and Sarin on γ-Al2O3. J. Phys. Chem. C 2007, 111, 3719–3728. [Google Scholar] [CrossRef]
  60. Albrecht, P.M.; Mullins, D.R. Adsorption and reaction of methanol over CeO(X)(100) thin films. Langmuir 2013, 29, 4559–4567. [Google Scholar] [CrossRef] [PubMed]
  61. Vayssilov, G.N.; Mihaylov, M.; Petkov, P.S.; Hadjiivanov, K.I.; Neyman, K.M. Reassignment of the vibrational spectra of carbonates, formates, and related surface species on ceria: A combined density functional and infrared spectroscopy investigation. J. Phys. Chem. C 2011, 115, 23435–23454. [Google Scholar] [CrossRef]
  62. Mi, R.; Li, D.; Hu, Z.; Yang, R.T. Morphology Effects of CeO2 Nanomaterials on the Catalytic Combustion of Toluene: A Combined Kinetics and Diffuse Reflectance Infrared Fourier Transform Spectroscopy Study. ACS Catal. 2021, 11, 7876–7889. [Google Scholar] [CrossRef]
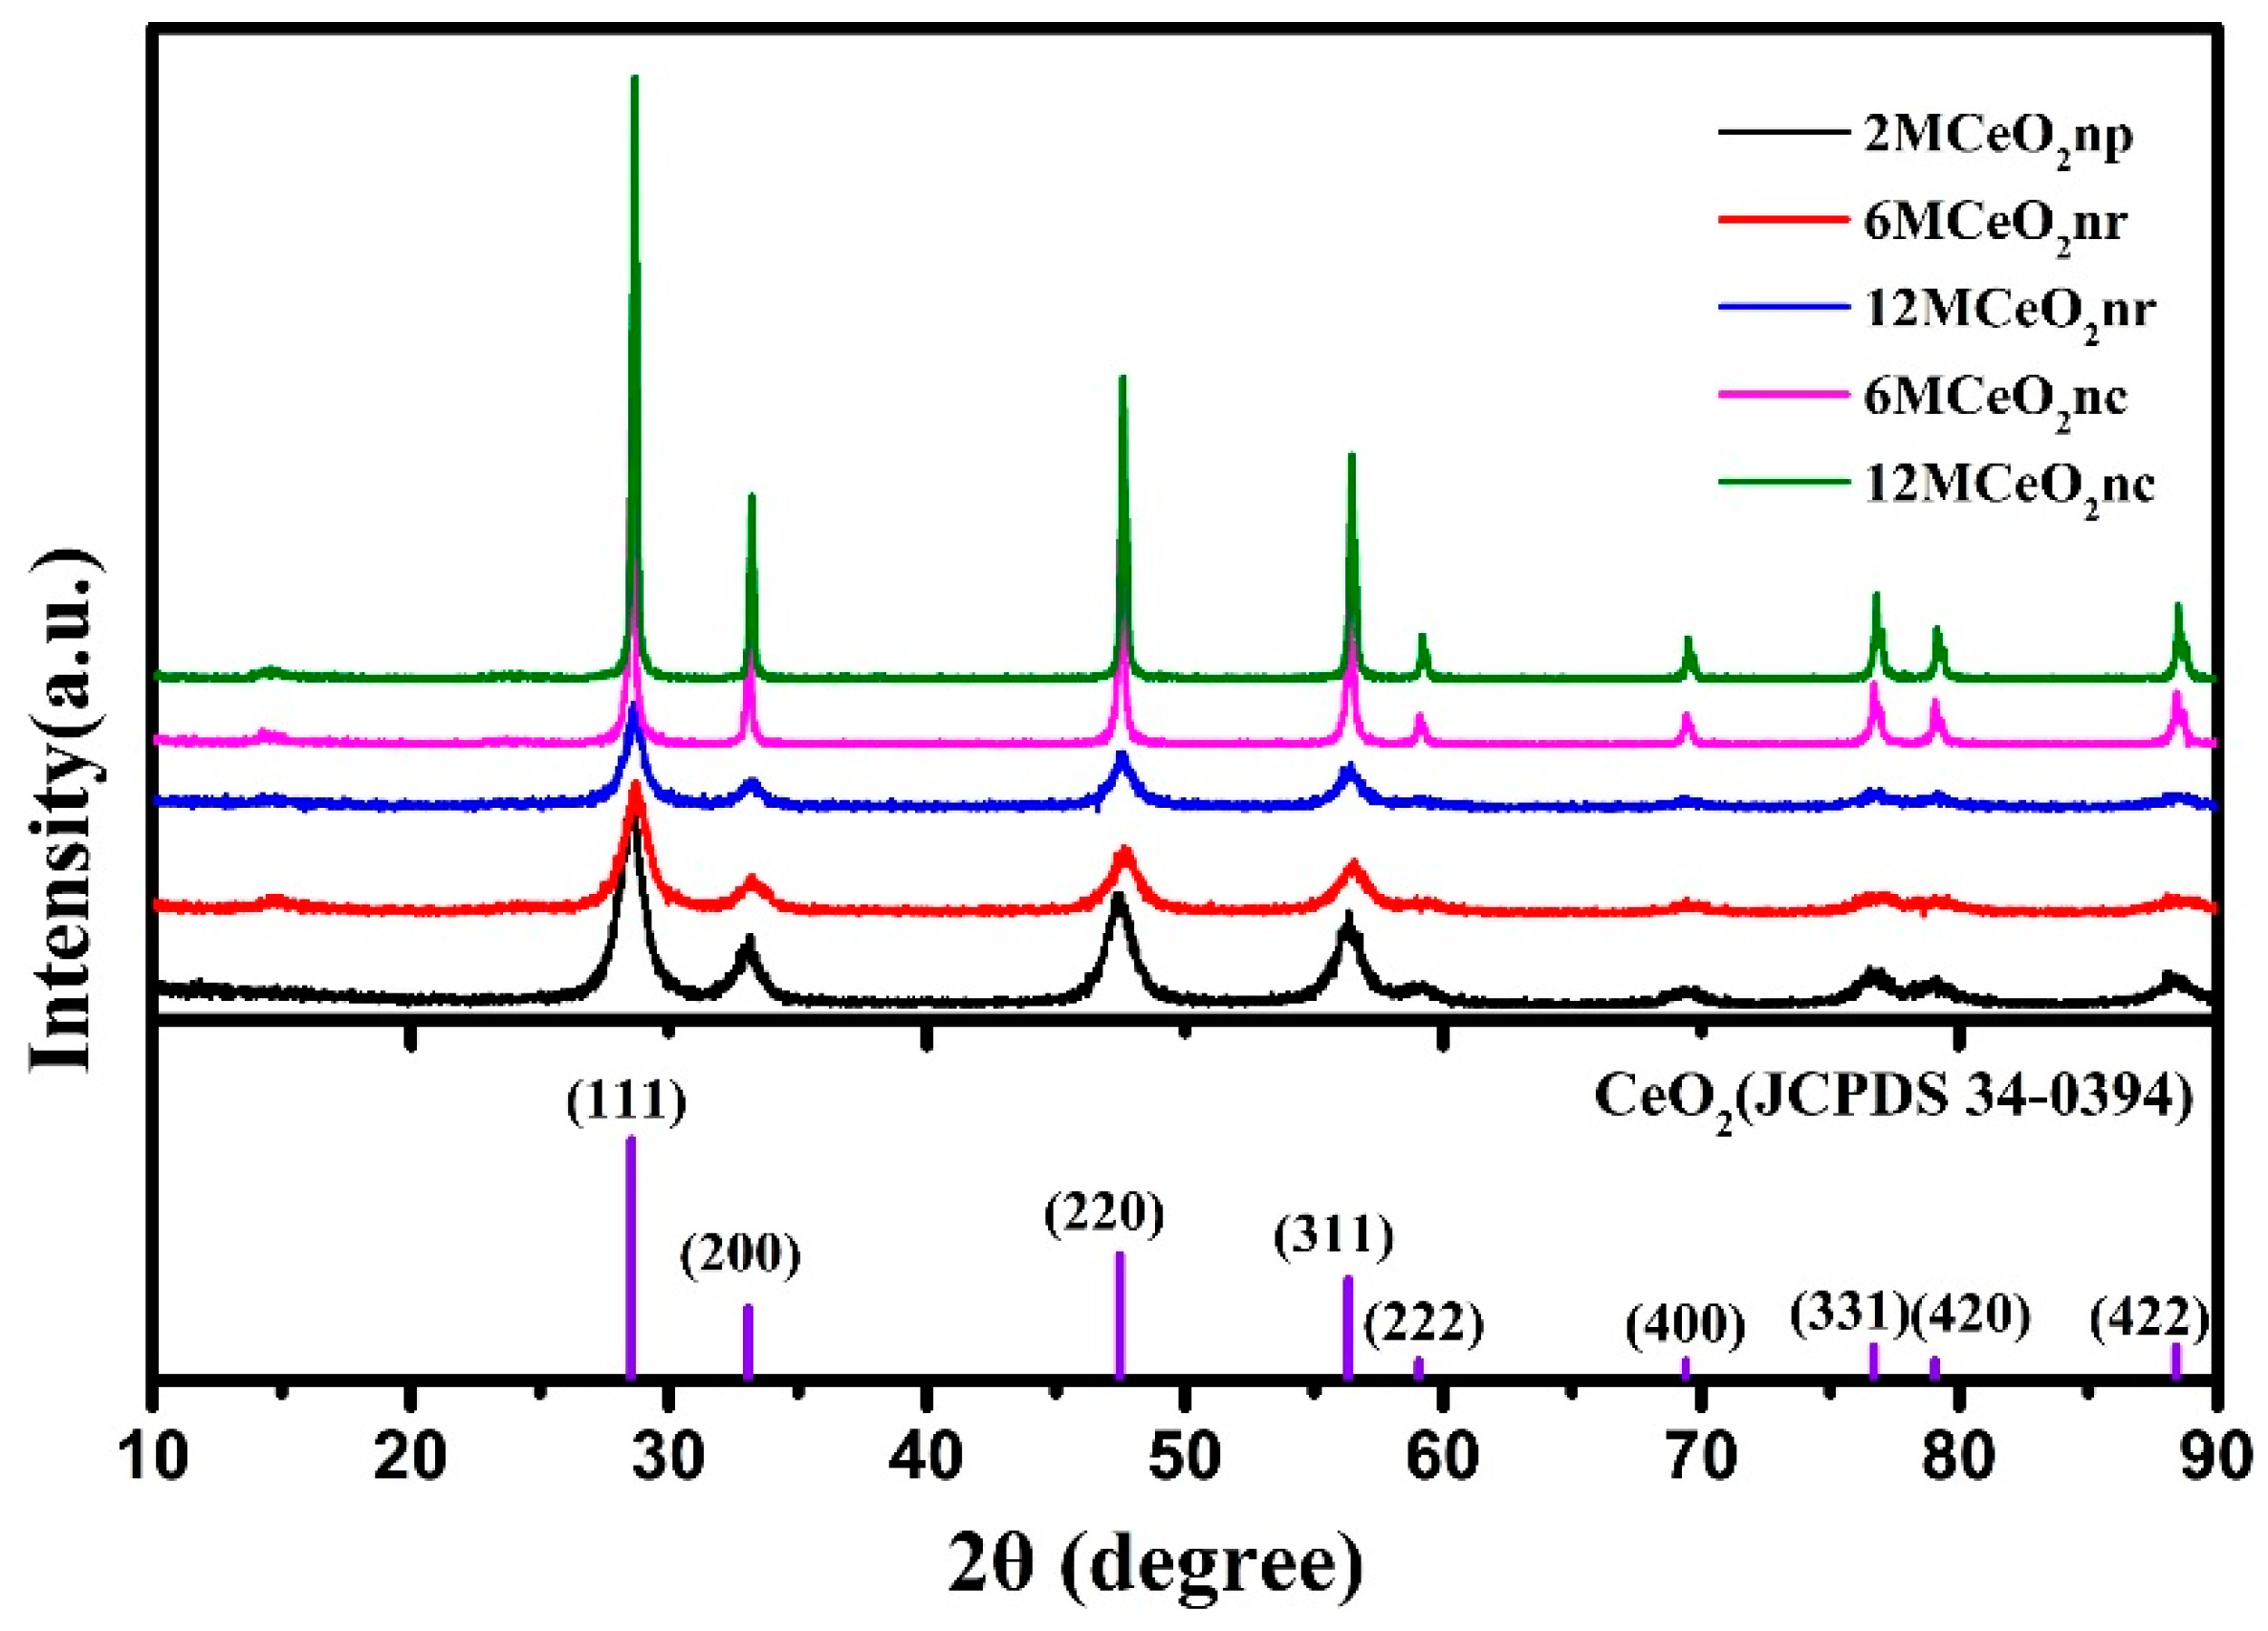
Figure 1. XRD patterns of the as-prepared CeO2 nanomaterials.
Applsci 13 03093 g001
Figure 2. TEM images of CeO2 nanomaterials (a) 6MCeO2nr, (b) 12MCeO2nr, (c) 6MCeO2nc, (d) 12MCeO2nc, and (e) 2MCeO2np. The scalebar is 100 nm and the insets show the length distribution histograms (28 nanoparticles were measured for each histogram by Nano Measurer software v1.2.5); (f) mean length distribution diagram of CeO2nr, CeO2nc, and CeO2np calculated from the length distribution histograms.
Applsci 13 03093 g002
Figure 3. H2−TPR profiles of CeO2 nanomaterials.
Applsci 13 03093 g003
Figure 4. Ce 3d spectra of various CeO2 nanomaterials (a) 2MCeO2np, (b) 6MCeO2nr, (c) 12MCeO2nr, (d) 6MCeO2nc, and (e) 12MCeO2nc.
Applsci 13 03093 g004
Figure 5. O1s spectra of various CeO2 nanomaterials (a) 2MCeO2np, (b) 6MCeO2nr, (c) 12MCeO2nr, (d) 6MCeO2nc, and (e) 12MCeO2nc, red peak is attributed to Oα, blue peak is attributed to Oβ.
Applsci 13 03093 g005
Figure 6. Raman spectra of various CeO2 nanomaterials.
Applsci 13 03093 g006
Figure 7. Effects of morphology and size various CeO2 on protection time with the following conditions: Reaction temperature, 300 °C; DMMP concentration, 5.32 g/m3; GHSV, 10,000 h−1; catalyst weight, 0.66 g CeO2 nanocubes, 0.42 g CeO2 irregular nanoparticles, and 0.42 g CeO2 nanorods; size, 20–40 mesh.
Applsci 13 03093 g007
Figure 8. XPS spectra of deactivation CeO2 nanomaterials (a) P2p of 2MCeO2np, (b) P2p of 12MCeO2nr, (c) P2p of 12MCeO2nc, (d) O1s of 2MCeO2np, (e) O1s of 12MCeO2nr, (f) O1s of 12MCeO2nc, (g) Ce3d of 2MCeO2np, (h) Ce3d of 12MCeO2nr, and (i) Ce3d of 12MCeO2nc.
Applsci 13 03093 g008
Figure 9. Mass spectrometry of the tail gas produced during the thermocatalytic decomposition of DMMP on (a) 2MCeO2np, (b) 12MCeO2nr, and (c) 12MCeO2nc. (The insets show the high magnification picture of 25 times).
Applsci 13 03093 g009
Figure 10. In situ DRIFTS spectra of CeO2 nanomaterials (a) 2MCeO2np, (b) 12MCeO2nr, and (c) 12MCeO2nc.
Applsci 13 03093 g010
Scheme 1. Proposed DMMP decomposition reaction pathways: (I) the main reaction pathway on CeO2 nanomaterials, (II) the side reaction pathways on CeO2np, () the side reaction pathways on CeO2nr, () the side reaction pathways on CeO2nc, (ak) show the various reactions.
Applsci 13 03093 sch001
Table 1. Synthesis conditions and physicochemical characteristics of the as-prepared CeO2 nanomaterials with different morphologies.
CatalystTemperature (°C)CNaOH (mol/L)MorphologyMean Length (nm)Crystallinity Size (nm)SBET (m2/g)
2MCeO2np1002Particles5.026.86128.89
6MCeO2nr1006Rods38.727.50126.1
12MCeO2nr10012Rods133.839.61102.19
6MCeO2nc1806Cubes18.7839.5631.13
12MCeO2nc18012Cubes57.9549.4614.609
Table 2. XPS, Raman characterizations, and catalytic performance of various CeO2 nanomaterials.
CatalystXPSRamanICPProtection Time (min)MSTC
(gDMMP/gcat)
SSTC
(gDMMP/m2)
Ce3+/(Ce3+ + Ce4+)Oα/OallOβ/OallFWHM460I600/I460Ce(wt%)
2MCeO2np19.6458.9441.0627.270.037077.93500.2220.00072
6MCeO2nr25.3251.0848.9233.400.038873.34200.2660.00089
12MCeO2nr25.1562.7437.2641.260.046177.34900.3100.00128
6MCeO2nc19.0470.1029.9012.410.011872.22100.0850.00179
12MCeO2nc20.8260.7039.3016.550.013272.33780.1520.00688
Table 3. Protection time on various catalysts.
CatalystReaction ConditionDMMP ConcentrationProtection TimeReference
0.5% Pt-Al2O3299 °C, flow rate 8.85 L/min3.5 g/m38 hGraven et al. [46]
Cu2-HA400 °C, flow rate 100 mL/min3.58 g/m37.5 hLee et al. [47]
1.6% Pt-TiO2300 °C, flow rate 100 mL/min8 h
10% V/Al2O3400 °C, flow rate 50 mL/min1300 ppm12.5 hCao et al. [13]
1% Pt/Al2O38.5 h
10% Cu/Al2O37.5 h
Al2O34.0 h
10% Fe/Al2O33.5 h
10% Ni/Al2O31.5 h
10% V/SiO225 h
CuO/γ-Al2O3350 °C, flow rate 100 mL/min4.0 g/m31.8 hDong et al. [48]
CuO-1% CeO2/γ-Al2O32.1 h
CuO-5% CeO2/γ-Al2O33.9 h
CuO-10% CeO2/γ-Al2O31.8 h
CeO2400 °C, flow rate 100 mL/min8.46 g/m32.33 hDong et al. [49]
10% Cu/Ce4.2 h
20% Cu/Ce4.43 h
50% Cu/Ce5.36 h
80% Cu/Ce2.33 h
CuO0.93 h
2MCeO2np300 °C, flow rate 50 mL/min5.32 g/m35.8 hThis work
6MCeO2nr7.0 h
12MCeO2nr8.1 h
6MCeO2nc3.5 h
12MCeO2nc6.3 h
Table 4. Variation of Ce3+ content in clean and deactivated catalysts.
CatalystBefore Decomposition ReactionAfter Decomposition ReactionΔCe3+ΔCe3+/Time
Ce3+/(Ce3++ Ce4+)Ce3+/(Ce3++ Ce4+)
2MCeO2np19.6434.9915.350.044
12MCeO2nr25.1535.019.860.020
12MCeO2nc20.8230.579.750.026
Table 5. Content of PO43− on various CeO2 materials and at the end of the reaction tube after catalytic decomposition of DMMP.
SamplesPO43−
2MCeO2np3.508 (g/kg)
12MCeO2nr1.450 (g/kg)
12MCeO2nc1.720 (g/kg)
2MCeO2np reaction tube tail residues0.2943 (mg/L)
12MCeO2nr reaction tube tail residues0.0722 (mg/L)
12MCeO2nc reaction tube tail residues0.1654 (mg/L)
Table 6. Assignments of IR frequencies in DMMP.
Vibrational ModeIR Frequencies (cm−1)
DMMP [51]DMMP Gas Phase [21,52]DMMP Liquid Phase
This Work
νa(P−CH3)299230142996
νa(O−CH3)295729622958
νs(P−CH3)292629242927
νs(O−CH3)285228602854
δa(O−CH3)146514671465
δs(O−CH3)1450//
δs(P−CH3)131713141315
ν(P=O)124212761257
ρ‖(O−CH3)11861188/11901187
νa(C−O)105810701061
νs(C−O)103410491034
ρ‖(P−CH3)916914914
ν(P−O)822816821
ν(P−O)789/788
ν(P−C)714/713
ν = stretching; δ = deformations; ρ = rocking; s = symmetric; a = asymmetric.
Table 7. Assignments of IR frequencies in surface species.
Vibrational ModeIR Frequencies (cm−1)
2MCeO2np12MCeO2nr12MCeO2ncReference [53]Reference [54]Reference [56]
ν(OH)3701/3709371037243720
ν(OH)36593655/36603656/36513652
ν(OH)/3554359436003616/
νs(P−CH3)293029282914///
νs(O−CH3)285428742876///
ν(Ce−O−CH3) [55]281328132813///
2δ(C−H)27162716//2721/
νa(OCO) 116151620/15991609/
νa(OCO) 21535//155315491552/1550
ν(CO3) 3 [57]1396//1354//
δ(C−H)13651363/137113671375/1372
δs(P−CH3)/13181318///
ν(CO3) 5 [57]/13181318///
ν(CO3) 5 [57]//1236///
ν(CO3) 4 [57]1294//1289///
ν(P=O) [32,55]126212791272///
νa(P−O) [32,55]12131208/1130///
νs(P−O) [32,55]105611691050///
1. monodentate formate species; 2. bidentate (bdt) formate bound to two Ce4+ atoms; 3. monodentate carbonate; 4. bidentate carbonate; 5. bridged carbonate.
Disclaimer/Publisher’s Note: The statements, opinions and data contained in all publications are solely those of the individual author(s) and contributor(s) and not of MDPI and/or the editor(s). MDPI and/or the editor(s) disclaim responsibility for any injury to people or property resulting from any ideas, methods, instructions or products referred to in the content.