Article

Experimental and Numerical Predictions of Cryogenic Leakages in Welded Steel Plates

1
Busan Headquarters, Korea Maritime Equipment Research Institute, Busan 46744, Republic of Korea
2
Department of Naval Architecture and Ocean Engineering, Pusan National University, Busan 46241, Republic of Korea
3
Hydrogen Ship Technology Center, Pusan National University, Busan 46241, Republic of Korea
*
Authors to whom correspondence should be addressed.
Appl. Sci. 2023, 13(5), 3132; https://doi.org/10.3390/app13053132
Submission received: 1 February 2023 / Revised: 24 February 2023 / Accepted: 25 February 2023 / Published: 28 February 2023
(This article belongs to the Special Issue Ship Structures: Design Loads and Reliability Assessment)

Abstract

:
This study presented experimental and numerical research to investigate the effect of cryogenic leakage on a plate structure of AH36-grade steel containing welded joints. To simulate the cryogenic leakage conditions, the welded plate was exposed to a temperature of −196 °C by supplying liquid nitrogen (LN2) to the center of the steel plate. The time-dependent temperature history and strain variation were measured by using thermocouples and strain gauges attached to the plate surface. Additionally, the residual stress of the middle surface section before and after the cryogenic leakage process was measured by X-ray diffraction analysis (XRD). A three-dimensional finite element model was created with the use of a commercial finite element analysis (FEA) program to simulate the flux-cored arc welding process and cryogenic leakage process. The steel surface temperature dropped sharply and reached approximately −196 °C at 160 s after LN2 supplement. After the first 650 s of the LN2 leakage experiment, the outside of the trough reached approximately −75 °C and −25 °C, depending on the location of the thermal couples. Although there was a relative difference in the results, the experiment and numerical simulation results for temperature and stress distribution showed good agreement. The results could be utilized in the ship design stage adopting welded structures as a basic database.

1. Introduction

The accelerated development of the world’s economy and the growing concern regarding environmental pollution has led to a considerable increase in demand for liquefied natural gas (LNG) [1,2,3,4]. To meet this demand, several types of LNG offshore plants and carriers have been developed that are now operating over the world [5,6]. The primary part of ships and offshore structures are weld joints [7] due to their ease of use and dependability [8]. Additionally, they are also cost-effective. However, during the welding process, the considerable local heat input and subsequent rapid cooling result in residual stress formation and dimensional distortions [9,10,11,12,13]. Owing to the compression of the fusion zone in the cooling period, the residual stresses appear in the neighborhood of the weld region in the form of normally tensile stresses [14]. As a result, these post-weld tensile residual stresses frequently contribute to the brittle fracture [15] and premature failure of the zone near the weld region [16]. In addition, in ships and offshore structures carrying LNG, some regions endure cryogenic temperature due to the leakage of LNG from pipework connections like flanges and valves during loading or unloading activities [17].
Cryogenic thermal shock occurs when a sudden thermal load acts on a plate structure around a liquefied gas storage tank or a pipeline when leakage occurs. Due to cryogenic thermal shock, deformation can occur, and crack propagation can also occur in severe cases. Recently, due to the use of eco-friendly liquefied gas fuel in ships, the importance of the effect of cryogenic thermal shock on the mechanical performance of ship structures has been increasing. Although the use of liquefied gas is becoming more common, there needs to be a greater understanding of the problems that may occur because of cryogenic thermal shock in plate structures that contain residual stress from the welding process. Of course, sudden deformation may not occur directly due to the leakage of cryogenic liquefied gas. After cryogenic liquefied gas leaks from the storage tank and pipeline, the surrounding plate does not experience abrupt deformation immediately. However, if the ambient temperature is reduced by continuous leakage, the cryogenic liquefied gas may be directly deposited on the plate, which leads to plate deformation and crack propagation.
The welded structure subjected to cryogenic temperature is considerably sensitive to crack propagation. This is because the residual stresses created during the original manufacture welding with thermal stress may remain in the structure. They could result from the weld zone suffering cryogenic temperature [18]. Crack propagation phenomena of offshore structures that contain welded joints under a cryogenic temperature are complex and difficult to predict. To prevent the catastrophic disasters derived from these phenomena, it is vital that the crack growth is studied using cryogenic temperature assessment and fatigue analysis. Several studies have investigated the crack propagation phenomena of welding structures under a cryogenic environment. Li et al. [19] focused on the tensile properties and fracture behavior of the friction-stir-welded joints of nitrogen-strengthened high manganese steel at ultralow temperatures. They showed that to obtain a desirable cryogenic tensile temperature, the effects of post-weld heat treatment on the microstructures of the friction stir welding joints should also be examined in detail. Ding and Wu et al. [20] conducted a series of tensile tests and Charpy impact tests at eight distinct temperatures of 20, 0, −20, −40, −80, −120, −160, and −196 °C, to investigate the mechanical properties of S30408 base metal and welded joints at cryogenic temperatures. Their study showed that the welded joints have a higher yield stress than the base metal. By contrast, the base metal has the maximum ultimate tensile stress and Charpy absorbed energy. The lateral expansion is higher in the base metal than in the welded joints. The Sandia laboratory [21,22] performed experimental and computational analysis of the thermally induced fracture of steel plate structures with and without a welded joint. Liquid nitrogen (LN2) was applied oto the sections of each steel plate to achieve thermal stress. They investigated the cooling of steel plates subjected to cryogenic liquids and studied the development and propagation of cracks in the plates due to the influenced thermal stresses and lowering fracture toughness. Usami et al. [17] fabricated carbon steel through a thermomechanically controlled process (TMCP). It can be applied to hull or module structure construction to manage possible brittle fracture. The hull construction and stress condition of floating–liquefied natural gas (FLNG) were presented through a series of real large-scale structure tests. The performances of the material expected under realistic cases were evaluated. However, few studies have experimentally investigated the mechanical behavior and crack propagation of welding structures under cryogenic temperatures. In contrast, tension tests, Charpy impact tests, numerical methods, and other methods have been used to investigate this behavior. Thus, this relatively unknown risk of cryogenic spills on a welded structure is yet to be fully studied or quantified at the level of a realistic design.
This study aimed to investigate abrupt cryogenic leakages and their impact on a structure having welded joints by carrying out a comparative analysis of structural deformation, with or without the appearance of cracks, from cryogenic spill experiments. LN2 was supplied to the center region of the steel plate, which contained the welding. The temperature history and strain were measured by thermocouples and strain gauges, respectively, attached to the steel plate during the experiment [22,23,24]. The appearance of cracks and their spread were observed, and they are analyzed herein. In addition, numerical analyses were conducted using the commercial software package ABAQUS/Standard [25] to predict the residual stress and distortion in weldments fabricated using flux-cored arc welding (FCAW), and to predict the temperature history and thermal stress of the welding structure during cryogenic liquid leakage. The appropriateness of the FEA model was validated by the experiments.

2. Experimental Preparations

2.1. Welding Procedure

Low-carbon-grade AH36 steel plates provide a wide range of applications in shipbuilding industries for hull construction and superstructures [26]. In this study, AH36 steel was chosen as the target material. Table 1 illustrates the AH36 steel’s chemical compositions. Pairs of steel plates with dimensions 580 × 340 × 6 mm were welded using the FCAW method. Figure 1a exhibits the geometry and main dimension of the Y-groove joint, which was employed during the welding of 6 mm thick AH36 steel, and Figure 1b displays the schematic diagram of the FCAW process. During the welding process, a special jig mechanically restrained the specimen, providing additional constraints to the structure. The welding current (I), voltage (U), and speed (v) are 215 A, 35 V, and 6.7 mm/min, respectively. Once the welding process was completed, the welded plate was air-cooled until the entire plate returned to ambient temperature. The temperature of weldments is above 1800 °C, and the cooling time is 3000 s.

2.2. Experimental Setup of the Cryogenic Liquid Test

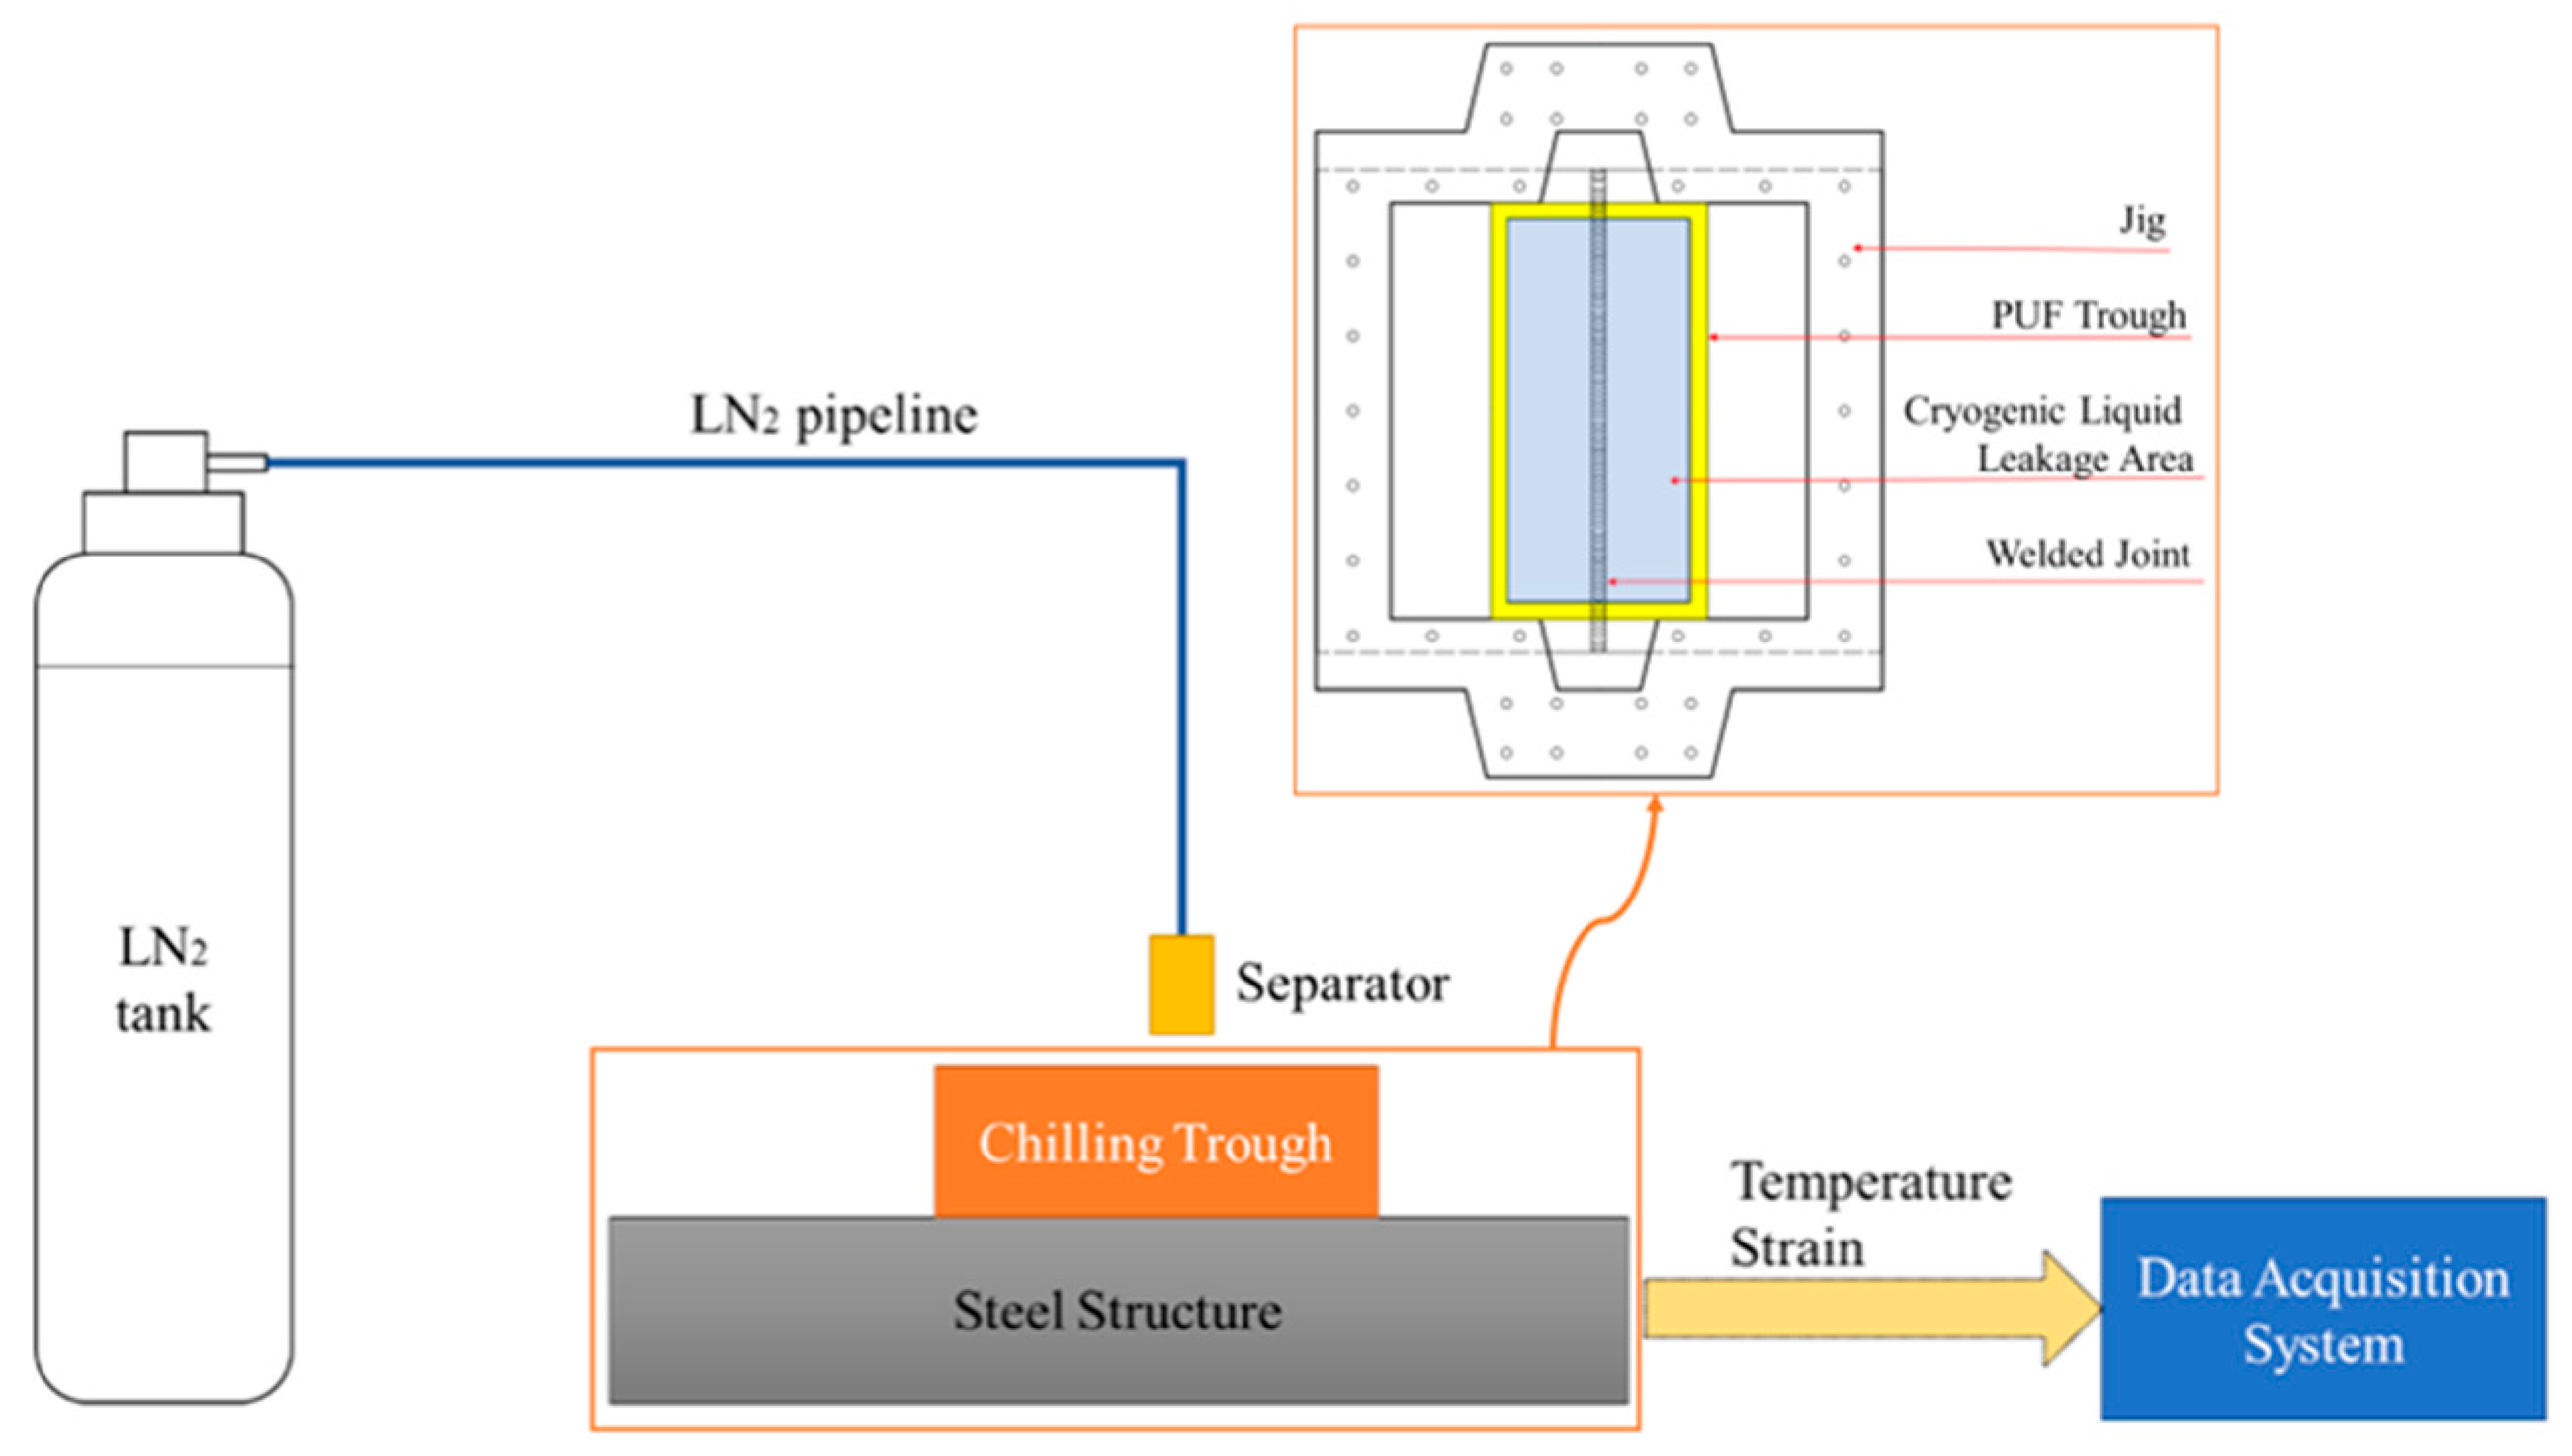
Figure 2 depicts the schematic of the experimental cryogenic liquid test. The experimental setup is composed of an LN2 tank, LN2 pipeline, valve, and data acquisition (DAQ) system. LN2 induces the cryogenic environment in the experiment, and the LN2 supply rate into the test welded plate was controlled manually. The cooling zone was defined as the welding plate’s center location with dimensions 220 mm × 460 mm. This area was isolated by a trough, fabricated from polyurethane foam. T-type thermocouples measured the temperature variations on the front side of the specimen during the cryogenic leakage test. The operating temperature of the T-type thermocouple, which consisted of copper and copper-nickel wires, was between −250 °C to +350 °C. The DAQ apparatus measured the temperature history of the plate during the experiment. Strain gauges were attached to the plate’s top surface to measure the thermal strain while cooling, providing data to the DAQ system.

2.3. Measurement of Strain and Temperature Data

To compare the difference in thermal strain between the inside and outside of the trough, a group of four strain gauges was attached to the welded plate’s top surface. igure 3a exemplifies the layout of strain gauges, where SS1–SS4 denote strain sensors at four different measurement points. Two strain gauges (SS1, and SS3) belong to the area that is directly affected by liquid nitrogen, whereas two strain gauges (SS2 and SS4) do not. In addition, strain gauges SS1, SS3, and SS4 belong to the HAZ area, which is 10 mm away from the welded joint. In addition, the strain gauges SS1 and SS2 resided on the middle cross-section of the welded plate. There are two strain gauges equipped at each measurement point, as captured in Figure 3b
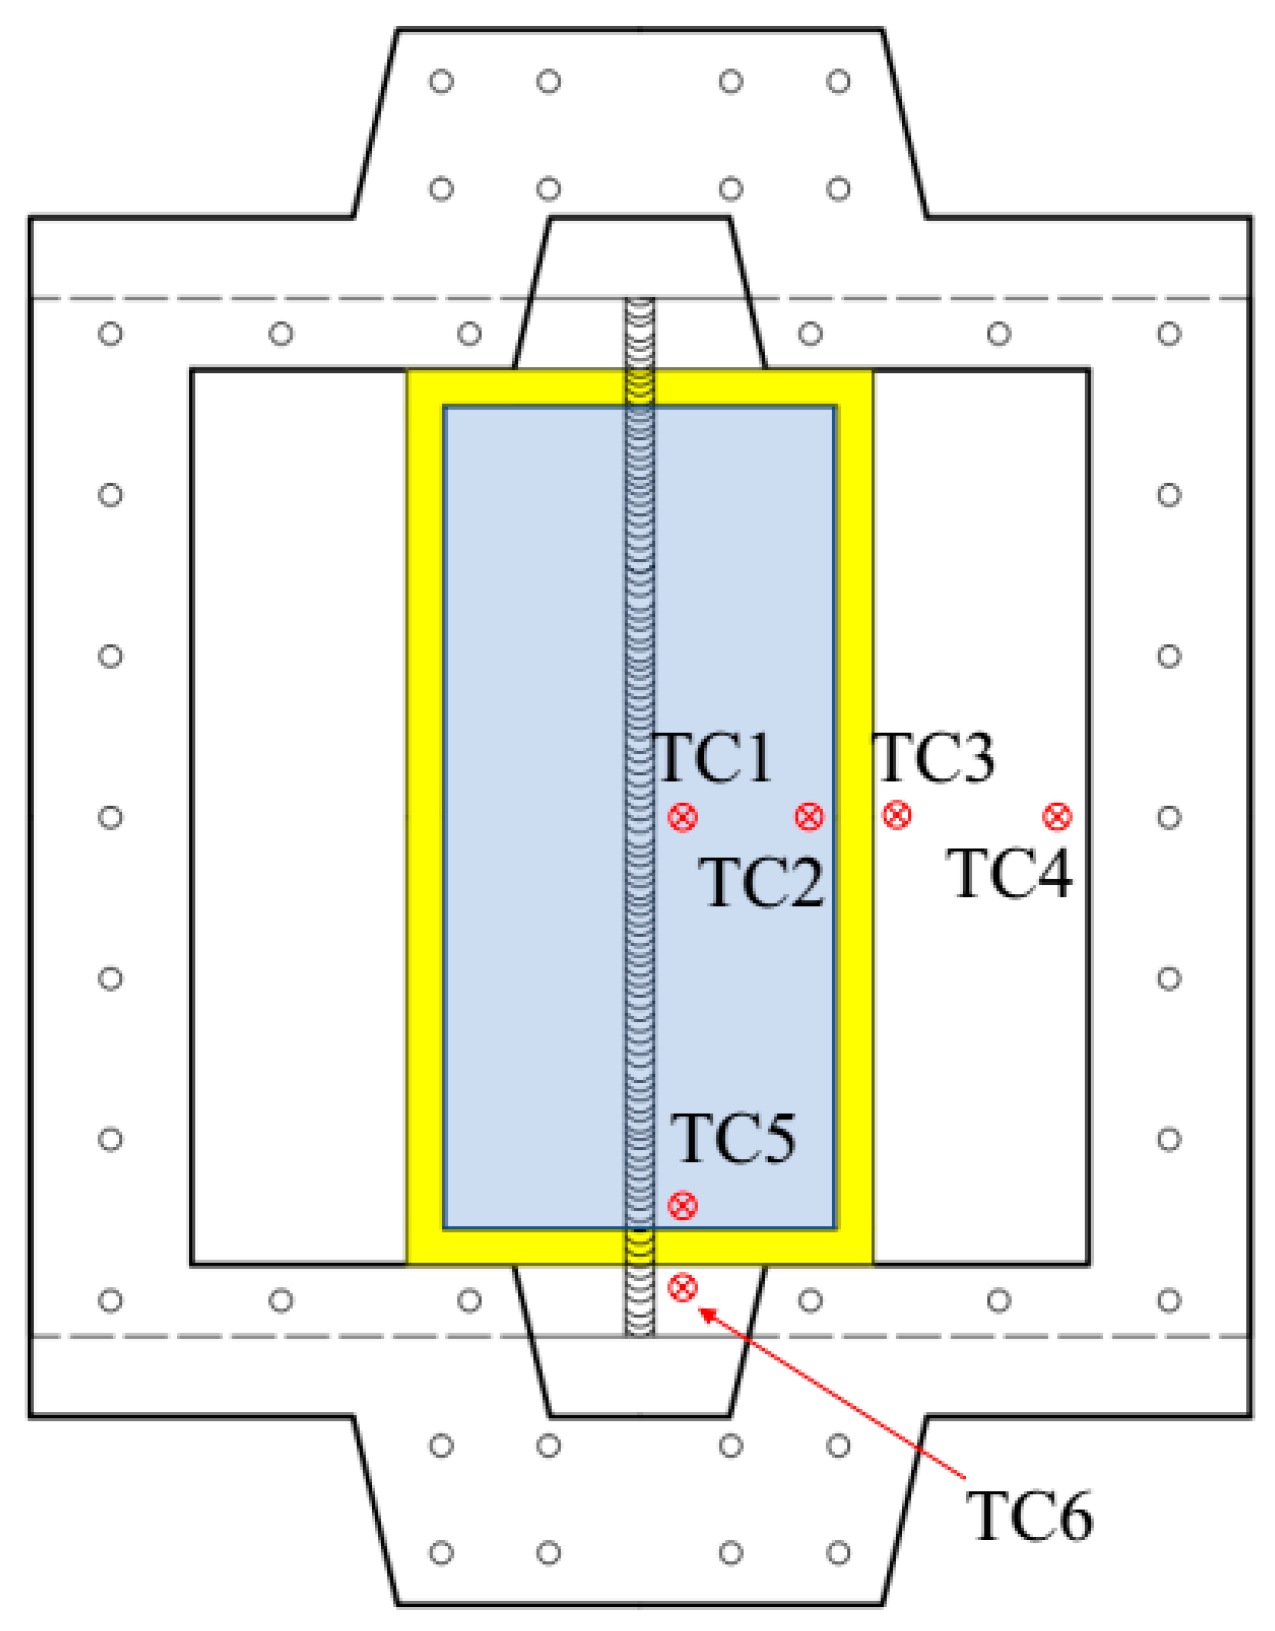
Figure 4 portrays the arrangement of thermocouples attached to the testing plate’s top surface. Similar to the strain gauges, three thermocouples (TC1, TC2, and TC5) belonged to the area that is directly affected by liquid nitrogen, whereas two thermocouples (TC4 and TC6) did not. In addition, the thermocouples TC1, TC5, and TC6 belonged to the HAZ area, and the thermocouples TC1, TC2, TC3, and TC4 attached to the welded plate’s middle cross-section.

2.4. Measurement for X-ray Diffraction

The X-ray diffraction (XRD) technique is a nondestructive method for measuring the stress at the surface of crystalline materials [27]. Bragg’s diffraction law in the XRD technique determines the interplanar spacing at a special point, as shown in Equation (1):
n λ = 2 d s i n θ ,
where n is an integer, λ is the X-ray wavelength, d is the interplanar spacing, and θ is the angle of reflection. The elastic strain is related to the difference in the interplanar spacing. Hence, based on the lattice spacing d , and reference space d 0 , the strain value is calculated by the following equation:
ε = d d 0 d 0   .
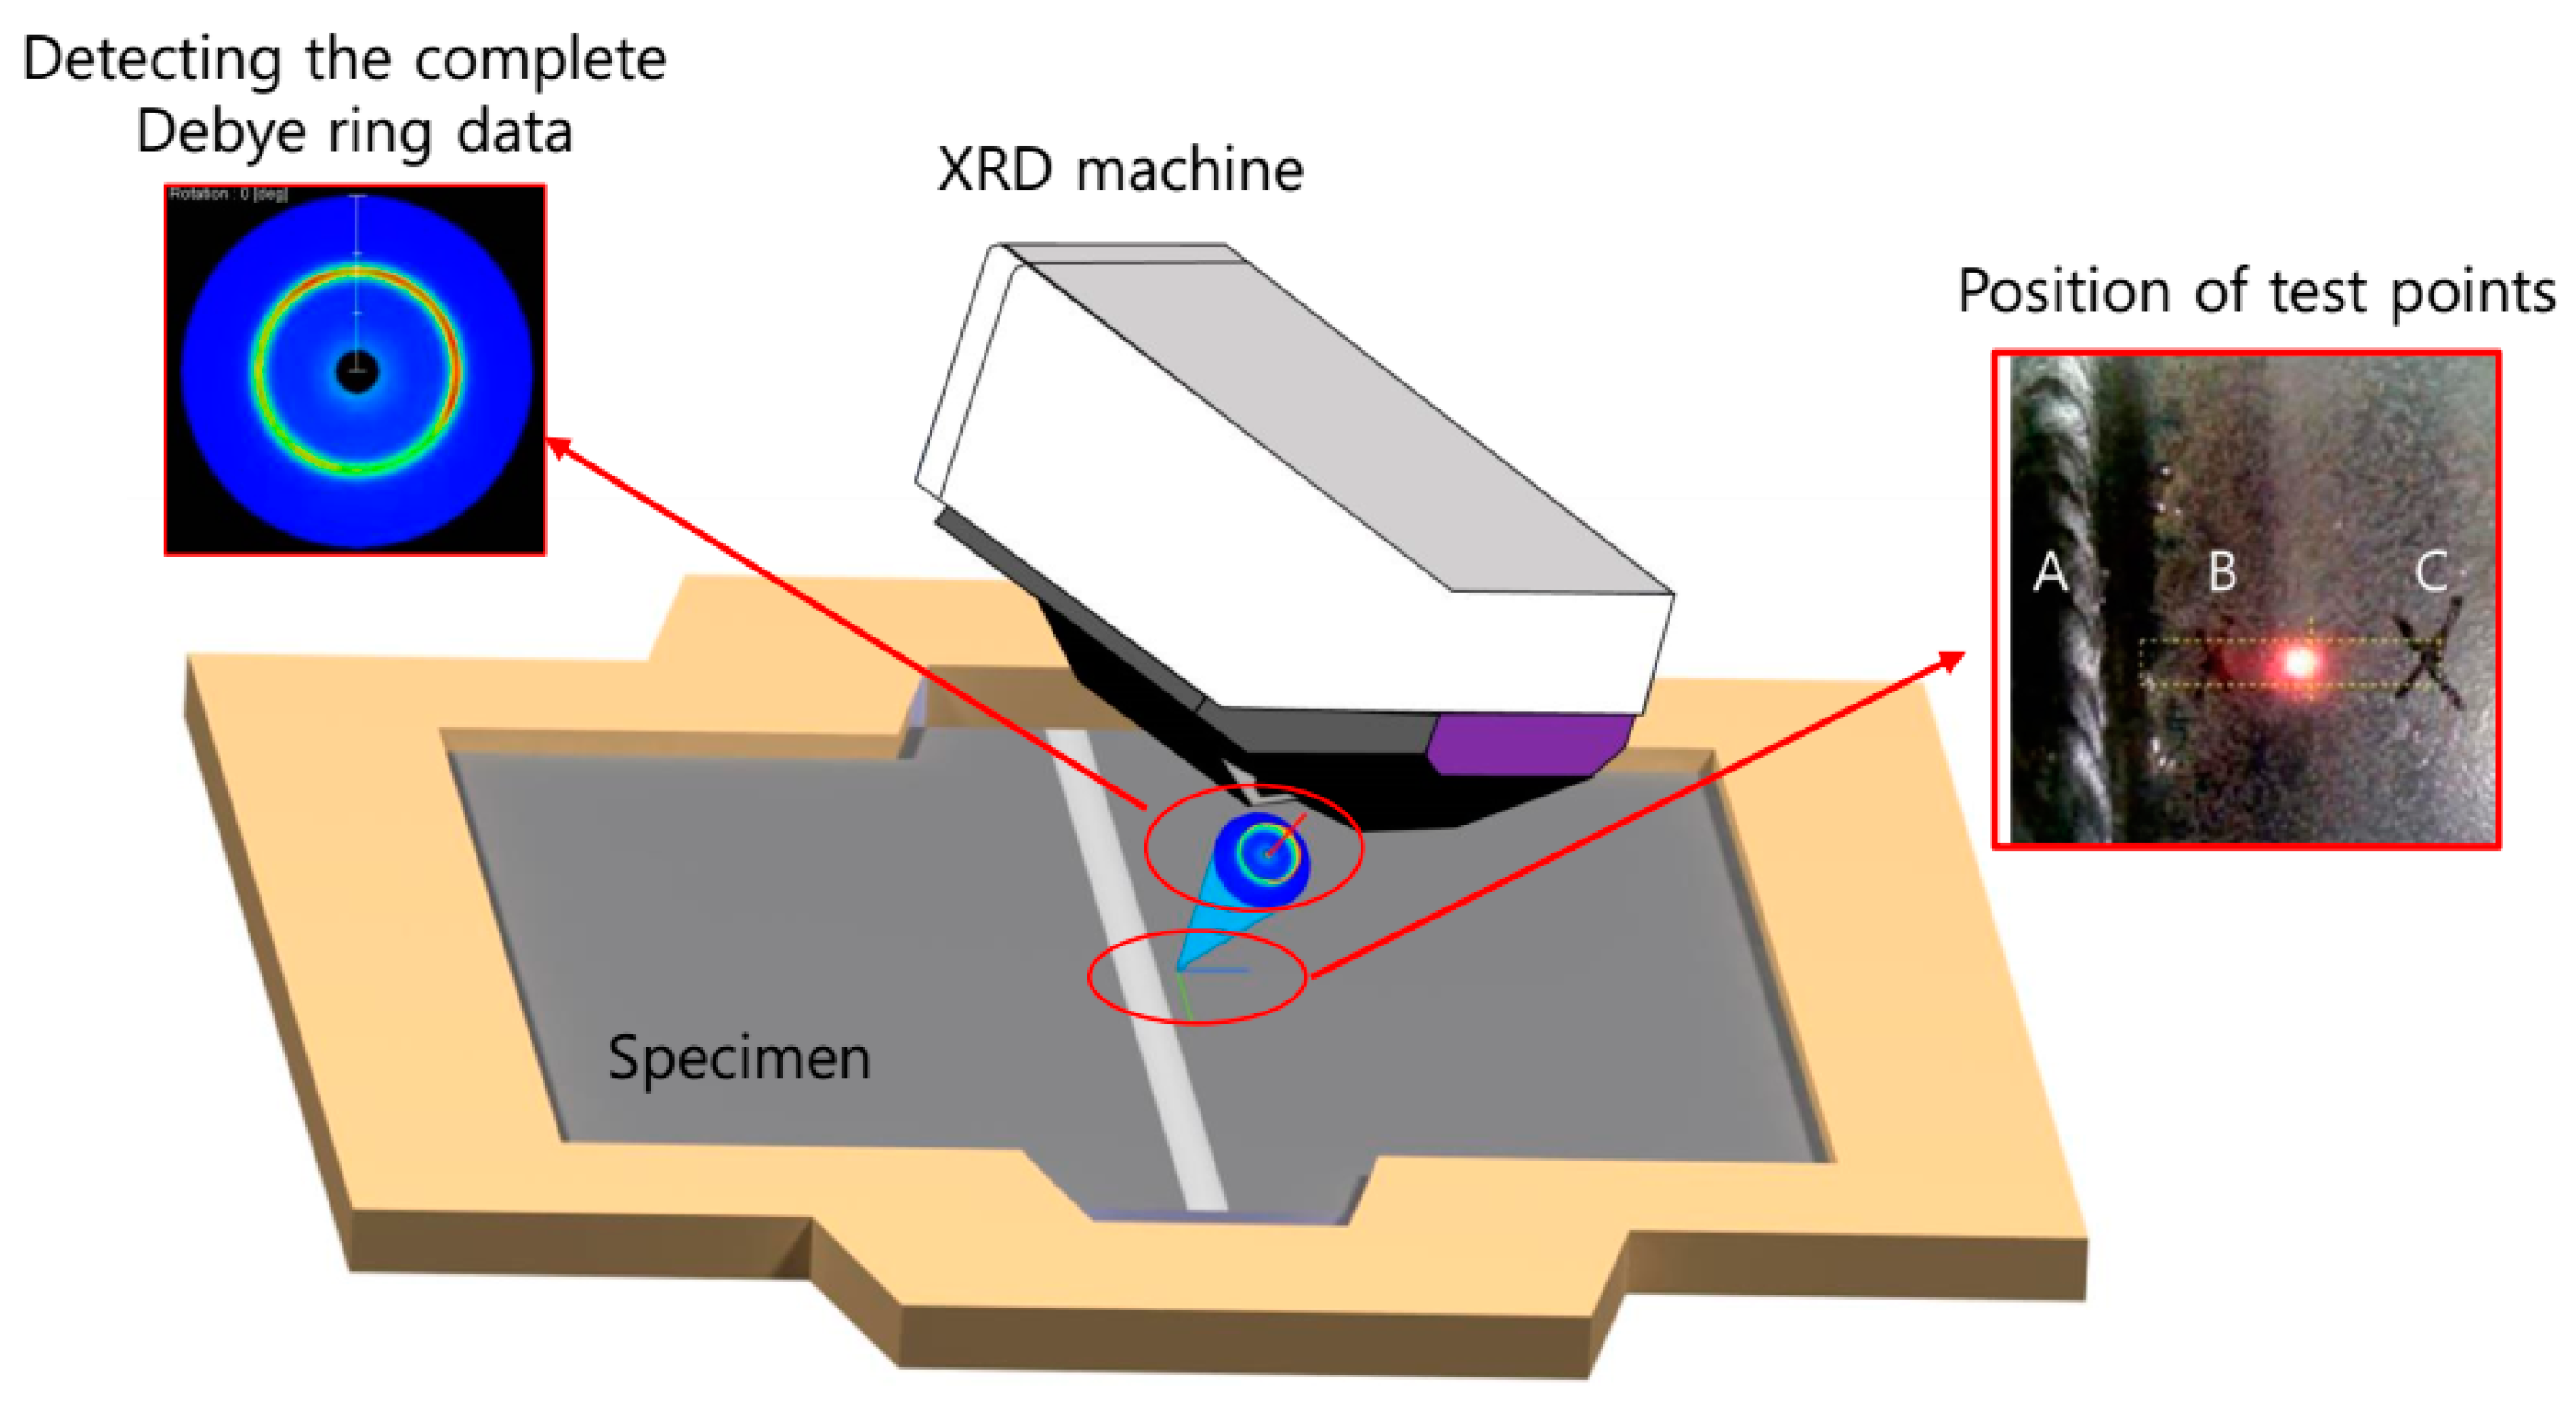
The equation above supports strain calculations in different directions, and the in-plane stress components can be calculated using the generalized Hooke’s law. To investigate the effect of the cryogenic temperature on the welded structure’s residual stress, measurements captured residual stresses both after the welding process and after the cryogenic liquid leakage test. In this work, residual stress at three points (A, B, and C in Figure 5) on the middle cross-section’s top surface was measured. Point A is located in the weld center line, Point B in the heat-affected zone, and Point C in the base metal. The distances of Points B and C from the weld center line are 20 and 30 mm, respectively. Figure 5 shows the XRD apparatus and position of residual stress test points.

3. Numerical Preparations

3.1. Numerical Preparation

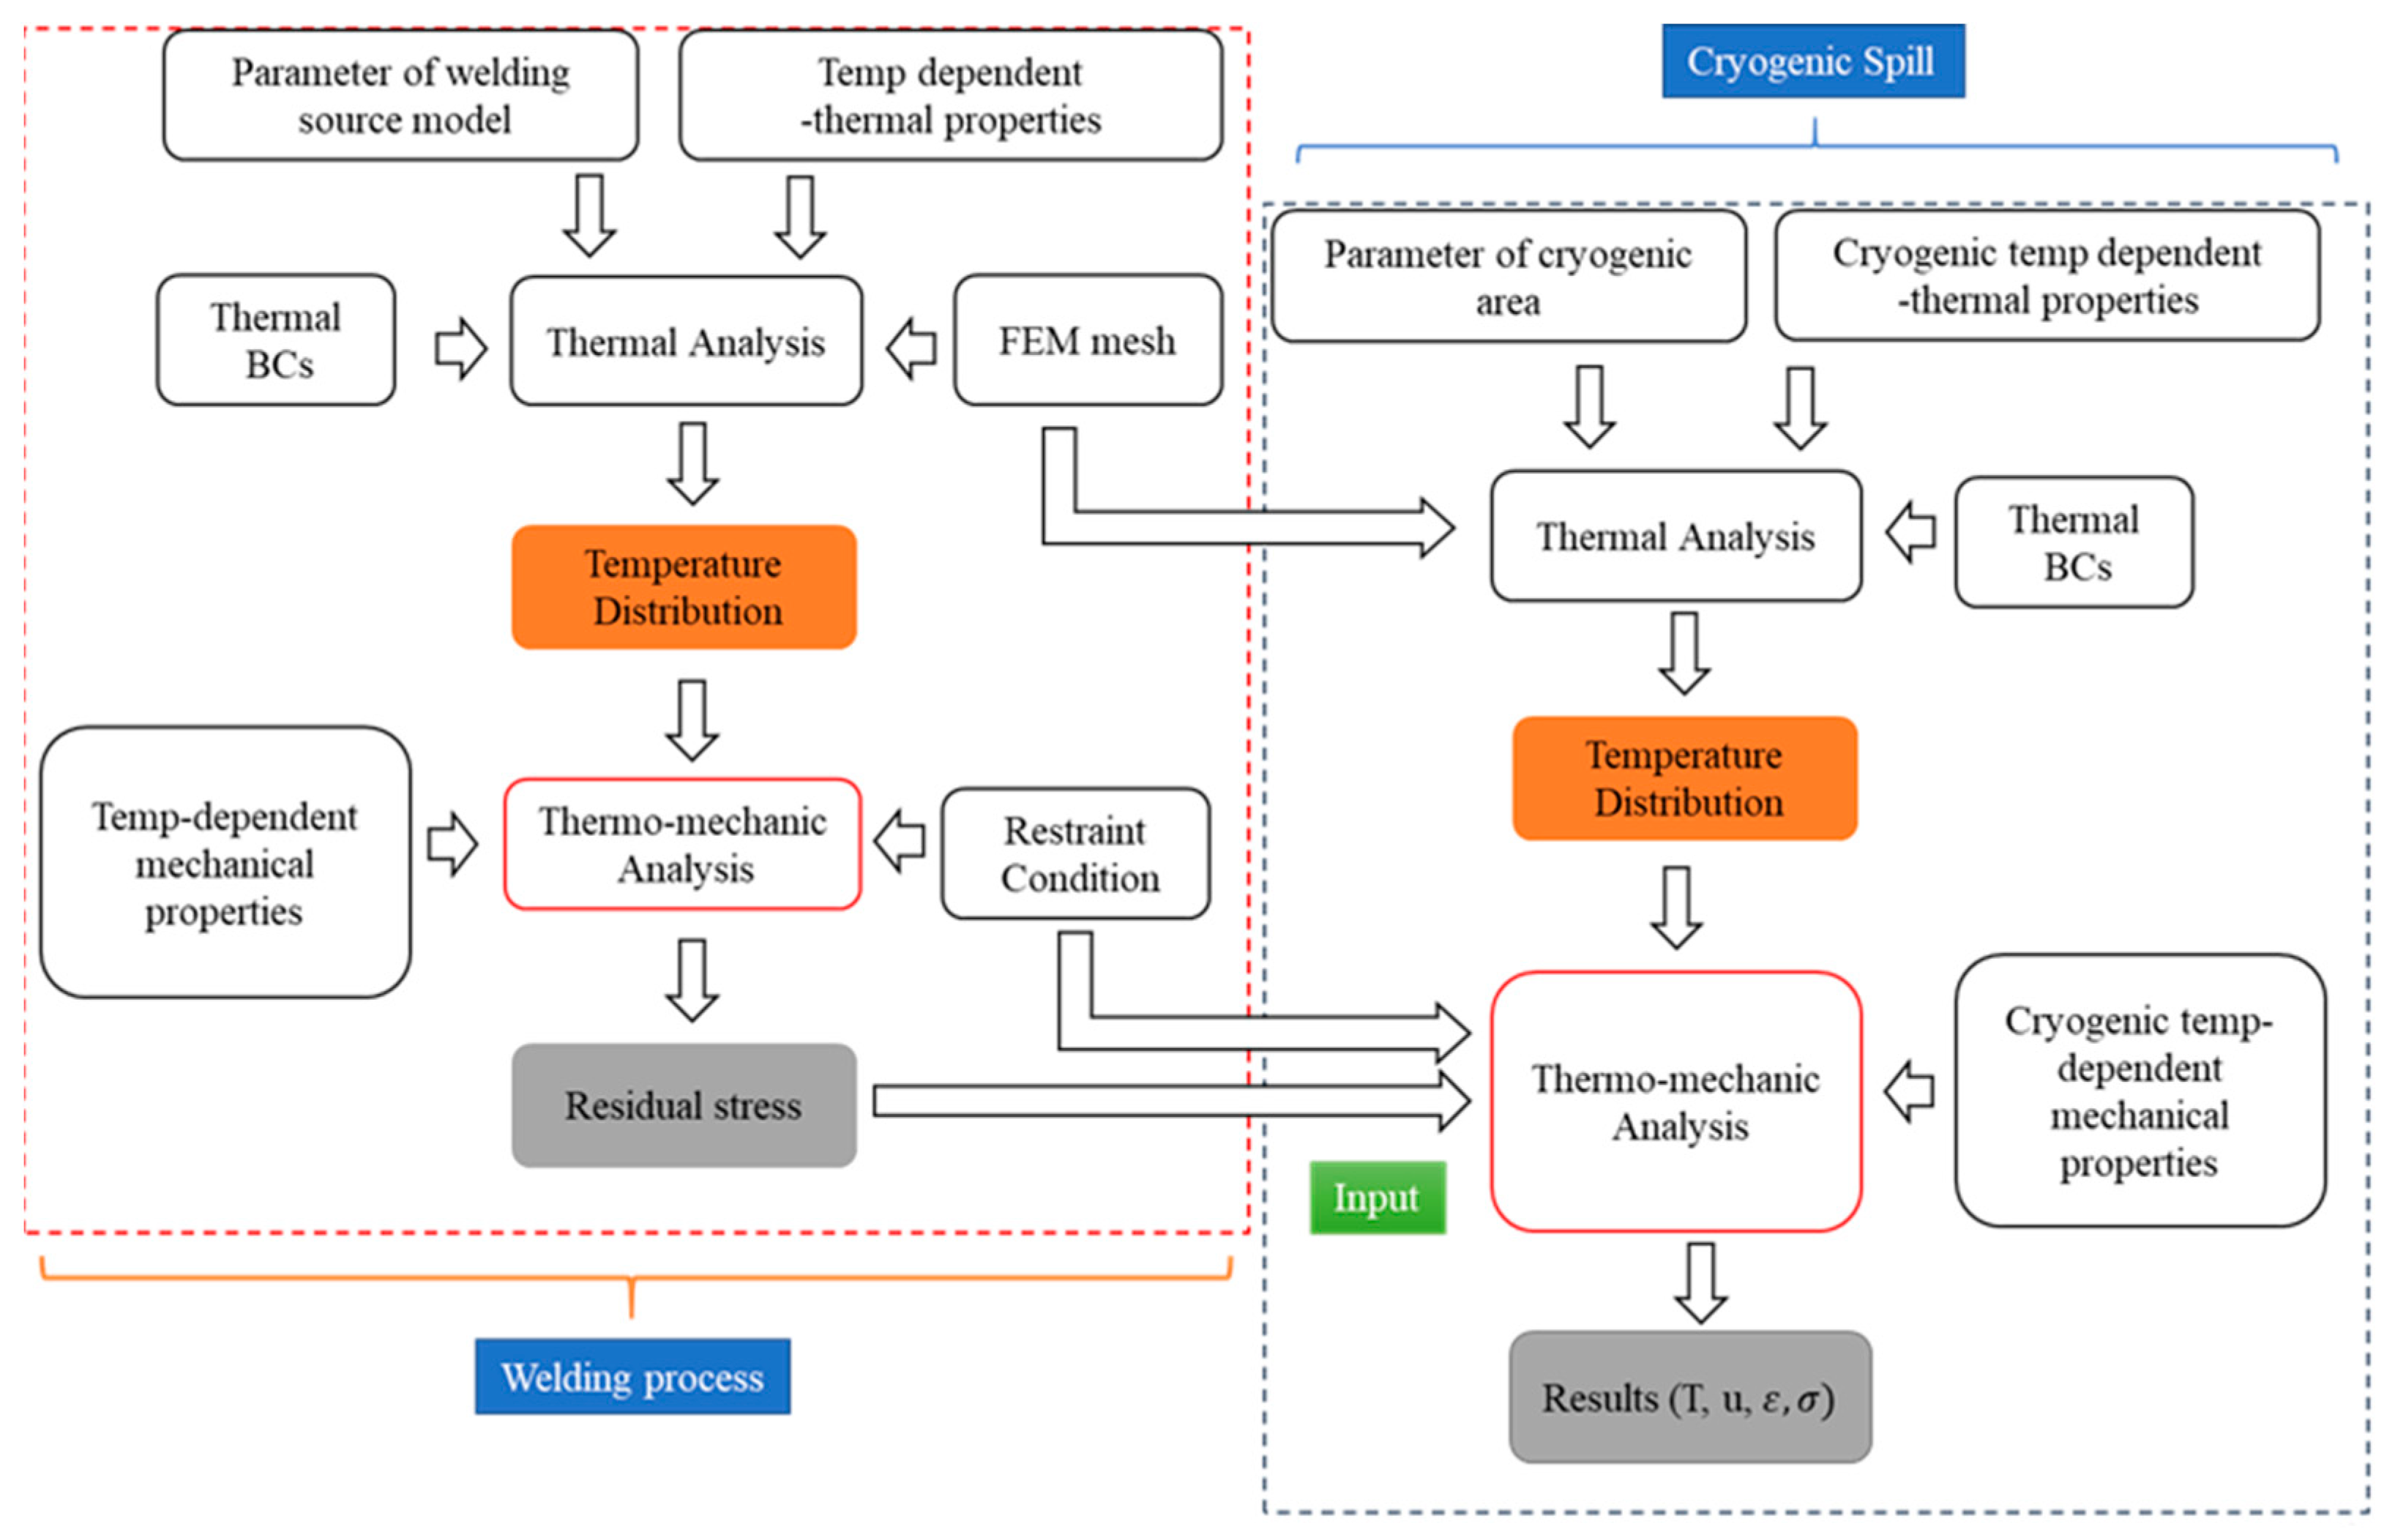
In the present study, finite element analysis (FEA) was performed using the commercial program Abaqus/Standard. A sequentially coupled thermomechanical analysis method was applied to predict the residual stress induced by the welding process and thermal stress generated from LN2 cooling. The temperatures and displacements are not fully coupled, as temperature distribution is unaffected by displacement. Therefore, the temperature field and its distribution in the entire experiment were calculated, providing an input thermal load to the mechanical analysis. Figure 6 illustrates the flow chart of the procedure for the finite element (FE) calculation obtained by the modified method [28,29].
Figure 7 displays the temperature-dependent material properties of AH36-grade steel, including the thermal conductivity, thermal expansion coefficient, specific heat, Young’s modulus, Poisson’s ratio, and yield stress measured in the welding step. As the temperature increases, the thermal conductivity of the AH36 steel plate gradually decreases. During this time, the specific heat capacity gradually increases. However, when the temperature rises to about 750 °C, the specific heat capacity, which reaches 700 J/Kg °C, no longer shows any change with an additional increase in temperature. The thermal conductivity, which reaches 20 W/m. °C, also increases again, and it increases dramatically around 150 °C. These results, when compared with the results graph for the change in mechanical properties on the right, show that at temperatures above approximately 750 °C, the specific heat capacity no longer increases as the steel melts, and the yield strength and elastic modulus values converge to 0, practically losing mechanical performance. The thermophysical and thermomechanical properties of these steels at cryogenic temperatures were obtained from the references and combined with the interpolation method [30,31].
For simplicity, we assumed that both the welded and base metals had identical material properties and chemical compositions as presented in Table 1. Geometrical models in the simulation were created with dimensions similar to the actual specimen used in the test. Two different models were used with a finer mesh size in the vicinity of the weld center line. Figure 8 illustrates the schematics of the fully adopted mesh for all thermal and mechanical analyses in the FEA. The whole mesh contained 93,144 linear hexahedral elements and 107,091 nodes. In the thermal analysis, three-dimensional, eight-node, solid DC3D8 finite elements are used. Conversely, C3D8 finite elements were used in the mechanical analysis, and the ENCASTRE boundary condition (U1 = U2 = U3 = U1R = U2R = U3R = 0) was adopted. Table 2 shows the boundary conditions of the transient thermal analysis and material properties of the target material.

3.2. Heat Source of FCAW Model

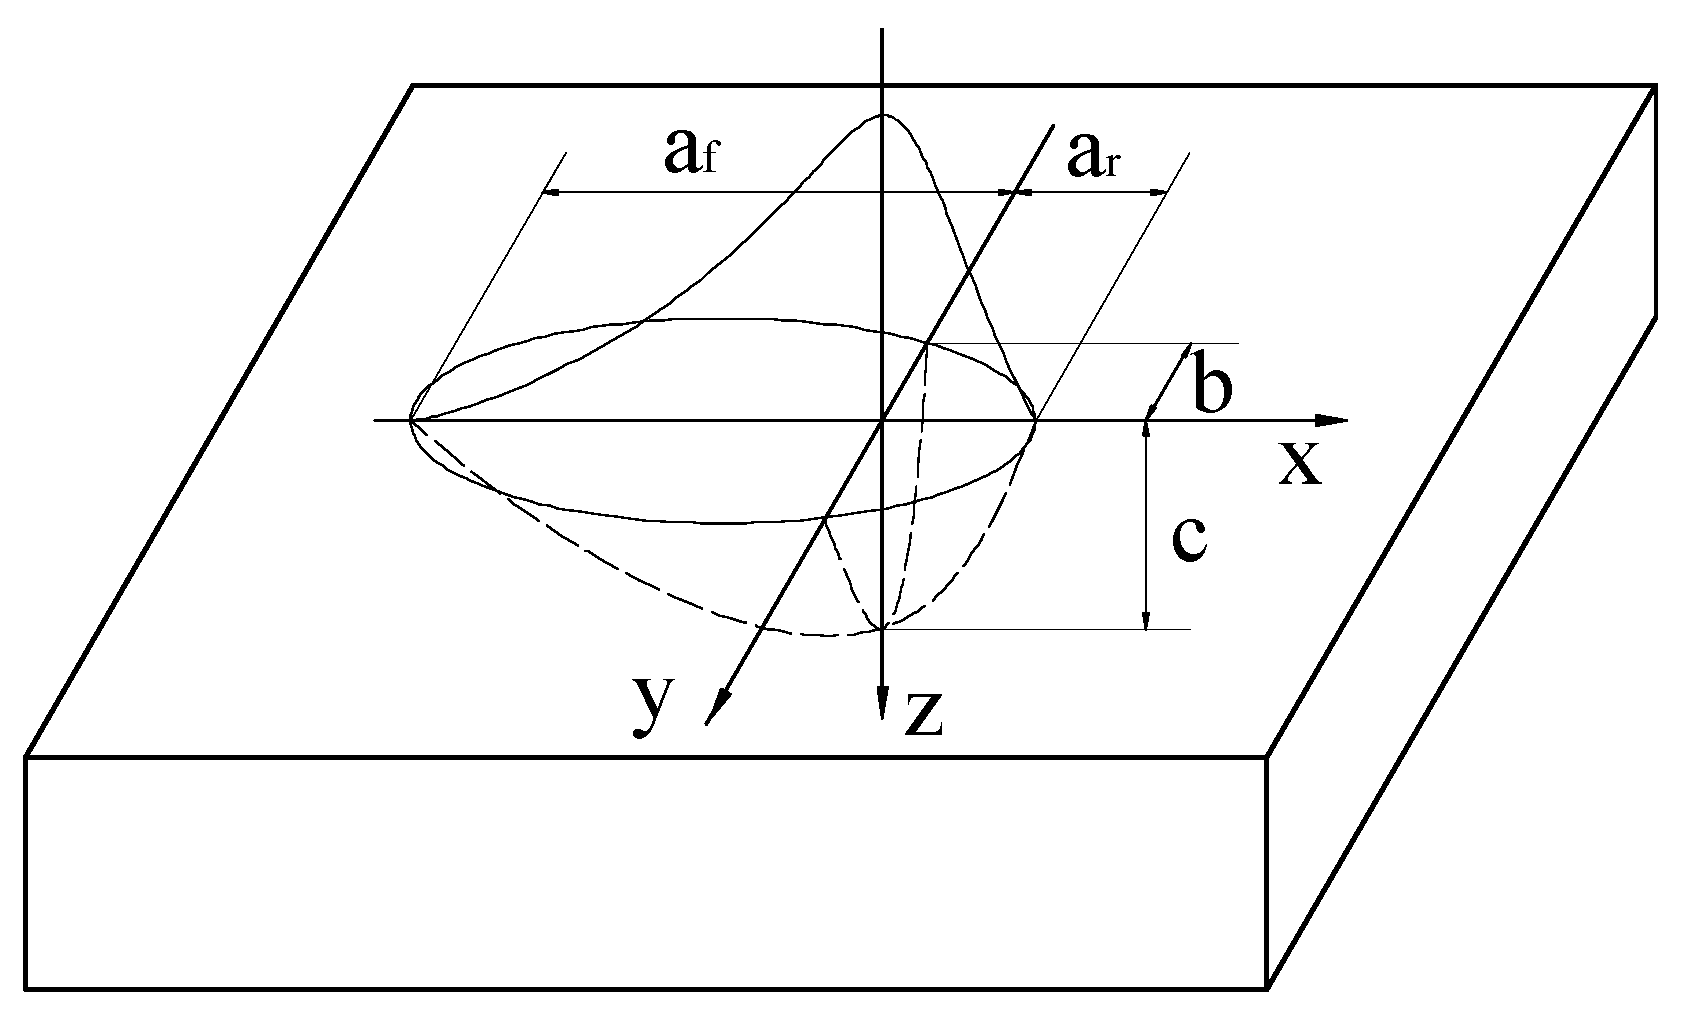
In this work, to model the heat source for the finite element analysis, the volume distribution of the heat generated by the welding process was described by a mathematical function. Originally, for the FCAW, a double ellipsoidal distribution was considered based on the work of Goldak [32]. The shape of this heat source is shown in Figure 9. A mathematical function of the double ellipsoidal model is presented as follows:
q ( x , y , z , t ) = 3 6 3 f f , r Q a f , r b c π π e 3 ( ( x + ν ( τ t ) ) 2 a f , r 2 + y 2 b 2 + z 2 c 2 )
where q is the volume heat flux; ν is the welding velocity; the parameters a f , a r , b , and c describe the dimensions of the heat source; a lag factor τ defines the position of the heat source at t = 0; and f is the fraction of the heat deposited in the front and rear parts, which was f f + f r = 2 in this simulation. f f and f r were 1.33 and 0.67, respectively. Finally, Q is the magnitude of the heat input expressed by
Q = η U I
where η is the welding thermal efficiency, U is the welding voltage, and I is the welding current. The heat source for the moving welding arc was modeled by a user DFLUX subroutine in ABAQUS. Table 3 shows the parameters of the heat sources considered in the present study.

3.3. Thermal Analyses

The whole heat transfer process including welding, cooling by the air, and chilling by LN2, based on Fourier’s law for transient heat transfer analysis, is illustrated as follows [33]:
{ x ( K ( T ) T x ) + y ( K ( T ) T y ) + z ( K ( T ) T z ) } + Q ν   ( t , T ) = ρ ( T ) c ( T ) T t
where x , y , and z denote the Cartesian coordinates. K ( T ) is thermal conductivity; c ( T ) is the specific heat. T is the current temperature. ρ ( T ) is the density of the based metal. In addition, the internal heat generation rate is Q ν . The simulated model shows the transient heat transfer. An initial condition is prescribed at time t = 10 5 s, which is set as the first ambient temperature. A specified initial temperature, which is also the ambient temperature on the entire welding plate, is given by
T ( x , y , z , 10 5 ) = T
where T is the temperature of ambient, and it is set to 25 °C in this study. Owing to the influence of phase transformation on welding deformation, the welding residual stress is inconsequential in low-carbon steel. The transformation of the solid-state phase is neglected in the welding simulation progress [34]. During the welding process, the heat losses to the ambient on all surfaces of the specimen are attributed to convection and radiation. Heat losses due to convection are considered for the whole surface based on Newton’s law:
Q c o n v = h c o n v ( T T )
where h c o n v is the convection heat transfer coefficient, which was approximated to be 25 W/(m2 °C4). Radiation losses are accounted for on all the surfaces using the Stefan–Boltzmann law:
Q r a d = ε σ ( T 4 T 4 )
where ε is the emissivity of the steel plate, which was set to 0.9. The Stefan–Boltzmann constant σ is approximately 5.675 × 10⁻⁸ W/(m2 °C4). The absolute zero temperature is −273.5 °C. For the chilling process, the convective heat transfer between the surface of the steel in the trough and LN2 is presented by
Q c o n v = h ( T T n )
where h is the convective heat transfer coefficient of LN2. T n = −196 °C expresses the temperature of LN2 as a coolant.

3.4. Mechanical Analyses

The temperature history received from the previous step was used as an input loading for mechanical analysis. The identical finite element models with meshing sizes equal to those in the thermal analysis were employed for the entire mechanical analysis, except for the analysis of the boundary condition and element type. The total strain at any node in the welded plate is defined as follows:
ε t o t a l = ε e + ε p + ε t h e r
where ε t o t a l , ε e , ε p , and ε t h e r are the total, elastic, plastic, and thermal strains, respectively. In this study, Hooke’s law with the temperature-dependent Young’s modulus and Poison’s ratio were employed to model the elastic strain. In addition to this, for the plastic strain part, the von Mises yield surface and temperature-dependent material properties were used to model plastic strain.

3.5. Numerical Validation

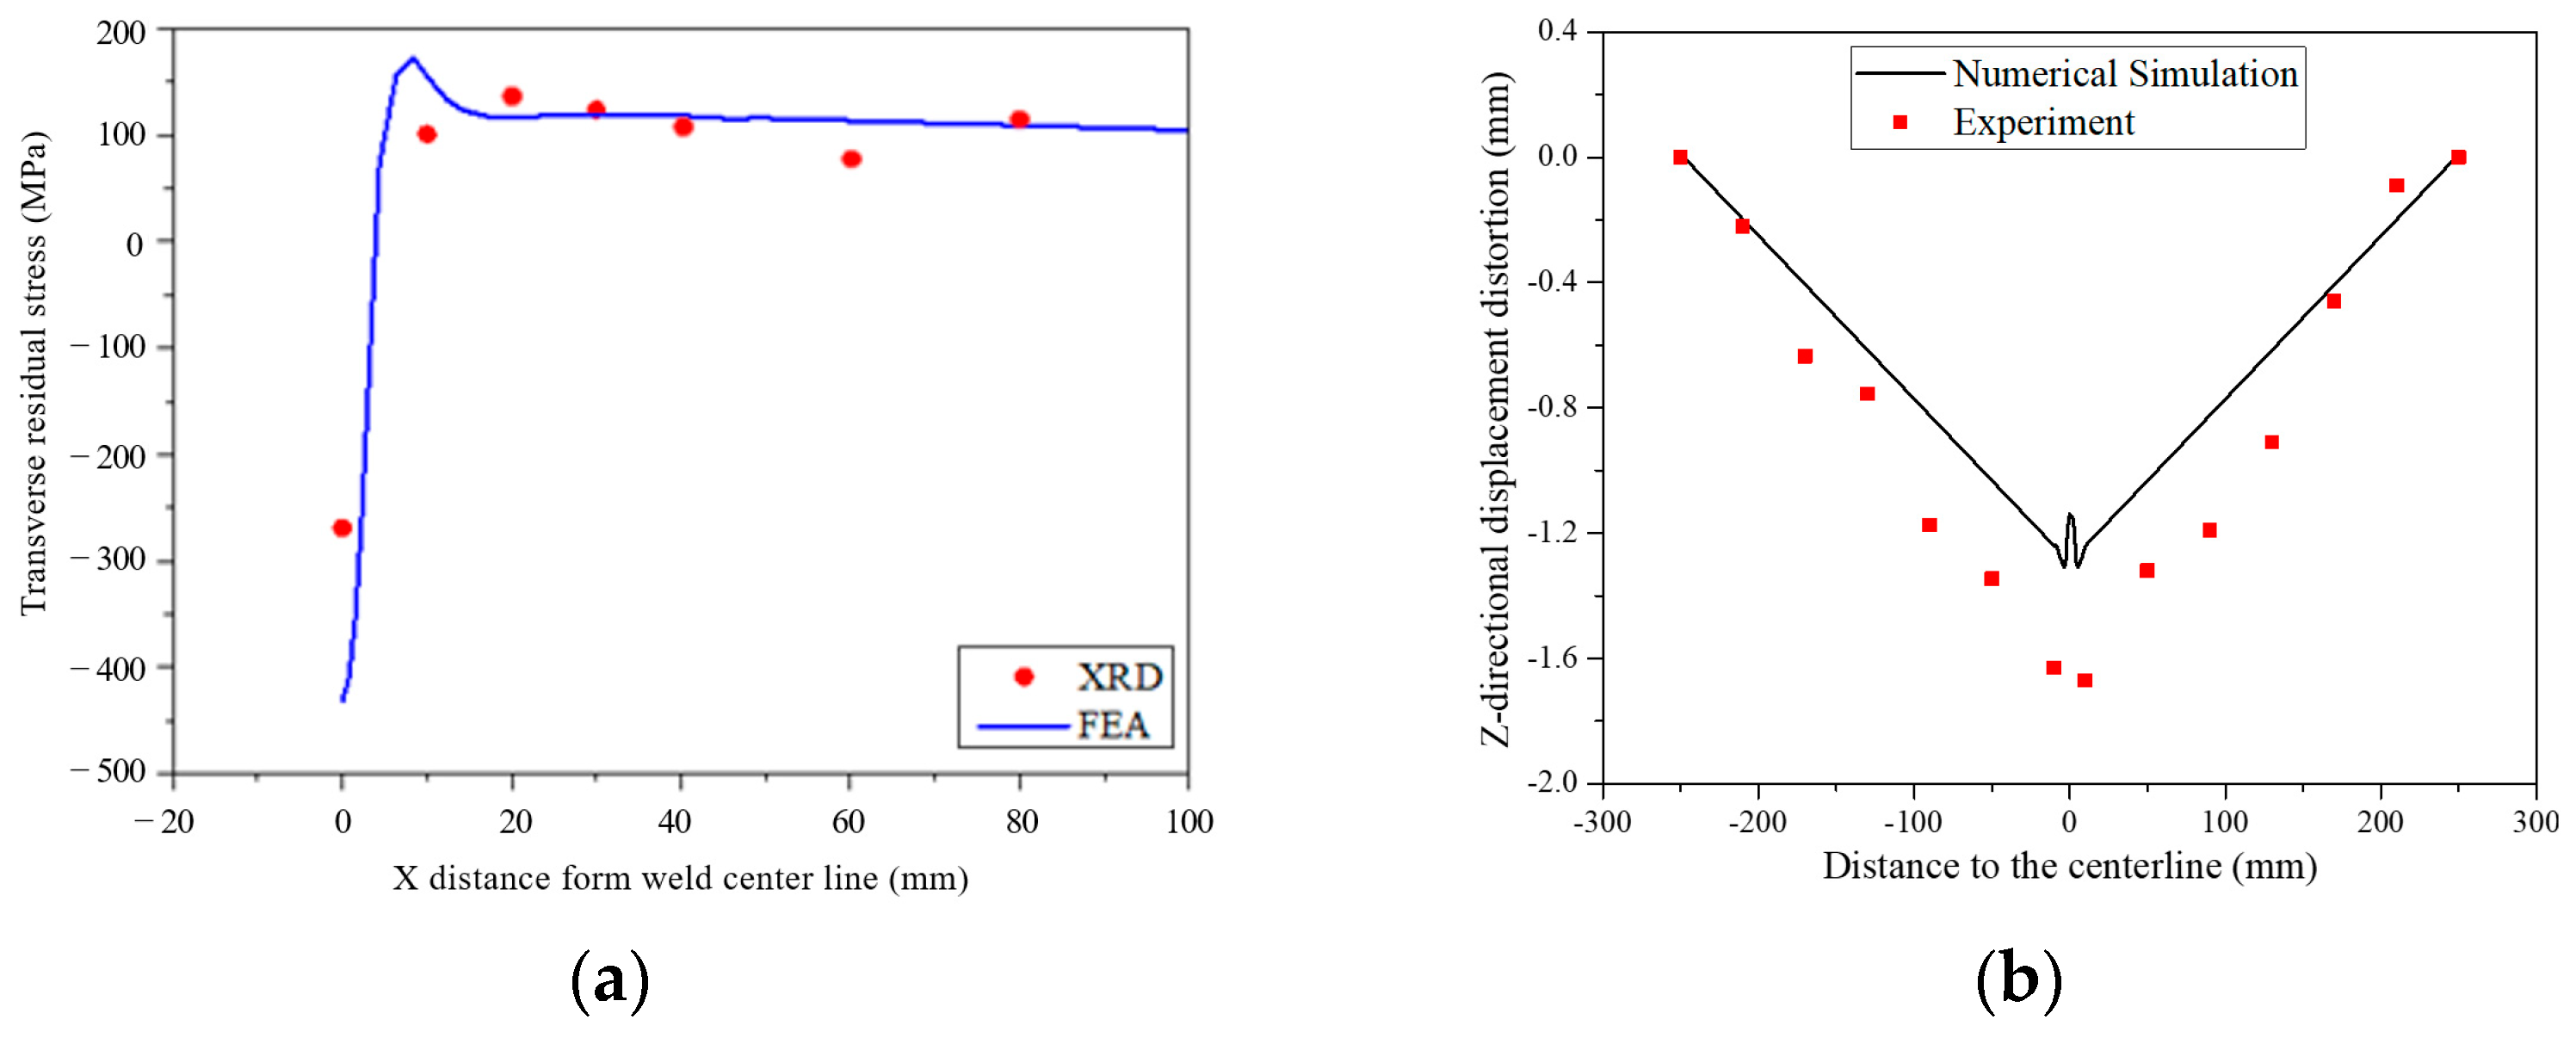
This work measured residual stress after welding and compared the results with the results obtained using the finite element modeling (FEM) approach. Figure 10a compares the results of XRD with the surface transverse stress. Additionally, the Z-directional distortion is also measured and compared between the numerical simulation and the experiment, as shown in Figure 10a. Both comparisons illustrate that the FEA welding analysis reflects the experiment.

4. Results and Discussion

4.1. Cryogenic Liquid Leakage Test

Figure 11a shows an image of the cryogenic liquid leakage test for investigating the temperature conditions of the welded steel plate by exposing the inside of the plate trough to LN2. As shown in the figure, the liquid nitrogen pipeline is located at the center of the trough, and there is no leakage to the outside of the trough. The liquid nitrogen is vaporized once it is supplied to the welded plate due to the difference between the temperatures of the surface of the plate and the liquid nitrogen. After reaching thermal equilibrium, liquid nitrogen can be supplied to the inside of the trough. When the plate inside of the trough is submerged in LN2, it cools rapidly to the temperature of the LN2 and undergoes significant thermal contraction due to the remarkable reduction in temperature. However, the outside of the trough cools slowly by thermal convection, which leads to minor thermal deformation. Additionally, the welded plate undergoes shrinkage due to the abrupt addition of the cryogenic liquid. However, the adjacent region, which is unaffected by the LN2, suffers relative thermal tensile stress.
Figure 11b shows the time-dependent temperature relationship under cryogenic liquid exposure at six different measurement points. As shown in the figure, the temperature decreases significantly from thermal shock due to the temperature difference between the ambient temperature at the steel plate surface and the temperature of the liquid nitrogen (−196 °C). Subsequently, the temperature decreases quickly and remains approximately constant until the cryogenic liquid supply is terminated. The thermocouples TC1, TC2, and TC5 eventually reach a cryogenic temperature of −196 °C because they contact liquid nitrogen inside the trough. However, the time required to reach a temperature of −196 °C shows different trends, depending on the location of the thermal couples. TC5 and TC2 reach a temperature of −196 °C in approximately 160 s and 280 s, respectively. In the cases of TC3 and TC6, which are located outside the trough, the temperature is maintained at approximately −75 °C by conduction and convection thermal transmission through the plate. In the case of TC4, the temperature is maintained at about −25 °C due to its position at a relatively long distance from the liquid nitrogen inside of the trough. All temperatures increase rapidly with the termination of the liquid nitrogen supply. Finally, the temperature gradually converges to room temperature in the interval between 4000 s and 5000 s.

4.2. Thermal Stress within the Whole Welding Steel Plate

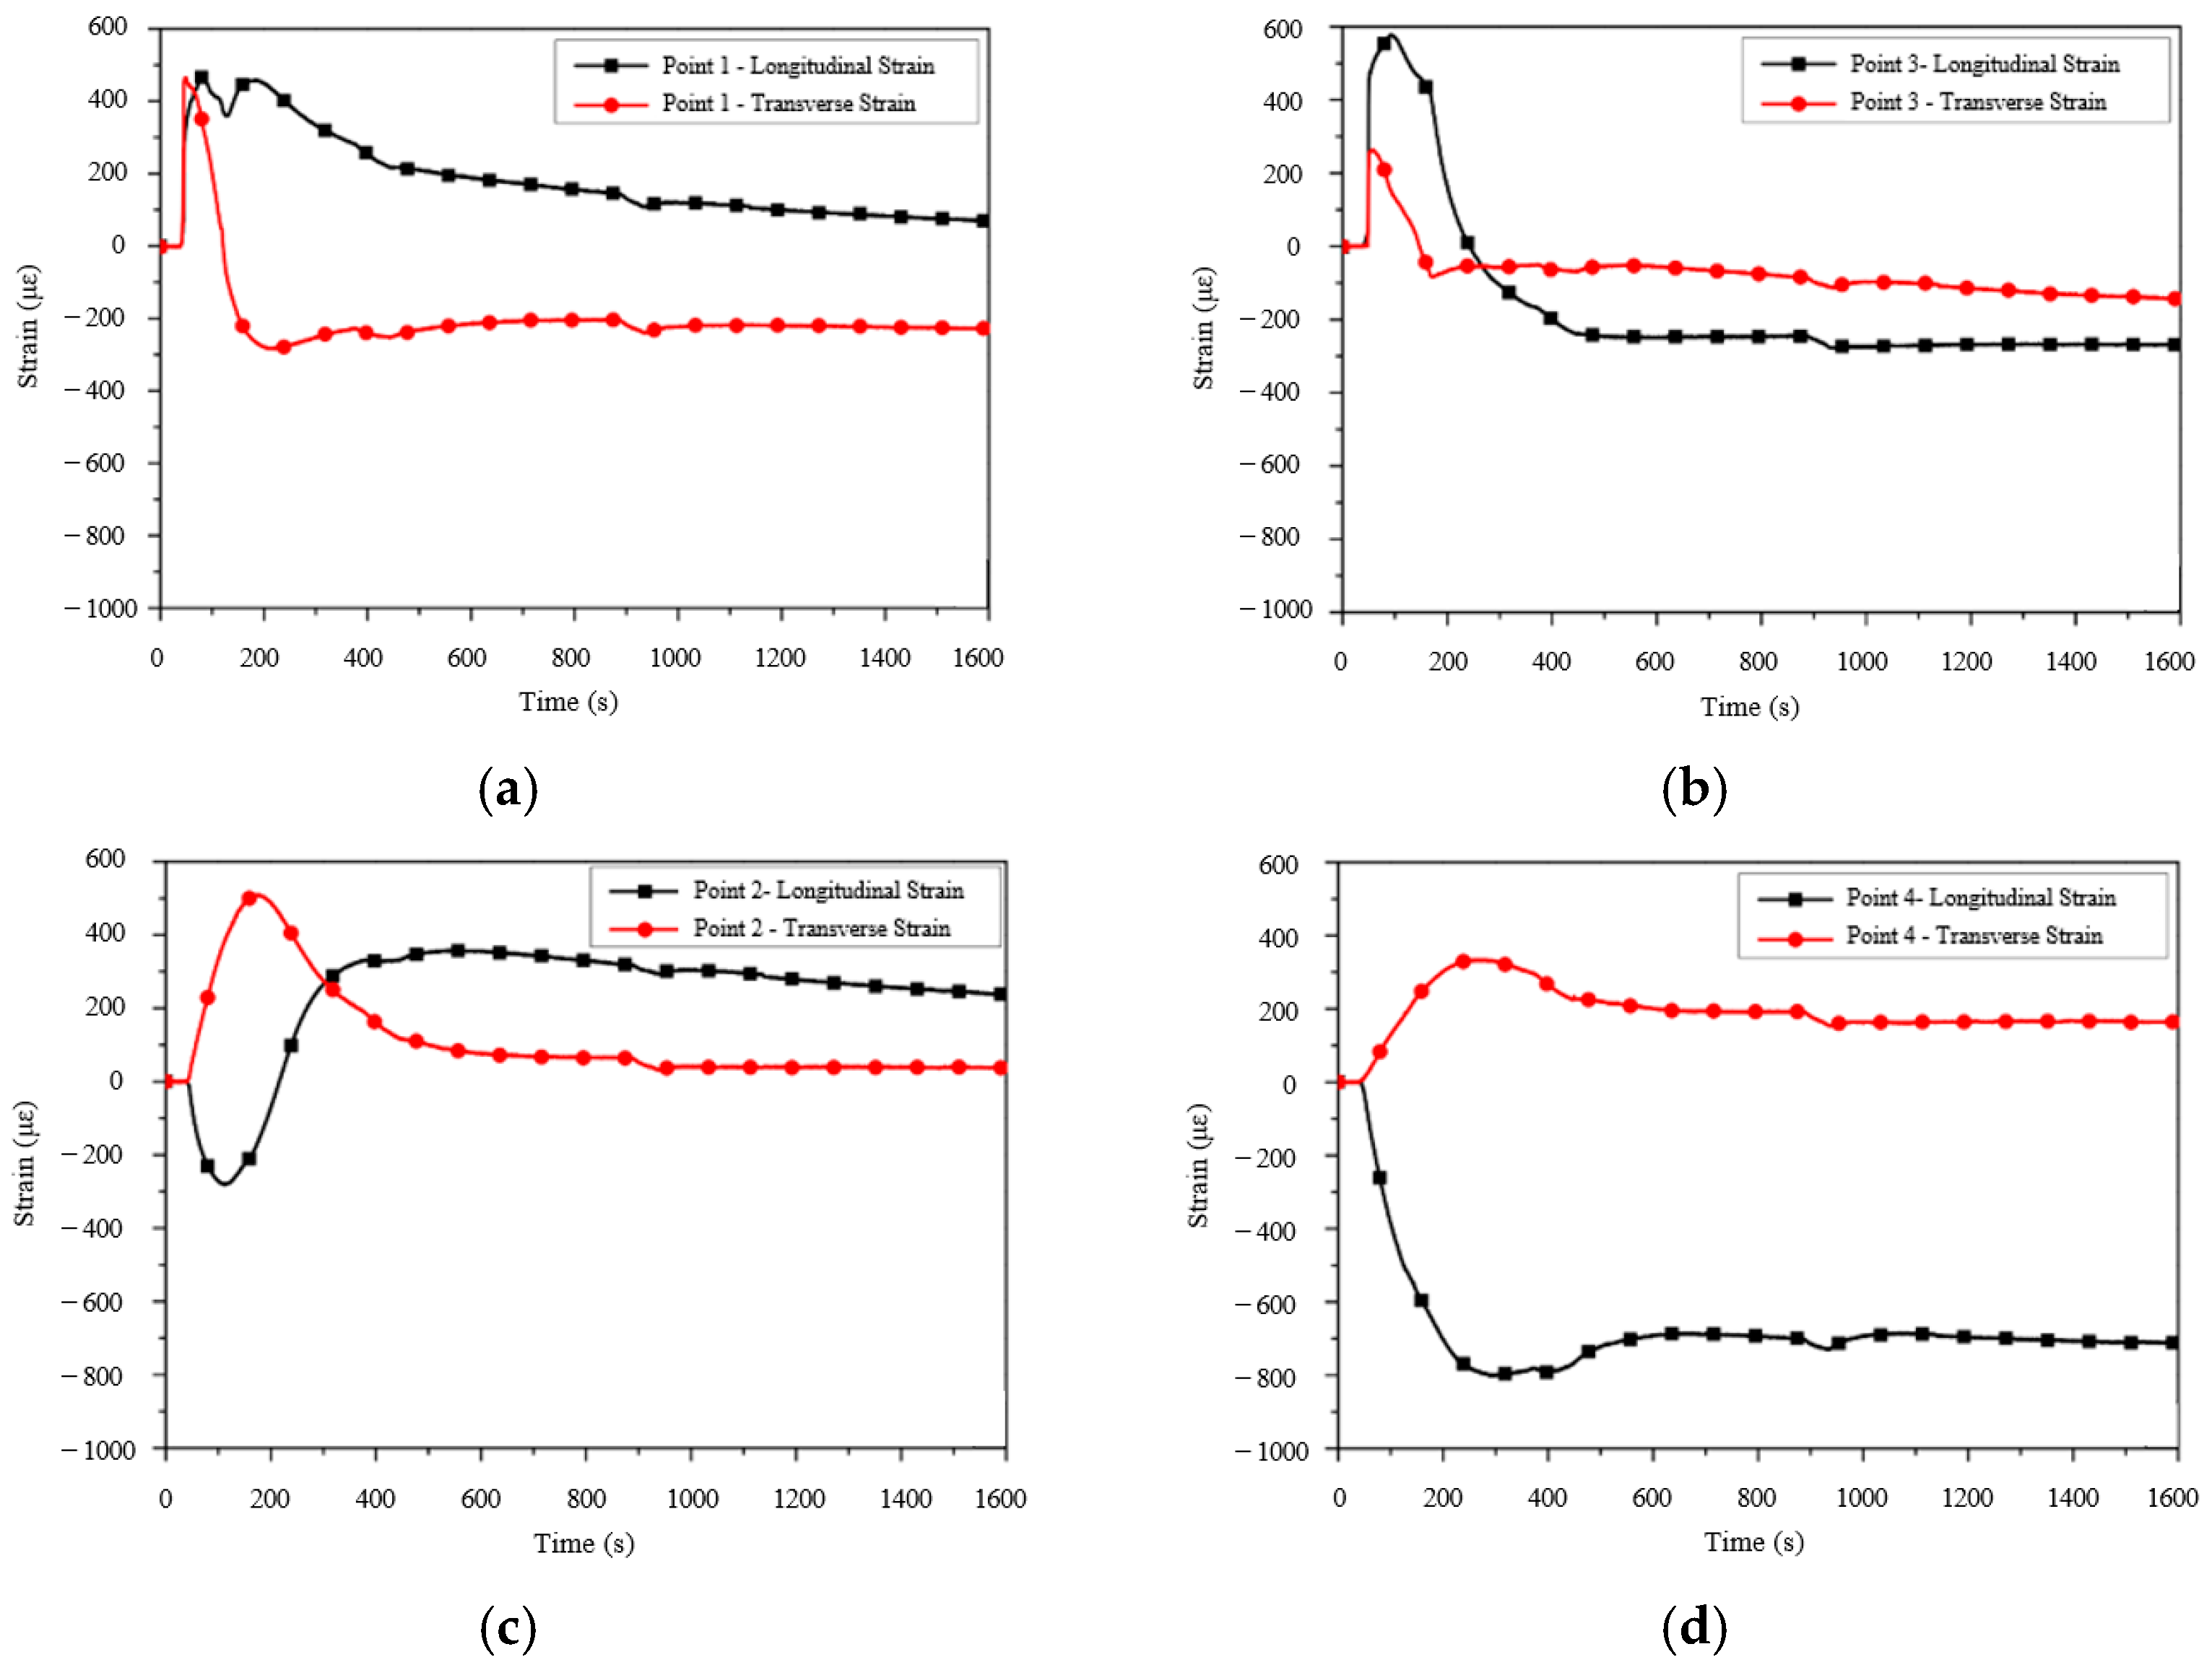
Figure 12 shows the strain curves in the longitudinal and transverse directions at two different strain measurement points in the area that was subjected to direct cryogenic liquid exposure for 1600 s. The present study assumed that the load by weight of LN2 could be neglected. Hence, the welded plate was considered to experience only the strain generated by the cryogenic temperature. As shown in the figures, the strain in both directions varied in a similar way and fluctuated considerably during the first 300 s of cryogenic liquid application. This phenomenon occurred due to a sudden thermal shock, given the significant difference between the temperatures of the steel plate surface and the liquid nitrogen. As shown in Figure 12a for example, the longitudinal and transverse strains suddenly rose between 50 and 100 s and reached about 500 με. Afterward, the strain values fell sharply to about 200 με and −200 με (respectively); the temperature at this point reached −196 °C, and this value remained relatively stable. Due to the difference in thermal expansion coefficients between the welded and the base materials, and due to the boundary constraint, the tensile or compression behavior was different for each measurement point. In particular, at measurement points that were directly exposed to cryogenic temperatures (1 and 3), the strain in the horizontal direction converged to a negative value, as shown in Figure 12a,c. By comparison, Measurement Point 2 underwent less contraction, and little deformation occurred in the horizontal direction, as shown in Figure 12b. The strain in the longitudinal direction converged to a positive value when the constraint was not considered. This occurred because there was no discontinuous section of material in the longitudinal direction, so the resulting expansion–shrinkage behavior was typical. In particular, the tensile strain converged to 200 με. Figure 12d, which shows the strain time history curves at Measurement Point 4, illustrates a remarkable difference from the other measurement points presented above. Firstly, the strain tendencies in the two directions contrasted with each other. Specifically, the vertical strain presented a compression trend, whereas the horizontal strain showed an expansion process. Secondly, the lowest vertical strain value was at approximately −800 με, which is about twice the magnitude of the peak horizontal strain value.

4.3. Numerical Analysis

The nonuniform temperature distribution and rapid heating and cooling both increase the heterogeneous expansion and shrinkage of the fusion zone. It produces residual stresses and unexpected distortions. Similarly, during cryogenic leakage, the area endures a violent cooldown process, transitioning from ambient to ultralow temperatures in a short time. This area experiences alternating tension-compression thermal stresses, due to the variable temperature distribution during the cooldown process. Therefore, accurate simulation of the heat transfer analysis of the welding process and cryogenic leakage process represents a vital prerequisite to ensure the reliability of the residual stress, distortions, and thermal stresses.
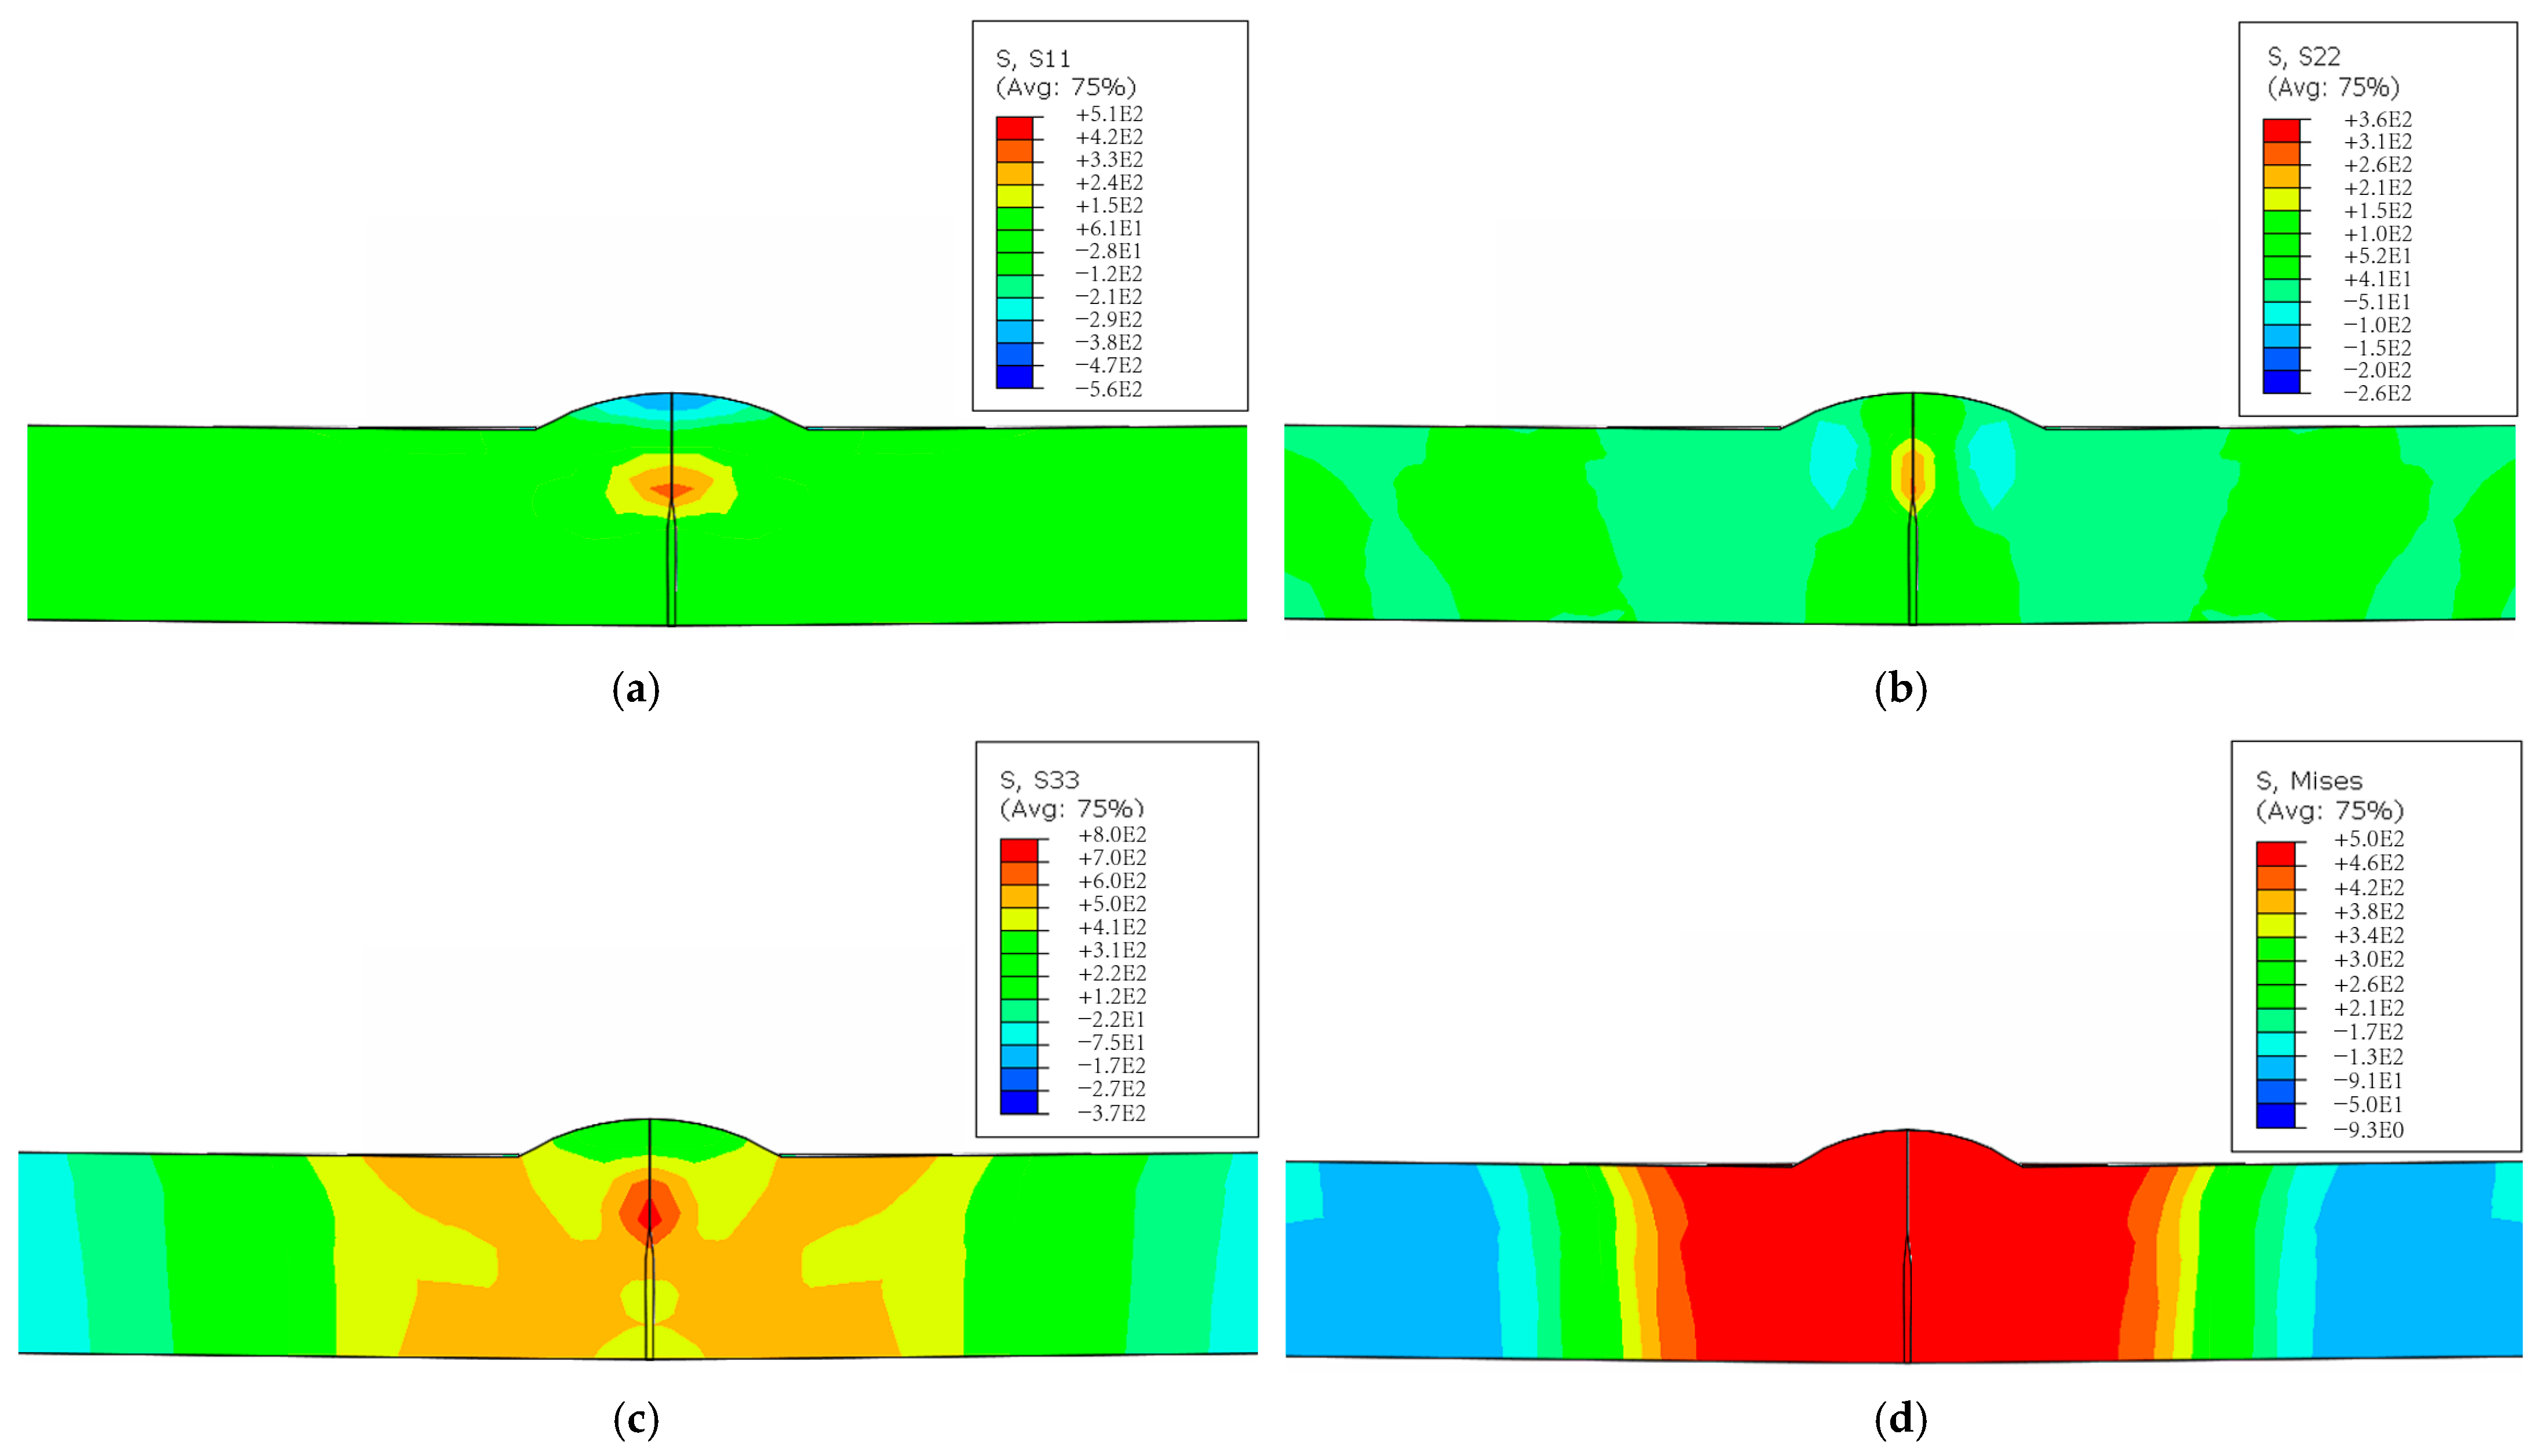
As expressed in Figure 13a–c, the residual stress distribution includes a three-axis stress model: the transverse stress σ x , longitudinal stress σ y , and normal stress σ z , which are perpendicular to the welded joint (X direction), parallel to the welded joint (Y direction) and along the thickness (Z direction), respectively. The transverse stress ranged from −711.9 to 749.2 MPa and the longitudinal stress varied from −255.7 to 358.9 MPa. The maximum and minimum of normal residual stress were −367.0 MPa and 799.0 MPa, respectively. The transverse stress in the fusion zone (FZ) and the heat-affected zone (HAZ) reached a higher concentration than the other areas, as shown in Figure 13a. The stress profiles of von Mises equivalent stress were calculated as well, to consider the final residual stress state. Figure 13d highlights the equivalent stress distribution, in which there was a significant stress concentration in both the FZ and neighboring HAZ. The maximum value of the equivalent stress was 502 MPa, coupled with the appearance of a minor plastic deformation on the weld bead.
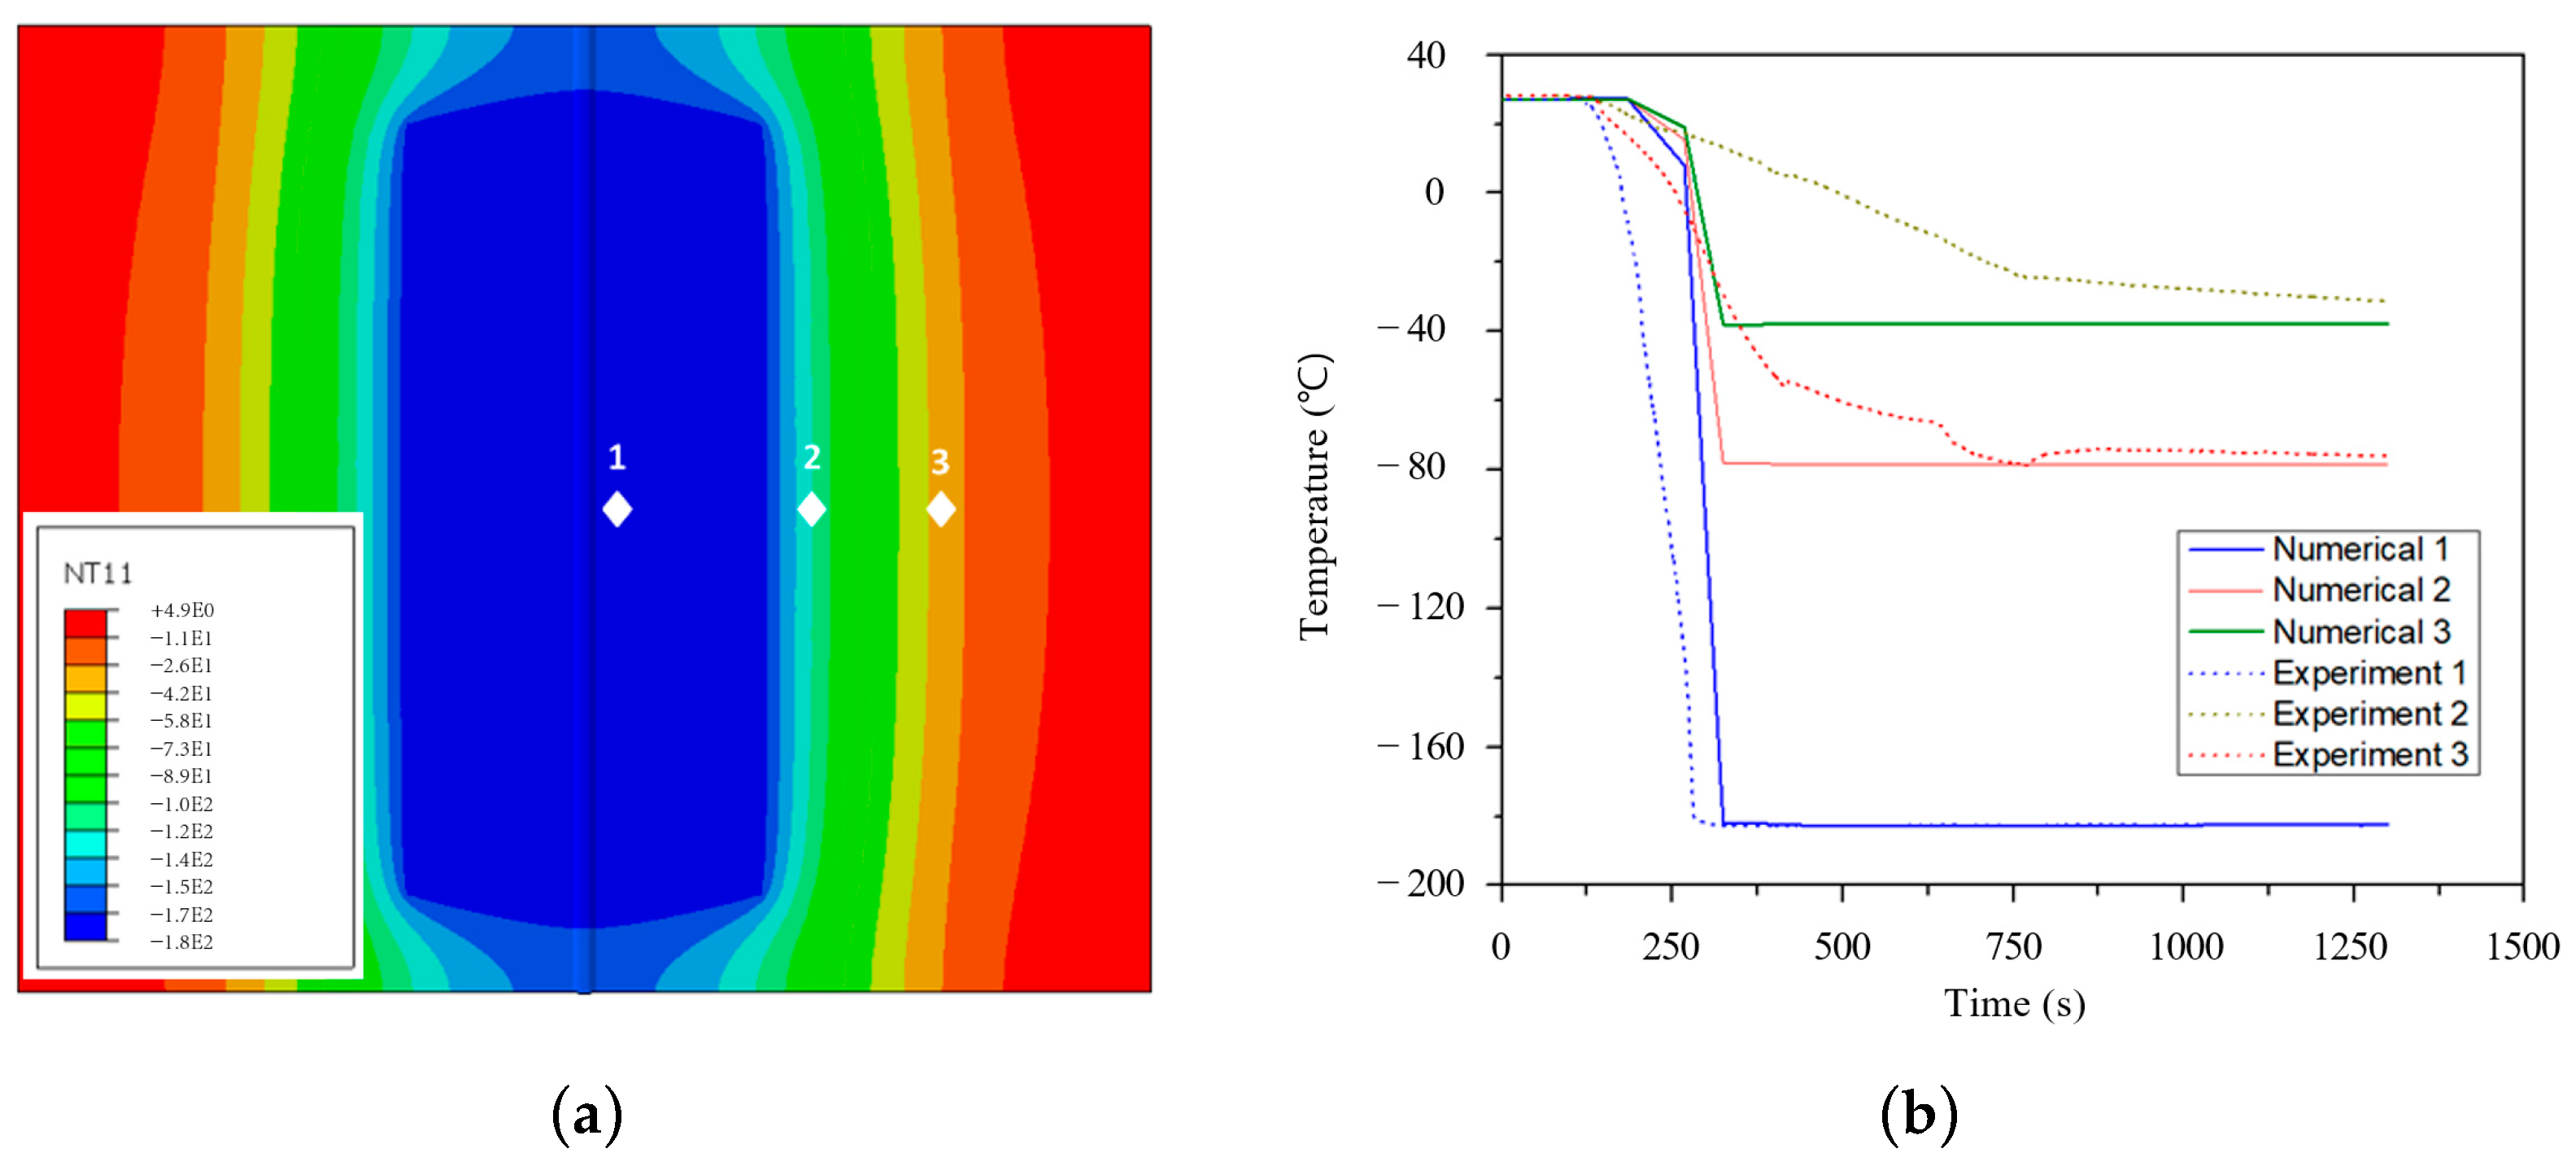
Figure 14 displays comparisons of the temperature curves between the cryogenic leakage experimental measurements and FEM at various points. The figure presents that the simulation temperature at Point 1 matches the experimental temperature curve well, in terms of slope, trend, and value. Although there was a relative difference in the temperature curves’ slopes (experiment and numerical simulation), both curves trended similarly, and their values are approximately equal. The temperatures were recorded at about −196 °C at Point 1 and around −75 °C at Point 2. The maximum temperature at Point 3 obtained from experimental measurements and numerical simulation was approximately −25 °C. With this simplification, the predicted results from the FE analysis agreed with the experimental measurements.
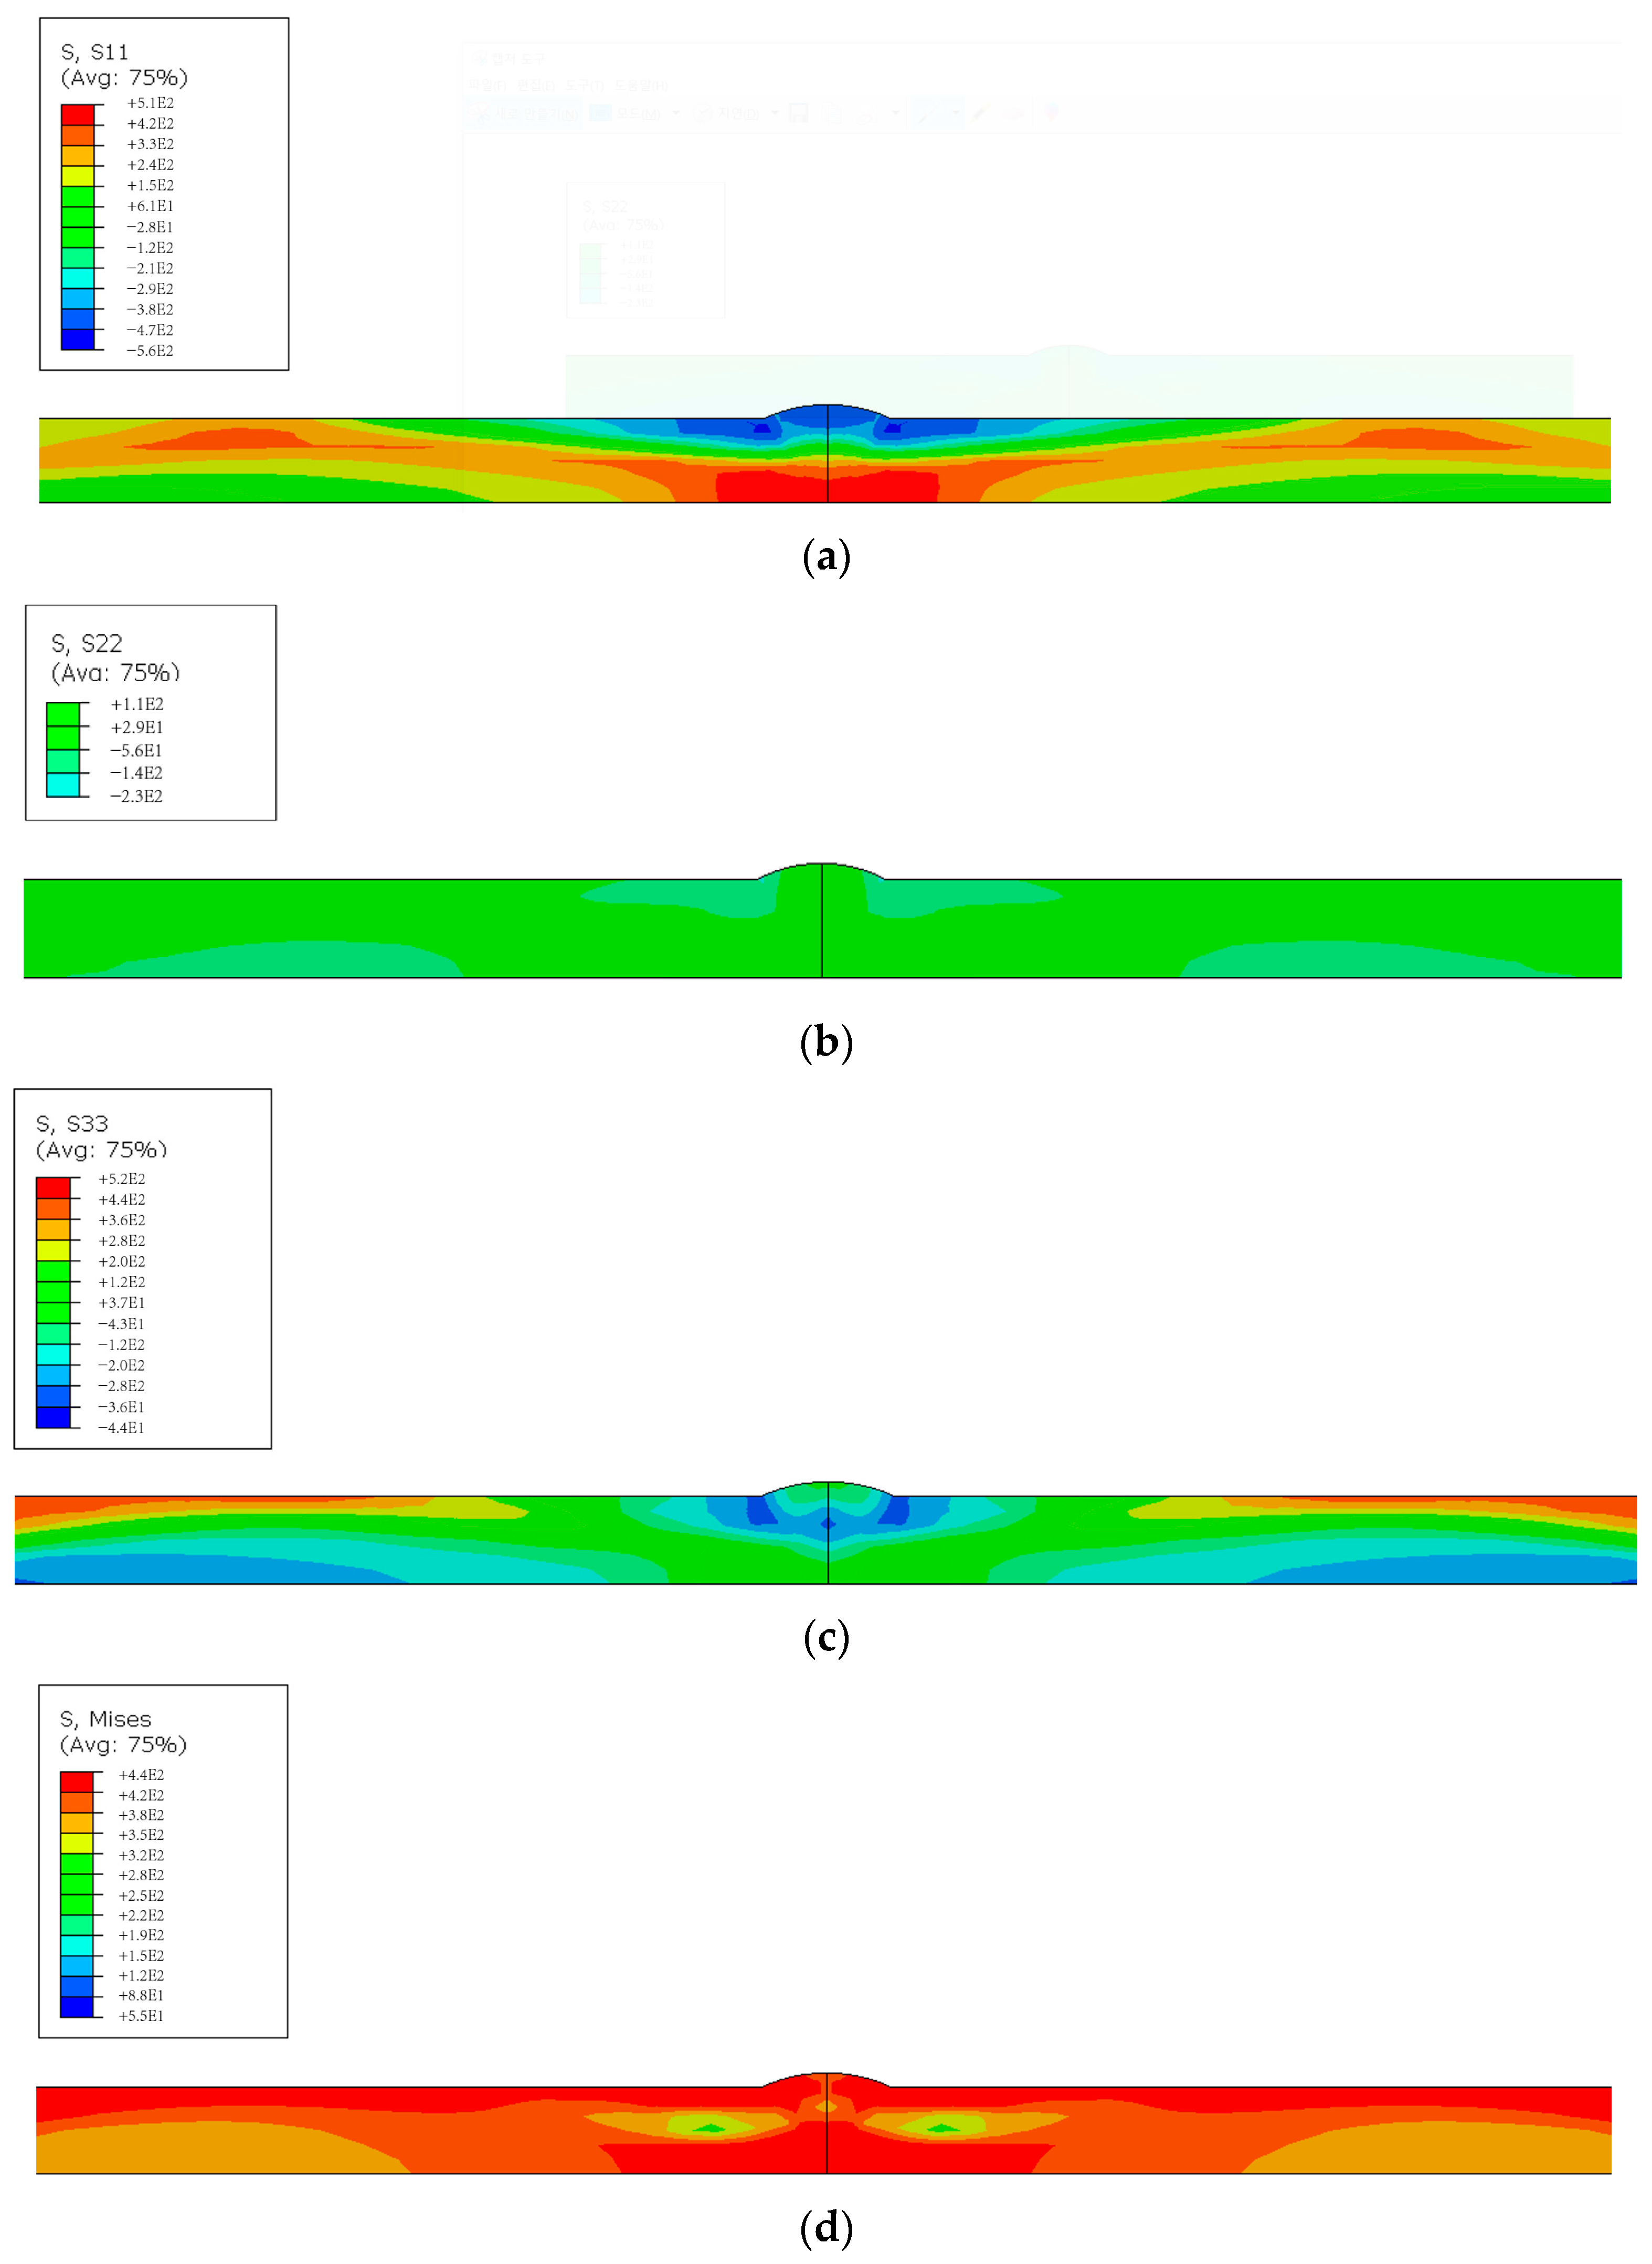
Stress simulation was also performed with directional and von Mises stresses. Unlike the relatively even distribution of Y-direction stress, Figure 15a illustrates that compressive stress was measured on the surface where LN2 contacted, and tensile stress was measured on the opposite surface. This distribution reverses as the distance from the weld point increases. Z-direction and stress, as shown in Figure 15c, show compressive stress around the weld point and tensile stress at a distance from the surface. Additionally, von Mises stress exceeded the yield strength, as shown in Figure 15d.
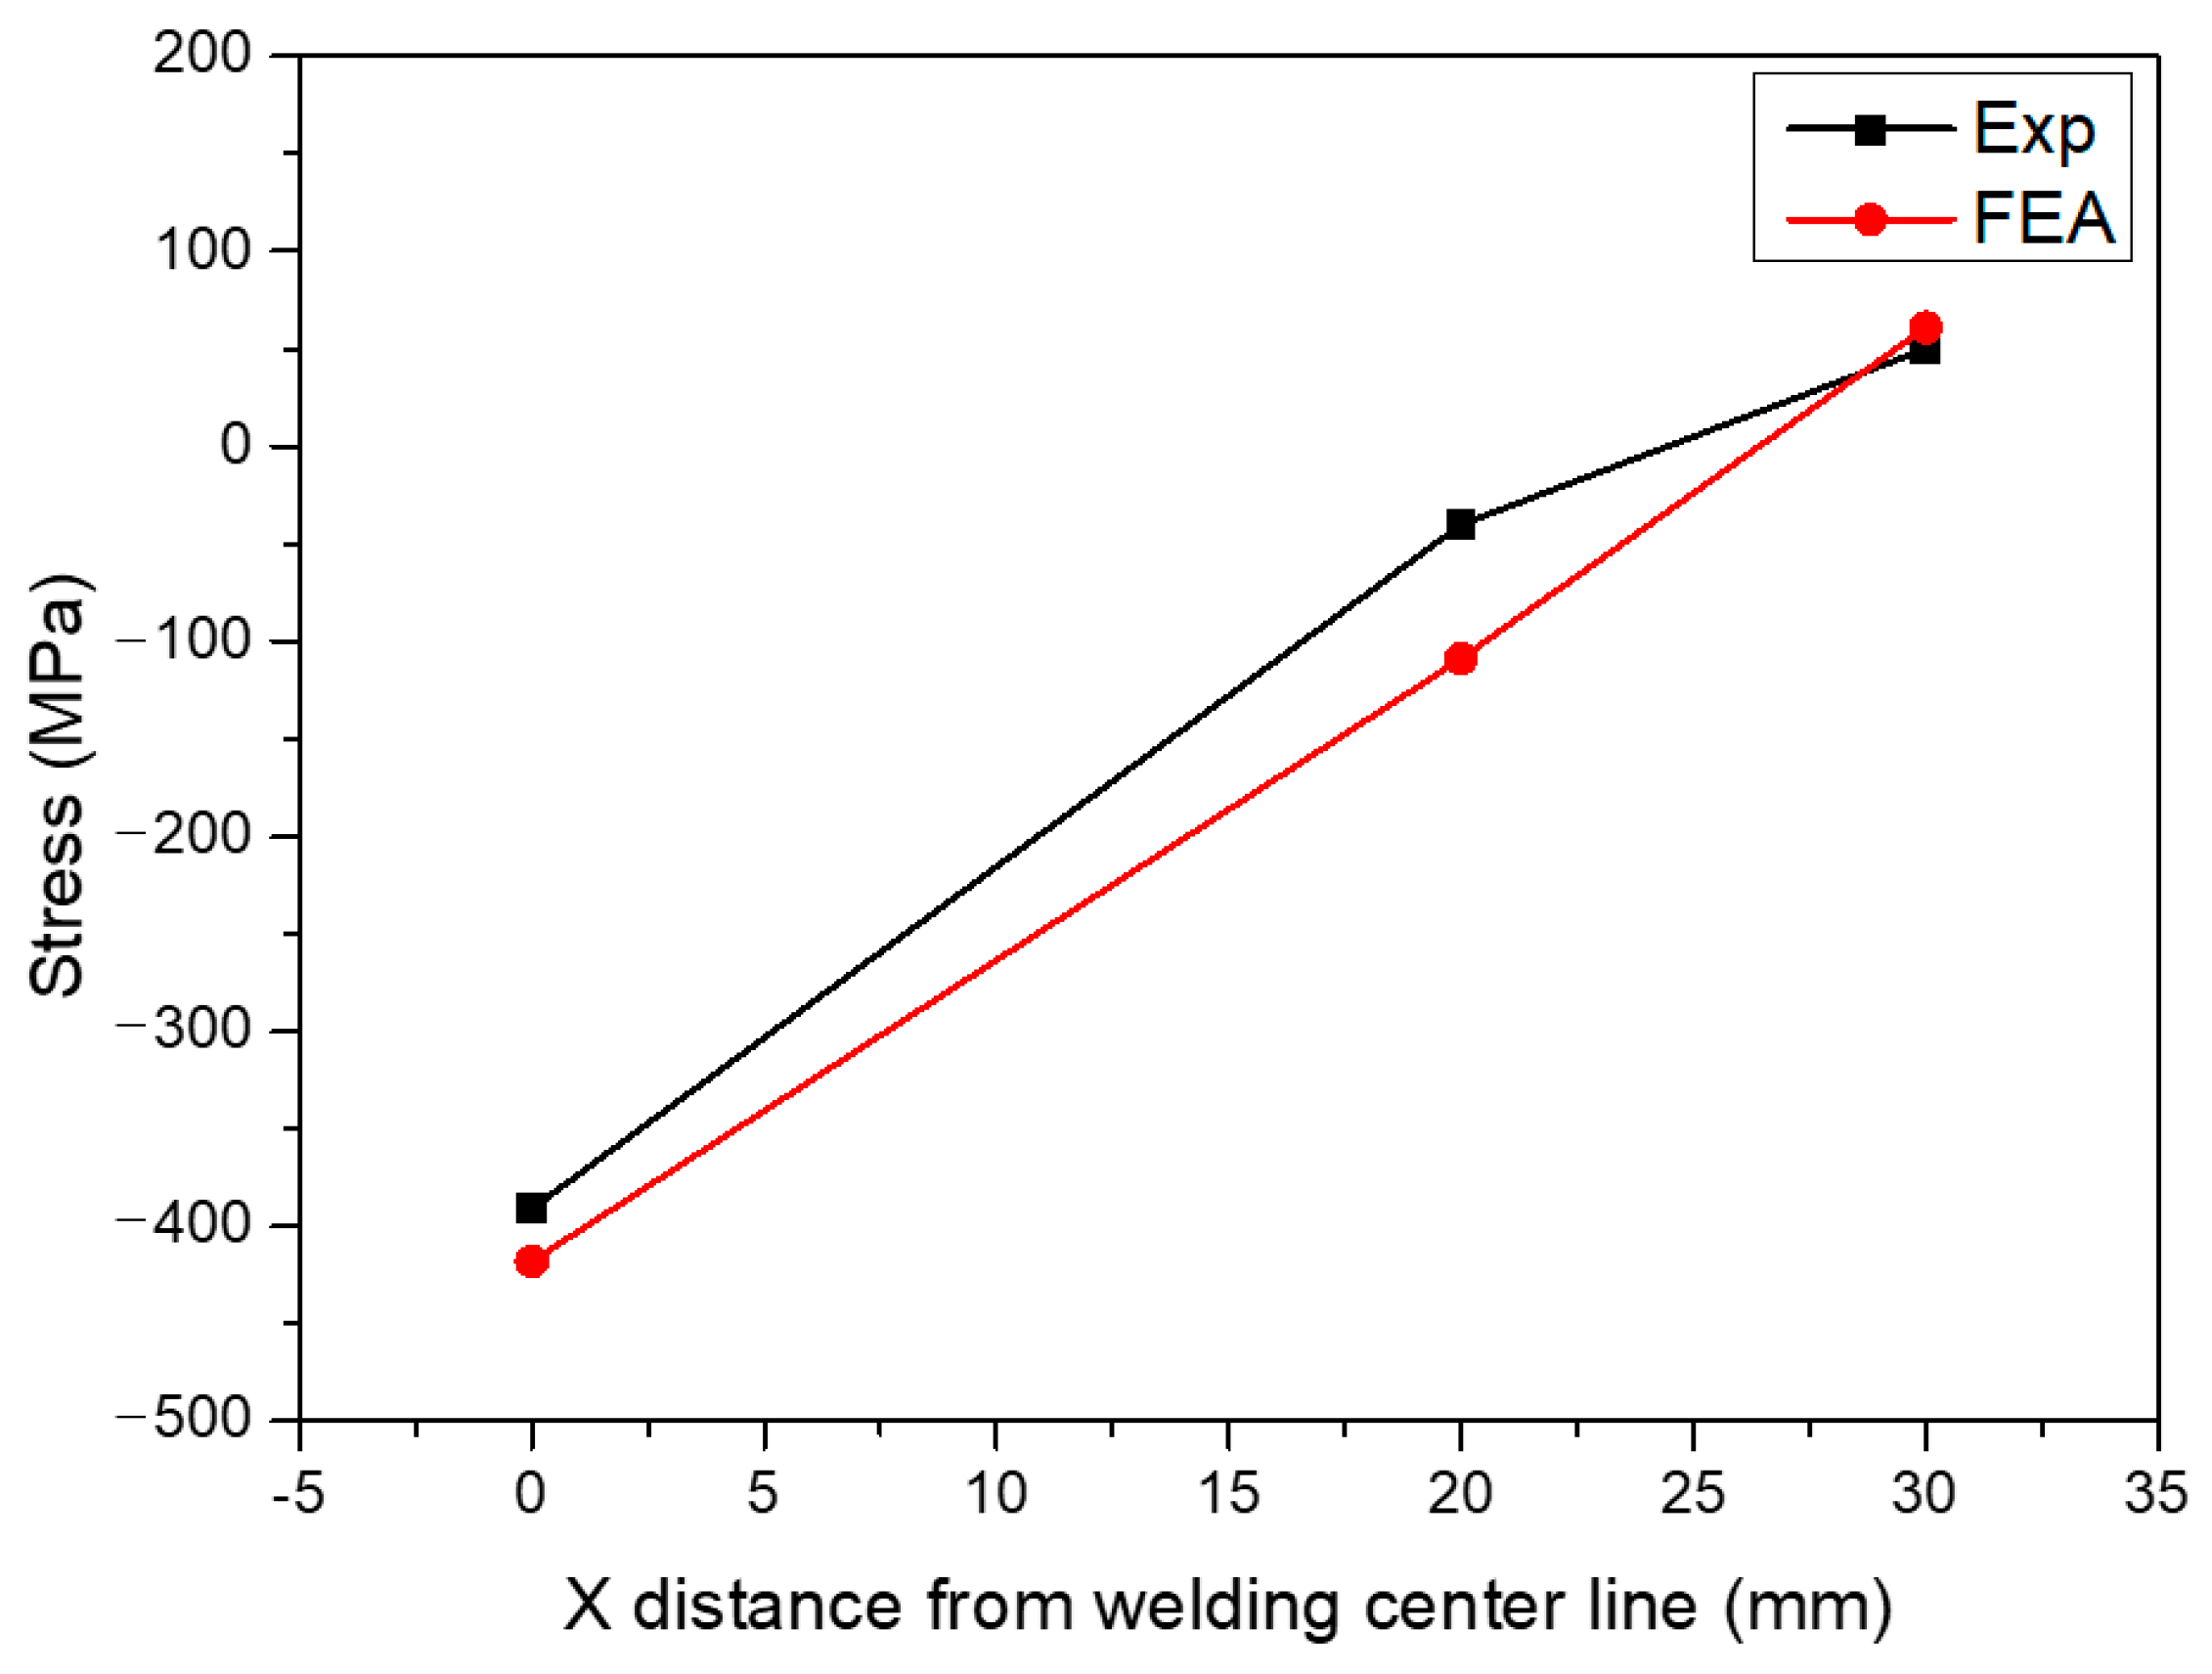
As shown in Figure 16, comparing the surface stress distribution with the X-direction stress measured using XRD yields a similar result. The comparison of the results of the temperature and stress distributions illustrates the need to consider residual stress in the analysis and design stage.

5. Conclusions

In the present study, we conducted an experimental and numerical investigation of the cryogenic leakage on a plate structure of AH36-grade steel that contained welded joints. To achieve this, a welded plate was exposed to liquid nitrogen to simulate a cryogenic leakage condition. In addition, a three-dimensional finite element model was developed to simulate the FCAW process and the cryogenic leakage process. Based on the results obtained from this work, the following conclusions were drawn.
  • When the plate inside of the trough was submerged in LN2, it cooled rapidly to the same temperature as the LN2 and experienced significant thermal contraction due to the remarkable temperature reduction.
  • After approximately 650 s, the thermocouples located outside of the trough measured approximately −75 °C and −25 °C, depending on their location.
  • Due to the sudden thermal shock, the strain in both directions varied in a similar way and fluctuated considerably during the first 300 s of cryogenic liquid application.
  • The residual stress of the weldments as measured in relation to the distance of the weld center line showed good agreement between the experimental and FEM approach.
  • Although there was a relative difference in the results, the experiment and numerical simulation results for temperature and stress distribution obtained showed a similar trend.
Ship structures, which are made up of thousands of types of equipment, require a welding process for their fabrication and assembly. Therefore, it can be said that the welding process is a very important production technology in the shipbuilding industry. Eco-friendly ships that use cryogenic liquefied gases, such as LNG and liquid hydrogen (LH2), have received considerable attention in shipbuilding. In the present study, the effect on welds of leakage of the cryogenic liquid gas was analyzed. The results could be used in the ship design stage adopting welded structures as a basic database.

Author Contributions

Conceptualization, D.H.K. and L.T.D.; methodology, K.-B.P. and Y.-H.C.; investigation, J.-H.K. and S.-K.K.; writing—original draft preparation, D.H.K., L.T.D. and K.-B.P.; resources, J.-H.K. and J.-M.L.; writing—review and editing, Y.-H.C. and S.-K.K. All authors have read and agreed to the published version of the manuscript.

Funding

This work was supported by the Korea Institute of Energy Technology Evaluation and Planning (KETEP) and the Ministry of Trade, Industry & Energy (MOTIE) of the Republic of Korea (20224000000090). This research was supported by the Development and Demonstration of On-Board Marine Debris Disposal Modules Program of the Korea Institute of Marine Science & Technology Promotion (KIMST) funded by the Ministry of Oceans and Fisheries (KIMST-20220494). This work was supported by the R&D Platform Establishment of Eco-Friendly Hydrogen Propulsion Ship Program (No. 20006644) funded by the Ministry of Trade, Industry & Energy (MOTIE, Korea).

Institutional Review Board Statement

Not applicable.

Informed Consent Statement

Not applicable.

Data Availability Statement

The data presented in this study are available on request from the corresponding author.

Conflicts of Interest

The authors declare no conflict of interest.

References

  1. Jeon, S.G.; Kim, J.H.; Kim, J.D.; Jeong, Y.J.; Kim, H.T.; Kim, S.K.; Lee, J.M. Impact failure characteristics of LNG carrier cargo containment system. Int. J. Mech. Sci. 2023, 240, 107938. [Google Scholar] [CrossRef]
  2. Jeong, J.C.; Lee, D.H.; Kim, S.K.; Kim, J.H.; Lee, J.M. Cryogenic reliability evaluation of glass fabric-reinforced composites using novel slip-prevention method. Materials 2023, 16, 121. [Google Scholar] [CrossRef] [PubMed]
  3. Kim, M.S.; Kim, H.T.; Choi, Y.H.; Kim, J.H.; Kim, S.K. A new computational method for predicting ductile failure of 304L stainless steel. Metals 2023, 12, 1309. [Google Scholar] [CrossRef]
  4. Chul Kim, B.; Ho Yoon, S.; Gil Lee, D. Pressure resistance of the corrugated stainless steel membranes of LNG carriers. Ocean Eng. 2011, 38, 592–608. [Google Scholar] [CrossRef]
  5. Oh, D.J.; Lee, J.M.; Chun, M.S.; Kim, M.H. Reliability evaluation of a LNGC insulation system with a metallic secondary barrier. Compos. Struct. 2017, 171, 43–52. [Google Scholar] [CrossRef]
  6. Wegrzyn, J.; Gurevich, M. Liquefied Natural Gas for Trucks and Buses. SAE Tech. Pap. Ser. 2000. [Google Scholar] [CrossRef]
  7. Muzaka, K.; Park, M.H.; Lee, J.P.; Jin, B.J.; Lee, B.R.; Kim, W.Y.I.S. A Study on Prediction of Welding Quality Using Mahalanobis Distance Method by Optimizing Welding Current for A Vertical-position Welding. Procedia Eng. 2017, 174, 60–67. [Google Scholar] [CrossRef]
  8. Seleš, K.; Perić, M.; Tonković, Z. Numerical simulation of a welding process using a prescribed temperature approach. J. Constr. Steel Res. 2018, 145, 49–57. [Google Scholar] [CrossRef]
  9. Lee, J.M.; Seo, H.D.; Chung, H. Efficient welding distortion analysis method for large welded structures. J. Mater. Process. Technol. 2018, 256, 36–50. [Google Scholar] [CrossRef]
  10. Perić, M.; Tonković, Z.; Garašić, I.; Vuherer, T. An engineering approach for a T-joint fillet welding simulation using simplified material properties. Ocean Eng. 2016, 128, 13–21. [Google Scholar] [CrossRef]
  11. Balitskii, A.I.; Dmytryk, V.V.; Ivaskevich, L.M.; Balitskii, O.; Glushko, A.V.; Medovar, L.B.; Abramek, K.F.; Stovpchenko, G.P.; Eliasz, J.J.; Krolikowski, M.A. Improvement of the Mechanical Characteristics, Hydrogen Crack Resistance and Durability of Turbine Rotor Steels Welded Joints. Energies 2022, 15, 6006. [Google Scholar] [CrossRef]
  12. Balyts’kyi, O.I.; Kostyuk, I.F. Strength of welded joints of Cr–Mn steels with elevated content of nitrogen in hydrogen-containing media. Mater. Sci. 2009, 10, 97–107. [Google Scholar] [CrossRef]
  13. Bai, R.; Guo, Z.; Tian, C.; Lei, Z.; Yan, C.; Tao, W. Study on welding sequence of butt-welded structures based on equivalent heat source parameter. Int. J. Press. Vessel. Pip. 2018, 163, 15–22. [Google Scholar] [CrossRef]
  14. Sun, G.F.; Wang, Z.D.; Lu, Y.; Zhou, R.; Ni, Z.H.; Gu, X.; Wang, Z.G. Numerical and experimental investigation of thermal field and residual stress in laser-MIG hybrid welded NV E690 steel plates. J. Manuf. Process. 2018, 34, 106–120. [Google Scholar] [CrossRef]
  15. Bang, H.S.; Bang, H.S.; Kim, Y.C.; Joo, S.M. Analysis of residual stress on AH32 butt joint by hybrid CO2 laser-GMA welding. Comput. Mater. Sci. 2010, 49, 217–221. [Google Scholar] [CrossRef]
  16. Flores-Johnson, E.A.; Muránsky, O.; Hamelin, C.J.; Bendeich, P.J.; Edwards, L. Numerical analysis of the effect of weld-induced residual stress and plastic damage on the ballistic performance of welded steel plate. Comput. Mater. Sci. 2012, 58, 131–139. [Google Scholar] [CrossRef]
  17. Usami, A.; Kishimoto, N.; Kusumoto, H.; Kaneko, F.; Inoue, T. Cryogenic leakage risk analysis for FLNG and use of brittle crack arresting material as a risk mitigation measure. In Proceedings of the SNAME Maritime Convention and 5th World Maritime Technology Conference, Providence, RI, USA, 4–6 November 2015; pp. 1–10. [Google Scholar]
  18. Woodward, J.L.; Pitbaldo, R. LNG Risk Based Safety: Modeling and Consequence Analysis; John Wiley & Sons: Hoboken, NJ, USA, 2010. [Google Scholar]
  19. Li, Y.J.; Fu, R.D.; Li, Y.; Peng, Y.; Liu, H.J. Tensile properties and fracture behavior of friction stir welded joints of Fe-32Mn-7Cr-1Mo-0.3N steel at cryogenic temperature. J. Mater. Sci. Technol. 2018, 34, 157–162. [Google Scholar] [CrossRef]
  20. Ding, H.; Wu, Y.; Lu, Q.; Xu, P.; Zheng, J.; Wei, L. Tensile properties and impact toughness of S30408 stainless steel and its welded joints at cryogenic temperatures. Cryogenics 2018, 92, 50–59. [Google Scholar] [CrossRef]
  21. Petti, J.P.; Lopez, C.; Figueroa, V.; Kalan, R.J.; Wellman, G.; Dempsey, J.; Villa, D.; Hightower, M. LNG Vessel Cascading Damage Structural and Thermal Analyses; Sandia National Laboratories: Albuquerque, NM, USA; Livermore, CA, USA, 2013.
  22. Kalan, J.K.; Petti, J.P. LNG Cascading Damage Study Volume I: Fracture Testing Report; Sandia National Laboratories: Albuquerque, NM, USA; Livermore, CA, USA, 2011. [CrossRef]
  23. Kang, Z.; Yanzhong, L.; Yuan, M.; Lei, W.; Fushou, X.; Jiaojiao, W. Experimental study on cool down characteristics and thermal stress of cryogenic tank during LN2 filling process. Appl. Therm. Eng. 2018, 130, 951–961. [Google Scholar] [CrossRef]
  24. Mizutani, Y.; Hiratsuka, T.; Tanabe, H.; Takemoto, M. Damage analysis of CFRP plates exposed to cryogenic shock by AE monitoring. Adv. Compos. Mater. Off. J. Jpn. Soc. Compos. Mater. 2005, 14, 99–111. [Google Scholar] [CrossRef]
  25. Abaqus, Version 6.14 Documentation; Dassault Systemes Simulia Corporation: Providence, RI, USA, 2014.
  26. Crupi, V.; Guglielmino, E.; Maestro, M.; Marinò, A. Fatigue analysis of butt welded AH36 steel joints: Thermographic Method and design S-N curve. Mar. Struct. 2009, 22, 373–386. [Google Scholar] [CrossRef]
  27. Anderoglu, O. Residual Stress Measurement Using X-Ray Diffraction. Ph.D. Thesis, Texas A&M University, College Station, TX, USA, 2004; pp. 1–64. [Google Scholar]
  28. Tsirkas, S.A.; Papanikos, P.; Kermanidis, T. Numerical simulation of the laser welding process in butt-joint specimens. J. Mater. Process. Technol. 2003, 134, 59–69. [Google Scholar] [CrossRef]
  29. Derakhshan, E.D.; Yazdian, N.; Craft, B.; Smith, S.; Kovacevic, R. Numerical simulation and experimental validation of residual stress and welding distortion induced by laser-based welding processes of thin structural steel plates in butt joint configuration. Opt. Laser Technol. 2018, 104, 170–182. [Google Scholar] [CrossRef]
  30. Ventura, G.; Perfetti, M. Thermal Properties of Solids at Room and Cryogenic Temperatures; Springer: Berlin, Germany, 2014. [Google Scholar]
  31. Bradley, P.E.; Radebaugh, R. Properties of Selected Materials at Cryogenic Temperatures; CRC Press: Boca Raton, FL, USA, 2013. Available online: https://www.nist.gov/publications/properties-selected-materials-cryogenic-temperatures (accessed on 24 February 2023).
  32. Goldak, J.A.; Akhlaghi, M. Computational Welding Mechanics; Springer Science & Business Media: Berlin, Germany, 2005. [Google Scholar]
  33. Logan, D.L. First Course in The Finite Element Method; University of Wisconsin-Platteville: Platteville, WI, USA, 2010. [Google Scholar]
  34. Deng, D.; Murakawa, H. Prediction of welding distortion and residual stress in a thin plate butt-welded joint. Comput. Mater. Sci. 2008, 43, 353–365. [Google Scholar] [CrossRef]
Figure 1. (a) Geometry of the Y-groove joint and (b) schematic diagram of the FCAW process.
Applsci 13 03132 g001
Figure 2. Schematic of the experimental setup of the cryogenic liquid leakage test.
Applsci 13 03132 g002
Figure 3. (a) Arrangement and (b) layout of strain gauges at each testing point.
Applsci 13 03132 g003
Figure 4. Arrangement and layout of the thermocouples at each measurement point.
Applsci 13 03132 g004
Figure 5. Experimental setup of the XRD measurement.
Applsci 13 03132 g005
Figure 6. Flow chart of the procedure for the FE calculation.
Applsci 13 03132 g006
Figure 7. Temperature-dependent material properties of AH36 steel plate: (a) thermal properties and (b) mechanical properties.
Applsci 13 03132 g007
Figure 8. Finite element of the fully adopted mesh for all thermal and mechanical analysis.
Applsci 13 03132 g008
Figure 9. Double ellipsoidal heat source of the welding process.
Applsci 13 03132 g009
Figure 10. Validation of the experiment data and numerical simulation for: (a) transverse residual stress and (b) Z-directional displacement distribution.
Applsci 13 03132 g010
Figure 11. (a) Image of LN2 exposure on the welded steel plate and (b) the typical cooldown curves of test points during the LN2 experiment.
Applsci 13 03132 g011
Figure 12. The strain curves in the longitudinal and transverse directions: (a) Point 1, (b) Point 2, (c) Point 3, and (d) Point 4.
Applsci 13 03132 g012
Figure 13. Simulated residual stress components in the weldment: (a) transverse stress, (b) longitudinal stress, (c) normal stress, and (d) von Mises equivalent residual stress.
Applsci 13 03132 g013
Figure 14. Validation of temperature distribution between simulation and experiment for (a) the measured points, and (b) comparing numerical results to experiment data.
Applsci 13 03132 g014
Figure 15. Stress components after liquid nitrogen exposure: (a) transverse stress σ x , (b) longitudinal stress σ y , (c) normal stress σ z , and (d) von Mises equivalent residual stress.
Applsci 13 03132 g015
Figure 16. Validation between FEA and experiment.
Applsci 13 03132 g016
Table 1. Chemical compositions of AH36 steel.
CSiMnPSNiCr
0.180.10–0.501.220.0350.0350.0400.20
Table 2. Boundary conditions and material properties for the.
ConditionValue
Initial temperature25 °C
Analysis time2000 s
Convection (25 °C)25 W/m2 °C
Convection (−196 °C)1000 W/m2 °C
Thermal conductivity (25 °C)39.17 W·m−1·K−1
Thermal conductivity (−196 °C)21.71 W·m−1·K−1
Specific heat (25 °C)457.7 J·kg−1·C−1
Specific heat (−196 °C)162.6 J·kg−1·C−1
Table 3. Parameters of the heat source.
Parameterafacbc
Value (mm)0.10–0.501.220.0350.035
Disclaimer/Publisher’s Note: The statements, opinions and data contained in all publications are solely those of the individual author(s) and contributor(s) and not of MDPI and/or the editor(s). MDPI and/or the editor(s) disclaim responsibility for any injury to people or property resulting from any ideas, methods, instructions or products referred to in the content.