Article

Parallel Water Column Technique for Obtaining a Smooth Output Power of the Pump as a Turbine at a Variable Water Flow Rate

1
Department of Electrical Engineering, Institute of Southern Punjab, Multan 59300, Pakistan
2
Department of Electrical, Electronics, and Communication Engineering Education, Chungnam National University, Daejeon 34134, Republic of Korea
3
Department of Electrical Engineering, The University of Lahore, Lahore 54000, Pakistan
*
Authors to whom correspondence should be addressed.
Appl. Sci. 2023, 13(5), 3232; https://doi.org/10.3390/app13053232
Submission received: 31 January 2023 / Revised: 27 February 2023 / Accepted: 1 March 2023 / Published: 2 March 2023
(This article belongs to the Topic Advances in Renewable Energy and Energy Storage)

Abstract

:
Hydro generation is the simplest and oldest method of electricity generation, with a century of successful operation. Using a pump as a turbine (PAT) is an optimal solution for minimizing the cost, particularly in low-head and small-scale hydro plants. Commercially available centrifugal pumps have become a popular solution for small-scale hydro and pumped-hydro facilities owing to their simple geometry, ease of operation, maintenance, and abundant availability in local markets. Variations in the water flow in hydro facilities, such as pumped-hydro and small-scale hydro facilities, are common; however, a PAT is unable to respond to variable flows because it is a fixed-speed device. To overcome this problem, different techniques have been suggested by researchers: (a) a system of parallel PATs; (b) geometrical modifications in the impeller of the PAT; and (c) power electronics-based variable frequency drives. All the aforementioned techniques have limitations, such as low output, high cost, complexity, transportation, and operation and maintenance. In this study, a simple and economical technique is proposed to smooth the output of a PAT on variable/decreasing water flow profiles. In the proposed technique, water columns connected in parallel (PWCs) are used to produce a pressurized water flow, as they have a convergent nozzle at the outlet. The PWC creates more space for water, and this additional mass of water boosts the water flow at the outlet. In this manner, the PWC technique maintains the flow at the inlet of the turbine. A serial integration of five PWCs with the same dimensions was conducted to inject the additional flow into the existing PAT penstock, governing a 37-kW generator. The design flow was maintained at 192.1 L/s without any additional power usage at the inlet of the PAT, and the output was smoothed even at the minimum water flow/head. Pump design and computational fluid dynamics simulations were performed using ANSYS software, whereas generator simulations were performed using MATLAB/Simulink software.

1. Introduction

Environmental effects, fear of the extinction of conventional energy sources (such as oil, gas, nuclear, and coal), and the high running costs of these costs have compelled planners toward renewable energy sources [1,2,3,4]. Among these resources, hydro energy contributes to nearly 16% of the global energy mix [5,6]. However, extensive capital costs, danger to aquatic life, significantly long construction times, and limited locations are the drawbacks of hydro-generation technology. To overcome these drawbacks, new arrangements for hydro facility construction, such as run-of-river, small hydro, and mini, micro, and pico-hydro plants, have been studied [7,8,9]. These new arrangements of hydro technology have reduced the initial cost, construction time, and environmental effects while increasing the location spectrum for the construction of hydro plants.
In pumped hydro storage (PHS) and small-scale hydro plants, using pumps in reverse (PAT) instead of conventional turbines is preferable to minimize the capital cost [10,11,12]. However, commercially available pumps are not designed to function in reverse mode, and if this mode is exercised, the pumps prove to be low-efficiency devices. Despite their low efficiency, PATs are used in small-scale hydro-generation and PHS facilities [13]. The use of PATs is abundant for numerous reasons, such as their low cost, bulk availability in local markets, and ease of installation. Furthermore, no specialty is required for operation and maintenance [14]. However, small-scale PHS and hydro-generation plants encounter flow fluctuations for several reasons, including intermittent upstream inflows and the decrement of the head in the upper reservoir of the PHS facility during generation. A PAT is unable to respond to these flow fluctuations owing to its simple geometry, and the output of the plant decreases. The design flow, which is obtained by the design head, determines the maximum efficiency of a PAT. Variations in the flow from its original design flow, for any reason, have an adverse effect on the output [15].
Researchers have adopted various methods to mitigate the adverse effects of flow fluctuations on the output, such as parallel PATs of different capacities, geometrical modifications of a PAT, and power electronics-based variable frequency drives (VFDs). In parallel PATs, when the flow is reduced and a PAT with a large capacity cannot deliver its rated output, it is either manually or automatically turned off. A PAT with a lower capacity is operated to minimize the adverse effects of flow fluctuations. However, the output is reduced by the newly available water flow, and the cost increases owing to paralleling, thereby making the design more complex [13,16]. Regarding the geometrical modifications of PATs, different researchers have suggested certain design modifications of the impeller [13,17,18,19,20,21,22], which better manage the variable flows. However, these modifications are unable to manage all the flow variations, and the cost is increased. Power electronics-based VFDs can provide any speed profile of variable flow inputs [23,24]. When the flow decreases, which affects the output of the plant, the VFD changes the speed of the generator, and the output of the plant becomes smooth. However, this method is significantly costly because devices with high ratings are required, causing installation, operational, maintenance, and transportation problems.
In this study, a simple technique is proposed to mitigate the adverse effects of flow variations on the output of a plant. This study is novel because a parallel water column (PWC) technique is used to smooth the output of a PAT system while maintaining the water flow at the inlet of the PAT by acting as an auxiliary penstock. With this technique, water columns connected in parallel are used with the existing penstock of a plant to inject additional flow at the inlet of the PAT in the event of a decreasing flow. This additional flow will maintain the smooth rated output of the plant, even at the minimum head. The effectiveness of the PWC technique was confirmed by performing a simulation using ANSYS software for the case study of a variable flow profile. Subsequently, based on the output obtained from the PAT, the electrical output of the generator was analyzed using MATLAB/Simulink software.

2. Materials and Methods

The details of the adverse effects of the flow fluctuations on the output of the PAT are discussed herein, along with the basic concepts of the PWC theory for a better understanding of the proposed PWC technique.

2.1. Effect of Flow Variations on the Output of PAT

The output of any hydro system is solely determined by the water flow, as given below [14,25]:
Pout = ηρgHQ
where Pout is the output power, η is the efficiency, ρ is the density of water, g is the gravitational acceleration due to gravity (9.81 m/s2), H is the head, and Q is the water flow.
The fluctuation of the flow ”Q” varies the output of the hydro system. A smooth output can be achieved while maintaining a constant flow, which can be accomplished using the aforementioned techniques. A smooth output makes the system more efficient. The effects of flow fluctuations on the efficiency of PAT are shown in Figure 1, in which five scenarios were considered for the calculations based on a previous study [15]. Notably, the total reduction in flow is 38.4 L/s, which causes a significant decrease of 6.62% in the efficiency of the system. This decrease in plant efficiency is dangerous for the stability of the system.
The reduction in flow can be eliminated using the PWC technique. The basics of this newly proposed technique are discussed herein.

2.2. Water Column Theory

The atmospheric pressure (0.1 MPa) is created by a column of air over the surface of the earth. Similarly, water exerts pressure at its bottom, owing to the weight of water acting vertically downward. A water column having a height of 10.3 m creates pressure that is equal to the atmospheric pressure, that is, 101 kPa [26]; pressure is the force acting on an area. Mathematically,
P = F/A
where P is the pressure, F is the force, and A is the area. In this study, “A” indicates the area of the water discharge. If the area of discharge decreases, then the pressure will increase while the force remains constant, which is the weight of water working vertically downward and is indicated by the following:
w = mg
where w is the weight of water, m is the mass of water, and g is the gravitational acceleration. Here, “g” is a constant, and the mass of water should be increased to increase the weight. Traditionally, no arrangement can be used for the increment of the mass of water because the penstock is a fixed entity and functions as a singular body. Therefore, flow fluctuations threaten the stability of the system. Therefore, the PWC technique is presented in this study. Increasing the number of PWCs allows more space for a larger mass of water, which increases the force at the same height. In particular, the PWC technique makes the penstock more flexible and can manage increased flows per the requirements.
Alternatively, the pressure is inversely proportional to the area of the discharge area. Therefore, to increase the pressure, the discharge area must be reduced. This reduction was achieved using a nozzle to increase the pressure, which boosted the velocity of the water.
As the PAT is a low-head device, and this study is regarding low heads, only the Q parameter, which indicates the discharge/flow of water, in Equation (1) can increase the output of the PAT system. Mathematically,
Q = Av
where Q is the water discharge, A is the area of the water discharge, and v is the velocity of the water. According to the continuity equation, the flow in a closed system is always constant. Mathematically,
Qı = Q2
where is the flow through point 1, and Q2 is the flow through point 2. Furthermore,
Aı vı = A2 v2 => v2 = A1v1/A2
The inlet of the PAT is constant since it is a fixed body, and the only option for increasing the value of Q through the PAT while maintaining the same height is by increasing the velocity. The nozzle at the bottom, which has a velocity of “v2”, as indicated in Equation (6), will increase the velocity of water, which will in turn increase the value of ‘Q’.
In this manner, as the number of water columns increases, increases, which increases v2. The PWC technique injects the additional flow at the inlet of the PAT in the event of a flow decrease with the existing penstock of a plant; the adverse effects of the flow fluctuations are filtered, which smooths the output of the PAT.

2.3. PWC Technique with the Design of Experiment

The PWC follows certain rules to produce an output. To understand the behavior of the PWC, an experiment in which five water columns were connected in parallel was conducted. This experimental design is called a “double-nozzle setup”, in which one nozzle makes the main outlet, which injects the additional water into the existing penstock of the PAT, while each water column has a separate nozzle. Computational fluid dynamics (CFD) simulations were performed using ANSYS software R1 2021 [27]. The dimensions of the PWC and specifications of the FLUENT solver are listed in Table 1.
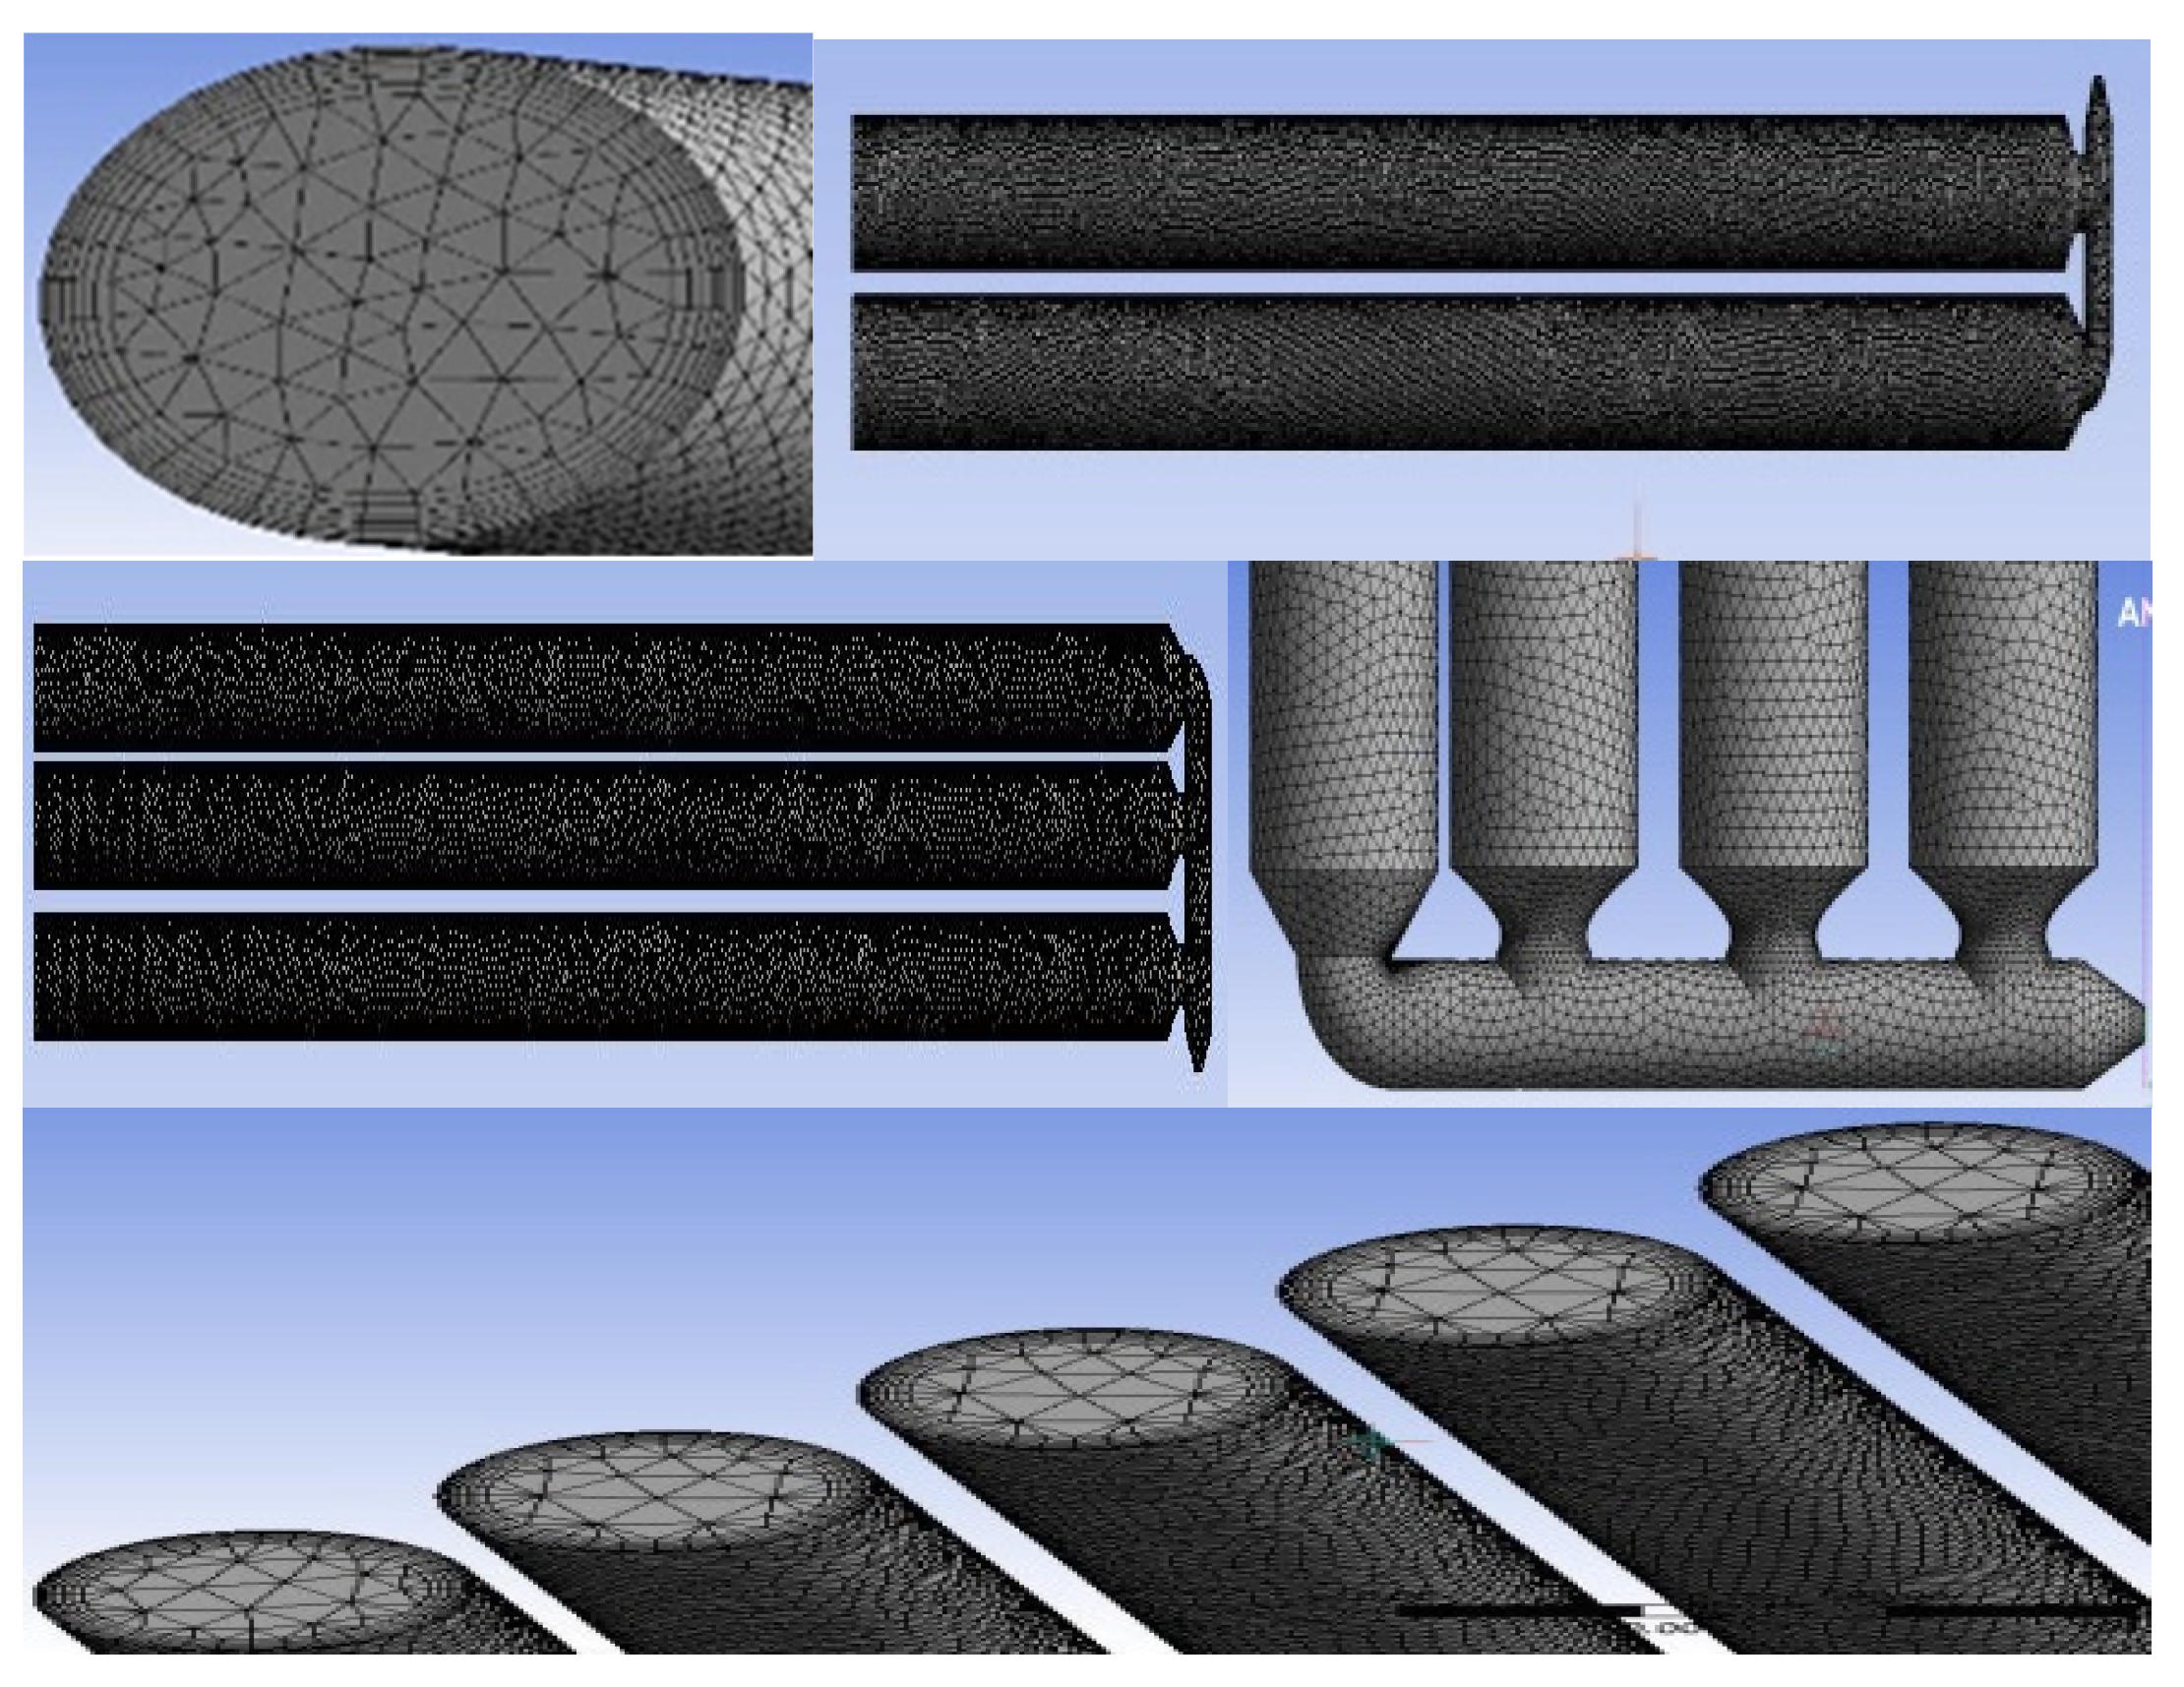
The geometrical dimensions of the PWC were composed in a design modeler, and the settings were changed from solid to fluid, while meshing of the PWC was performed using ANSYS meshing. A tetrahedral mesh was created using a patch-confirming algorithm, and the span angle center was set to fine. Meshing of the PWC is shown in Figure 2, the details of which are provided in Table 2, including the meshing method, inflation layers, element size, and number of elements per PWC.
A mesh independence test was performed for two PWCs to obtain the optimal element size and number of elements. Element sizes of 20, 30, 40, 50, 60, 70, 80, and 90 mm were applied to create 1,477,215, 655,237, 358,456, 237,308, 174,459, 138,933, 100,099, and 77,206 mesh elements, respectively. The optimal element size was 40 mm, which was selected for all the PWC simulation cases. A size of 40 mm yielded 358,456 elements for the two PWCs, as proven by the grid independence test shown in Figure 3.
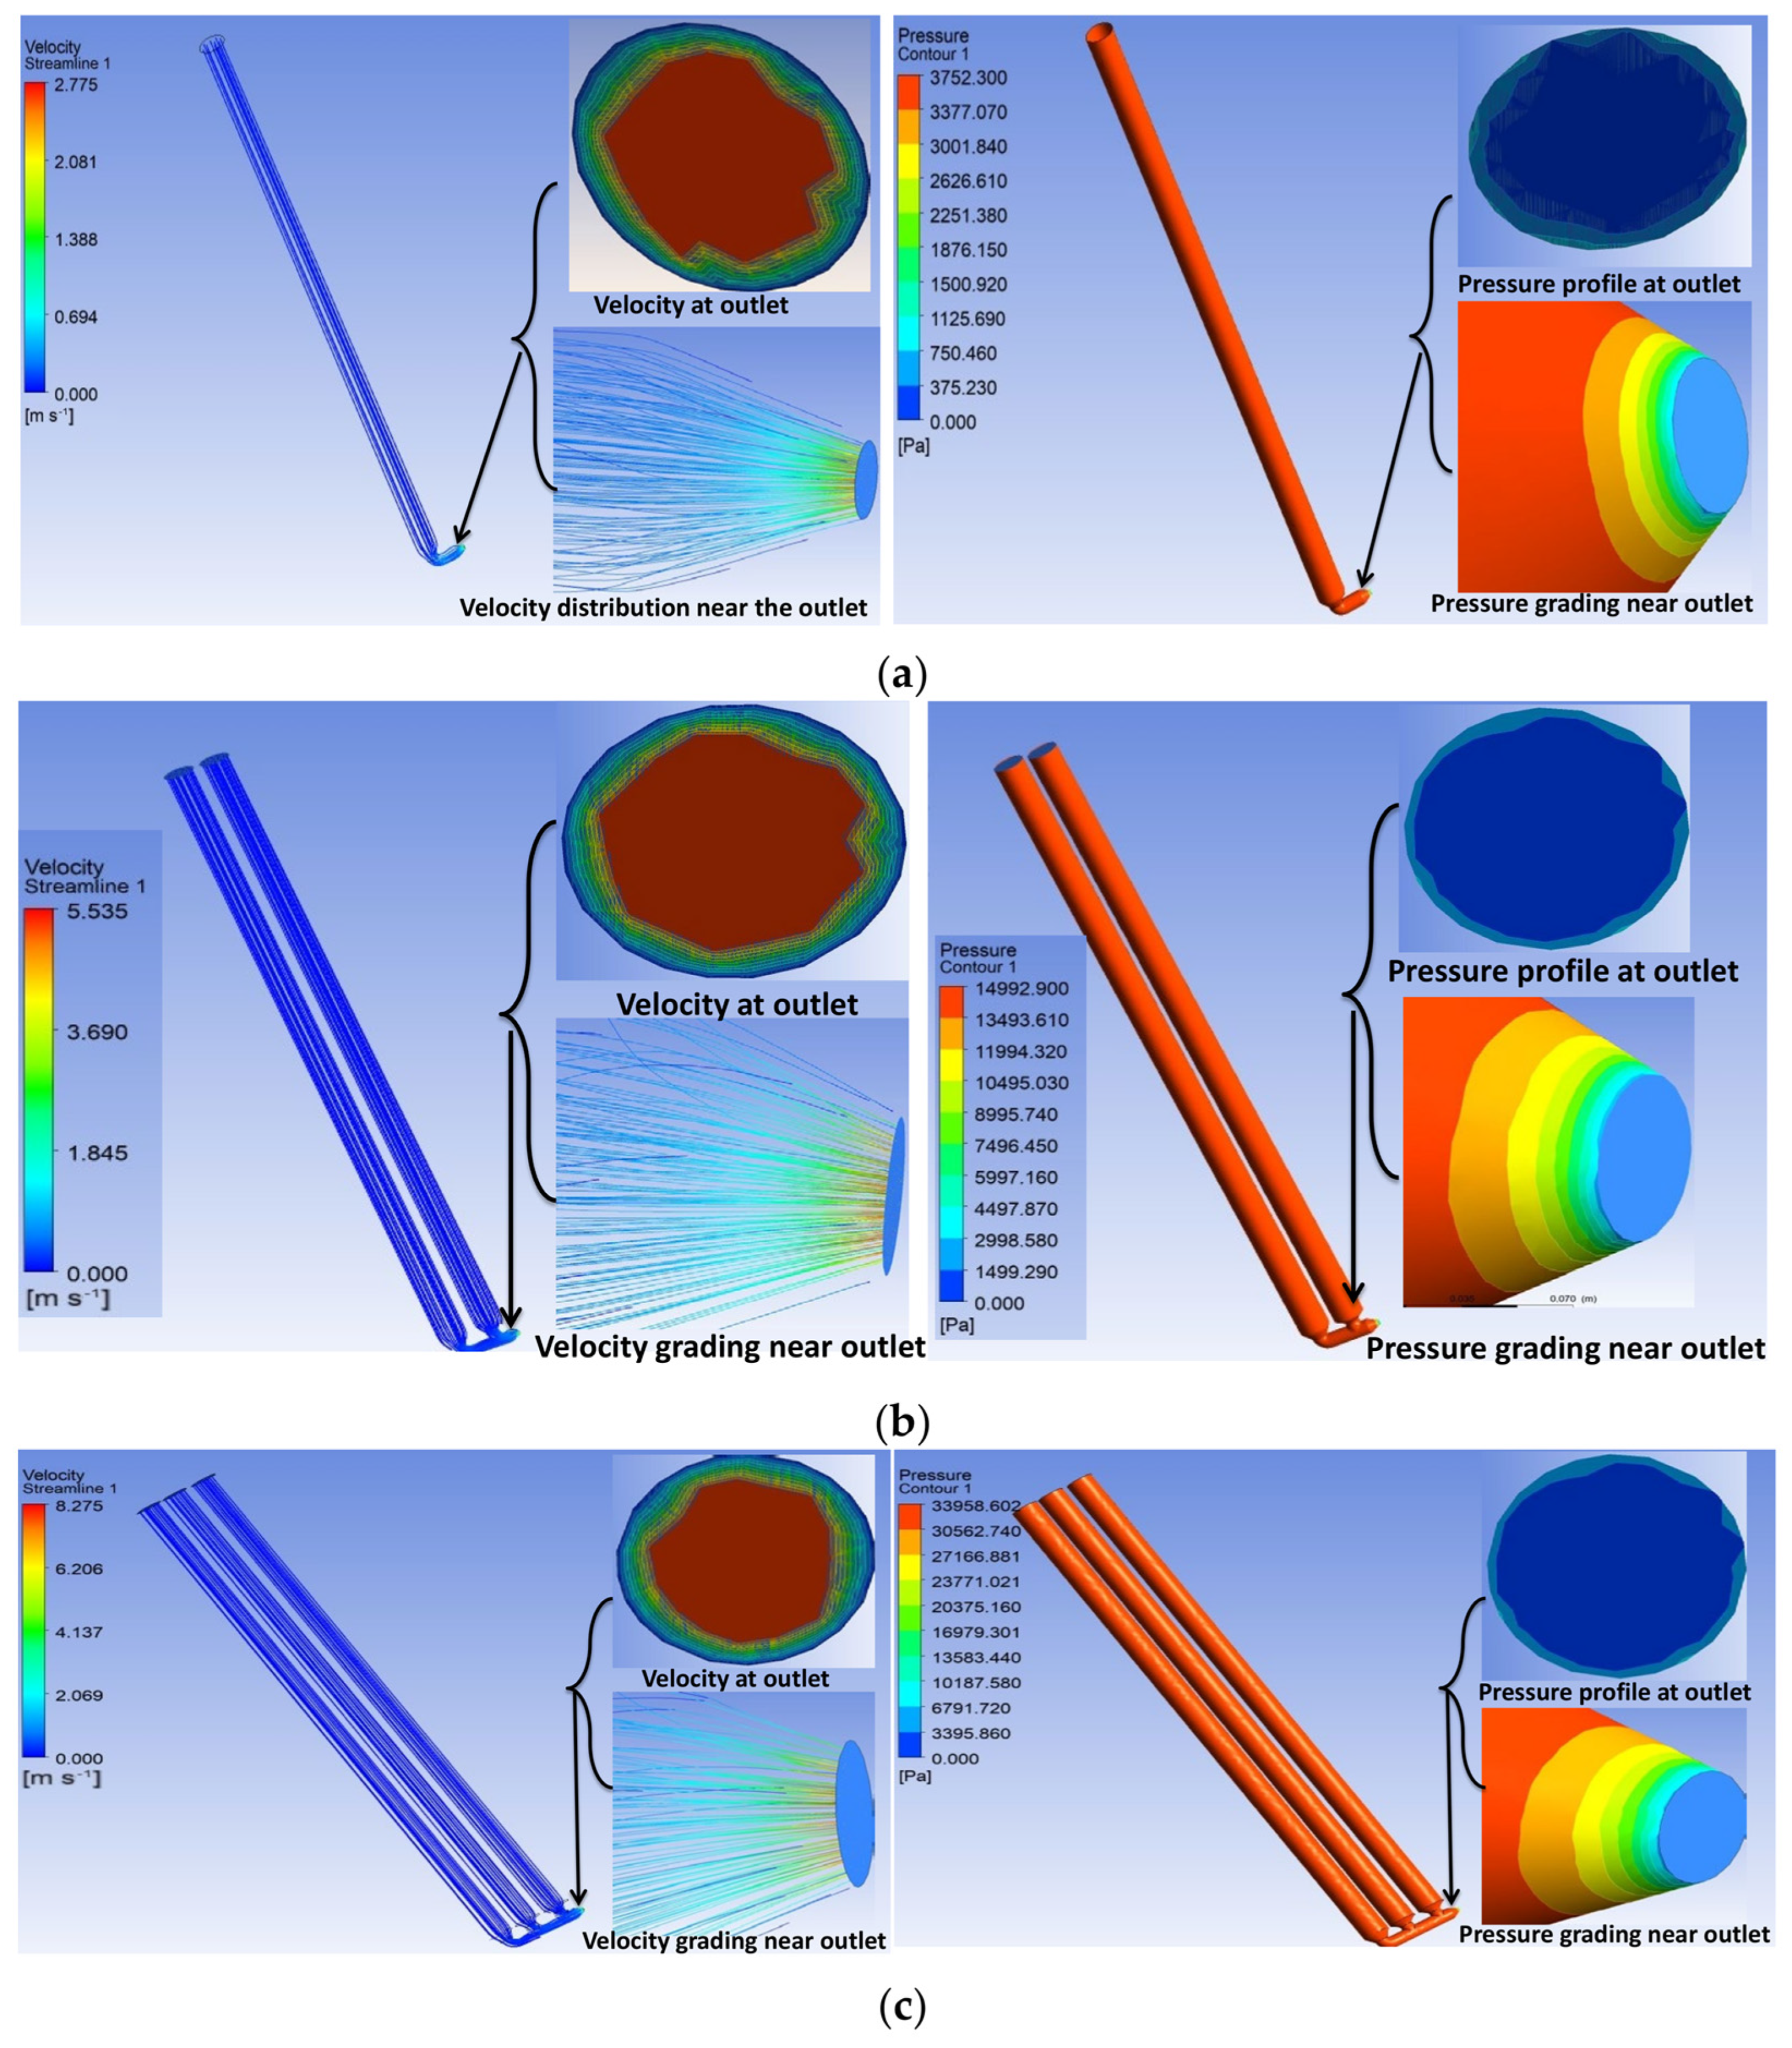
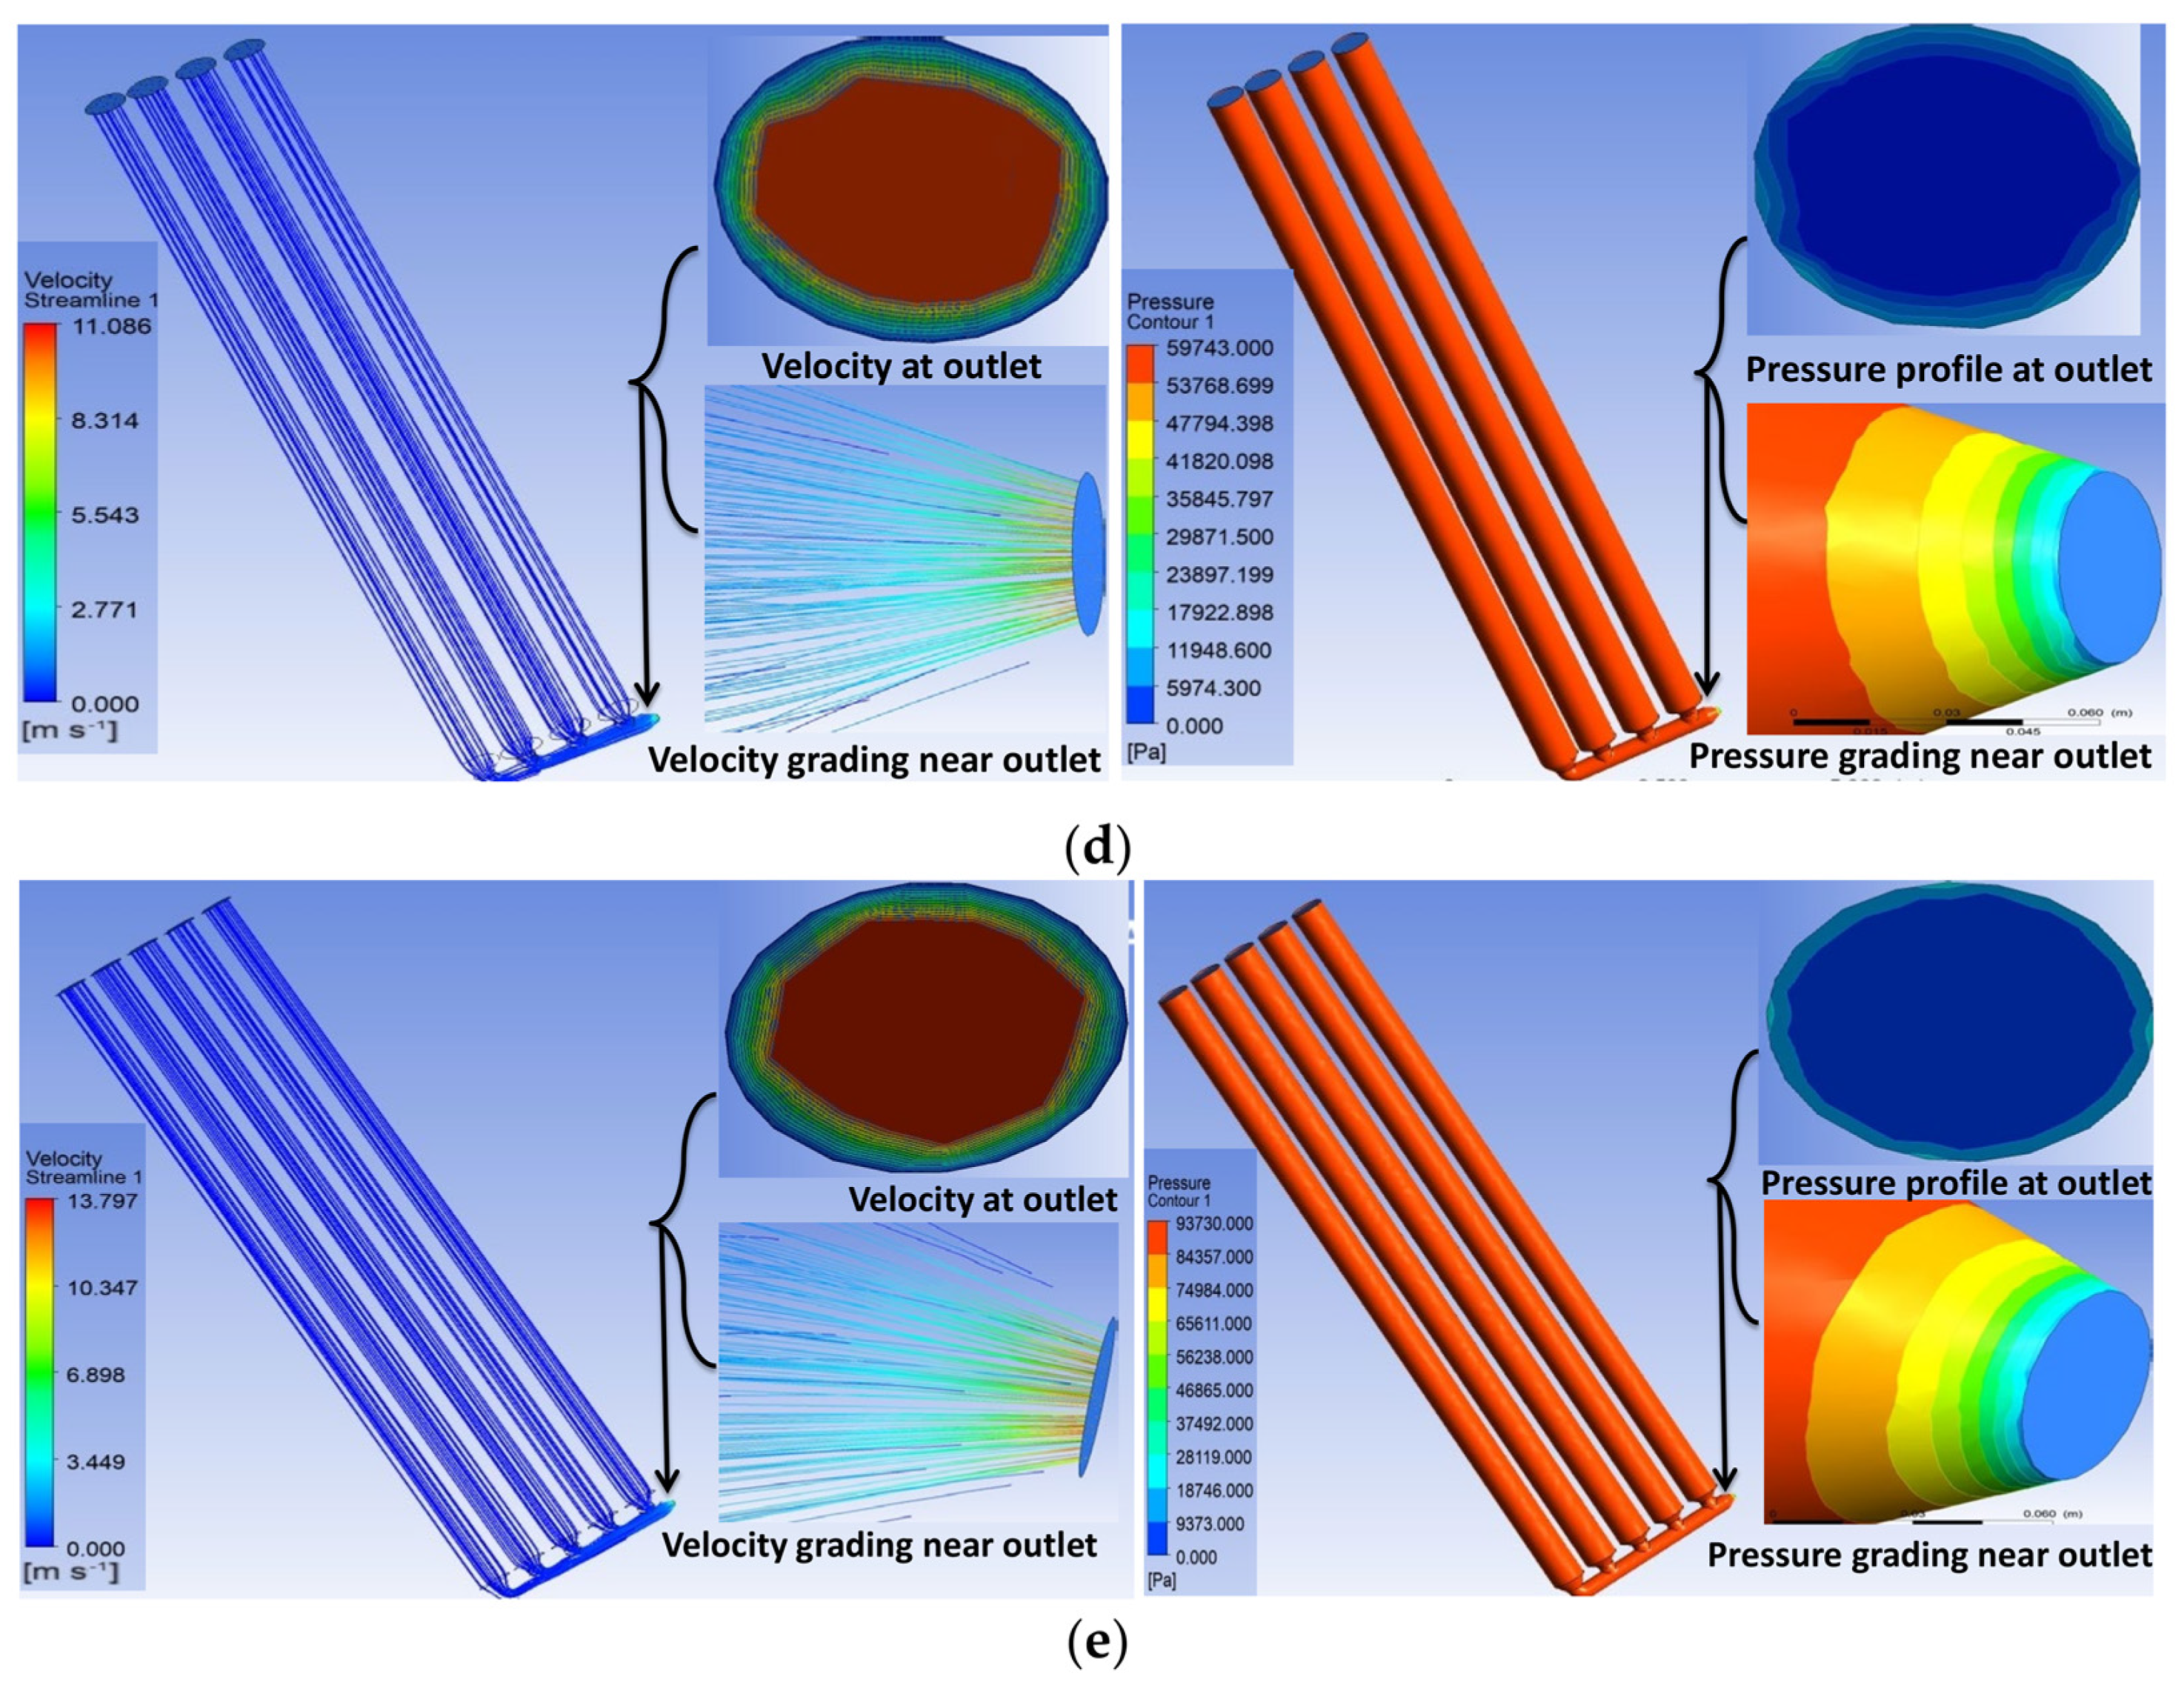
In the experimental design, the dimensions of the PWCs were kept constant, while the number of PWCs was increased individually. The velocity inlet was assigned as the boundary condition at the inlet of the PWCs, whereas the pressure outlet was assigned at the outlet. The velocity and pressure produced in each case, which were processed in CFD-Post, are illustrated in (a)–(e) of Figure 4.
Two types of results were obtained from the experimental design study. First, the output behavior of the PWC was determined, and a mathematical model was developed. If the dimensions and output of the water column are known, the optimal number of PWCs can be derived for any flow, velocity, or pressure profile. Second, the optimal number of PWCs was derived for the aforementioned PAT, the water flow of which was variable at its inlet owing to the variations in the head of the upper reservoir during generation.
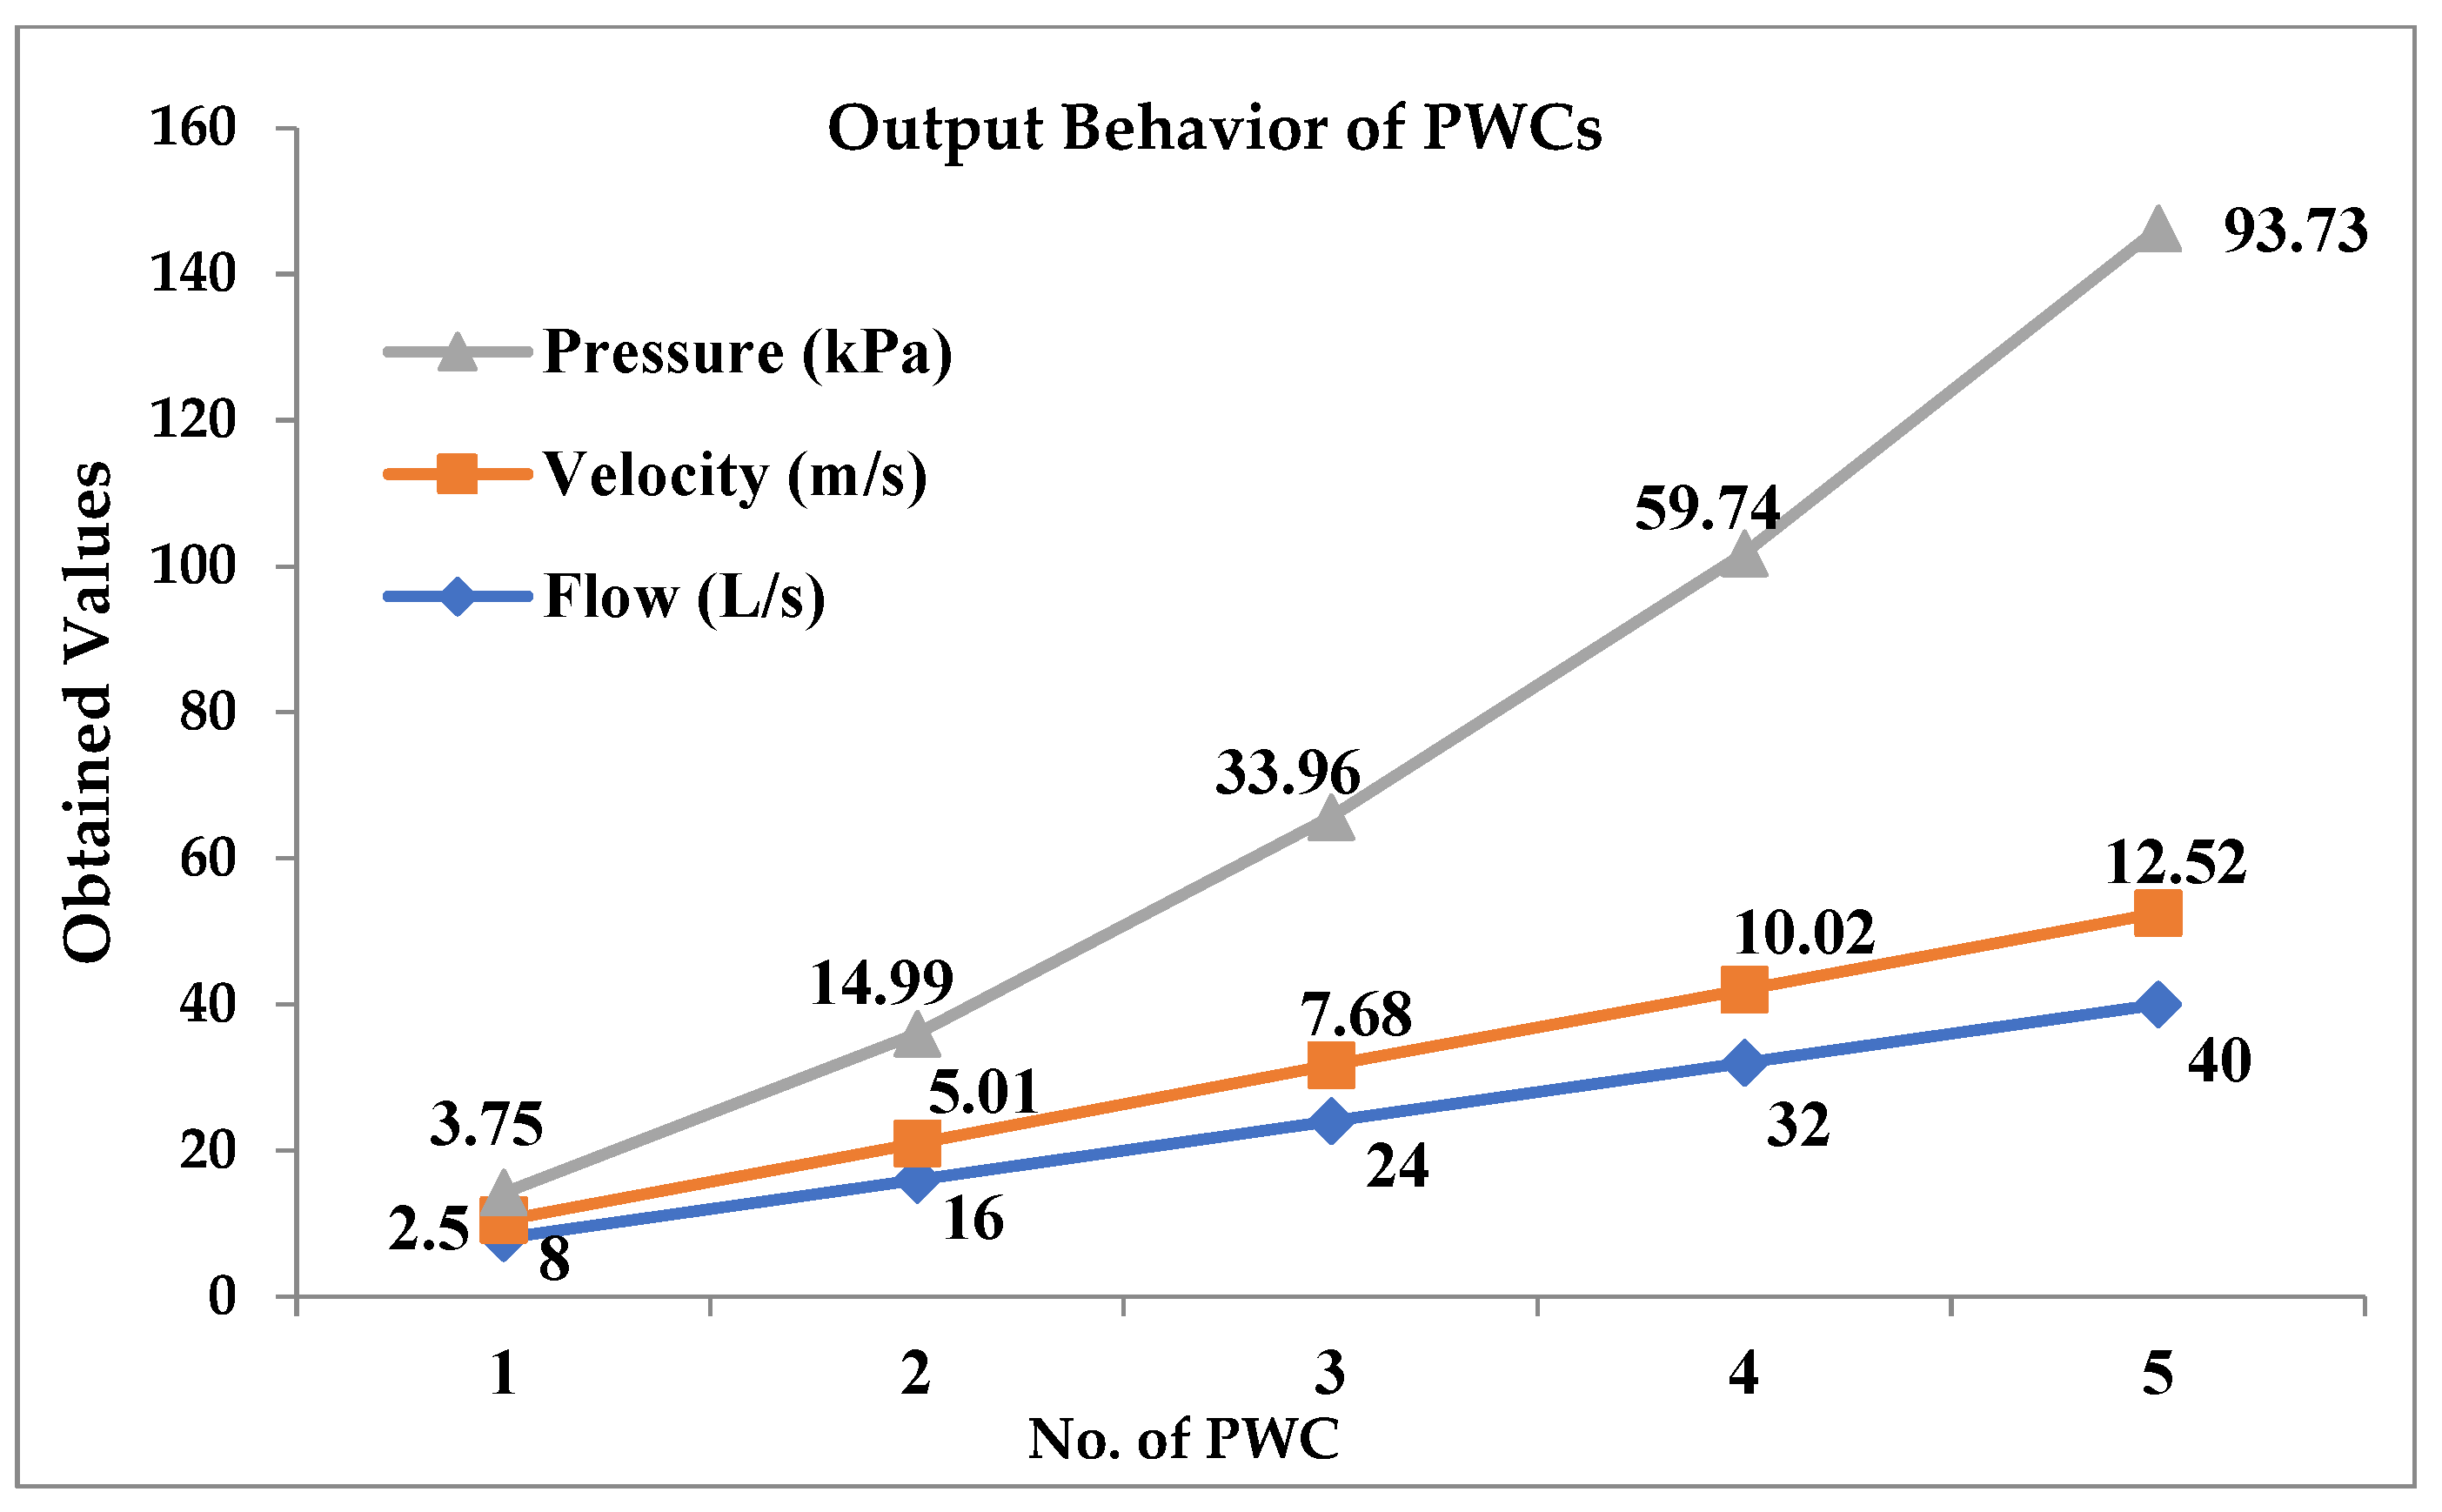
The results of the flow, outlet velocity, and pressure were calculated in CFD-Post with a function calculator, while the dimensions of the PWC were maintained to be the same; only the number of PWCs was increased individually according to the requirements of the design flow, as shown in Figure 5.

2.4. Findings from the Design Experiment

The findings obtained from the design experiment are presented (Figure 5) while developing a mathematical model to determine the output of the PWC.
Finding 1: Flow
The flow graph shown in Figure 5 demonstrates that the flow increases linearly as the number of water columns increases. Mathematically,
F = Fi × n
where F is the flow of water, Fi is the flow obtained from one water column, and n is the number of PWCs used.
Finding 2: Velocity
The velocity of water also increases linearly as the number of water columns increases, as shown in the velocity graph (Figure 5). The mathematical relationship between the velocity and PWCs is as follows:
v = vi × n
where v is the velocity at the outlet, vi is the velocity obtained from one water column, and n is the number of PWCs used.
Finding 3: Pressure
The water pressure at the nozzle inlet increases with the square of the number of water columns, which increases the water flow at the nozzle outlet. The pressure graph (Figure 5) describes the mathematical relationship between the PWC and the generated pressure. Mathematically,
P = Pi× n2
where P is the total generated pressure, Pi is the pressure obtained from one water column, and n is the number of PWCs used in any setup.

3. Optimal Number of PWCs for a Smooth Output of the PAT

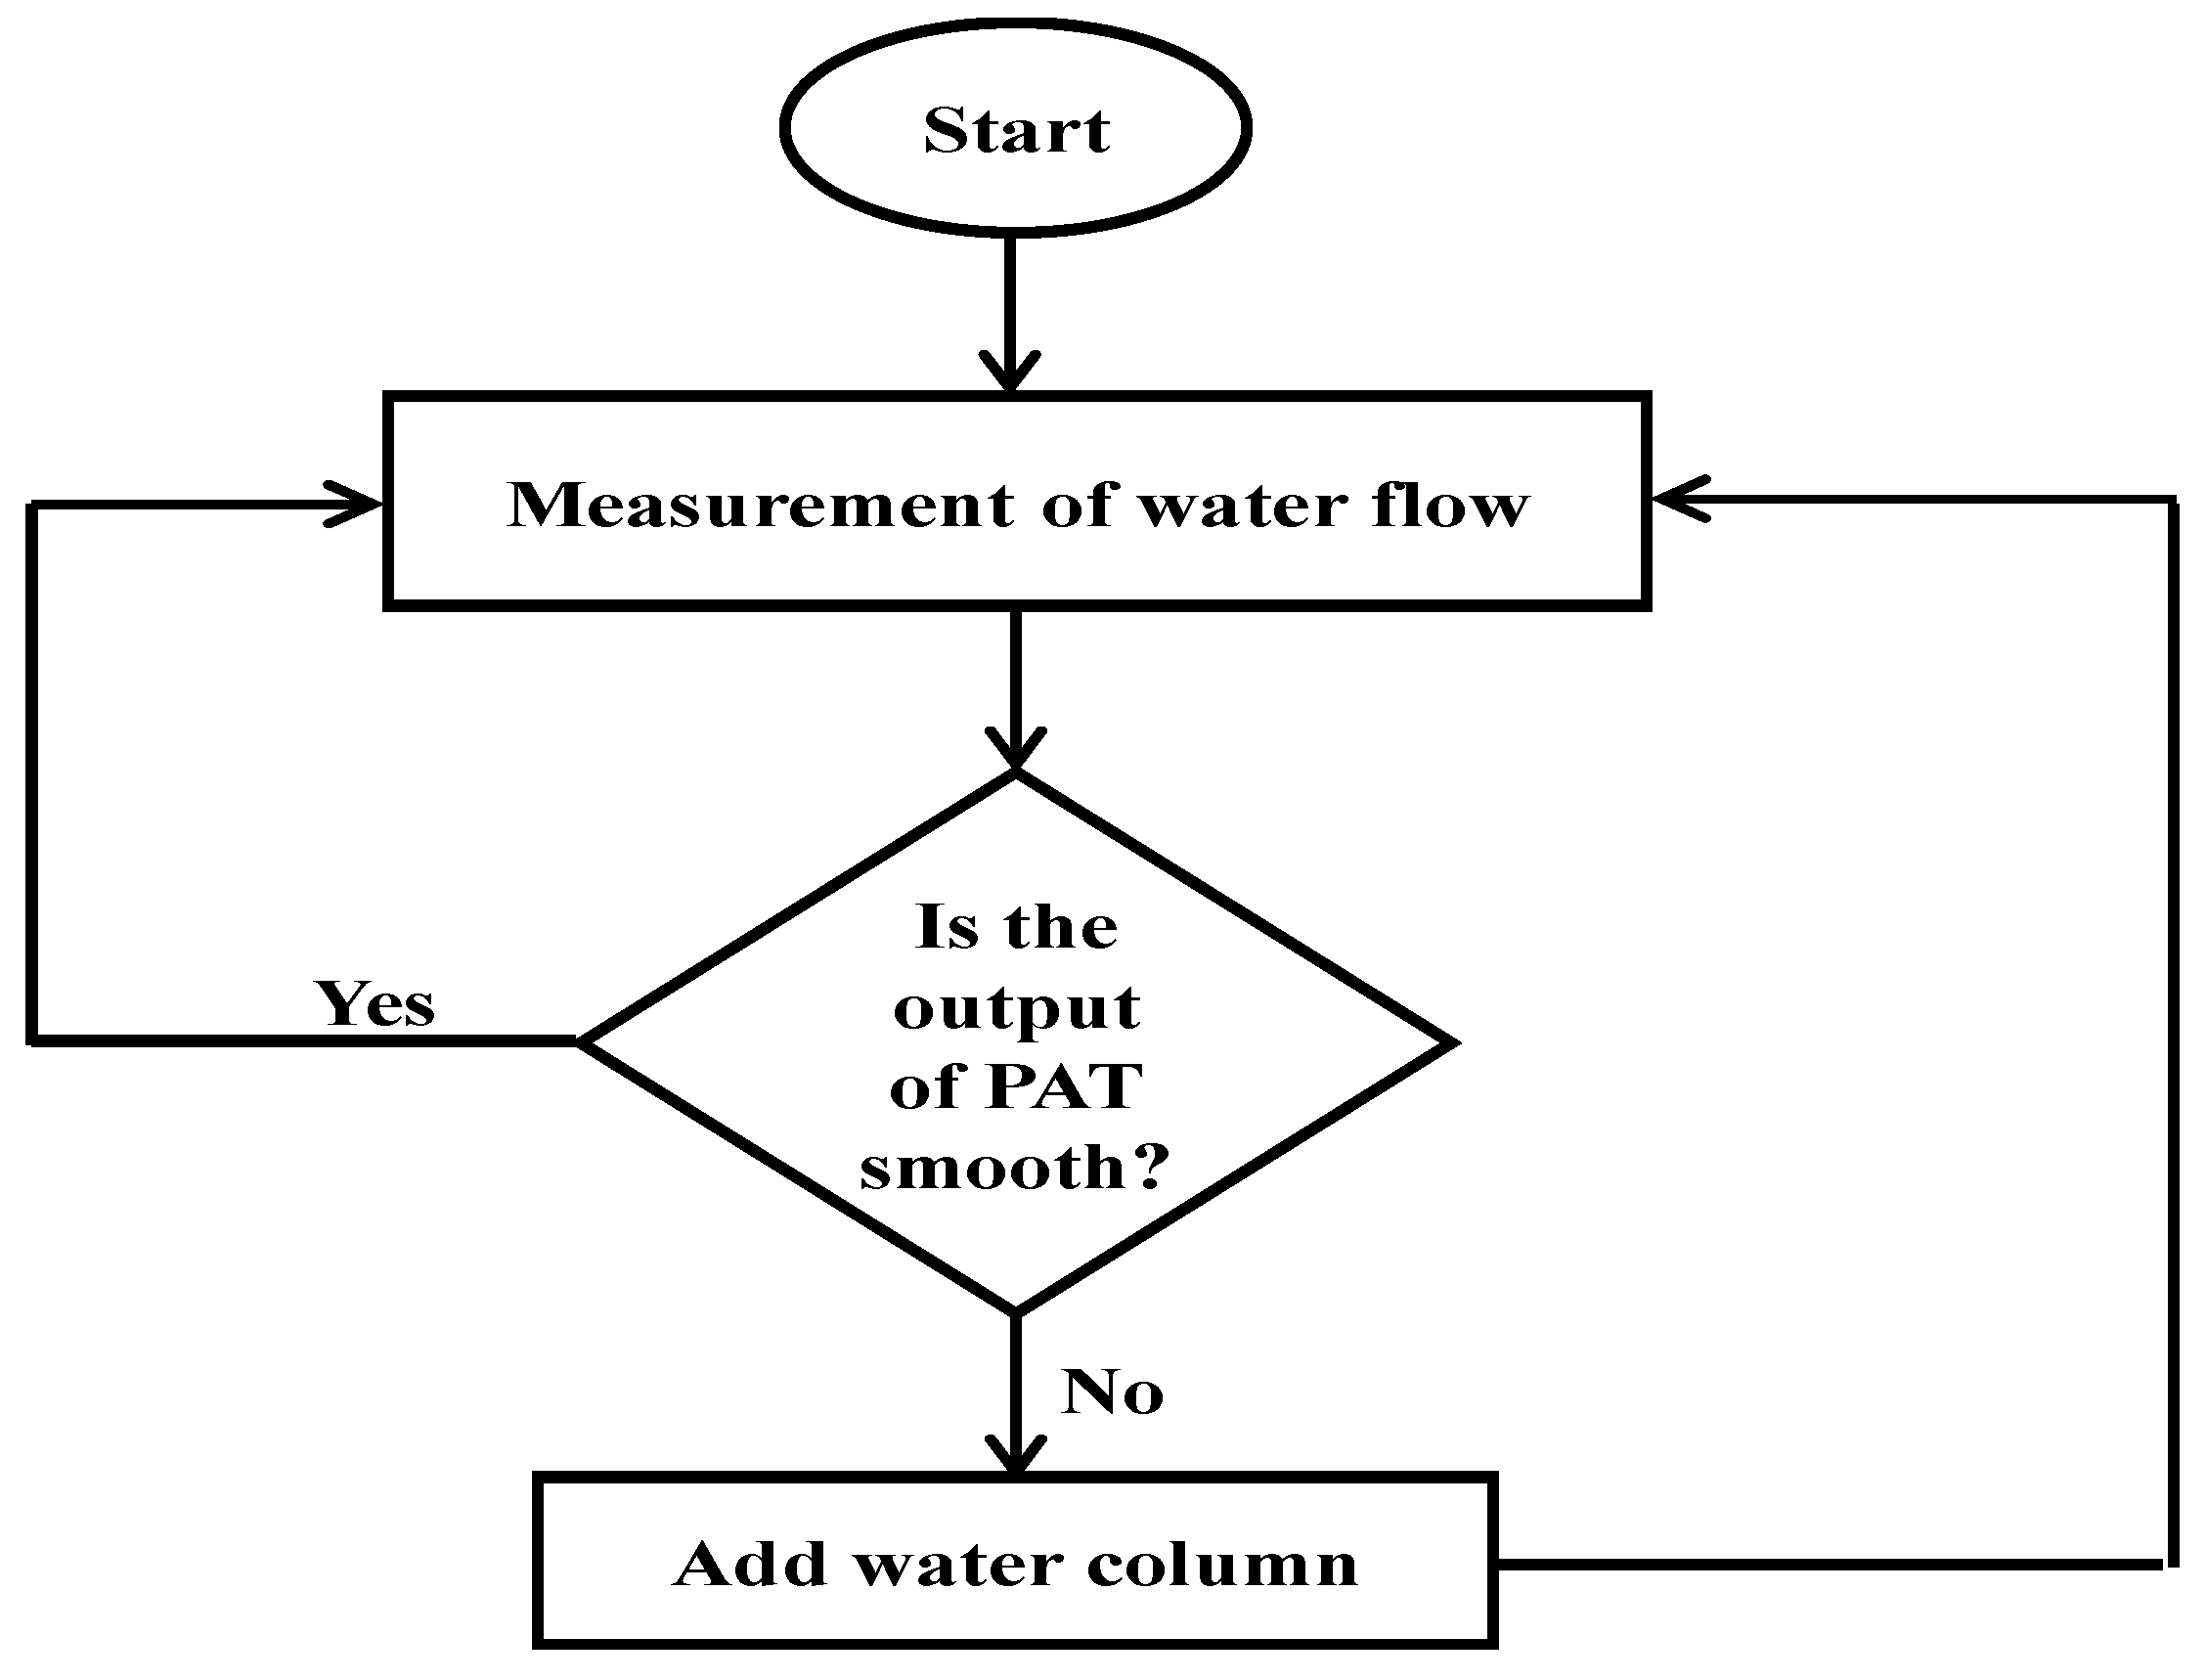
Based on Section 2.1, the decrease in the flow of the PAT is 38.4 L/s, for which, according to Equation (7), a total of five PWCs with a flow of 8 L/s each are required to smooth the flow at the inlet of the PAT. The PWC dimensions used for this purpose were the same as those shown in Table 1. Thus, the outlet nozzle of the PWC design becomes an additional inlet of the PAT, injecting the flow into the existing penstock, which is required for a particular stage of operation. Initially, the flow through the turbine was a design flow, and no change was required. As the flow decreases, the output also decreases. One water column is added by the system to acquire the design flow; if the new flow through the turbine meets the design flow, no further water column will be added by the system. However, considering a further deviation from the smooth output, another water column is added to the system to check whether the new scenario provides a smooth output. No changes are required if the new output is smooth. These five PWC were added to the system according to the flowchart shown in Figure 6.
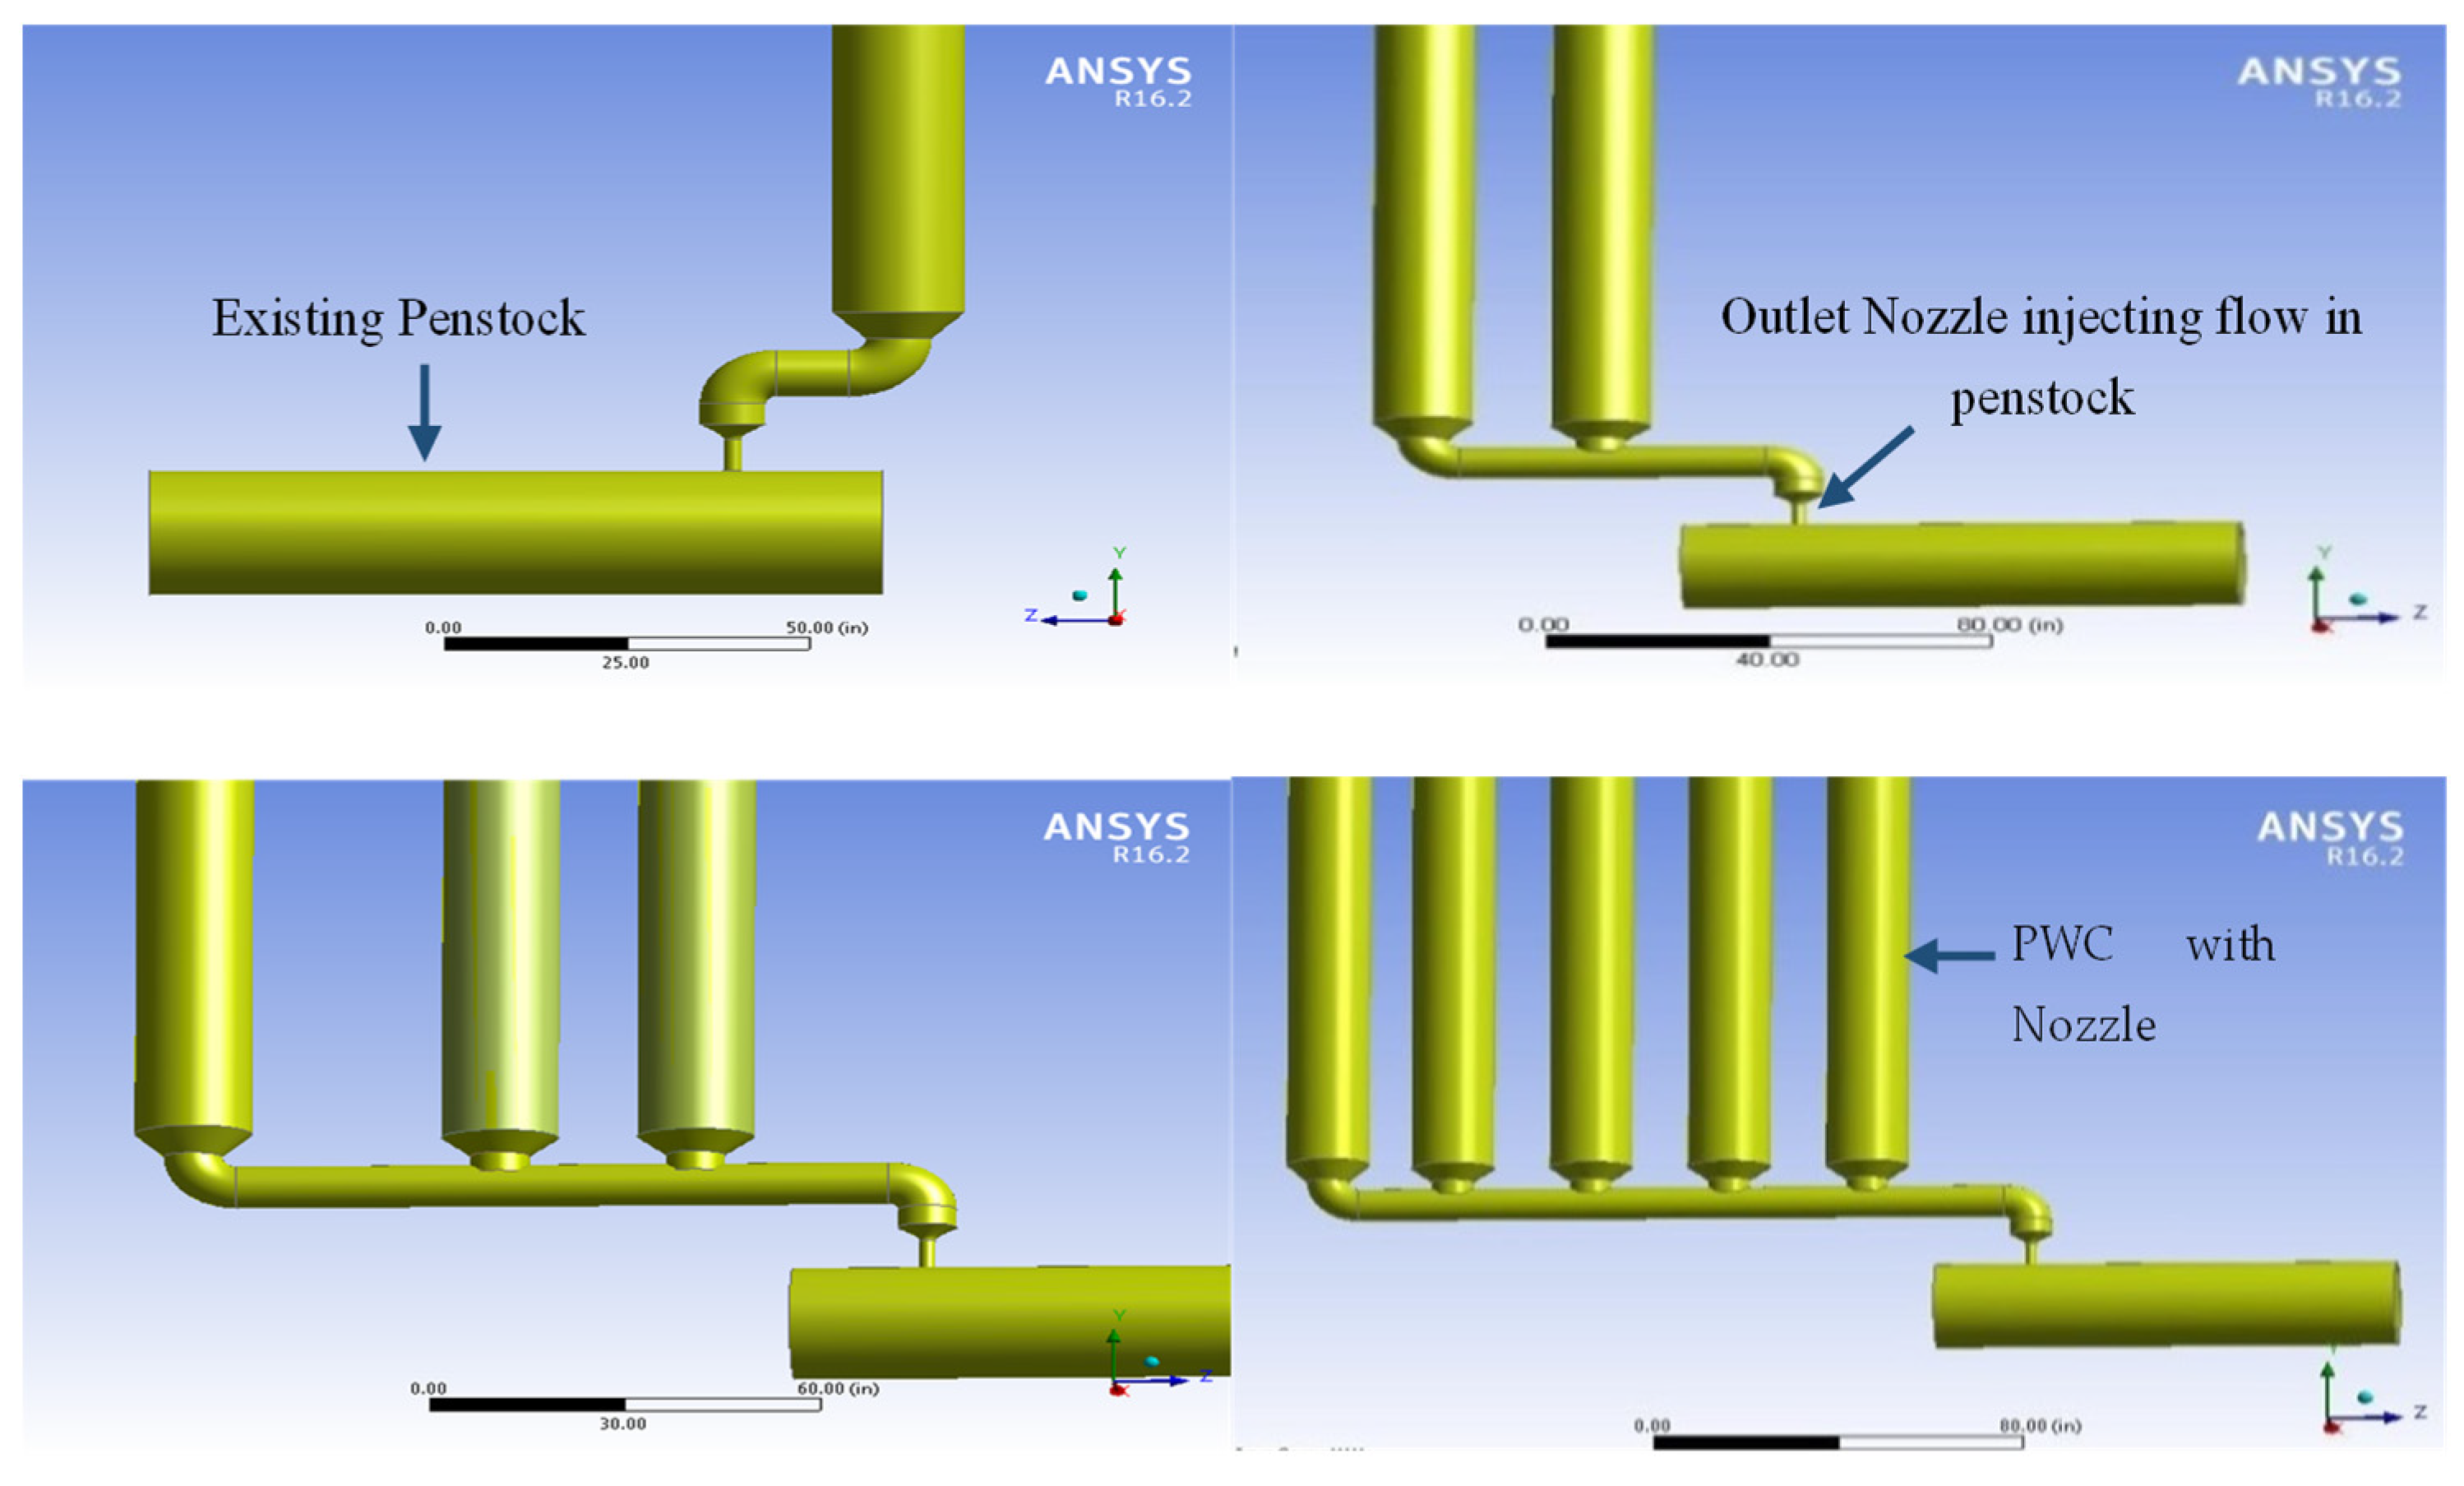
The integration of the five PWCs with the existing PAT penstock and the injection of an additional flow at the inlet were conducted in ANSYS, as shown in Figure 7.
As the number of PWCs is increased according to the demand, the flow is maintained at approximately the designed value, as listed in Table 3.

4. Torque Calculation and Generator Behavior

The aforementioned flow profile produces torque in the PAT, which is applied as an input to the generator to monitor its output. Simulations were performed using ANSYS and MATLAB software.

4.1. Torque Produced by PAT on Different Flow Values

A pump with a flow of 192.1 L/s was designed using the ANSYS (Vista CPD) tool, consisting of a volute and impeller with six blades, as shown in Figure 8. A flow analysis through PAT was conducted in ANSYS CFX [13,28], in which water was used as the material, and the standard atmospheric pressure was considered to be one atm.
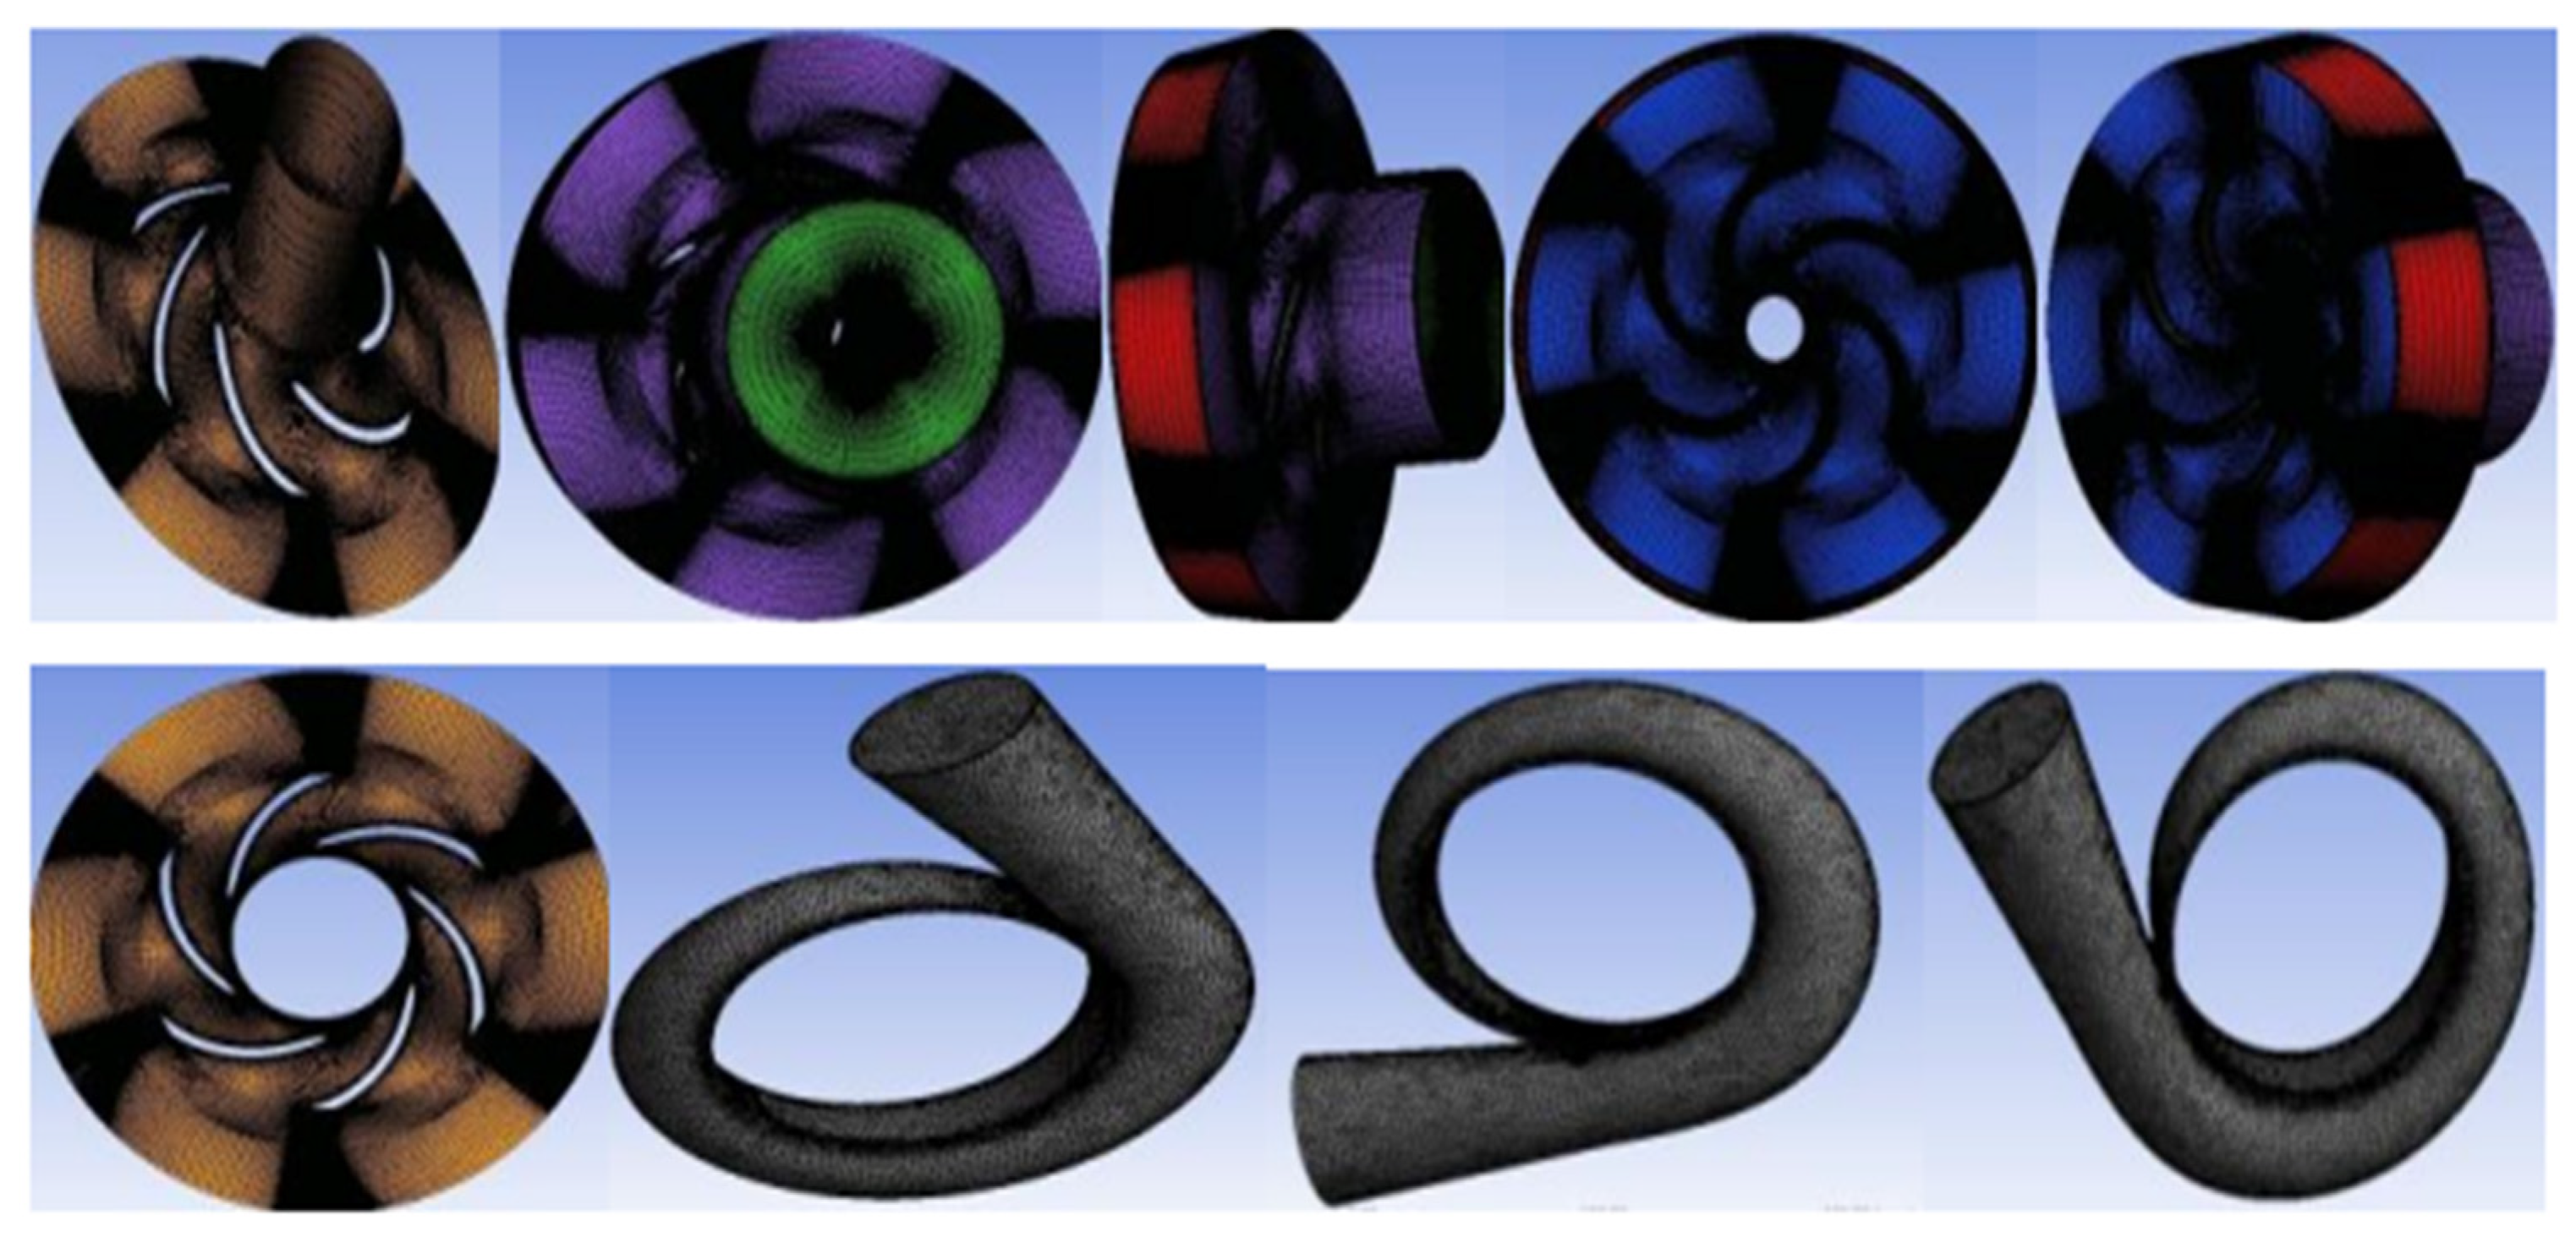
The pump was meshed using TURBO GRID, while the impeller and volute were separately meshed, achieving a good quality mesh, as shown in Figure 9.
A detailed mesh report is provided in Table 4, which demonstrates the domains of the analysis, location of the domains, number of nodes, and number of elements.
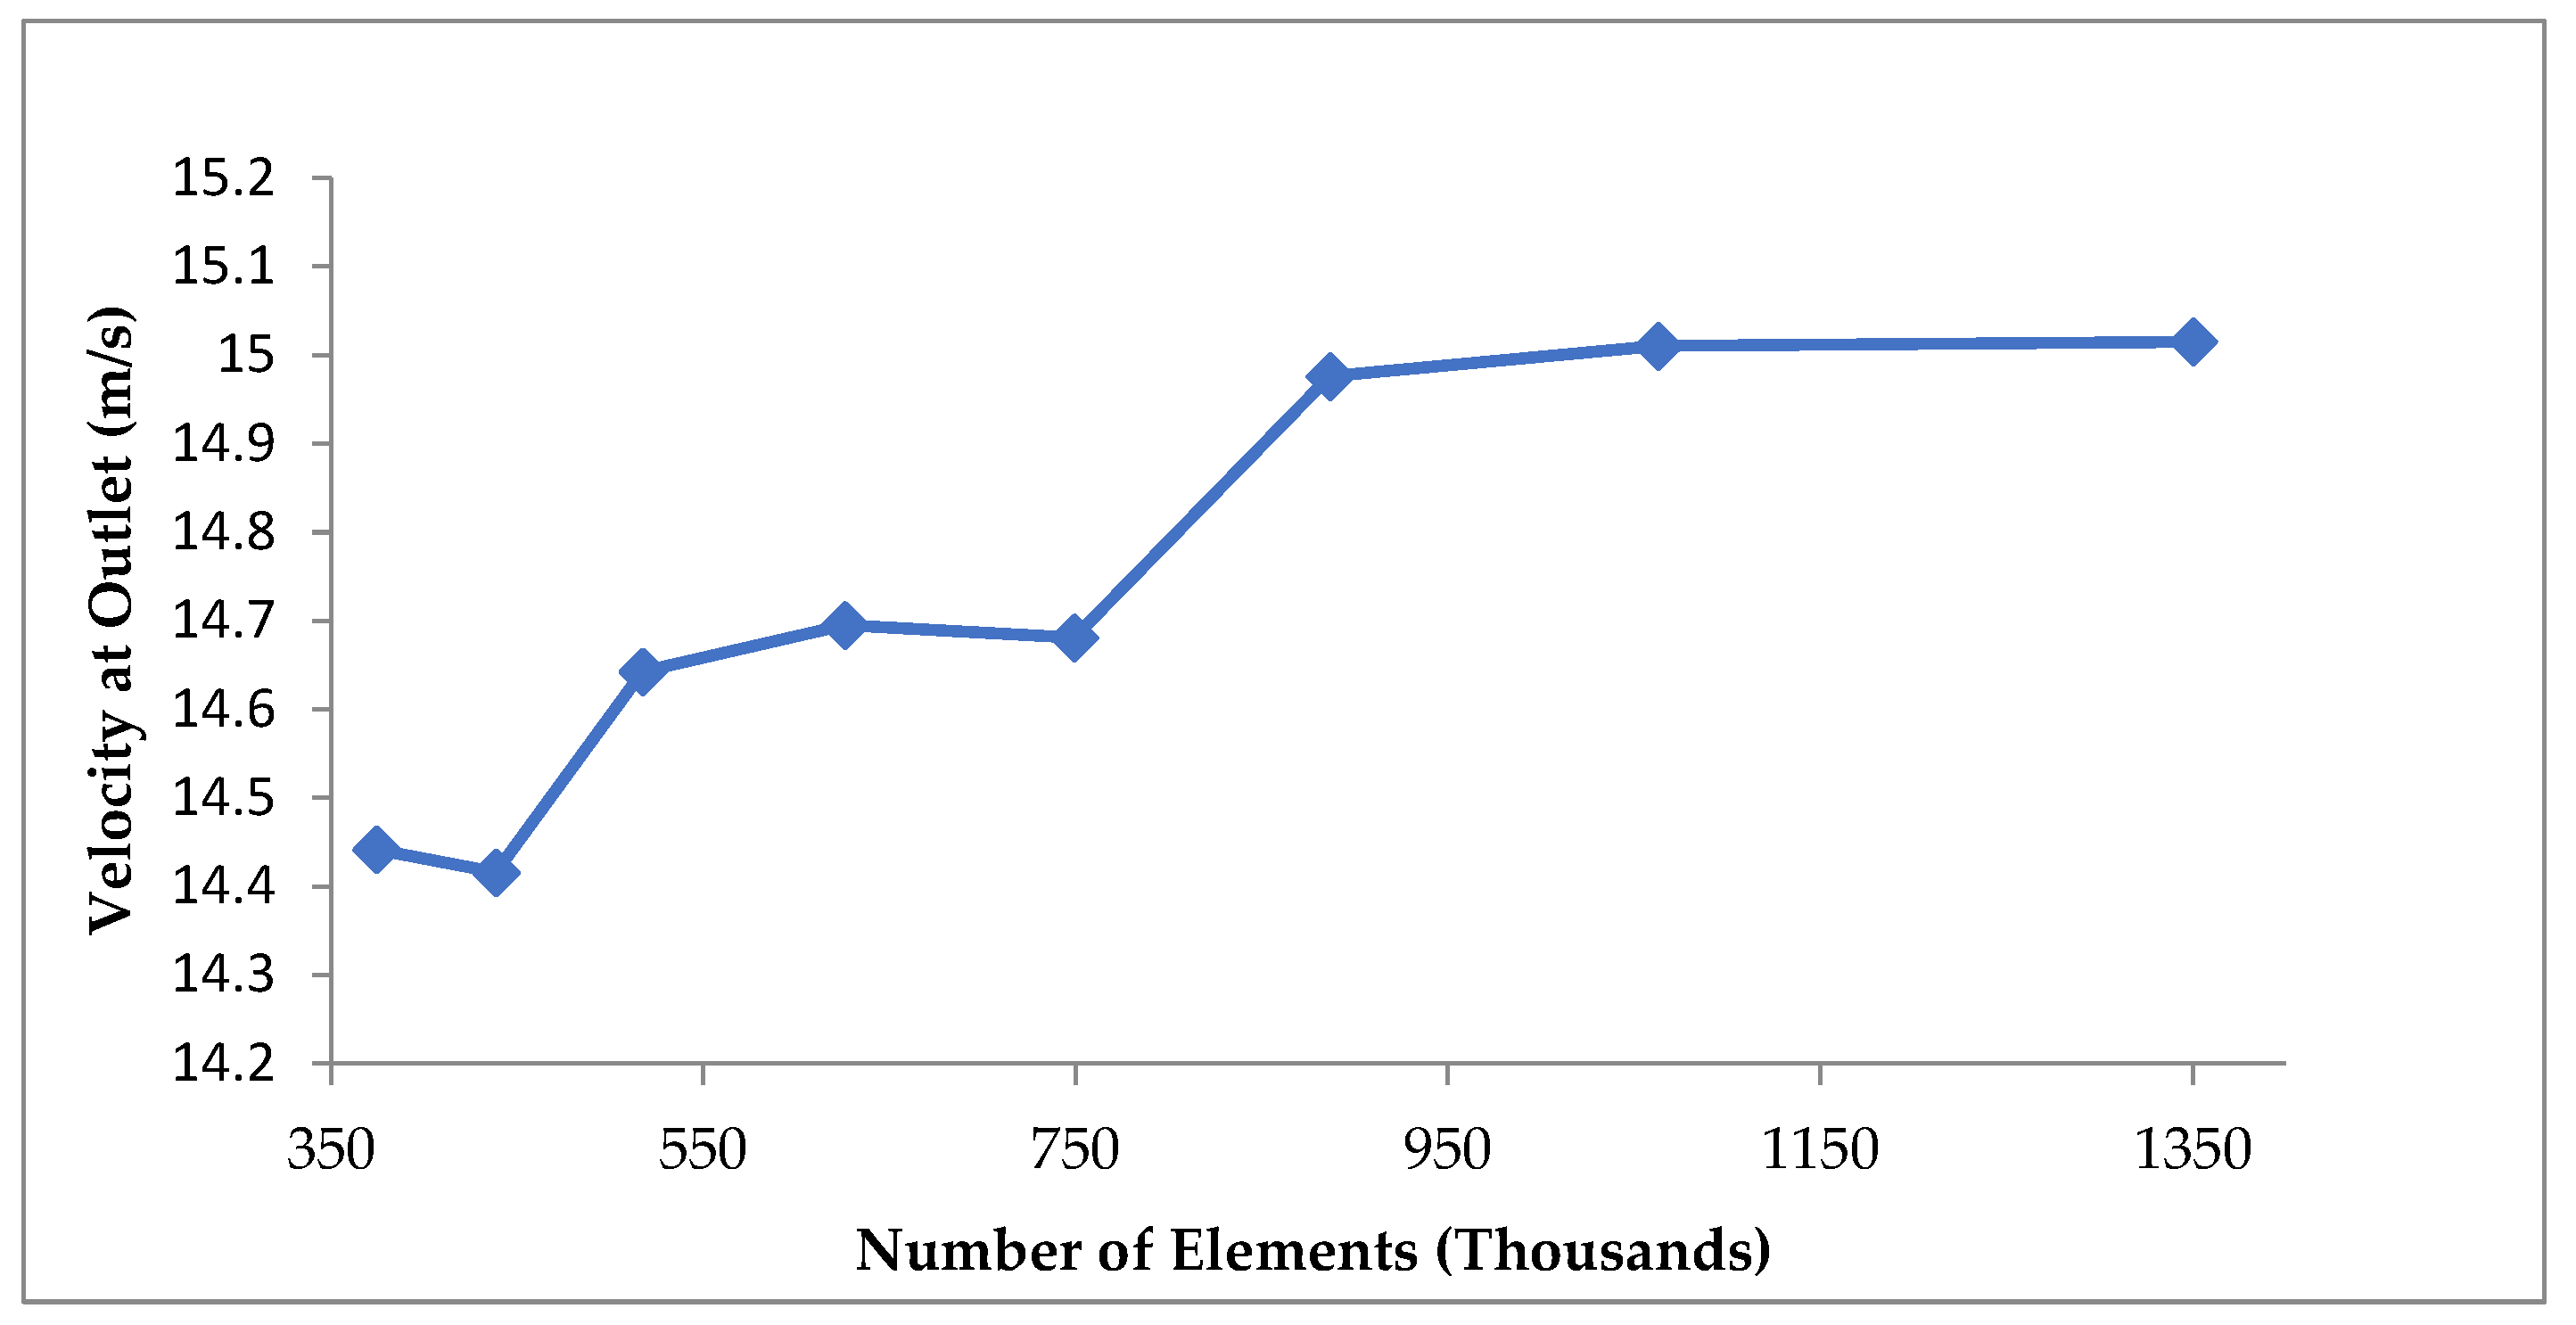
The mesh independence is checked for the pump and eight different cases with regard to. element numbers, which are obtained by changing the element size and global size factor for the volute and impeller, respectively. Element sizes of 15, 20, 25, 30, 35, 40, 45, and 50 mm were applied for the volute in meshing, yielding 330,438, 281,176, 258,746, 248,172, 240,762, 237,168, 234,902, and 232,452 elements, respectively. In contrast, the global size factor was the main parameter that was manipulated for impeller meshing, achieving a range of eight element numbers. Different global size factors for the impeller were assigned in TURBO GRID; the 0.8, 0.9, 1.0, 1.1, 1.2, 1.3, 1.4, and 1.5 sizes produced 141,792, 203,553, 280,080, 385,118, 501,128, 781,482, and 1,019,900 elements, respectively. The output parameter was the velocity at the outlet, which is demonstrated by the mesh independence test shown in Figure 10; 886,386 elements were selected for the simulations, which were produced by a 25-mm element size and a 1.3 global size factor.
The steady-state boundary conditions for this simulation were set for the PAT. The stationary (S1) domain is the volute, while the rotating (R1) domain is the impeller of the pump. The inlet was assigned a boundary condition for the mass flow, while the outlet was the pressure, and the standard atmospheric pressure was assigned. The blade and all other boundary walls were assigned a boundary condition (no slip). A frozen-rotor mixing model was adopted for the interface between S1 and R1. The SST turbulence model was applied for the flow analysis, while in the solver control panel, a high resolution was applied as an advection scheme, 1.0 × 10⁻⁵ for convergence, first order for numeric turbulence, and SIMPLEC [27,29,30]. Transient or unsteady simulations were also performed after steady simulations. The total time was set to 1 s, the time step to 0.0001 s, and the initial time value to 0 s for the transient case. The transient rotor-stator mixing model was assigned to the interface between S1 and R1. Cartesian velocity components were selected as u = 0 m/s, v = 0 m/s, and z = 0 m/s for the global initialization [31].
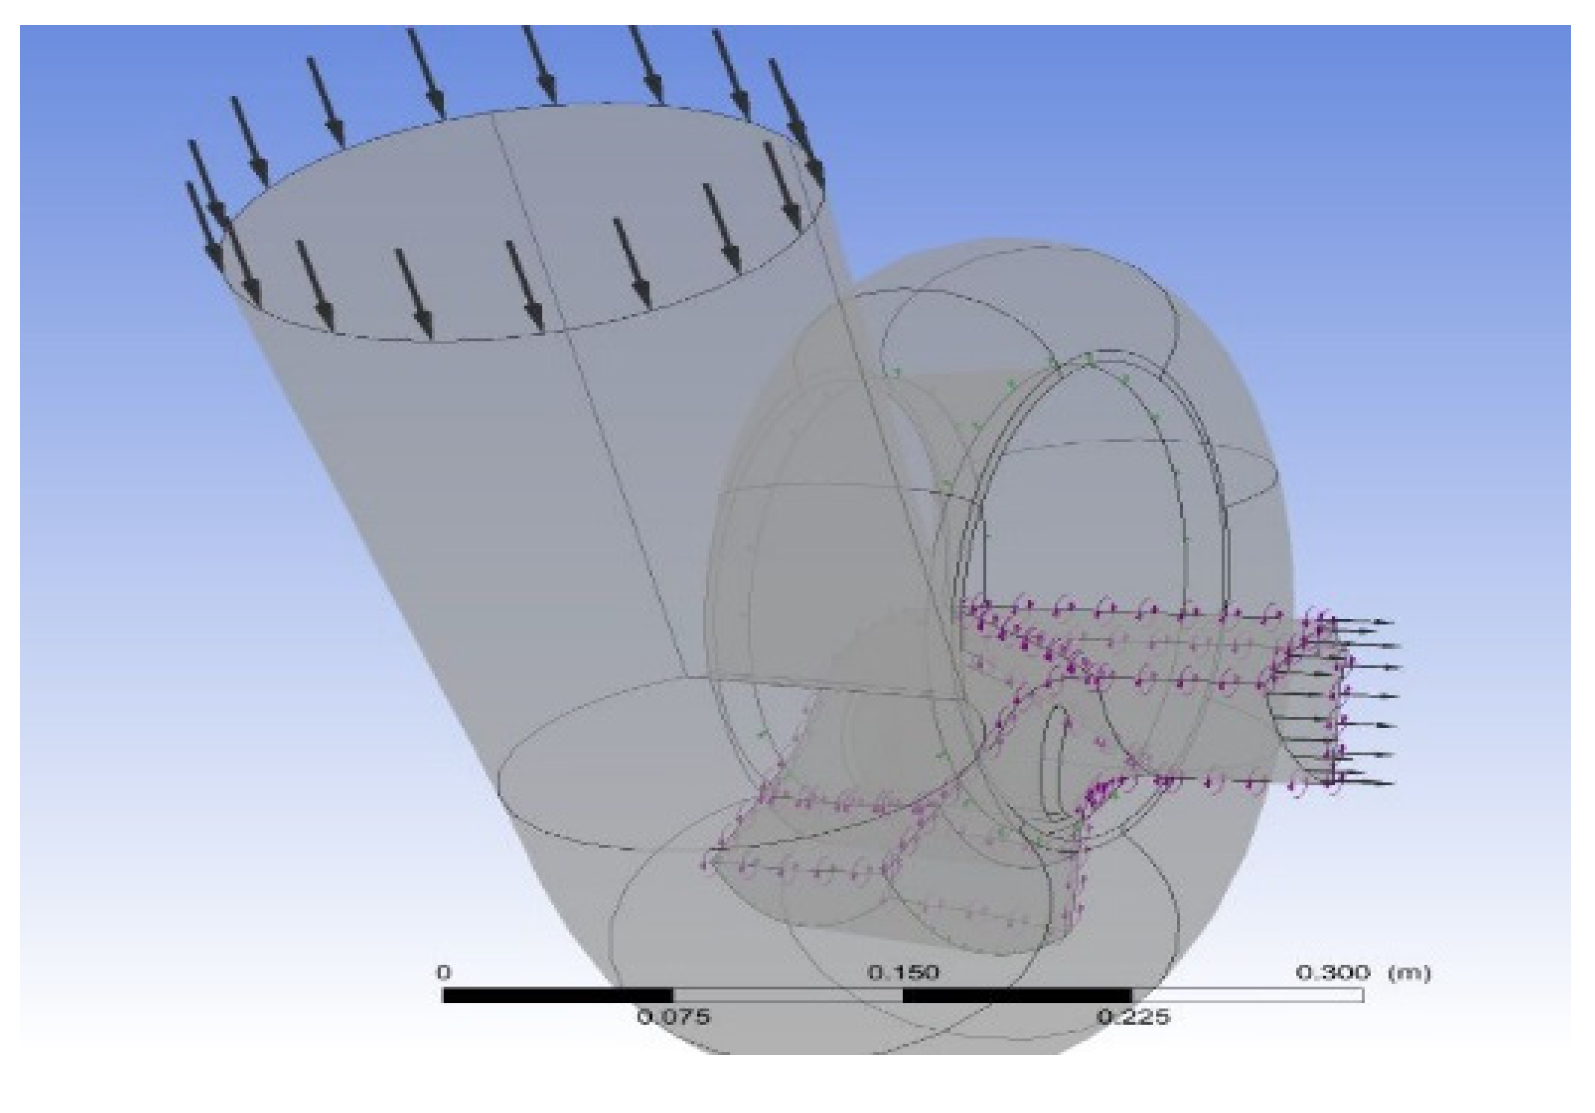
Here, the pump functions as a turbine; therefore, the outlet of the pump is the inlet of the PAT, and the direction of the flow of water through the PAT is shown in Figure 11.
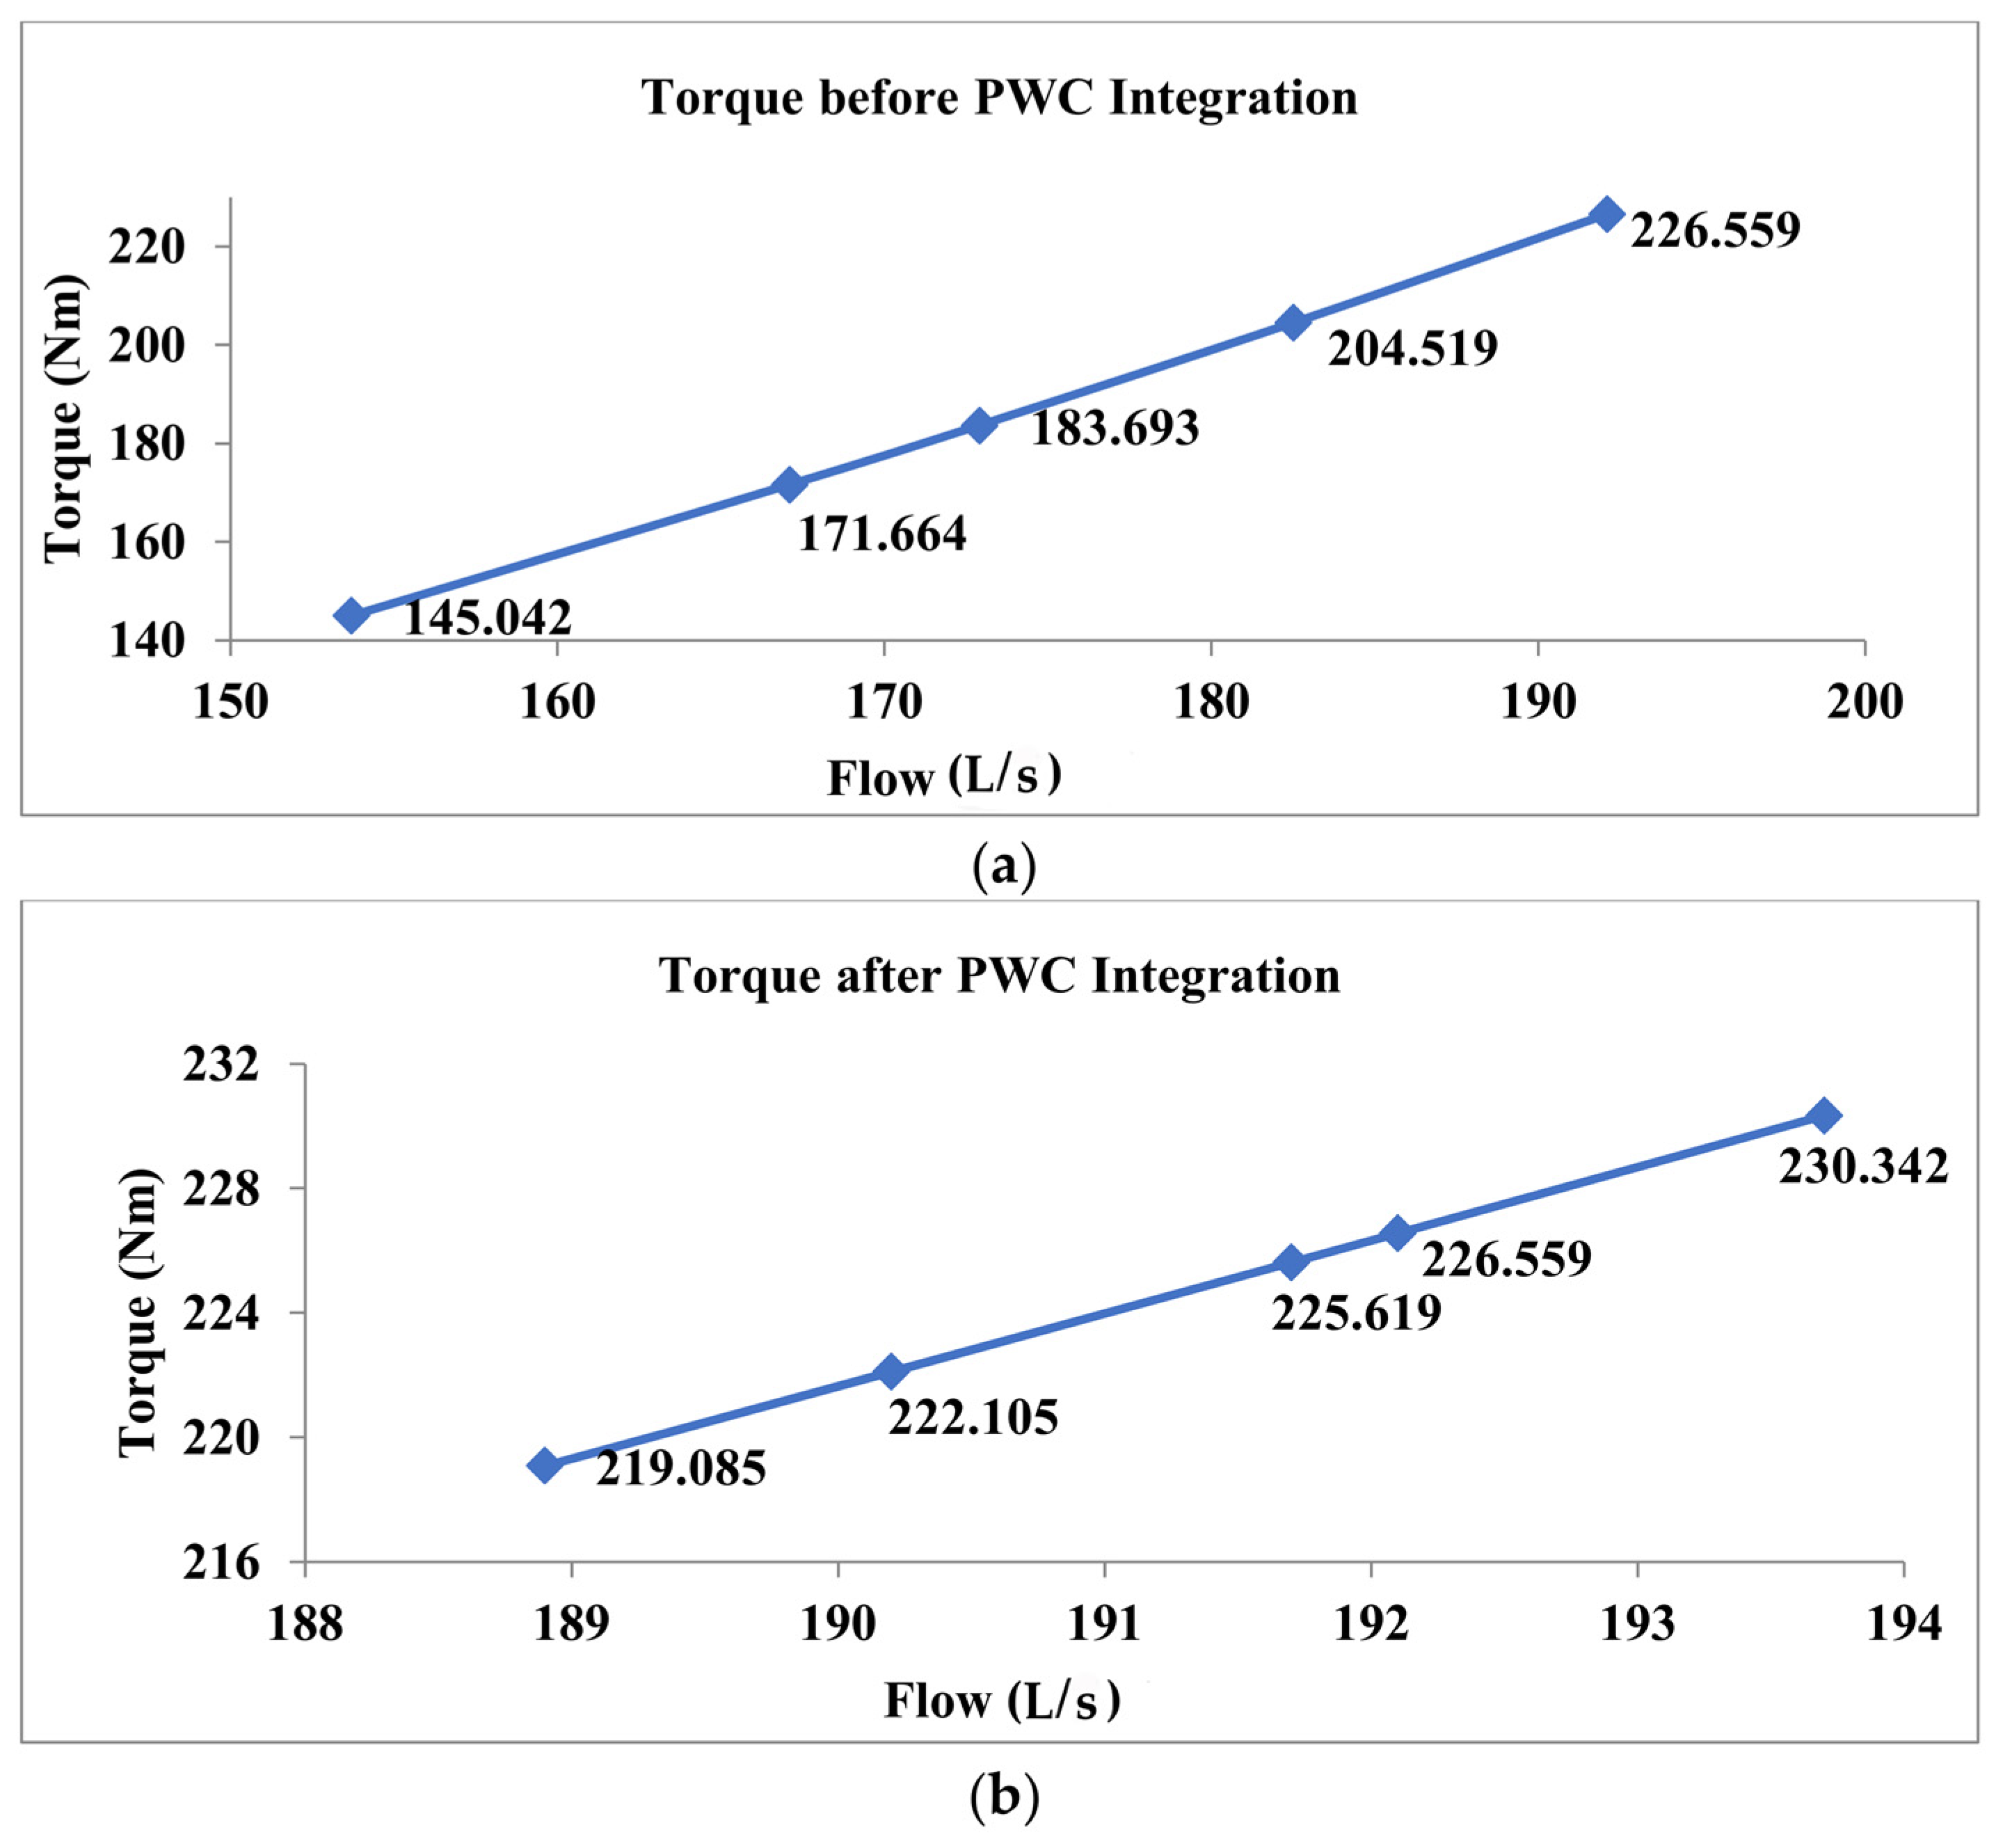
As indicated in Section 2.1, the torque produced by the variable water flow was calculated using ANSYS CFD-Post, which is a function calculator. A graphical representation of the flow and the produced torque is shown in Figure 12a. When the PWC is integrated, and a new range of flows at the inlet of the PAT is obtained, the model is simulated once again to calculate the new torque produced by the new values of the water flow. A graphical representation of the new flow and torque produced is shown in Figure 12b.
The torque produced by the PAT at variable and smooth flows is compared in Table 5, along with the deviations given before and after the integration of the PWC. These results clearly demonstrate that the values of the produced torque decrease with decreasing flow. Hence, fluctuations in the flow rate significantly affect the torque of the PAT. When the flow rate is kept constant with the integration of the PWC, the torque of the PAT is smoothed and maximized according to the design flow.

4.2. Generator Behavior on the Variable and Smooth Torque

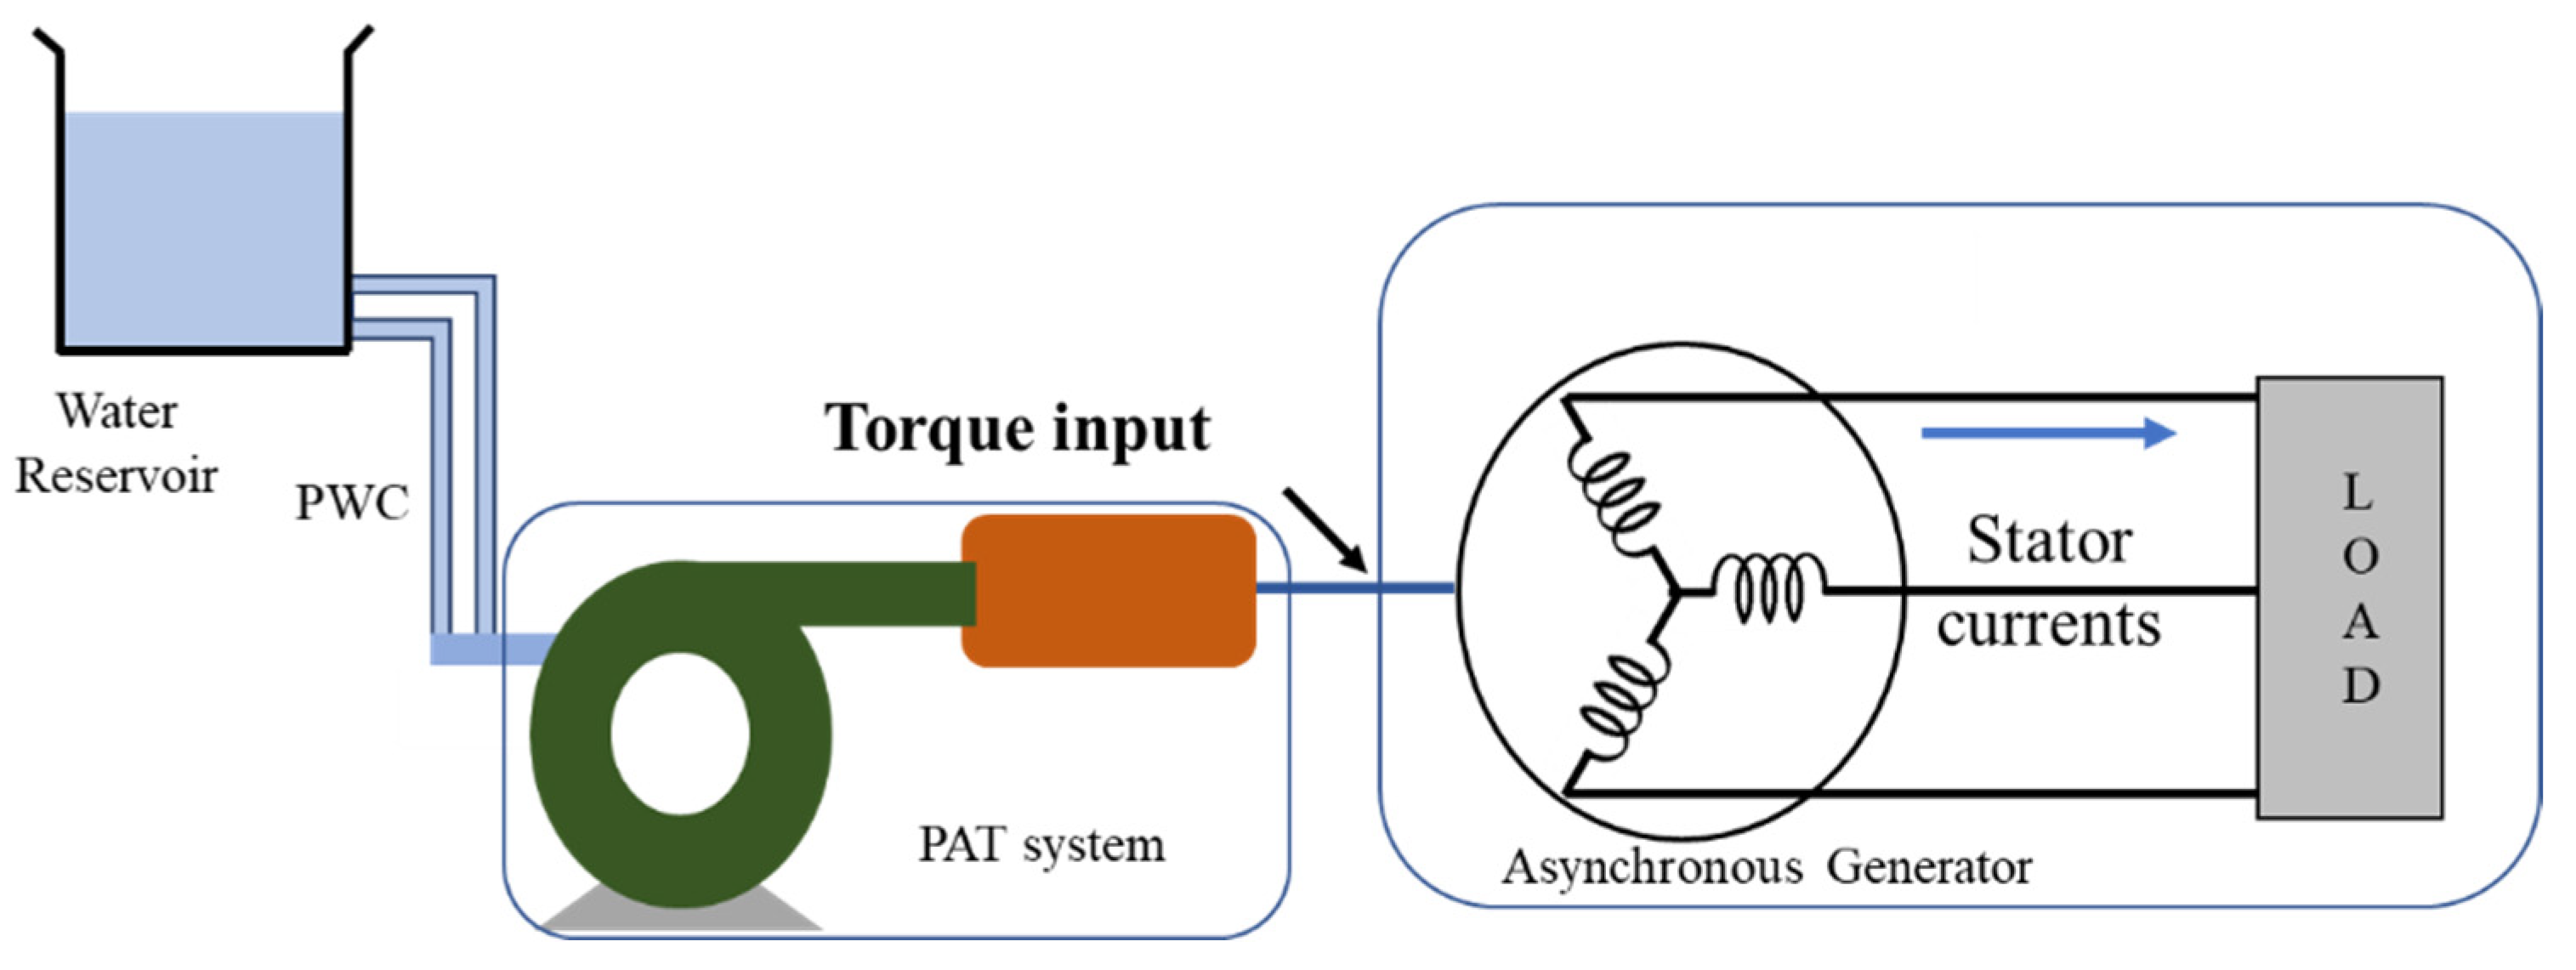
Although a smooth torque is obtained, which ultimately smooths the output of the PAT, in most cases, the PAT and generator are directly coupled. However, a Simulink model was developed to observe the behavior of the generator with variable and smooth torques, as shown in Figure 13.
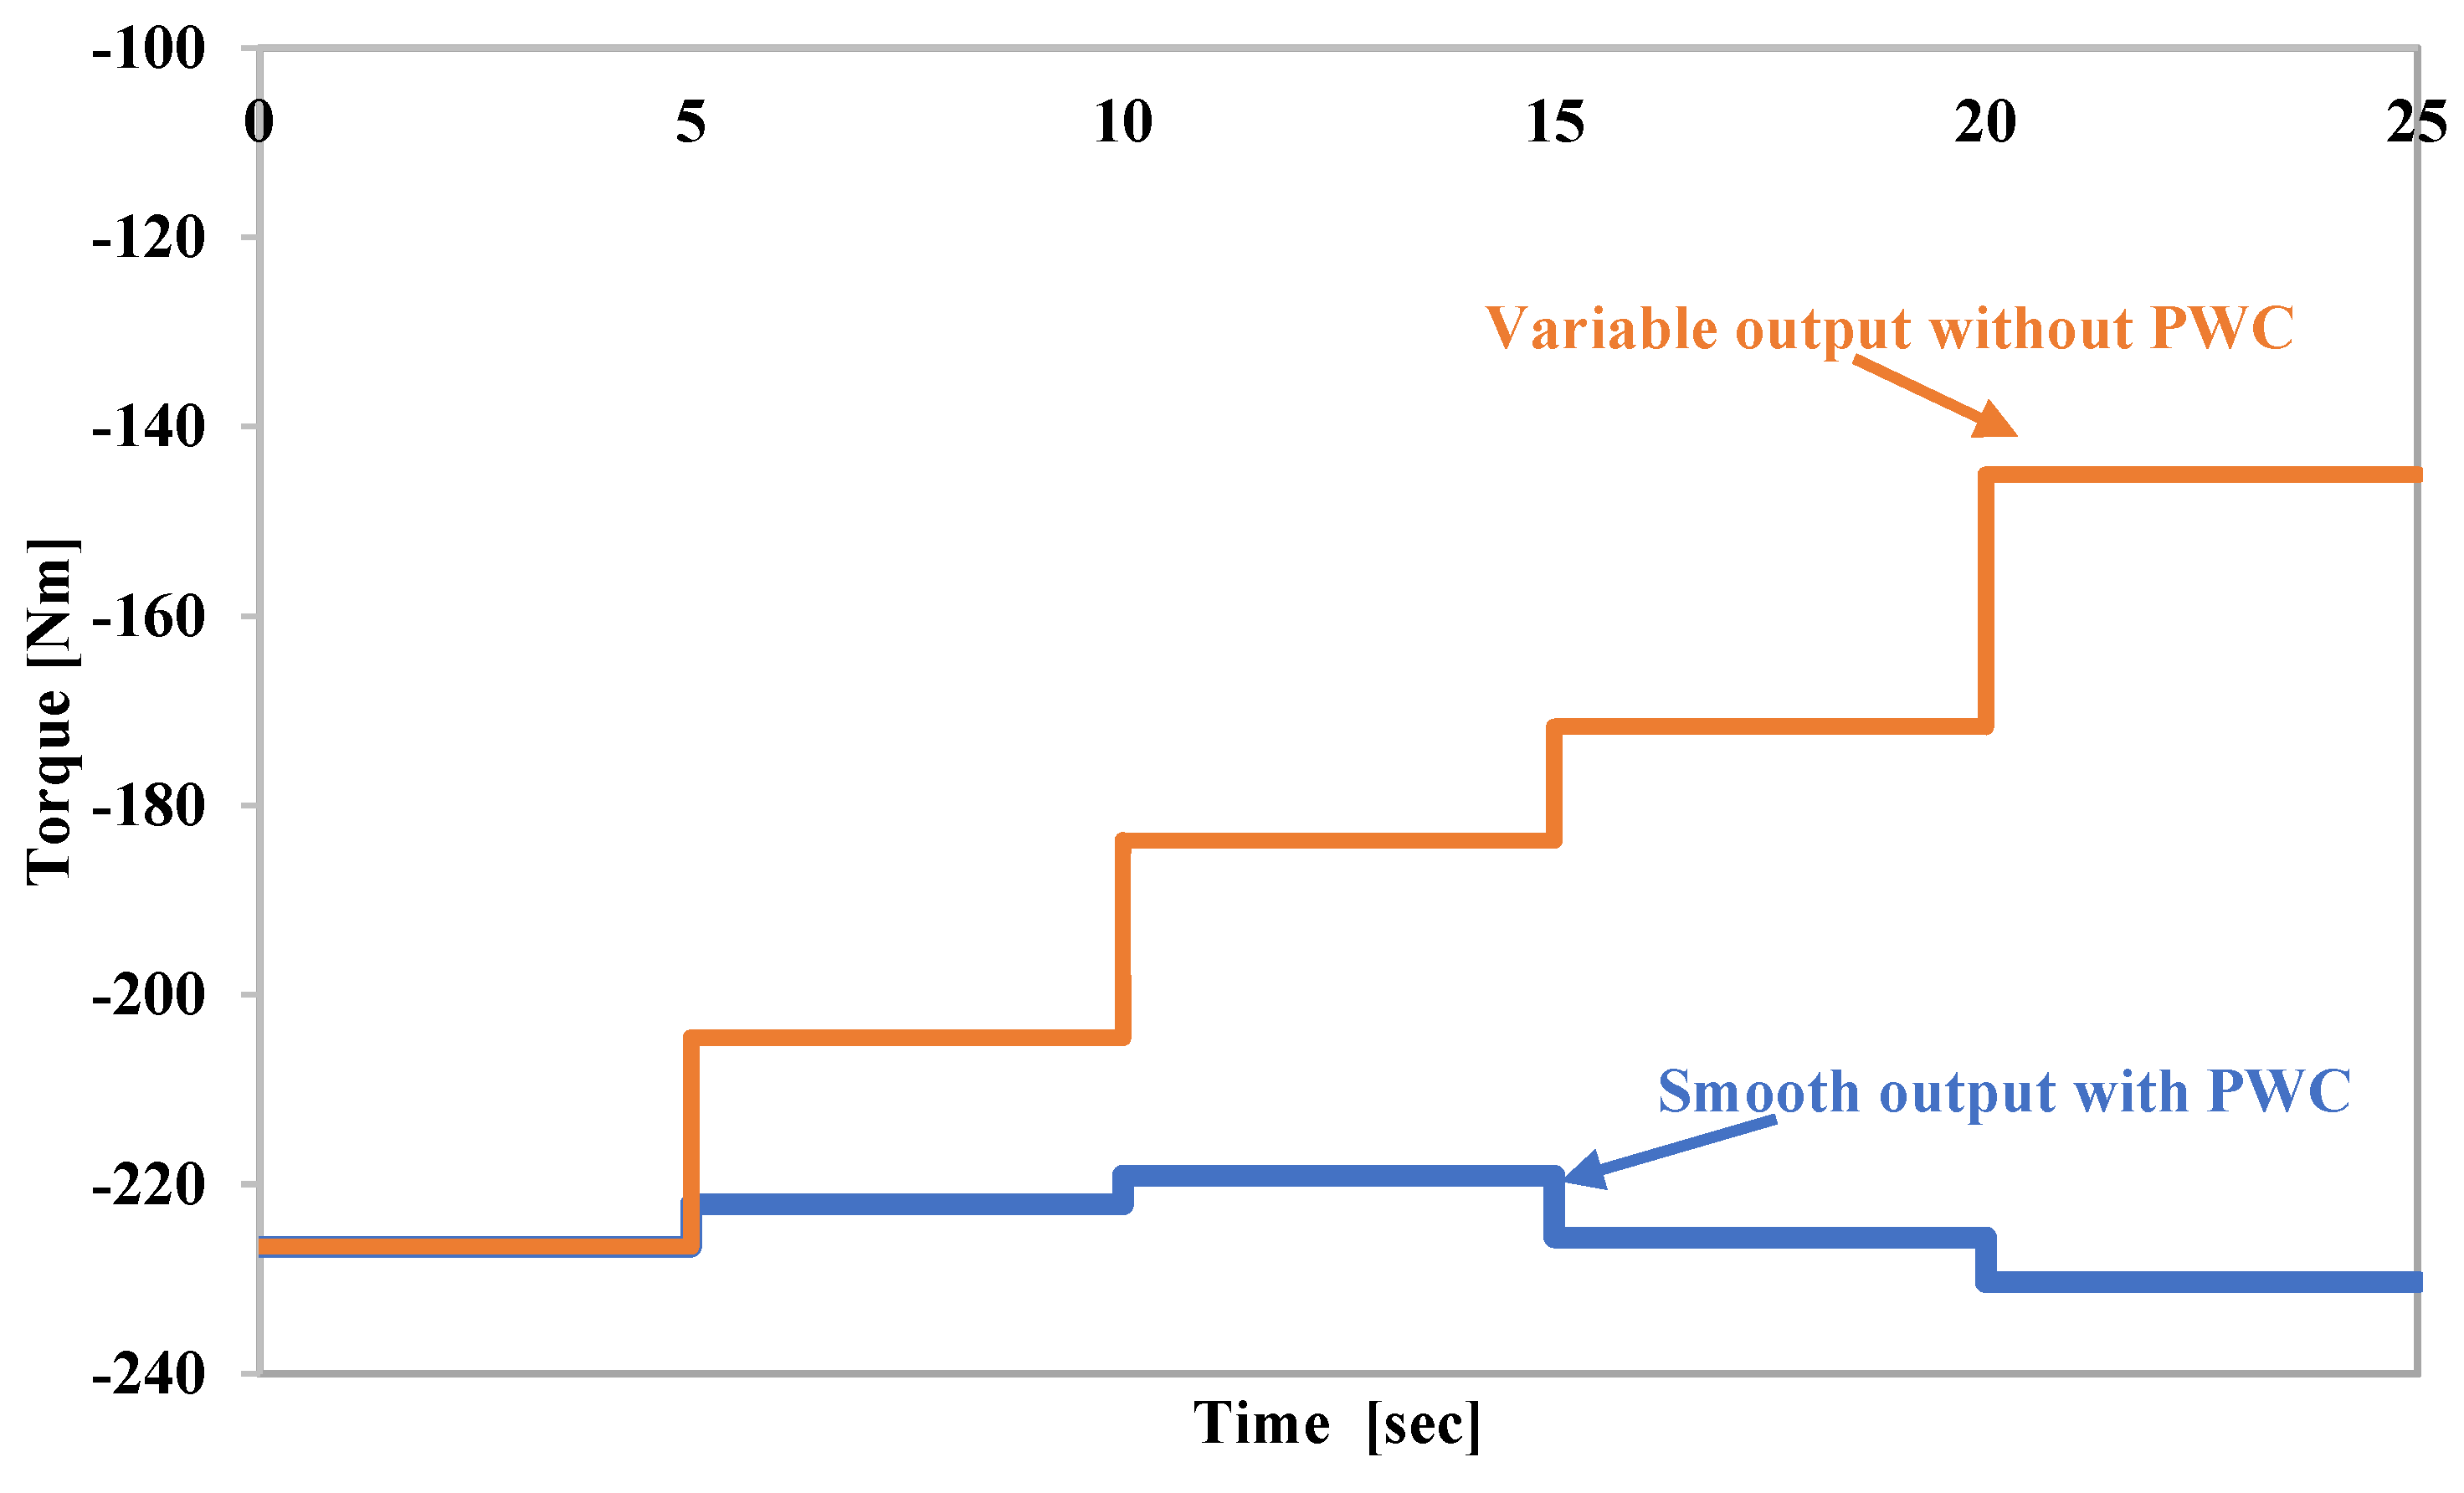
A built-in asynchronous machine block rated at 37 kW was selected from the Simulink library to simulate the behavior of the generator. This block can simulate both motors and generators, using (+) and (−) signs with the torque, respectively. The variable and smoothed torques obtained from ANSYS CFX, as shown in Figure 14, were used as the input signals in the Simulink model [32,33]. The model was simulated for 25 s, and each duration of five seconds corresponds to a different torque value.
The simulation results of the peak value of the generator current are shown in Figure 15, which demonstrates the variations in the current with respect to the torque obtained from the PAT. In a hydro system, the torque varies with the flow variation. The current depends on the torque value. Therefore, any fluctuation in the flow rate affects the output current of the generator. However, the PWC technique provides a smooth flow, which results in a smooth output.

5. Conclusions

A simple and economical PWC technique was proposed in this study to maintain the design flow at the inlet of a PAT under variable flow conditions. The proposed technique employs the series integration of parallel water columns with the same dimensions using a double-nozzle design. Paralleling the water columns creates more space for water to provide the design flow at the outlet. When water flow is decreased owing to a decrease in the upstream flow or in a PHS facility, the PWC maintains a flow at the inlet of the PAT by acting as an axillary penstock.
The design of the experiment and its findings indicate that, for a given case, the designed flow of 192.1 L/s can create a maximum torque of 226.559 Nm. The reduction in the flow to 153.7 L/s produced a reduced torque of 145.042 Nm. A total reduction of 38.4 L/s in the water flow was compensated for by integrating five PWCs, each having a flow capacity of 8 L/s. After the integration, the new flow and torque values were 193.7 L/s and 230.342 Nm, respectively, which were nearly identical to the designed values with a deviation of only 1.64%. Furthermore, based on the smooth output of the PAT, the generator output was confirmed. Thus, integration of the PWC using a double-nozzle design is an effective technique for maintaining smooth output of the PAT and generator.

Author Contributions

Conceptualization, S.H. and M.H.; methodology, M.H. and T.Y.; software, S.H. and G.A.; formal analysis, M.H., T.Y. and G.A.; writing and draft preparation, S.H., M.H. and T.Y.; review and editing, T.Y. and G.A.; supervision, H.-W.C. and M.H.; funding acquisition, H.-W.C. All authors have read and agreed to the published version of the manuscript.

Funding

This research received no external funding.

Institutional Review Board Statement

Not applicable.

Informed Consent Statement

Not applicable.

Data Availability Statement

Not applicable.

Acknowledgments

This work was supported by the National Research Foundation of Korea (NRF) grant funded by the South Korean government (No. 2022R1I1A3072104).

Conflicts of Interest

The authors declare no conflict of interest.

Nomenclature

Aarea of water discharge [m2]
Fforce [N]
ggravitational acceleration [m/s2]
Hhead height [m]
mmass of water [kg]
nnumber of water columns
Ppressure [Pa]
Poutoutput power [W]
PATpump as turbine
PWCparallel water columns
Qflow of water [L/s]
vvelocity of water [m/s]
wweight of water
ηefficiency [%]
ρdensity of water [kg/m3]

References

  1. Olabi, A.; Abdelkareem, M.A. Renewable energy and climate change. Renew. Sustain. Energy Rev. 2022, 158, 112111. [Google Scholar] [CrossRef]
  2. Bilgili, F.; Lorente, D.B.; Kuşkaya, S.; Ünlü, F.; Gençoğlu, P.; Rosha, P. The role of hydropower energy in the level of CO2 emissions: An application of continuous wavelet transform. Renew. Energy 2021, 178, 283–294. [Google Scholar] [CrossRef]
  3. Jurasz, J.; Ciapala, B. Solar–hydro hybrid power station as a way to smooth power output and increase water retention. Sol. Energy 2018, 173, 675–690. [Google Scholar] [CrossRef]
  4. Wang, Z.; Yen-Ku, K.; Li, Z.; An, N.B.; Abdul-Samad, Z. The transition of renewable energy and ecological sustainability through environmental policy stringency: Estimations from advance panel estimators. Renew. Energy 2022, 188, 70–80. [Google Scholar] [CrossRef]
  5. International Energy Agency. Available online: https://www.iea.org/reports/renewables-information-overview/supply (accessed on 6 January 2022).
  6. International Hydro Power Association (IHA). Available online: https://www.hydropower.org/iha/discover-facts-about-hydropower (accessed on 6 January 2022).
  7. Tkac, S. Hydro power plants, an overview of current types and technology. SSP-J. Civ. Eng. 2018, 13, 115–126. [Google Scholar]
  8. Paish, O. Small hydro power: Technology and current status. Renew. Sustain. Energy Rev. 2002, 6, 537–556. [Google Scholar] [CrossRef]
  9. Kaunda, C.S.; Kimambo, C.Z.; Nielsen, T.K. Hydropower in the Context of Sustainable Energy Supply: A Review of Technologies and Challenges. Int. Sch. Res. Not. 2012, 2012, 730631. [Google Scholar] [CrossRef]
  10. Alatorre-Frenk, C. Cost Minimization in Micro-Hydro System Using. PAT. Dissertation, University of Warwickshire, Coventry, UK, 1994. [Google Scholar]
  11. Aggidis, G.A.; Luchinskaya, E.; Rothschild, R.; Howard, D.C. The costs of small-scale hydro power production: Impact on the development of existing potential. Renew. Energy 2012, 35, 2632–2638. [Google Scholar] [CrossRef]
  12. Hossain, I.M.; Ferdous, S.M.; Salehin, S.; Saleque, A.M.; Jamal, T. Pump-as-turbine (PAT) for small scale power generation: A comparative analysis. In Proceedings of the 2014 3rd International Conference on the Developments in Renewable Energy Technology (ICDRET), Dhaka, Bangladesh, 29–31 May 2014. [Google Scholar]
  13. Binamaa, M.; Sua, W.-T.; Li, X.-B.; Weia, X.-Z.; Anc, S. Investigation on pump as turbine (PAT) technical aspects for micro hydropower schemes: A state-of-the-art review. Renew. Sustain. Energy Rev. 2017, 79, 148–179. [Google Scholar] [CrossRef]
  14. Morabito, A.; Furtado, G.A. Variable speed regulation for pump as turbine in micro pumped hydro energy storage application. In Proceedings of the 38th IAHR Congress, Panama City, Panama, 1–6 September 2019. [Google Scholar]
  15. Deyou, L.; Hongji, W.; Goaming, X.; Ruxhi, G.; Zhansheng, L. Unsteady simulation and analysis for hump characteristics of a pump turbine model. Renew. Energy 2015, 77, 32–42. [Google Scholar] [CrossRef]
  16. Nobile, E.; Sari, G.; Schwery, A. Variable Speed Hydro Pumped Storage as Flexible Enabler of Intermittent Renewable Penetration. In Proceedings of the 2018 IEEE Power & Energy Society General Meeting (PESGM), Portland, OR, USA, 5–10 August 2018; pp. 1–5. [Google Scholar]
  17. Elbatran, A.H.; Yakoob, O.B.; Ahmed, Y.M. Operation, performance and economic analysis of low head micro-hydropower turbines for rural and remote areas: A review. Renew. Sustain. Energy Rev. 2015, 43, 40–50. [Google Scholar] [CrossRef]
  18. Derakhshan, S.; Kasaeian, N. Optimization, Numerical, and Experimental Study of a Propeller Pump as Turbine. J. Energy Resour. Technol. 2014, 136, 012005. [Google Scholar] [CrossRef]
  19. Yang, S.-S.; Kong, F.-Y.; Jiang, W.-M.; Qu, X.-Y. Effects of impeller trimming influencing pump as turbine. Comput. Fluids 2012, 67, 72–78. [Google Scholar] [CrossRef]
  20. Yang, S.-S.; Liu, H.-L.; Kong, F.-Y.; Dai, C. Experimental, Numerical, and Theoretical Research on Impeller Diameter Influencing Centrifugal Pump-as-Turbine. J. Energy Eng. 2013, 139, 299–307. [Google Scholar] [CrossRef]
  21. Yang, S.-S.; Wang, C.; Chen, K.; Yuan, X. Research on Blade Thickness Influencing Pump as Turbine. Adv. Mechan. Eng. 2014, 6, 190530. [Google Scholar] [CrossRef]
  22. Yang, S.-S.; Kong, F.-Y.; Qu, X.-Y.; Jiang, W.-M. Influence of blade number on the performance and pressure pulsations in a pump used as a turbine. J. Fluids Eng. 2012, 134, 124503. [Google Scholar] [CrossRef]
  23. Lugauer, F.J.; Kainz, J.; Gehlich, E.; Gaderer, M. Roadmap to Profitability for a Speed-Controlled Micro-Hydro Storage System Using Pumps as Turbines. Sustainability 2022, 14, 653. [Google Scholar] [CrossRef]
  24. Binama, M.; Kan, K.; Chen, H.-X.; Zheng, Y.; Zhou, D.-Q.; Su, W.-T.; Ge, X.-F.; Ndayizigiye, J. A Numerical Investigation into the PAT Hydrodynamic Response to Impeller Rotational Speed Variation. Sustainability 2021, 13, 7998. [Google Scholar] [CrossRef]
  25. Hunt, J.D.; Zakeri, B.; Lopes, R.; Barbosa, P.S.F.; Nascimento, A.; de Castro, N.J.; Brandão, R.; Schneider, P.S.; Wada, Y. Existing and new arrangements of pumped-hydro storage plants. Renew. Sustain. Energy Rev. 2020, 129, 109914. [Google Scholar] [CrossRef]
  26. Bansal, R.K. A Textbook of Fluid Mechanics and Hydraulic Machines; Laxmi Publication (P) Ltd.: New Delhi, India, 2010. [Google Scholar]
  27. ANSYS Fluent Tutorial Guide. Release 18.0, January 2017. Available online: www.ansys.com (accessed on 5 December 2021).
  28. Zhou, L.; Hang, J.; Bai, L.; Krzemianowski, Z.; El-Emam, M.A.; Yasser, E.; Agarwal, R. Application of entropy production theory for energy losses and other investigation in pumps and turbines: A review. Appl. Energy 2022, 318, 119211. [Google Scholar] [CrossRef]
  29. Weidong, C.; Lingiun, Y.; Bing, L.; Yining, Z. The influence of impeller eccentricity on centrifugal pump. Adv. Mech. Eng. 2017, 9, 1–17. [Google Scholar] [CrossRef] [Green Version]
  30. El-Emam, M.; Zhou, L.; Yasser, E.; Bai, L.; Shi, W. Computational Methods of Erosion Wear in Centrifugal Pump: A State-of-the-Art Review. Arch. Comput. Methods Eng. 2022, 29, 3789–3814. [Google Scholar] [CrossRef]
  31. Wei, Y.; Shi, Y.; Shi, W.; Pan, B. Numerical Analysis and Experimental Study of Unsteady Flow Characteristics in an Ultra-Low Specific Speed Centrifugal Pump. Sustainability 2022, 14, 16909. [Google Scholar] [CrossRef]
  32. Simulink Getting Started Guide, Release 2015. Available online: www.mathworks.com (accessed on 15 December 2021).
  33. Alberizzi, J.C.; Renzi, M.; Nigro, A.; Rossi, M. Study of a Pump-as-Turbine (PAT) speed control for a Water Distribution Network (WDN) in South-Tyrol subjected to high variable water flow rated. Energy Procedia 2018, 148, 226–233. [Google Scholar] [CrossRef]
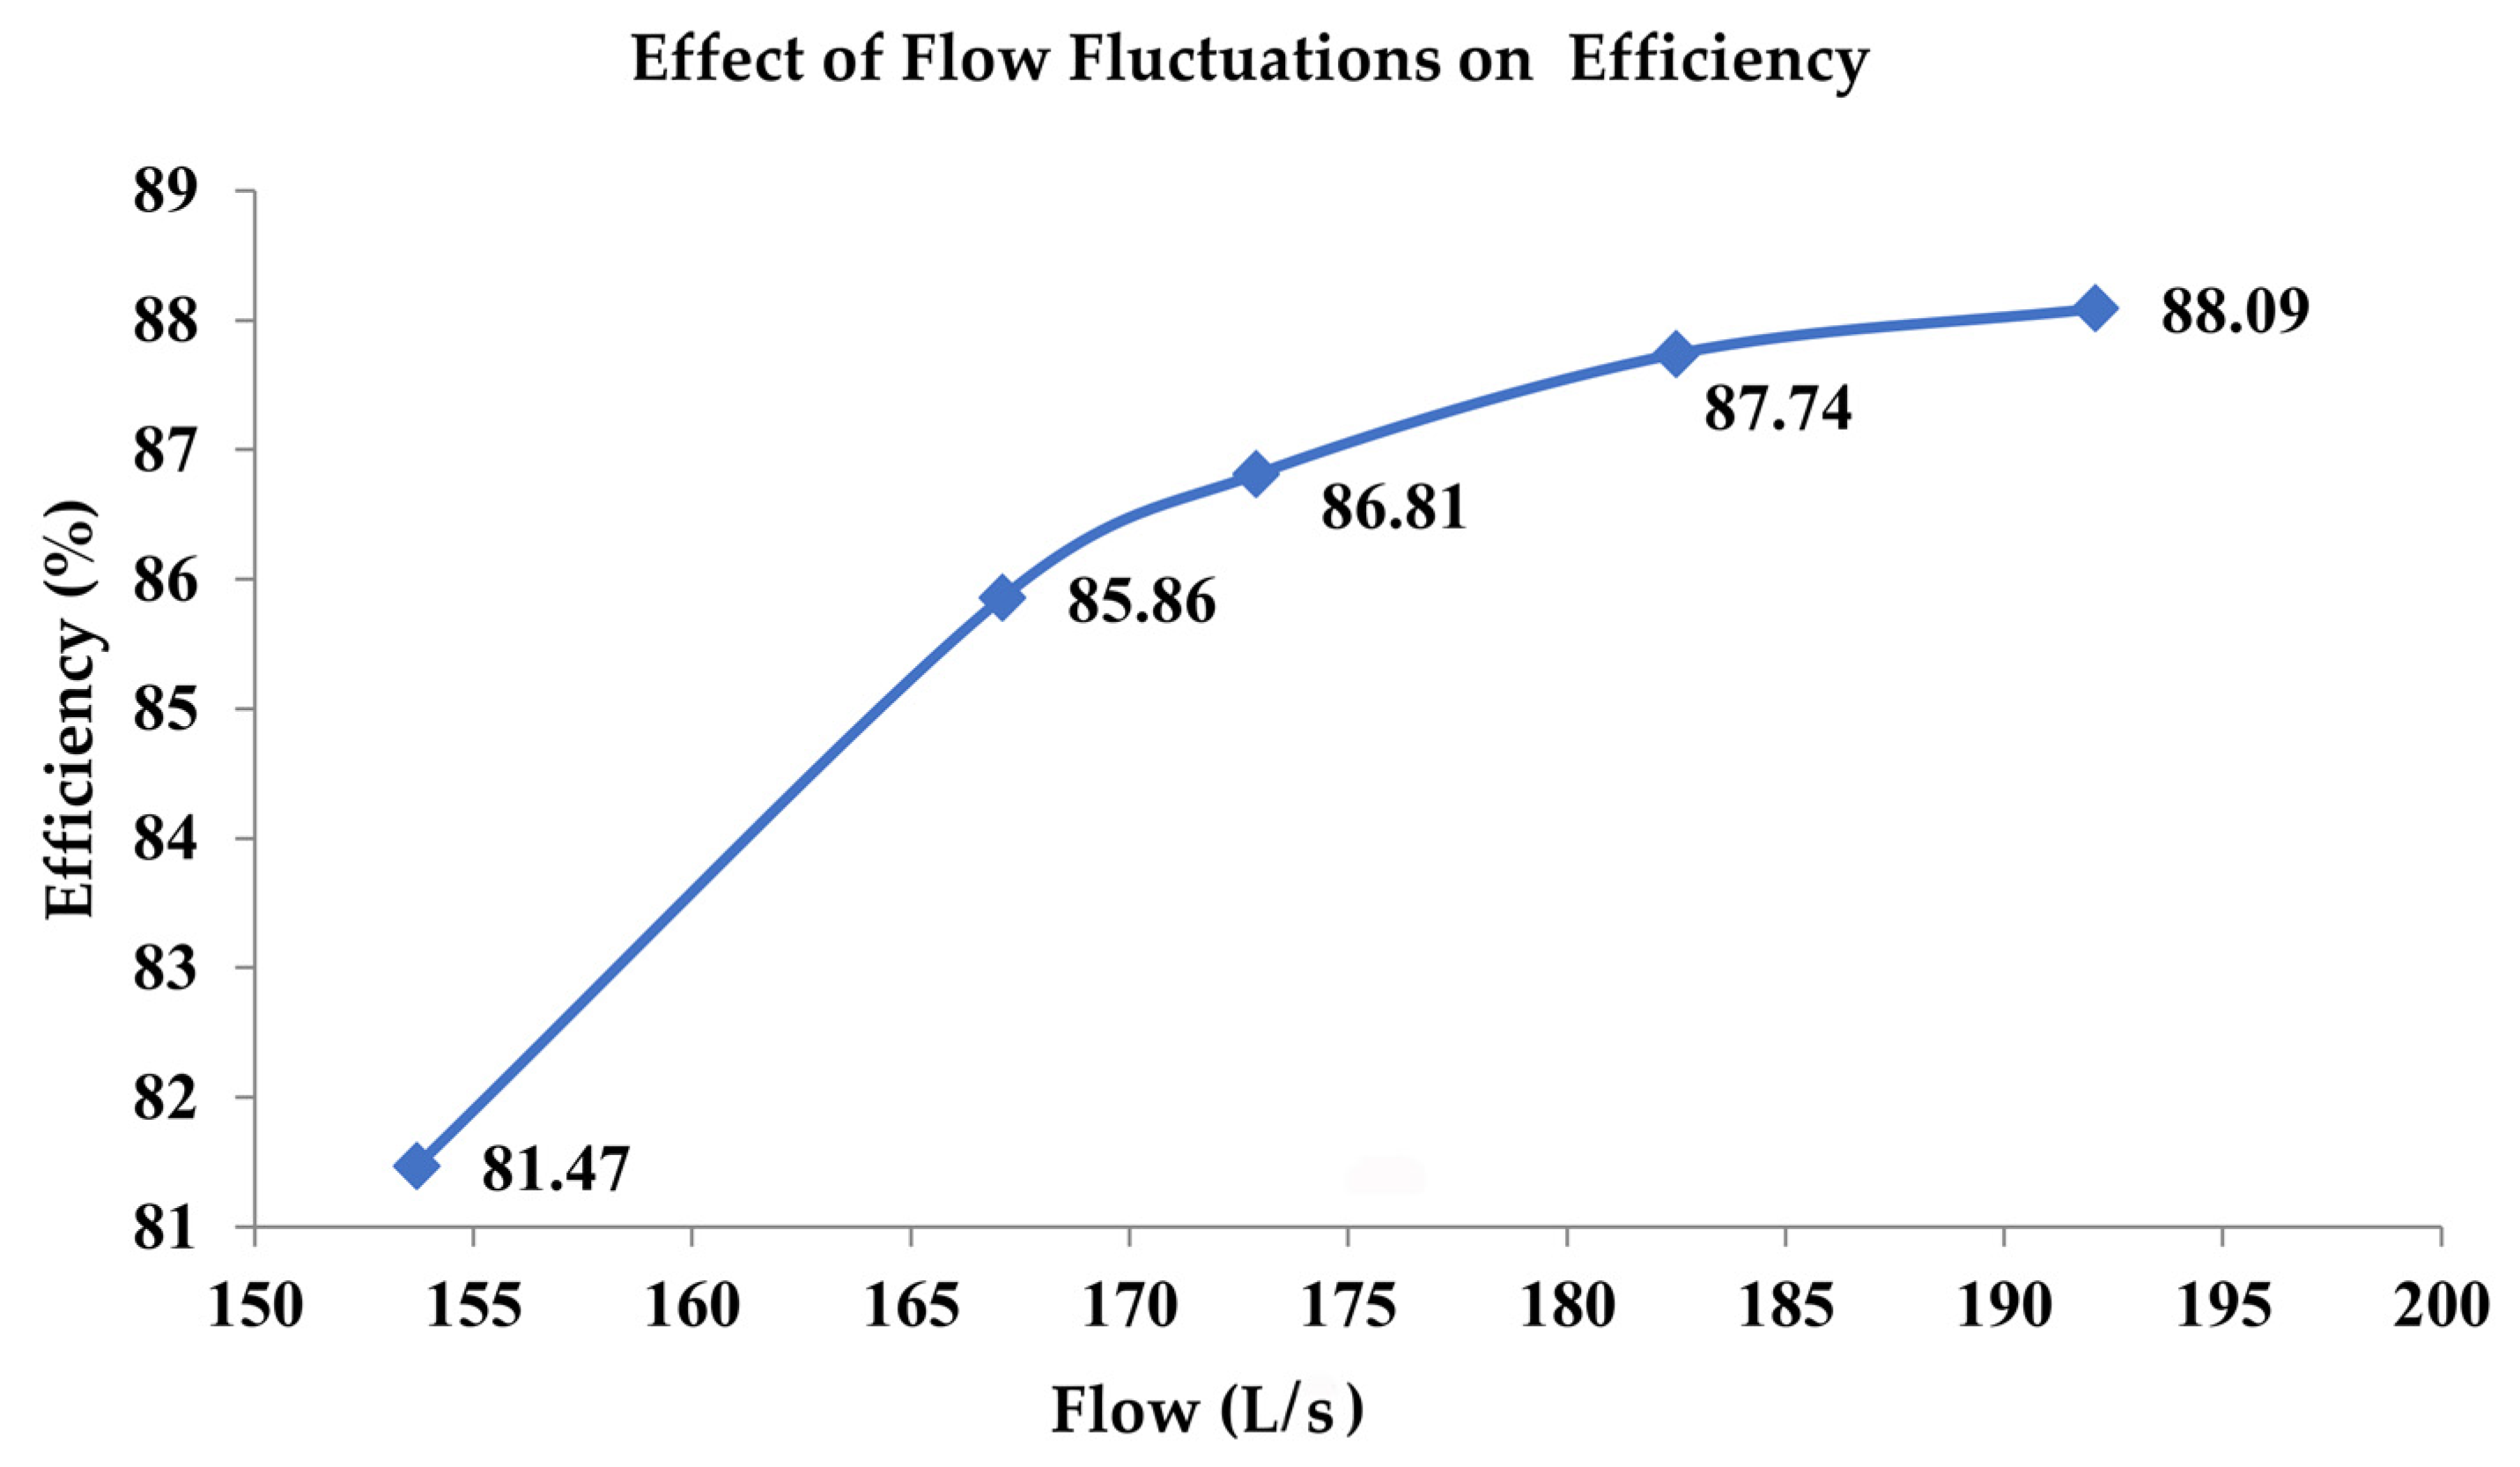
Figure 1. Effect of flow variations on efficiency.
Applsci 13 03232 g001
Figure 2. Meshing of PWCs.
Applsci 13 03232 g002
Figure 3. Grid independence test of the two PWCs.
Applsci 13 03232 g003
Figure 4. Velocity and pressure produced by (a) one water column, (b) two water columns, (c) three water columns, (b) four water columns, and (e) five water columns.
Applsci 13 03232 g004aApplsci 13 03232 g004b
Figure 5. Variations in the pressure, flow, and velocity as the number of PWCs increases.
Applsci 13 03232 g005
Figure 6. Integration of the PWC to maintain the flow.
Applsci 13 03232 g006
Figure 7. Integration of the PWC with the existing penstock.
Applsci 13 03232 g007
Figure 8. Side views of the pump designed in Vista CPD.
Applsci 13 03232 g008
Figure 9. Meshing of the impeller and volute.
Applsci 13 03232 g009
Figure 10. Meshing independency test of the pump.
Applsci 13 03232 g010
Figure 11. Direction of the flow of water for the PAT.
Applsci 13 03232 g011
Figure 12. Torque produced by PAT (a) before PWC integration and (b) after PWC integration.
Applsci 13 03232 g012
Figure 13. Overall system to observe the behavior of the generator.
Applsci 13 03232 g013
Figure 14. Torque input signal to the generator.
Applsci 13 03232 g014
Figure 15. Output current of the generator for both variable and smooth torques.
Applsci 13 03232 g015
Table 1. Dimension of the water columns and solver settings.
Dimensions/SettingsValues
Head10 m
Diameter of the outlet nozzle0.0635 m
Upper diameter of each water column0.4572 m
Diameter of the nozzle used at the bottom of each water column0.2286 m
Working fluidWater (liquid)
Outlet pressure0 Pascals
Turbulence modelk-ω (SST)
Density of water1000 kg/m3
Boundaries
InletVelocity inlet
OutletPressure outlet
Wall functionStandard
Table 2. Mesh report of PWC.
No. of PWCElement SizeMethod of MeshingInflation LayersNo. of Elements
1 40Tetrahedrons7274,274
2 40Tetrahedrons7358,456
340Tetrahedrons7543,020
440Tetrahedrons7736,088
540Tetrahedrons7926,713
Table 3. Flow profile of PAT before and after the addition of the PWCs.
Flow (L/s)Reduced Flow (L/s)PWC Added
(8 L/s Each)
Additional Flow
(L/s)
New Flow
(L/s)
192.1NilNoNil192.1
182.29.918190.2
172.919.2216188.9
167.125324191.7
153.738.4540193.7
Table 4. Mesh report of the pump.
DomainNodesElementsTetrahedraWedgesHexahedra
R1(Passage)663,175627,64000627,640
S1(B75)82,927258,746165,19693,5500
All Domains746,102886,386165,19693,550627,640
Table 5. Torque of PAT regarding different flow values.
Before PWC IntegrationAfter PWC Integration
Flow (L/s)Torque (Nm)Deviation (%)Flow (L/s)Torque (Nm)Deviation (%)
192.1226.5590192.1226.5590
182.5204.5199.73190.2222.1051.97
172.9183.69318.92188.9219.0853.3
167.1171.66424.23191.7225.6190.41
153.7145.04235.98193.7230.3421.64
Disclaimer/Publisher’s Note: The statements, opinions and data contained in all publications are solely those of the individual author(s) and contributor(s) and not of MDPI and/or the editor(s). MDPI and/or the editor(s) disclaim responsibility for any injury to people or property resulting from any ideas, methods, instructions or products referred to in the content.