Communication

Tunable Spatial Resolution Focused Laser Differential Interferometer for Density Fluctuation Measurement

Facility Design and Instrumentation Institute, China Aerodynamics Research and Development Center, Mianyang 621000, China
*
Author to whom correspondence should be addressed.
Appl. Sci. 2023, 13(5), 3253; https://doi.org/10.3390/app13053253
Submission received: 18 January 2023 / Revised: 23 February 2023 / Accepted: 27 February 2023 / Published: 3 March 2023

Abstract

:
We first propose and demonstrate a novel approach for achieving a focused laser differential interferometer (FLDI) system with tunable spatial resolution. The spatial resolution of the FLDI can be adjusted continuously between 83 μm and 382 μm. The density fluctuation of a supersonic shear flow is measured using the FLDI system with a spatial resolution of 182 μm, and the density fluctuations at different locations of the supersonic shear flow are measured and analyzed. The ability to adjust the spatial resolution in this work is of great significance for enhancing the spatial resolution and flexibility of the FLDI system.

1. Introduction

For the characterization and study of high-speed flow and combustion phenomena, non-intrusive measurement techniques based on optics and laser technology have attracted considerable attention in recent years. It has the potential to break through the limitations of traditional methods, such as thermocouple [1,2] and pitot probes [3,4], owing to the advantages of high precision, visualizing, non-interfering, wide range of measurements. Various non-intrusive measurement techniques, such as planar laser-induced fluorescence (PLIF) [5,6,7], resonantly enhanced focused schlieren deflectometry (REFSD) [8], nanoparticle-based planar laser scattering (NPLS) [9], and focused laser differential interferometry (FLDI) [10,11,12,13,14,15], have been developed to measure the density distribution and fluctuation of the flow field which are of great significance to research the boundary layer transition. Specifically, the FLDI system is a non-imaging, common path, polarizing interferometer, which converts the information of density fluctuation into light intensity modulation based on the Gladstone–Dale relation and interference. Owing to the rapid development of modern lasers and high-speed data-acquisition technologies, the FLDI system has the advantage of high spatial resolutions, high response frequency, and high flexibility, which can realize the measurement of density fluctuations at any interesting point without disturbance from other locations.
The FLDI system was firstly proposed by Smeets et al., to reduce the line-of-sight integrating effect and measure the density fluctuation of wind tunnel and pedestal jet platforms [16,17,18,19]. With the availability of high-speed data acquisition systems, the FLDI technique was developed rapidly in the last decade. In 2013, Parziale et al., used FLDI to study boundary layer instabilities for a cone in hypervelocity conditions and demonstrated reproducible measurements of the acoustic instability associated with the second Mack mode [20]. Recently, Huazhong University of Science and Technology studied the nonlinear behavior of boundary layer instability waves upon a flared-cone model using FLDI [21]. Birch et al., used an FLDI system to investigate the freestream disturbances in the University of Southern Queensland’s Mach 6 hypersonic wind tunnel [22]. Lawson et al., developed the quantitative measurement of the refractive index field by using a Mach–Zehnder interferometer, and the response sensitivity of the FLDI system was explored by building a theoretical model of FLDI [23]. Ceruzzi et al., analyzed the sensitivity function and effective measurement region of the FLDI system experimentally and theoretically [24]. Beyond density fluctuations, FLDI has been used for measurements of the streamwise convective velocity of disturbances, an analysis based on signal correlation between a pair of neighboring FLDI beams [25,26,27]. Ceruzzi et al., measured the thickness of the wall boundary layer and the velocity profiles in the boundary layer with the single-point and two-point FLDI systems [28]. Furthermore, the accuracy of the measurement results is close to that of the traditional measurements. However, all of those reported works mentioned above are based on the fixed spatial resolution FLDI system, and the spatial resolutions are greater than 200 μm, which depends heavily on the manufacturing process of birefringence crystals.
This paper proposes an FLDI system with a tunable spatial resolution that covers a range of 83–382 μm. Utilizing the spatial-resolution-tunable FLDI system, the density fluctuation characteristics of eight locations in a supersonic shear flow are measured. The results compare well to the numerical simulation data, which yield that the density fluctuation frequency decreases as the shear flow transmits, accompanied by the growth of the larger structures in the flow field.

2. Materials and Methods

The principle of the FLDI system depends on a phase difference owing to the nonuniform density generated by two orthogonal polarization beams passing through the flow field and obtaining a phase difference owing to the nonuniform density of the two optical paths. Here, the optical paths of the two beams, except for the rhomboid region in the middle, can be considered common path due to the tiny separation of the two beams, which indicates that the phase difference Δφ is mainly caused in the rhomboid region, especially the two convergence points. Then, the polarization state of the combined beam through a Wollaston prism is dependent on Δφ, and the intensity I of the combined beam through the polarizer can be described as follows [29]
I = I 1 + I 2 + 2 I 1 I 2 cos ( Δ φ )
where I1 and I2 are the intensity of the two beams. To obtain the maximum interference contrast ratio, I1 and I2 should be identical, which can be realized by adjusting the half-wave plate. According to the above analysis, the time-varying density fluctuation is characterized by collecting the intensity variation, and the power spectrum of density fluctuation can be obtained by fast Fourier transform (FFT) processing.
The separation distance of two orthogonally polarization beams on the focus lens changes as the Wollaston prism is in a different position. In other words, the distances of the virtual point sources introduced by the two divergent orthogonal polarization beams and the two convergence points within the measurement area change by horizontally adjusting the position of the Wollaston prism, which leads to the spatial resolution variation of the FLDI system. Therefore, the spatial resolution of the FLDI system can be adjusted by synchronously moving the Wollaston prisms.
Figure 1 provides the schematic and image of the experimental setup of the FLDI system, which consists of the modules of the beam emitting portion and the beam receiving portion. In the beam emitting module, the laser source is a 532 nm continuous narrow linewidth pigtail-fiber laser delivered 20 mW power. The incident laser passes through a combination of a polarizer and half-wave plate, generating a linearly polarized beam with a high polarization ratio (over 20 dB) and polarization direction adjustment. A special pinhole is used to regulate the size of the beam to match up with the aperture of the Wollaston prism (W1). Two orthogonally polarization beams with a small divergence angle can be obtained through W1 with a divergence angle of less than 2′. The two beams pass through the convex lens L1 and focus on two points with the separation distance Δx in the measurement area. Here, note that the separation distance Δx is defined as the spatial resolution in spanwise directions. Similar to the beam emitting module, the beam receiving module consists of a convex lens (L2) and a Wollaston prism (W2). The two orthogonal beams after the flow field are collected by utilizing L2 and merged into a single beam with a special polarization state through W2. A polarizer is used to convert polarization into intensity modulation, then the intensity of the beam is collected by a fast photodetector (D, DH-GDT-D020V) with a 10 MHz bandwidth. Here, the data acquisition system has a sampling rate of 1 MHz.
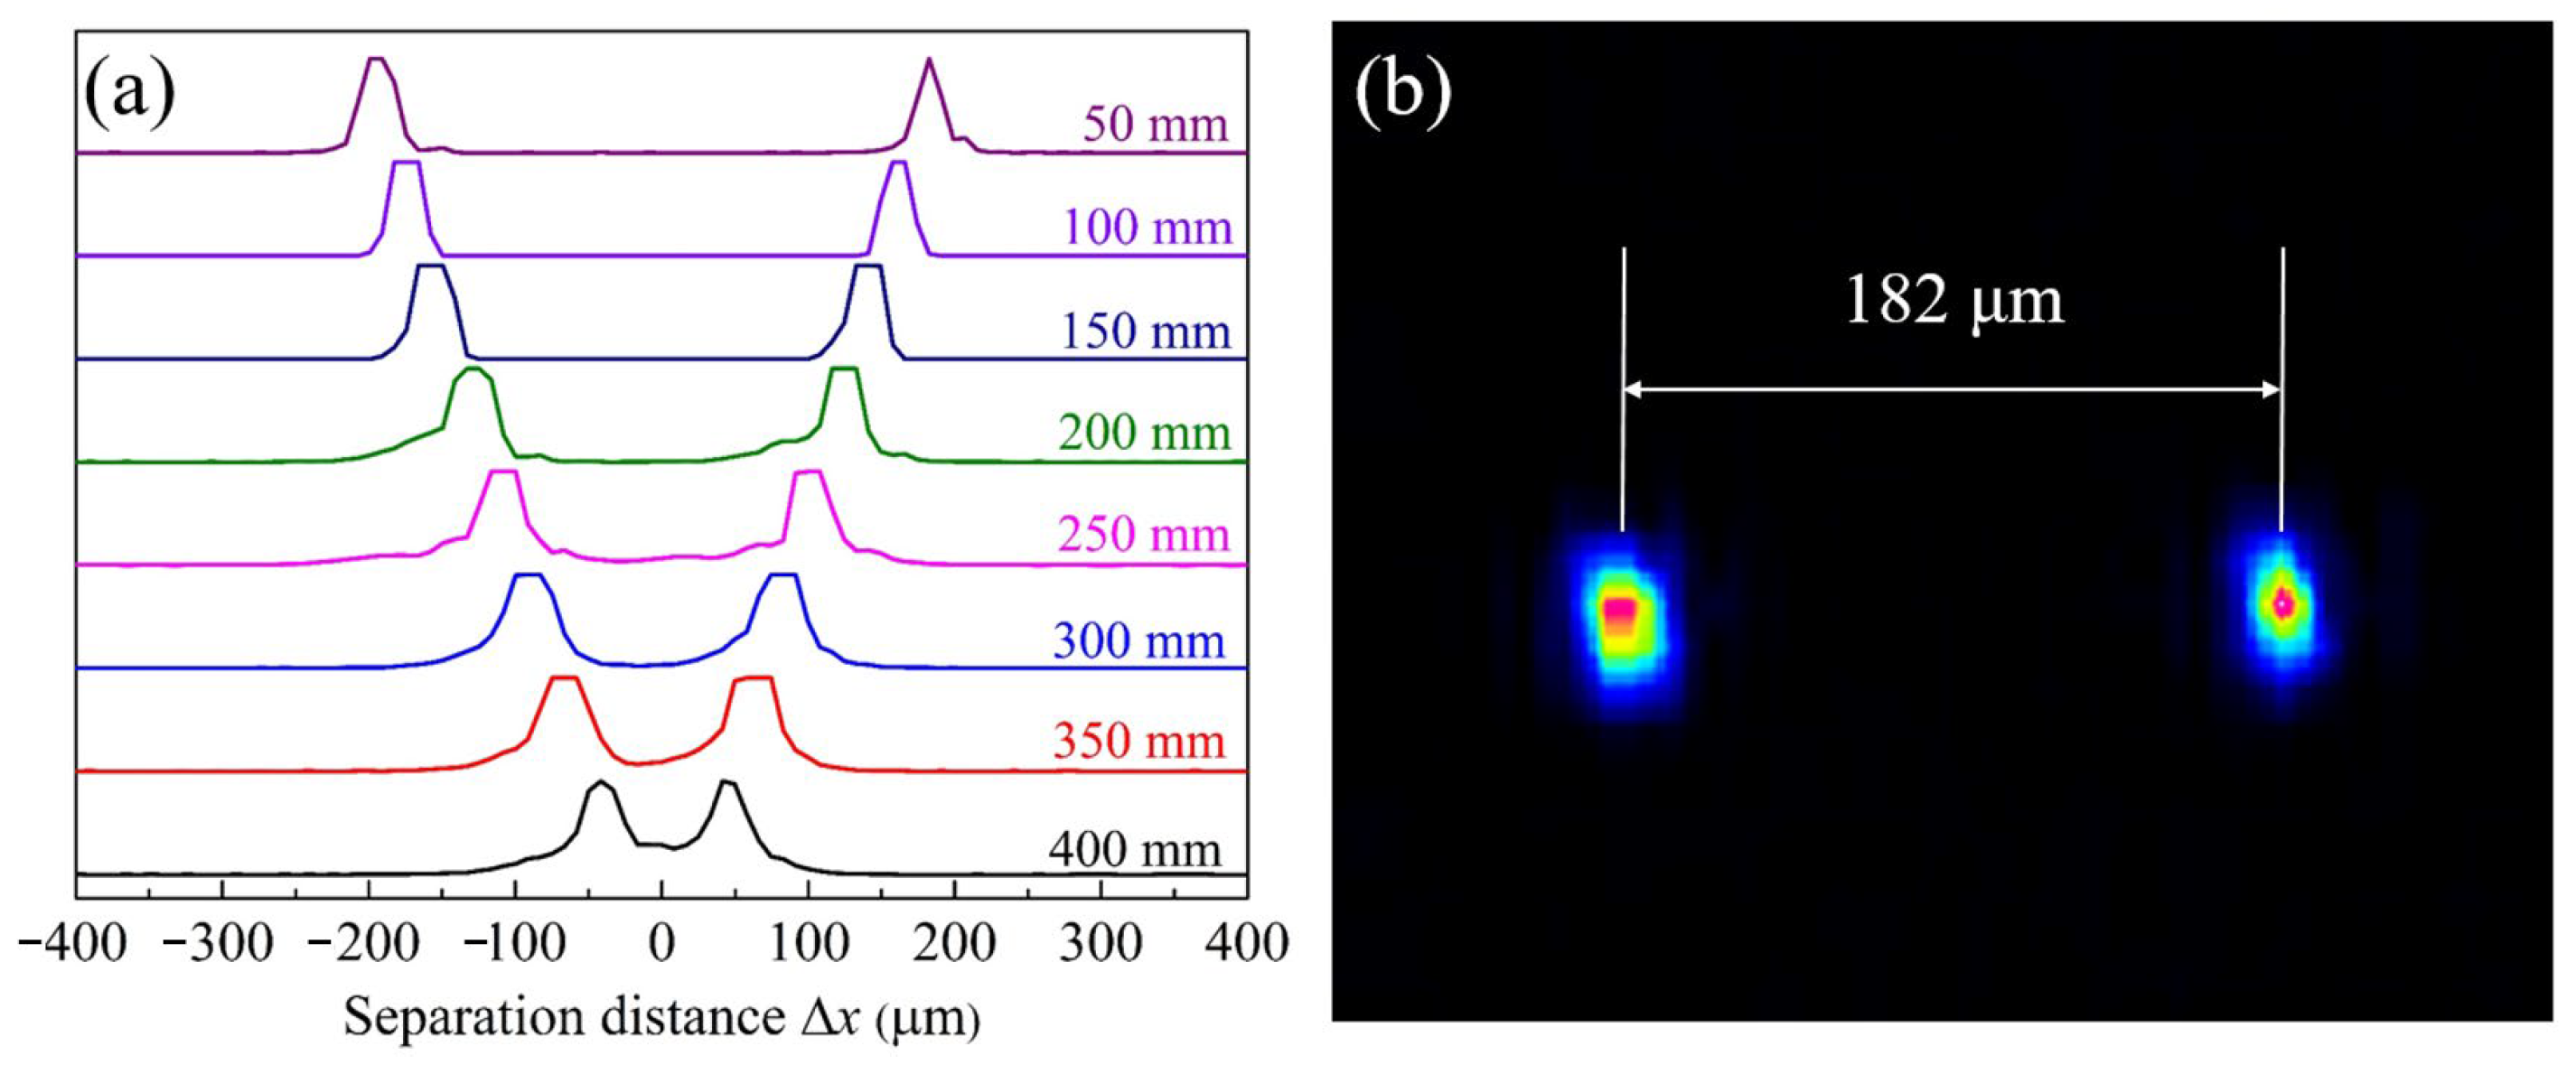
In our experiment, the focal lengths of L1 and L2 are 250 mm. The convergence points are about 500 mm from the lenses L1 and L2. As mentioned before, the spatial resolution of this FLDI system can be adjusted by moving W1 and W2 synchronously which are installed on the two-dimensional moving stages, respectively. Figure 2a shows the separation distance of the two convergence points with different distances (50 mm–400 mm) between the Wollaston prism and the convex lens. It is clear that the spatial resolution varies from 83 μm to 382 μm, with a tuning range around of 300 μm. The tuning range can be further enlarged using the Wollaston prism with a larger separation angle or longer-focus convex lens.
According to Ref. [29], transfer function H is an important index for FLDI system performance. It can be described as
H = 2 k Δ x sin ( k Δ x 2 ) exp ( w 0 2 k 2 8 )
here, k is the wavenumber of the density disturbance field and not the wavenumber of the laser. w0 is the beam waist radius. The transfer function H determines the cut-off frequency of the FLDI system, which characterizes the ability of this system to recognize different density fluctuation scales. It is clear that the transfer function is not only affected by the Gaussian characteristics of the beam, but also by the separation distance Δx, that is, the spatial resolution of the FLDI system. Although the latter has a weaker impact than the former, its influence on the system performance cannot be ignored.
The cutoff frequency of the FLDI system decreases as the separation distance Δx increases, and then the small density fluctuation scale cannot be recognized effectively. Therefore, we should choose a small separation distance Δx, but also make sure that the two focal points are completely separated to avoid crosstalk. Here the separation distance Δx was selected as 182 μm in the experiment because the two convergence points are already distinguished. The result is smaller than those of other systems previously reported, which indicates this FLDI system has a high spatial resolution. The distance between the two convergence points is measured by a CCD camera, shown in Figure 2b.

3. Results and Discussion

3.1. Device Calibration

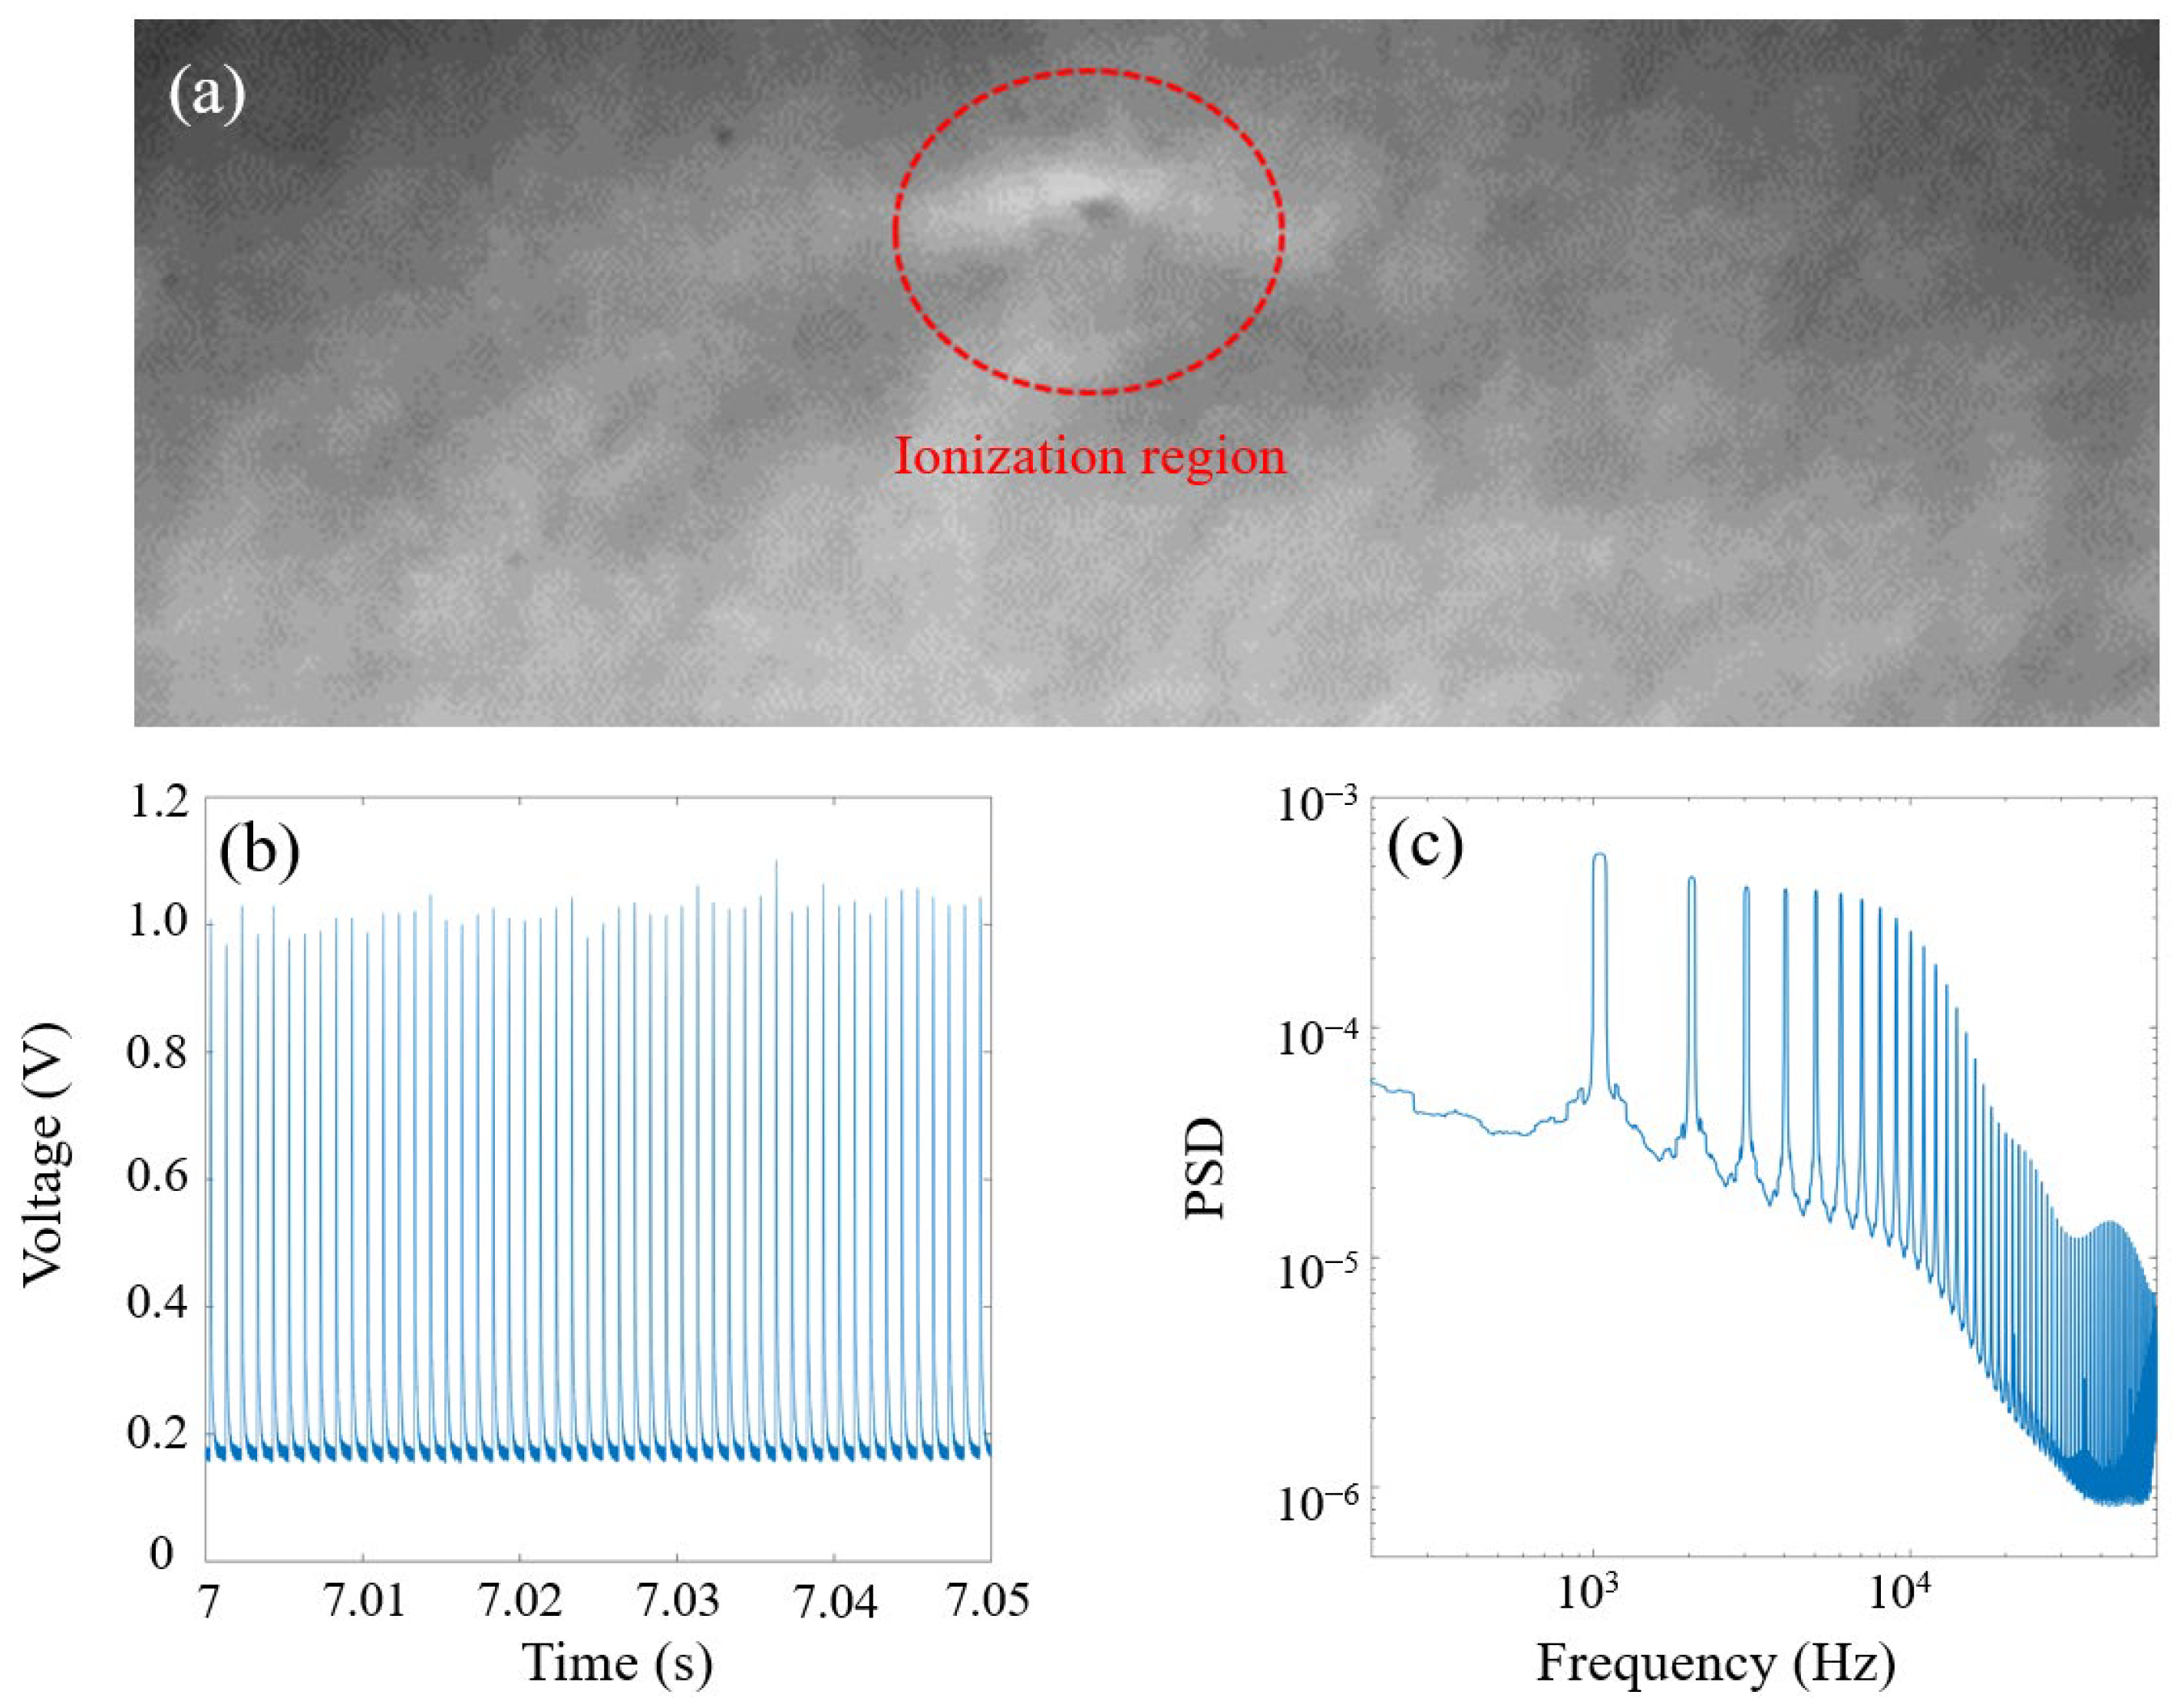
A 780 nm femtosecond laser (the pulse duration is 120 fs) was used to verify the measurement accuracy of the FLDI system. The laser energy of a single pulse is 2.4 mJ with a repetition frequency of 1 kHz. An artificial density fluctuation is introduced by focusing a femtosecond laser to ionize the air and generate shockwaves. The schlieren image of the ionization point is shown in Figure 3a, and the ionization region caused by femtosecond laser pulse can be observed clearly from the schlieren image. Figure 3b shows the measurement results with a sampling time of 50 ms. It can be seen that the voltage signal is characterized by a similar amplitude with a repetition frequency of 1 kHz, which is consistent with the femtosecond laser. Figure 3c shows the power spectrum of the density fluctuation after FFT processing. Here an optical filter and a pinhole device are used to eliminate the effect of laser and ionizing radiation light on the system. The result shows that the fundamental frequency is 1 kHz, and the harmonics are also observed. It certifies that this FLDI system can accurately measure the density fluctuation frequency. In our experiment, the femtosecond laser is transmitted through a light guide arm, which can conveniently change the transmission direction of the laser in free space. The light guide arm carries a focusing lens at the end, and the focused femtosecond laser is emitted in the vertical direction, perpendicular to the beam of the FLDI system which is transmitted horizontally. The distance between the measuring point of FLDI and the ionization point is less than 1 mm due to the small disturbance area of the shock waves. Based on the above analysis, the scheme of generating shock waves from a femtosecond laser pulse has the characteristics of stable frequency and small disturbance area and provides an effective method for calibrating the FLDI system.

3.2. Shear Flow Device

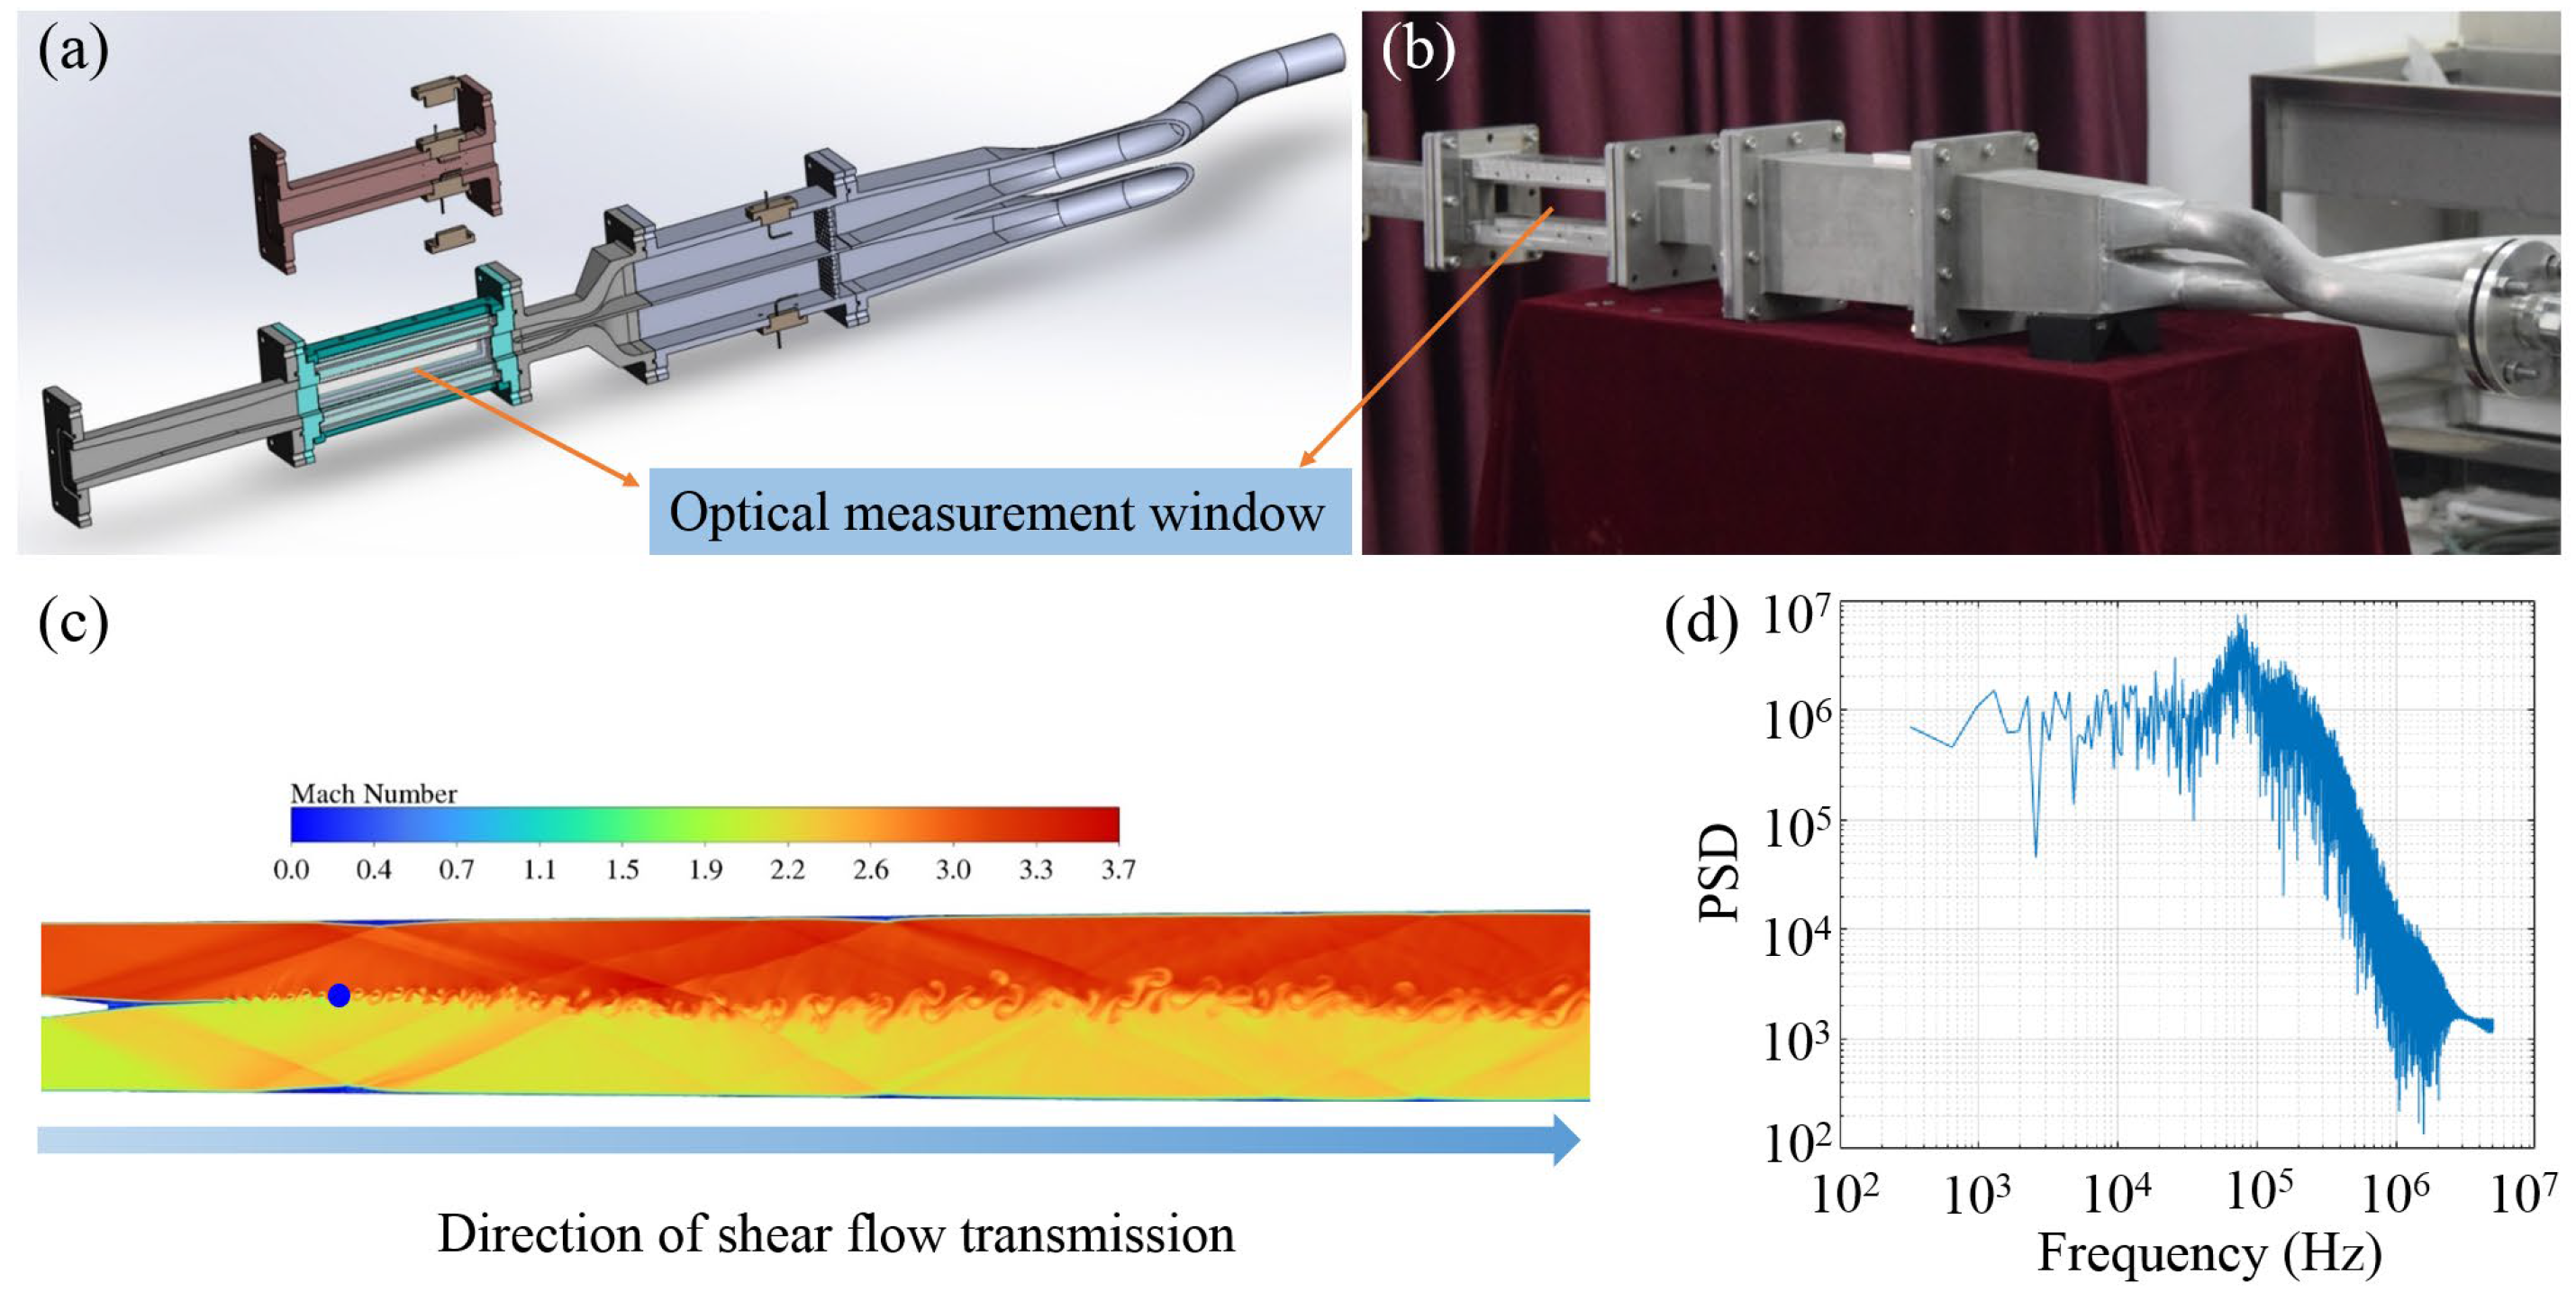
In our experiment, an air blowing scheme is employed to design the shear flow device. As shown in Figure 4a,b, the body of the device is divided into two layers, and the corresponding nozzles have different surface structures. Therefore, the flows with different Mach numbers are jetted and mixed, and the shear flow is generated in the test section. To improve the contraction ratio of the nozzles and provide a flow with high quality, a scheme with contracting in three dimensions is employed to design the nozzle. In this device, the Mach number of the primary flow from the high-speed nozzle is 3.0, and the operating mode is Mach 3.0–2.0 during the experiment. To ensure the two nozzle outlets have the same pressures of about 23.5 kPa, the corresponding total pressures of the two layers at the settling chamber are 804 kPa and 194 kPa. The Reynolds numbers at the outlets of the high-speed nozzle and low-speed nozzle are 2.99 and 1.99, respectively. The four walls of the optical test section are made of planar quartz glass so that the optical measurement window of this device is large enough. In addition, Figure 4c shows the numerical simulation of the shear flow, from which the stable shock waves and the fine structure of the shear flow can be observed clearly. The primary flow and secondary flow are mixed in the initial position of the device, and the small-scale vortex structures are caused by the instability and transition of the mixing layer. Due to the entrainment effect, the vortex structures gradually evolve into larger-scale structures. Here, the power spectrum of the density fluctuation at the blue point in Figure 4c is also analyzed. The numerical calculation result is shown in Figure 4d and the peak frequency is about 80 kHz.

3.3. Density Fluctuation Measurement

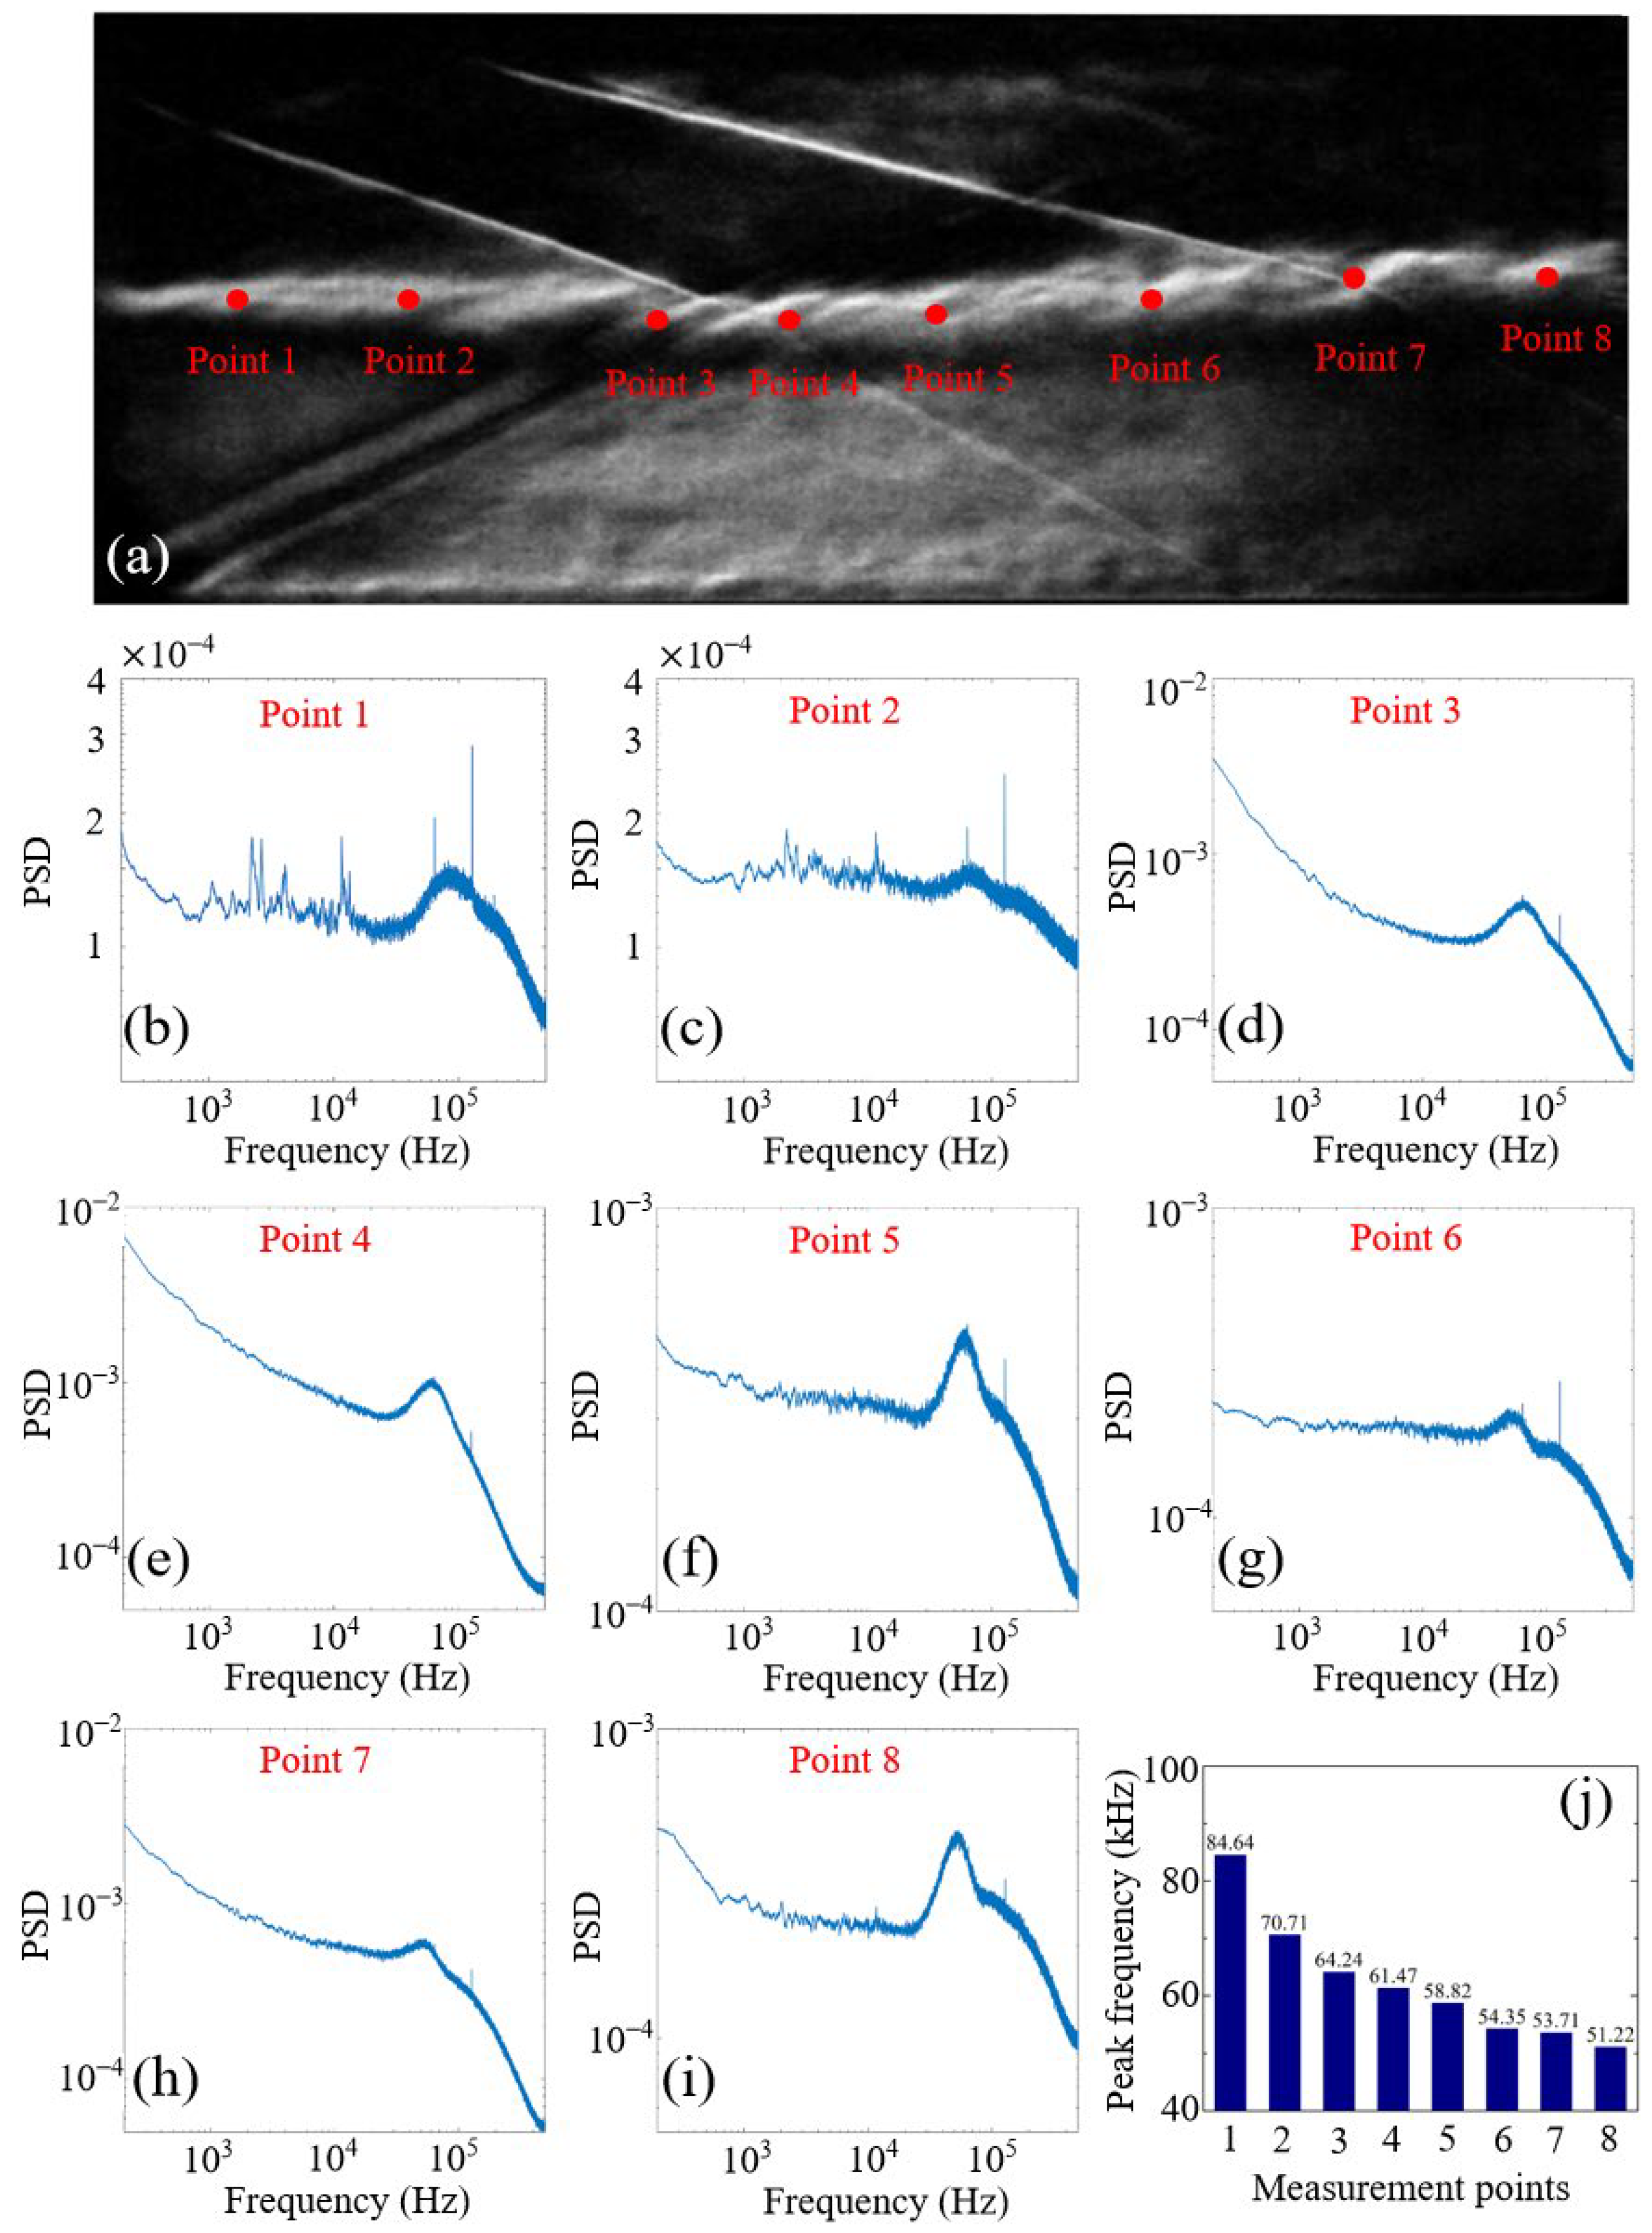
To investigate the characteristics of the density fluctuations in the shear flow, measurements were taken at different positions in the flow. Figure 5a shows the schlieren image of the flow field. A shear flow with horizontal orientation can be observed clearly in the middle of the field of view. Here, the measurement points of density fluctuation are also marked red in the schlieren image. Figure 5b–i displays the power spectra of the density fluctuation at different measurement points. The peak frequency at point 1 is 84 kHz which is in good agreement with the simulation result in Figure 4d. Note that there are two peaks at 64 kHz and 128 kHz in all power spectra, which is attributed to the noise of the fast photodetector. Figure 5c shows the statistical histogram of the density fluctuation frequencies of different measurement points. The result shows that the frequencies of the density fluctuation are concentrated within the range from 50 kHz to 85 kHz. It is clear that the density fluctuation frequency decreases gradually as the measurement point is further from the nozzle. The variation of the frequency indicates the scale of the turbulence structure of shear flow gradually becomes larger as the shear flow propagates downstream [30]. This conclusion is consistent with the evolution of the vortex structures obtained in Figure 4c. Note that the intersection of shock wave and shear flow can be observed at point 3 as shown in Figure 5a. It can be seen from the time-varying voltage signal (not shown here) that the density fluctuation has a large amplitude due to the impact of shock waves; however, the frequency did not deviate significantly. The phenomenon above indicates the shock wave is stable in this shear flow device, and the interaction between the shear flow and shock wave has no effect on the density fluctuation frequency.

4. Conclusions

In conclusion, an FLDI system with a tailored spatial resolution is demonstrated, and the spatial resolution of this FLDI system can be adjusted between 83 μm and 382 μm continuously. The density fluctuation at different locations of a supersonic shear flow from the customized shear flow device is measured using this FLDI system with a spatial resolution of 182 μm. Under this spatial resolution, the measurement capability of this FLDI system is above 84 kHz. No other higher frequency components are found in numerical simulations, so the measured spatial statistics will remain constant with an increase in FLDI resolution, and the density fluctuation frequency less than 84 kHz can be measured well. The operating mode of the supersonic shear flow is Ma 3.0–2.0. According to the analysis of the fluctuation frequencies and power spectra, the evolution of density fluctuation characteristics with shear flow transmission is revealed. The frequency decreases gradually as the measurement point is further from the nozzle, which indicates the scale of the turbulence structure of the shear flow gradually becomes larger as the shear flow propagates downstream. Our work is of great significance for enhancing the spatial resolution and application flexibility of the FLDI system.

Author Contributions

Conceptualization, H.L. and X.Y.; methodology, H.L.; software, Y.L.; investigation, H.L.; resources, Y.L. and L.C.; writing—original draft preparation, H.L.; writing—review and editing, H.L., X.Y. and Y.L.; visualization, L.C. All authors have read and agreed to the published version of the manuscript.

Funding

This research was funded by the National Key R&D Program of China, grant number 2020YFA0405700.

Institutional Review Board Statement

Not applicable.

Informed Consent Statement

Not applicable.

Data Availability Statement

Not applicable.

Conflicts of Interest

The authors declare no conflict of interest.

References

  1. Tagawa, M.; Ohta, Y. Two-thermocouple probe for fluctuating temperature measurement in combustion—Rational estimation of mean and fluctuating time constants. Combust. Flame 1997, 109, 549–560. [Google Scholar] [CrossRef]
  2. Sanderson, S.R.; Sturtevant, B. Transient heat flux measurement using a surface junction thermocouple. Rev. Sci. Instrum. 2002, 73, 2781–2787. [Google Scholar] [CrossRef] [Green Version]
  3. Preston, J.H. The Determination of Turbulent Skin Friction by Means of Pitot Tubes. J. R. Aeronaut. Soc. 1954, 58, 109–121. [Google Scholar] [CrossRef]
  4. Nguyen, D.T.; Choi, Y.M.; Lee, S.H.; Kang, W. The impact of geometric parameters of a S-type Pitot tube on the flow velocity measurements for greenhouse gas emission monitoring. Flow Meas. Instrum. 2019, 67, 10–22. [Google Scholar] [CrossRef]
  5. Charogiannis, A.; An, J.S.; Voulgaropoulos, V.; Markides, C. Structured planar laser-induced fluorescence (S-PLIF) for the accurate identification of interfaces in multiphase flows. Int. J. Multiph. Flow 2019, 118, 193–204. [Google Scholar] [CrossRef]
  6. Li, F.; Yang, H.; Zhang, J.; Gu, C.; Huo, J.; Jiang, L.; Wang, X.; Zhao, D. OH-PLIF investigation of Y2O3-ZrO2 coating improving flame stability in a narrow channel. Chem. Eng. J. 2021, 405, 126708. [Google Scholar] [CrossRef]
  7. Hsu, P.S.; Jiang, N.; Felver, J.J.; Lauriola, D.K.; Danehy, P.M.; Roy, S. 10 kHz two-color OH PLIF thermometry using a single burst-mode OPO. Opt. Lett. 2021, 46, 2308–2311. [Google Scholar] [CrossRef]
  8. Parziale, N.J.; Jewell, J.S.; Shepherd, J.E.; Hornung, H.G. Shock tunnel noise measurement with resonantly enhanced focused schlieren deflectometry. In Proceedings of the 28th International Symposium on Shock Waves, Manchester, UK, 17–22 July 2012; Springer: Berlin/Heidelberg, Germany, 2012; pp. 747–752. [Google Scholar]
  9. Wang, D.; Zhao, Y.; Xia, Z.; Wang, Q.; Huang, X. Multi-resolution analysis of density fluctuation of coherent structures about supersonic flow over vg. Chin. J. Aeronaut. 2012, 25, 173–181. [Google Scholar] [CrossRef] [Green Version]
  10. Benitez, E.K.; Jewell, J.S.; Schneider, S.P. Focused laser differential interferometry for hypersonic flow instability measurements with contoured tunnel windows. In Proceedings of the AIAA Scitech 2020 Forum, Orlando, FL, USA, 6–10 January 2020; p. 1282. [Google Scholar]
  11. Settles, G.S.; Fulghum, M.R. The Focusing Laser Differential Interferometer, an Instrument for Localized Turbulence Measurements in Refractive Flows. J. Fluids Eng. 2016, 138, 101402. [Google Scholar] [CrossRef]
  12. Price, T.J.; Gragston, M.; Schmisseur, J.D.; Kreth, P.A. Measurement of supersonic jet screech with focused laser differential interferometry. Appl. Opt. 2020, 59, 8902–8908. [Google Scholar] [CrossRef]
  13. Yu, T.; Xiong, Y.; Zhao, J.; Wu, J. Application of focused laser differential interferometer to hypersonic boundary-layer instability study. Chin. J. Aeronaut. 2021, 34, 17–26. [Google Scholar] [CrossRef]
  14. Bathel, B.F.; Herring, G.C.; Weisberger, J.M.; Chou, A.; Jones, S.B. Simultaneous focused laser differential interferometry and high-speed schlieren in a Mach 6 flow. Meas. Sci. Technol. 2021, 32, 095907. [Google Scholar] [CrossRef]
  15. Lawson, J.M.; Austin, J.M. Focused laser differential interferometer response to shock waves. Meas. Sci. Technol. 2021, 32, 055203. [Google Scholar] [CrossRef]
  16. Smeets, G. Laser Interferometer for High Sensitivity Measurements on Transient Phase Objects. IEEE Trans. Aerosp. Electron. Syst. 1972, AES-8, 186–190. [Google Scholar] [CrossRef]
  17. Smeets, G.; George, A. Gas-Dynamic Investigations in a Shock Tube Using a Highly Sensitive Interferometer; Institut Franco-Allemand de Recherches: Saint-Louis, France, 1996. [Google Scholar]
  18. Smeets, G.; George, A. Laser-Differential Interferometer Applications in Gas Dynamics; Institut Franco-Allemand de Recherches: Saint-Louis, France, 1996. [Google Scholar]
  19. Smeets, G. Flow diagnostics by laser interferometry. IEEE Trans. Aerosp. Electron. Syst. 1977, 2, 82–90. [Google Scholar] [CrossRef]
  20. Parziale, N.J.; Shepherd, J.E.; Hornung, H.G. Differential Interferometric Measurement of Instability in a Hypervelocity Boundary Layer. AIAA J. 2013, 51, 750–754. [Google Scholar] [CrossRef] [Green Version]
  21. Xiong, Y.; Yu, T.; Lin, L.; Zhao, J.; Wu, J. Nonlinear Instability Characterization of Hypersonic Laminar Boundary Layer. AIAA J. 2020, 58, 5254–5263. [Google Scholar] [CrossRef]
  22. Birch, B.; Buttsworth, D.; Zander, F. Measurements of freestream density fluctuations in a hypersonic wind tunnel. Exp. Fluids 2020, 61, 158. [Google Scholar] [CrossRef]
  23. Lawson, J.M.; Neet, M.C.; Grossman, I.J.; Austin, J.M. Static and dynamic characterization of a focused laser differential interferometer. Exp. Fluids 2020, 61, 187. [Google Scholar] [CrossRef]
  24. Ceruzzi, A.; Neisess, C.; McManamen, B.; Cadou, C.P. Investigation of Focused Laser Differential Interferometry (FLDI) Sensitivity Function. In Proceedings of the AIAA Scitech 2021 Forum, virtual, 11–15 & 19–21 January 2021; p. 1299. [Google Scholar]
  25. Jewell, J.S.; Hameed, A.; Parziale, N.J.; Gogineni, S.P. Disturbance speed measurements in a circular jet via double focused laser differential interferometry. In Proceedings of the AIAA Scitech 2019 Forum, San Diego, CA, USA, 7–11 January 2019; p. 2293. [Google Scholar]
  26. Ceruzzi, A.; Cadou, C.P. Simultaneous velocity and density gradient measurements using two-point focused laser differential interferometry. In Proceedings of the AIAA Scitech 2019 Forum, San Diego, CA, USA, 7–11 January 2019; p. 2295. [Google Scholar]
  27. Bathel, B.F.; Weisberger, J.M.; Herring, G.C.; King, R.A.; Jones, S.B.; Kennedy, R.E.; Laurence, S.J. Two-point, parallel-beam focused laser differential interferometry with a Nomarski prism. Appl. Opt. 2020, 59, 244–252. [Google Scholar] [CrossRef]
  28. Ceruzzi, A.; Callis, B.; Weber, D.; Cadou, C.P. Application of focused laser differential interferometry (FLDI) in a supersonic boundary layer. In Proceedings of the AIAA Scitech, Orlando, FL, USA, 6–10 January 2020; p. 1973. [Google Scholar]
  29. Schmidt, B.E.; Shepherd, J. Analysis of focused laser differential interferometry. Appl. Opt. 2015, 54, 8459–8472. [Google Scholar] [CrossRef] [PubMed] [Green Version]
  30. Gutmark, E.J.; Schadow, K.C.; Yu, K.H. Mixing enhancement in supersonic free shear flows. Annu. Rev. Fluid Mech. 1995, 27, 375–417. [Google Scholar] [CrossRef]
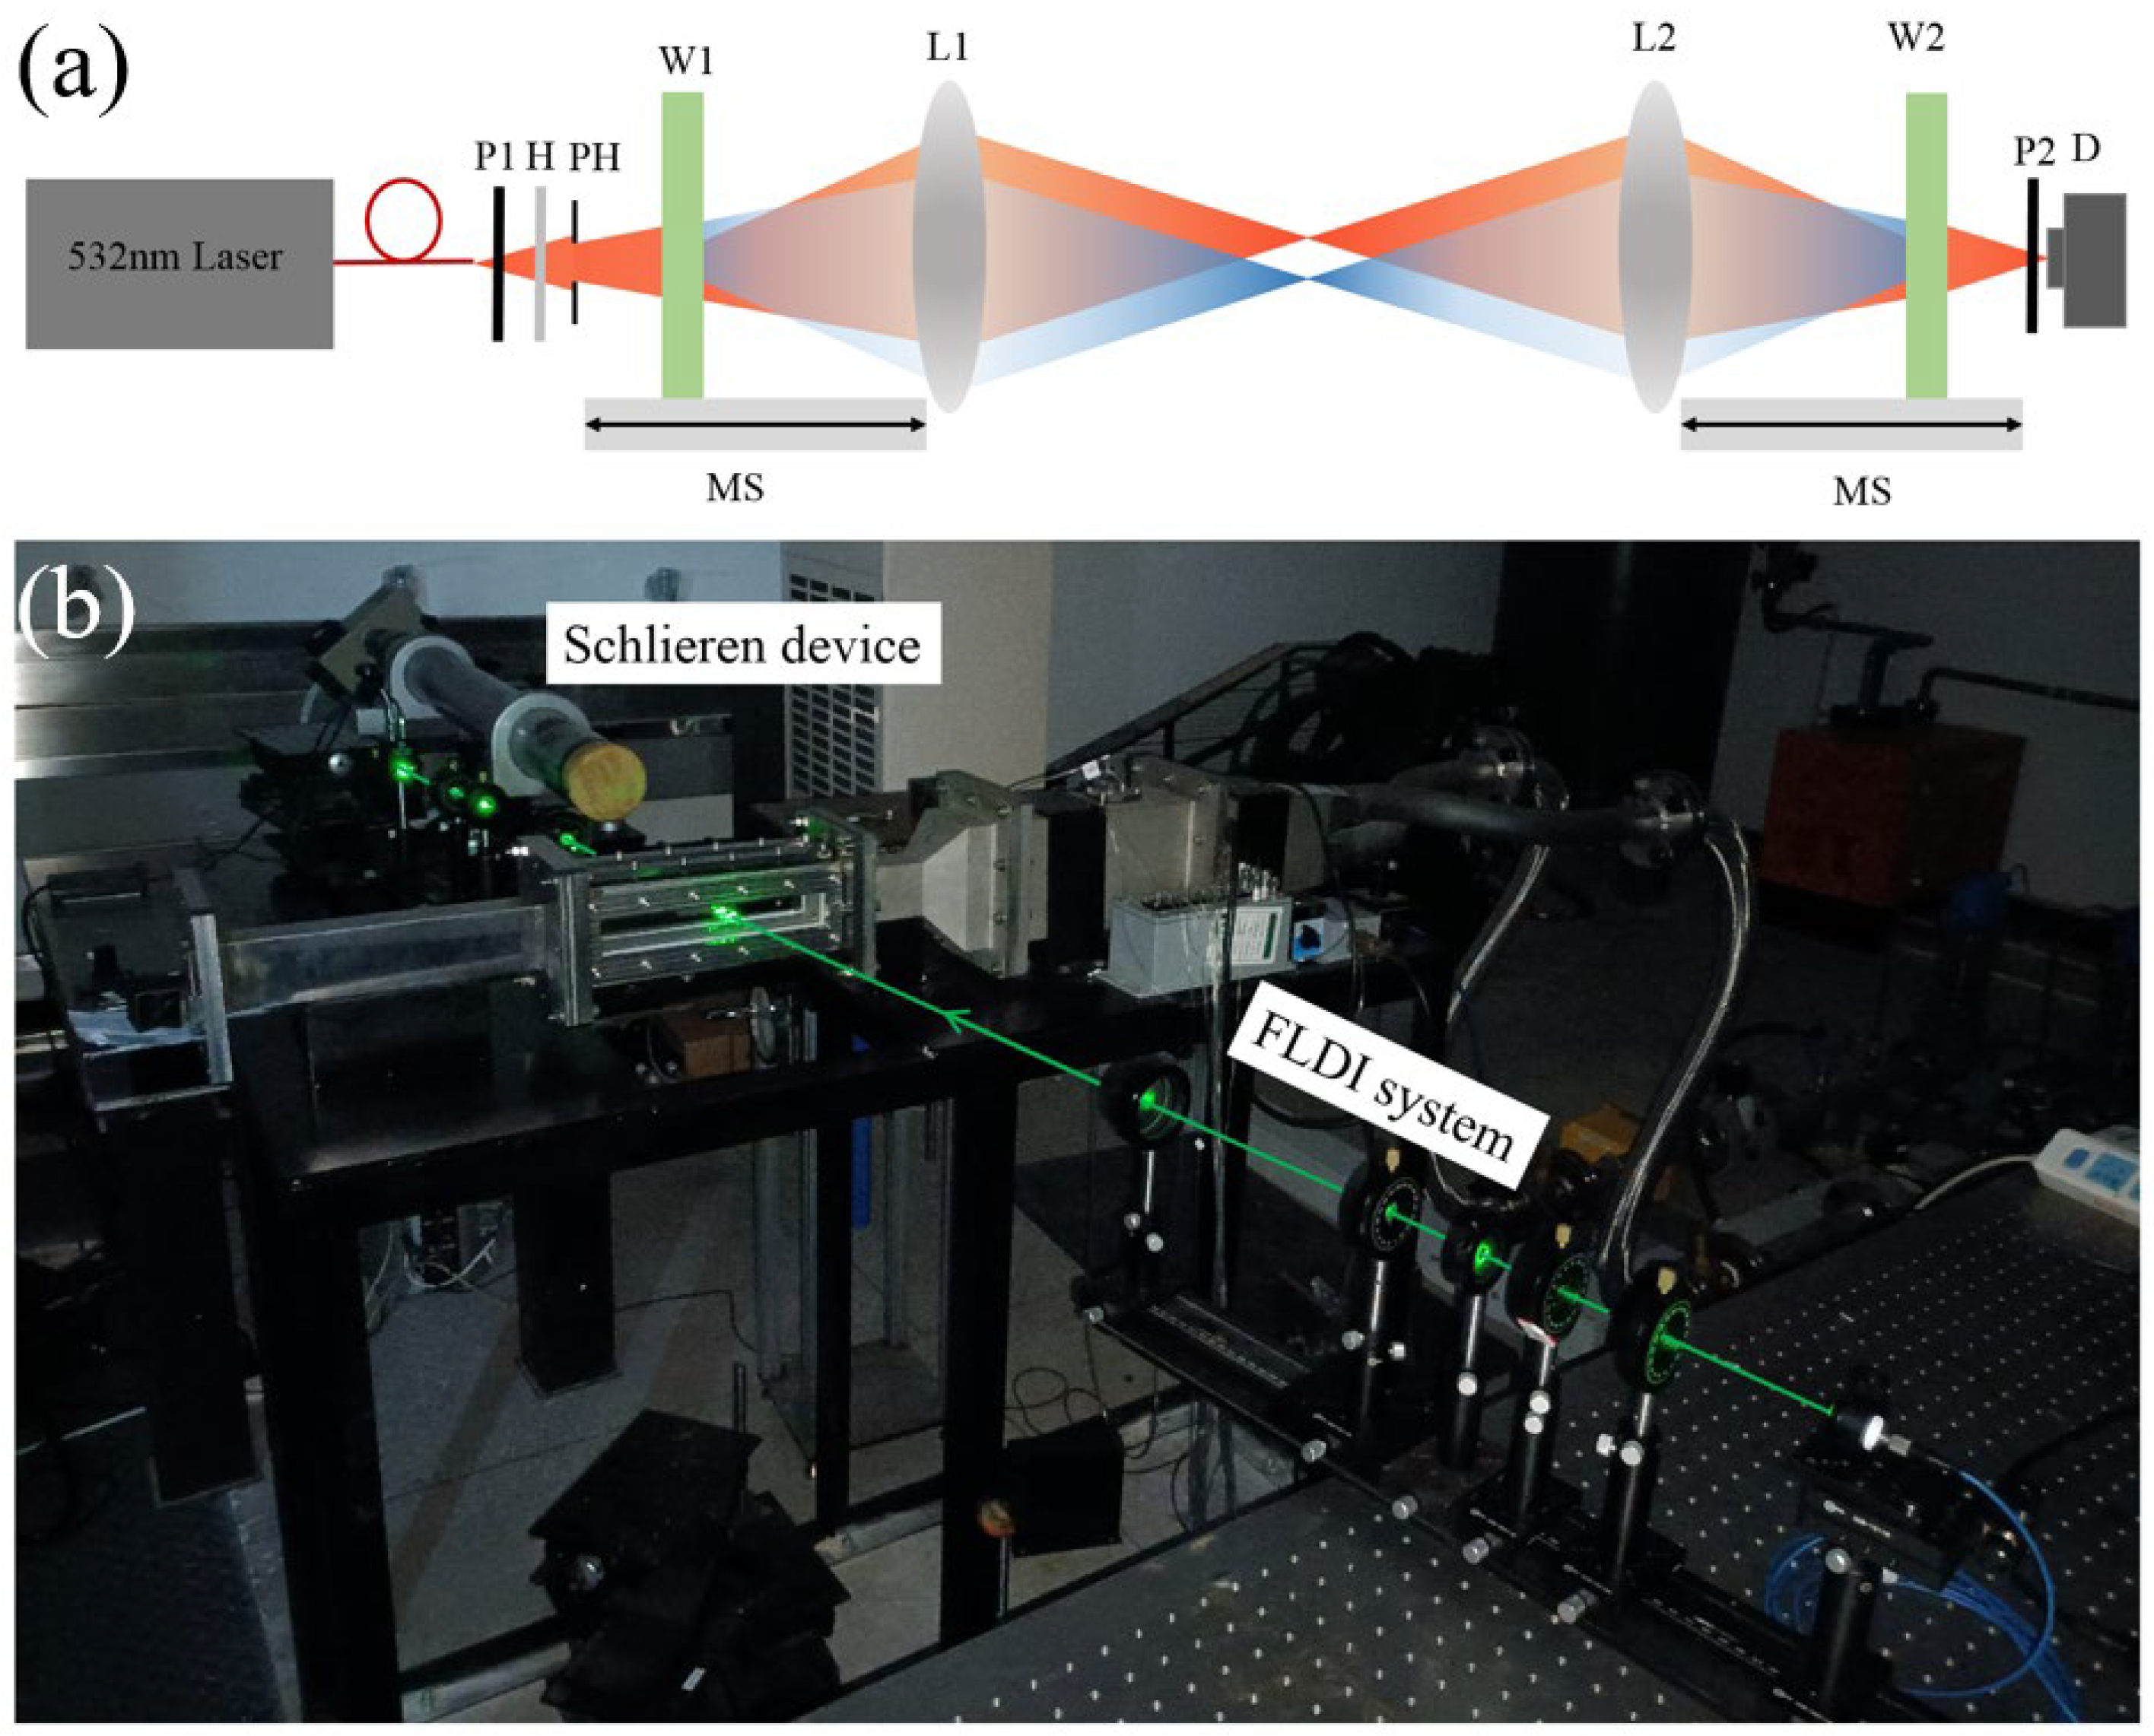
Figure 1. (a) Schematic diagram and (b) image of FLDI system. P1, P2, polarizer; H, half-wave plate; PH, pinhole; W1, W2, Wollaston prism; L1, L2, convex lens; D, fast photodetector; MS, moving stage.
Applsci 13 03253 g001
Figure 2. (a) Separation distance of the two convergence points with different distances between the Wollaston prism and the convex lens. (b) CCD image of the two convergence points in FLDI.
Applsci 13 03253 g002
Figure 3. (a) Schlieren image of the ionization point caused by a femtosecond laser pulse. (b) Time-varying signal with a sampling time range of 50 ms. (c) Power spectrum of the density fluctuation.
Applsci 13 03253 g003
Figure 4. (a) Schematic diagram and (b) image of shear flow device. (c) Numerical simulation of the shear flow. (d) Simulation result of the density fluctuation at the location of blue point.
Applsci 13 03253 g004
Figure 5. (a) Schlieren image of the shear flow. (bi) Power spectrum of density fluctuation at measurement points. (j) Peak frequencies of density fluctuation at different measurement points.
Applsci 13 03253 g005
Disclaimer/Publisher’s Note: The statements, opinions and data contained in all publications are solely those of the individual author(s) and contributor(s) and not of MDPI and/or the editor(s). MDPI and/or the editor(s) disclaim responsibility for any injury to people or property resulting from any ideas, methods, instructions or products referred to in the content.