Article

Detection of Defective Features in Cerasus Humilis Fruit Based on Hyperspectral Imaging Technology

1
College of Information Science and Engineering, Shanxi Agricultural University, Jinzhong 030801, China
2
College of Agricultural Engineering, Shanxi Agricultural University, Jinzhong 030801, China
*
Author to whom correspondence should be addressed.
Appl. Sci. 2023, 13(5), 3279; https://doi.org/10.3390/app13053279
Submission received: 4 February 2023 / Revised: 22 February 2023 / Accepted: 1 March 2023 / Published: 3 March 2023

Abstract

:
Detection of skin defects in Cerasus humilis fruit is a critical process to guarantee its quality and price. This study presents a valid method for the detection of defective features in Cerasus humilis fruits based on hyperspectral imaging. A total of 420 sample images were acquired that included three types of natural defects and undamaged samples. After acquiring hyperspectral images of Cerasus humilis fruits, the spectral data were extracted from the region of interest (ROI). Five spectral preprocessing methods were used to preprocess the original spectral data, including Savitsky–Golay (S-G), standard normal variate (SNV), multiplicative scatter correction (MSC), baseline correction (BC), and de-trending (De-T). Regression coefficient (RC), successive projections algorithm (SPA), and competitive adaptive reweighed sampling (CARS) were conducted to select optimal sensitive wavelengths (SWs); as a result, 11 SWs, 17 SWs, and 13 SWs were selected, respectively. Then, the least squares-support vector machine (LS-SVM) discrimination model was established using the selected SWs. The results showed that the discriminate accuracy of the CARS-LS-SVM method was 91.43%. Based on the characteristics of image information, images corresponding to eight sensitive wavebands (950, 994, 1071, 1263, 1336, 1457, 1542, and 1628 nm) selected by CARS were subjected to principal component analysis (PCA). Then, an effective approach for detecting the defective features was exploited based on the imfill function, canny operator, region growing algorithm, bwareaopen function, and the images of PCA. The location and area of defect feature of 105 Cerasus humilis fruits could be recognized; the detect precision was 88.57%. This investigation demonstrated that hyperspectral imaging combined with an image processing technique could achieve the rapid identification of undamaged samples and natural defects in Cerasus humilis fruit. This provides a theoretical basis for the development of Cerasus humilis fruit grading and sorting equipment.

1. Introduction

Cerasus Humilis fruit is native to China, and is a popular healthcare fruit for the older generation. Because the fruit has a high calcium content and is easy to absorb, it is often called “calcium fruit” [1]. The Cerasus humilis fruit is not unique in flavor, but is rich in sugar, organic acids, protein, vitamins, total flavonoids, and other components. In addition to being eaten fresh for health reasons, it can also be used for deep processing product development (such as fruit vinegar and fruit juice); these products have important medicinal value for hyperlipidemia and cardiovascular and cerebrovascular systems. In recent years, with the continuous development of technology used to maintain freshness, the supply period of Cerasus humilis fruits has been extended, and the economic benefits have increased exponentially. This has significantly improved the added value after harvest and increased the income of farmers. However, the existence of external defects, such as rust spots, insect pest, and crack, has seriously affected the production and quality of Cerasus humilis fruits. These defects can easily cause fungi and infection of other intact fruits. The economic losses associated with these defects account for 1.0% of the industrial value of Cerasus humilis fruit. Therefore, it is necessary to remove the defective fruit from the intact part. At present, the defective fruit is removed primarily through manual detection. This process is not only time-consuming but physically laborious and lacks efficiency. In particular, the sorting of naturally damaged fruit is more difficult. Therefore, there is an urgent need for a method that can quickly and accurately identify the defects of Cerasus humilis fruit.
Hyperspectral imaging (HSI) technology is a fusion technology of image and spectrum, which has the advantages of high sensitivity and fast measurement speed [2,3,4,5]. It has become a rapid non-destructive detection and classification method. In recent years, this technology has been widely used in the detection of external features of fruit. Cui et al. [6] used HSI technology and stoichiometry to identify bruised and normal tomatoes and built a multivariate analysis classifier model. The study showed that the established back propagation artificial neuron network (BP-ANN) model had the highest recognition rate, and the recognition rates of bruised and normal tomatoes were 89.29% and 100%, respectively. Huang et al. [7] realized nondestructive testing of external quality indexes (intact, crack, rust spot, deformation, and insidious injury) of nectarines by using HSI technology combined with mapping information and the least squares support vector machine (LS-SVM) modeling method. The results indicate that the comprehensive identification accuracy of the model for external quality indexes of nectarine was 94.45%. Lü et al. [8] used HSI technology combined with principal component analysis (PCA) to detect the hidden bruises of kiwifruit. It was concluded that that the detection error of this method for kiwifruit hidden bruises was 14.5%. Wu et al. [9] collected reflectance images of four kinds of jujube fruits (intact, cracked, bruised, and insect damage) using HSI technology. The results showed that the SIMCA model had the best classification accuracy for intact, cracked, bruised, and insect pests, which reached 96%, 96%, 93.9%, and 95.6%, respectively. Yuan et al. [10] conducted a rapid identification study of intact and four damage classes of Lingwu jujube using hyperspectral imaging techniques (380~1030 nm). The results showed that the accuracy of the classification discrimination model (MSC-CARS-PLS-DA) for the calibration set and prediction set was 77.41% and 89.52%, respectively. The above research results show that it is feasible to detect fruit defects using HSI technology. However, from the current research situation, there are few reports on the detection and classification of the external defects of Cerasus humilis fruits using HSI technology.
In this work, many kinds of defective Cerasus humilis fruits (Nongda No. 6) were taken as the research object. The image information of rust spots, crack, insect damage, and intact samples of Cerasus humilis fruit was collected using a hyperspectral imaging system combined with chemometrics and image processing methods. A rapid and accurate identification of Cerasus humilis fruit defect type samples in terms of both spectra and images was attained, providing a theoretical basis for the development of Cerasus humilis fruit grading and sorting equipment.

2. Materials and Methods

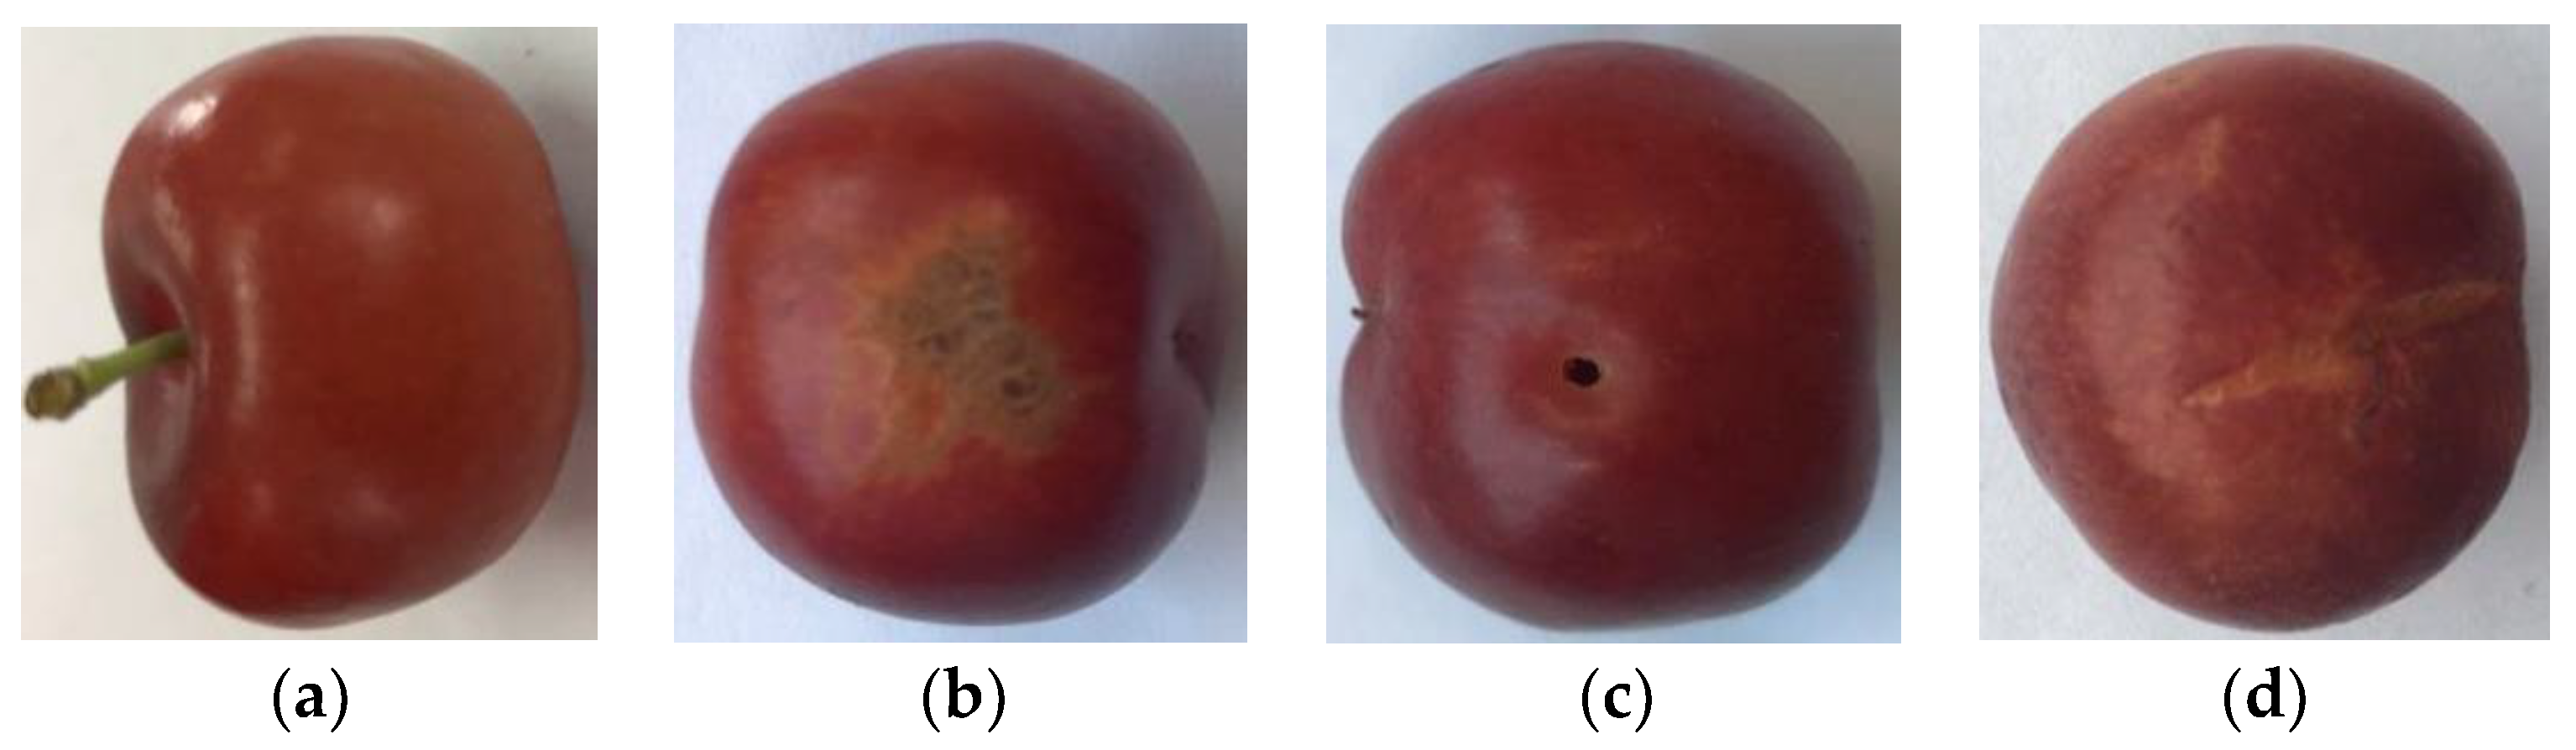
2.1. Experimental Sample

The samples were collected from the Cerasus humilis fruit planting demonstration base of Shanxi Agricultural University (3 August 2022), and the variety is “Nongda No. 6”. To ensure the reliability of the study, samples of similar shape, uniform size (9.0–13.0 g per fruit), and complete defect type (intact, rust spot, insect damage, crack) were selected. A total of 420 samples were selected, including 92 rust spot samples, 84 insect damage samples, 84 crack samples, and 160 intact samples. Intact and defective samples are shown in Figure 1.
Hyperspectral images of each sample were collected and assigned values of 1, 2, 3, and 4 for each of the 4 categories of data (rust spot, crack, insect damage, and intact). Four types of samples were divided into the correction set (315) and the prediction set (105) according to the ratio of 3:1 using the sample set partitioning based on joint X-Y distance (SPXY) algorithm [11]. The statistical results of sample set division were shown in Table 1.

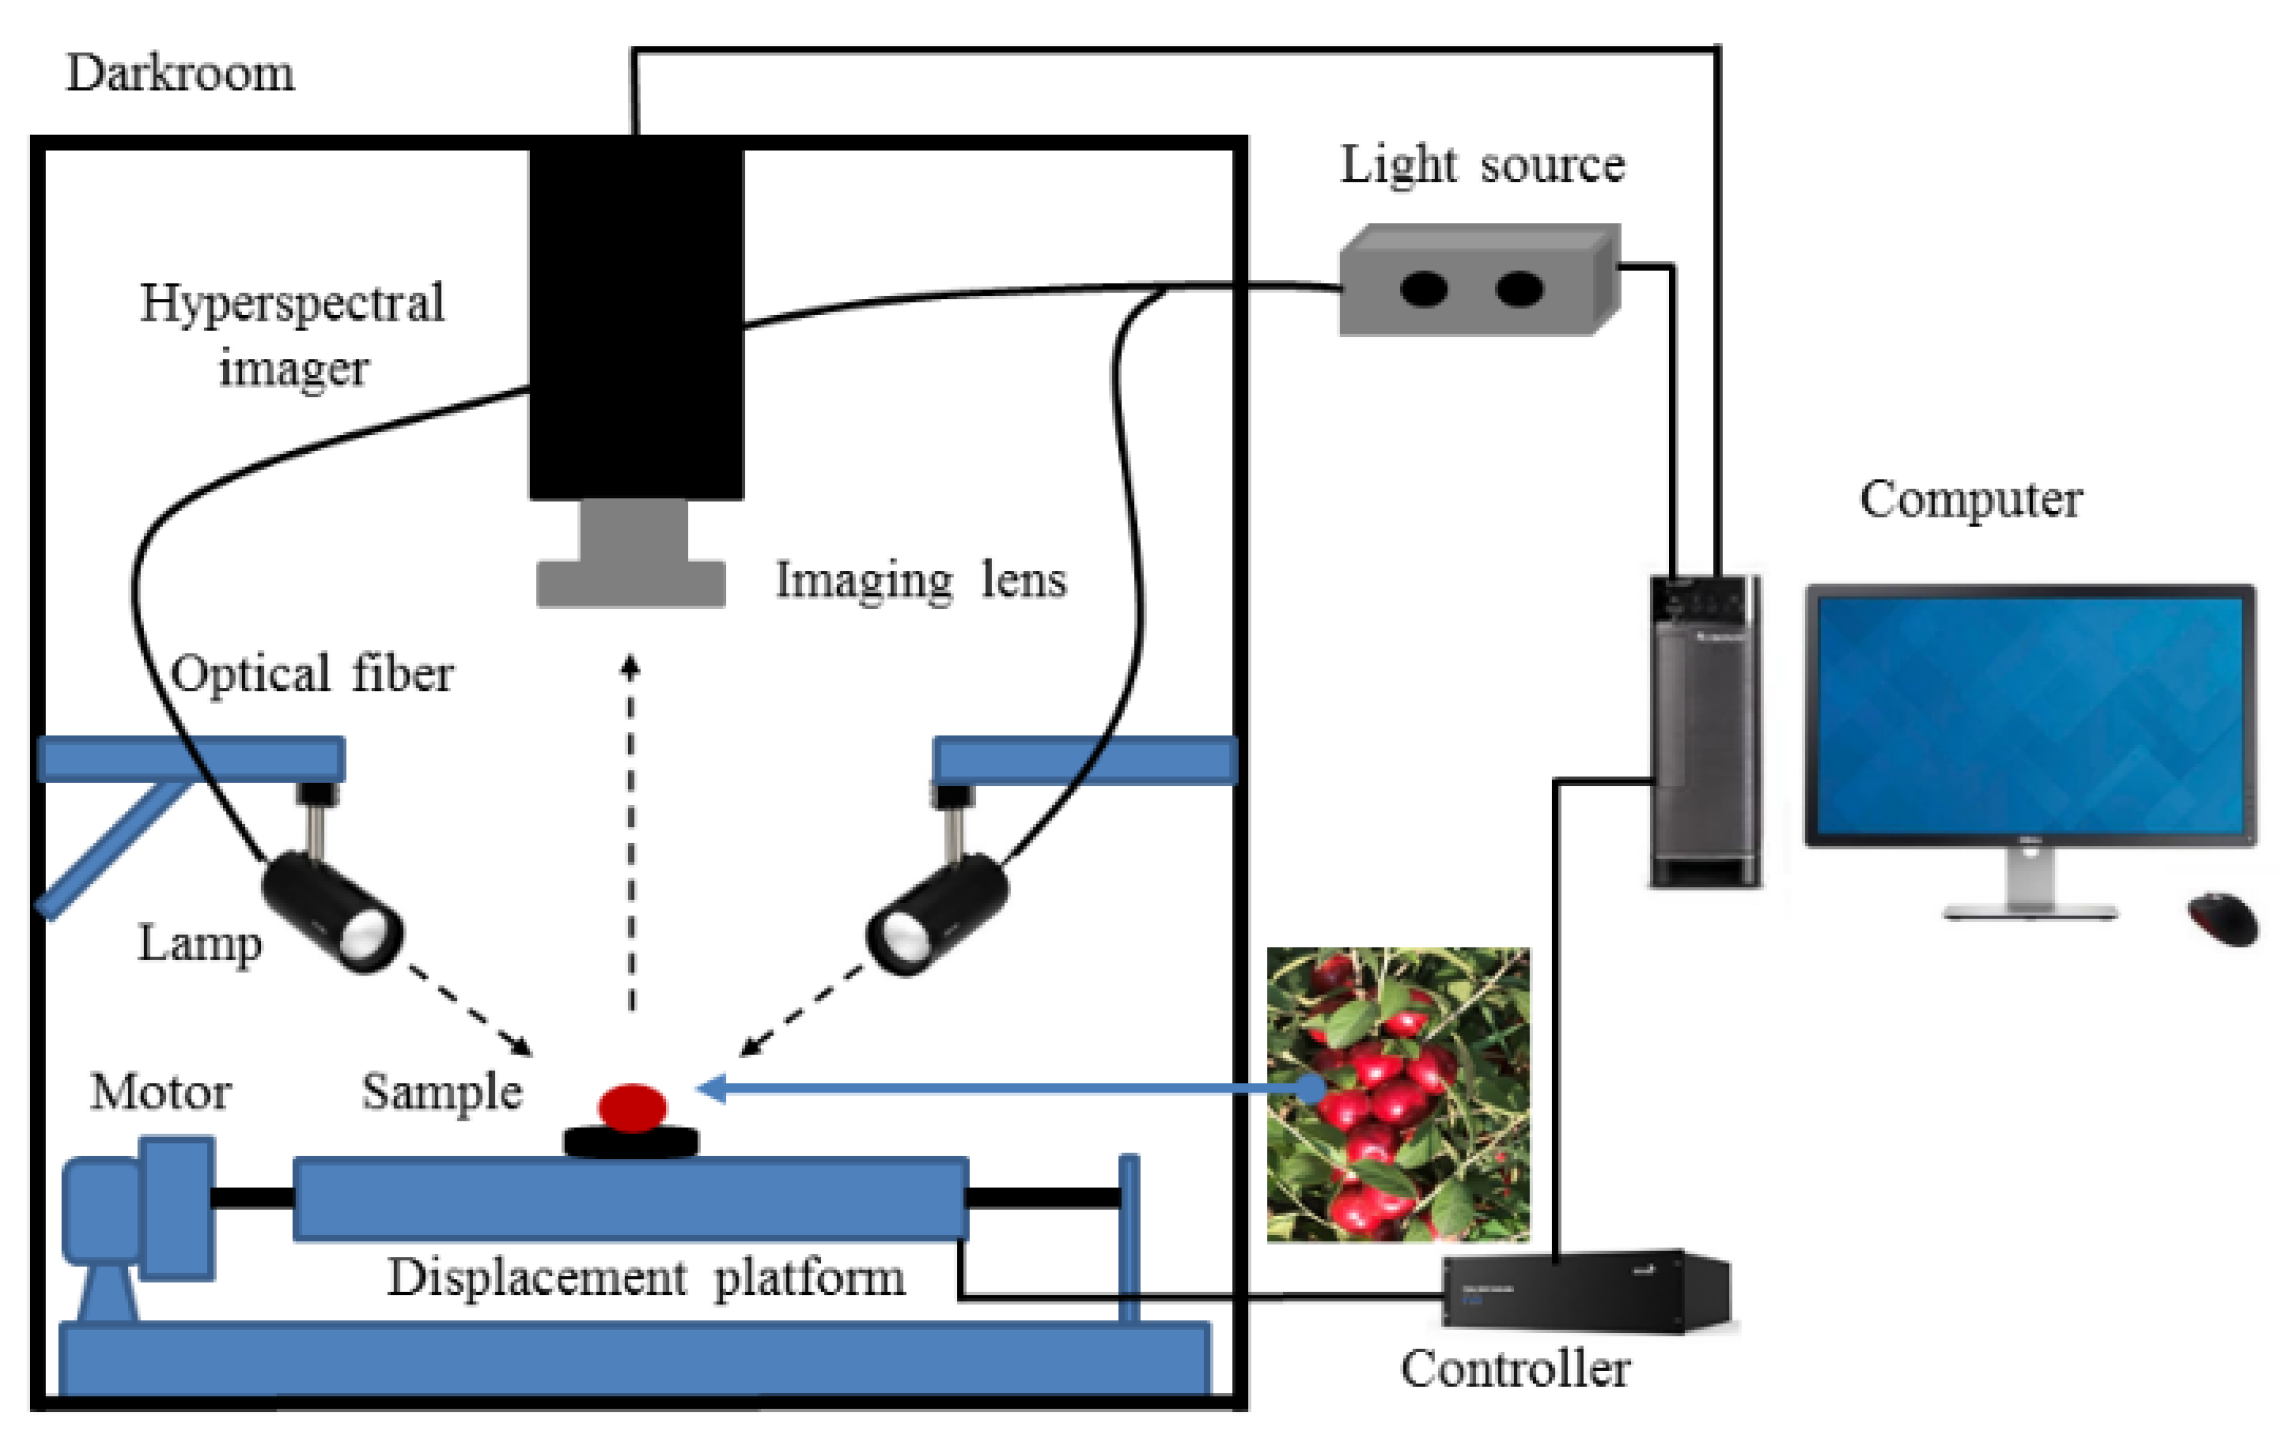
2.2. Hyperspectral Imaging System and Image Acquisition

In this study, the hyperspectral imaging system (GaiaSorter, Zolix Instruments Co. Ltd., Beijing, China) was used to collect spectral and image information [12]. The spectral resolution was 5 nm in 895~1700 nm (with 254 wavelengths), the wavelength interval was 3.19 nm, and the resolution of each image was 320 × 256 pixel. The core components of the system included the hyperspectral imager, uniform light sources, electronically controlled mobile platforms, computers, and control software. The spectral camera was Zolix’s “image-λ-N17E”. The light source consisted of four 250 W bromine tungsten lamps, as shown in Figure 2.
During the process of image acquisition, it was necessary to set a reasonable exposure time and the moving speed of the mobile platform to avoid information oversaturation and image distortion [13]. According to experimental experience, we set the exposure time to 0.13 s, the platform moving speed to 8.0 mm/s, and the distance between the sample surface and the lens to 280 mm. To illuminate the target sample, the illumination unit was fixed above the sample from both sides, at an angle of 45°and a height of 220 mm, to reduce the effects of shadow. To accurately collect the spectral data from each region, the target region is oriented towards the lens when collecting the spectra of different samples.

2.3. Hyperspectral Image Correction Method

In order to eliminate the influence of the change of light intensity and the dark current in the lens on the imaging, and to calculate the relative reflection spectral value of the scanned objects, the black and white board correction must be carried out before the spectral acquisition begins [12]. The calculation formula can be seen in Equation (1):
R = I R I D I W I D × 100 %
where R represents the corrected image; I R represents the original image; I D represents the blackboard correction image; and I W represents the whiteboard correction image.

2.4. Spectral Data Extraction

The selection of region of interest (ROI) should be the most representative part of image content features; this can significantly improve the accuracy and precision of image processing and spectral data analysis. The ENVI 5.0 software was used to extract the spectral data of the regions of interest of three types of defect samples and intact samples. Since the defect features of each type of sample were different in size and irregular in shape (especially rust spots and cracks), a 50 × 60 pixel rectangular region was manually extracted at the position corresponding to the intact and defective area of each fruit sample as ROI. The imaging resolution was about 1.5 mm/pixel, and 1.5 mm of the fruit’s surface corresponds to 1 pixel of the image [14]. The original spectral curves of the 420 samples are shown in Figure 3a, and the average spectral curves of four types of Cerasus humilis fruit samples were obtained, as shown in Figure 3b, for the next analysis.

2.5. Spectral Preprocessing

The collected original spectral information contains both useful information and noise, background color, dark current, and other redundant information [15]. The preprocessing of the collected spectral data can effectively optimize the original spectral data and improve the accuracy of the model. As such, it is necessary to preprocess the original spectra. In the present work, Savitzky–Golay (S-G 5-point) smoothing, standard normal variate (SNV), multiplicative scatter correction (MSC), baseline correction (BC), and de-trending (De-T) were used to preprocess the raw spectral data. Then, the PLS model was established, and the best spectral pretreatment method was determined by comparing the correlation coefficient and the root mean square error (RMSE) of the model. This spectral preprocessing and PLS model analysis were performed using the Unscrambler X10.1 (CAMO AS, Oslo, Norway).

2.6. Variable Selection Methods and Classification Models

2.6.1. Selection Methods of Characteristic Wavelengths

The characteristic wavelengths were extracted by selecting a representative with the least redundancy and collinearity from the full band that can represent the main information of the sample. This improves the running speed and reliability of the model and improves the accuracy of the prediction results [16]. In this study, we chose regression coefficient (RC), successive projections algorithm (SPA), and competitive adaptive reweighted sampling (CARS) algorithms to reduce the dimensions of the original spectral matrix and extract effective wavelengths. Finally, the optimal algorithm was obtained by comparing the model coefficients.
The RC is also called the β-coefficients method. It is based on the partial least square regression (PLSR) model and used to select the characteristic wavelength according to the local extreme value of the regression coefficient. The wavelengths with high absolute values of RCs were chosen as effective wavelengths [17]. The RC method characteristic wavelength selection procedures mentioned were carried out using the Unscrambler X10.1 (CAMO AS, Oslo, Norway).
The SPA algorithm is an effective method for the selection of characteristic variables in the spectrum [18]. When extracting the characteristic wavelength, the algorithm searches for the optimal wavelength variable based on the multiple regression analysis models. Through the projection analysis of the vector, the wavelength is projected with other wavelengths, and the maximum value of the final projection vector is selected as the characteristic wavelength. After the spectral characteristic wavelength is extracted using SPA, a group of variables with the least irrelevant information content is obtained from the full band range. This new set of variables not only eliminates the influence of collinearity between wavelength variables, but also effectively reduces the complexity of the model. SPA uses RMSE as an evaluation index and determines the number of final characteristic variables based on the smaller RMSE value.
The CARS algorithm is a feature information filtering method that has been widely used in recent years. The algorithm is based on the PLS model. It uses adaptive reweighted sampling (ARS) technology and the exponentially decreasing function (EDF) to remove the wavelength points with smaller weight from the PLS model [19], screen out the wavelength points with the larger absolute value of the regression coefficient, and select the variable combination with the smallest cross-validation root mean square error (RMSECV) in the PLS model through cross-validation. In each sampling process, the CARS operation is divided into four consecutive steps: Monte Carlo model sampling, EDF removing variables, ARS screening variables, and calculation of the RMSECV of each subset. At last, it chooses the subset with the lowest RMSECV value as the optimal subset. The SPA and CARS algorithm characteristic wavelength selection procedures mentioned were carried out in the MATLAB R2016b (The MathWorks, Natick, MA, USA).

2.6.2. Classification Models

The least squares-support vector machine (LS--SVM) is an improved version of the support vector machine (SVM) algorithm. This method changes the inequality constraint in the SVM to an equation constraint, maps the selected nonlinear vector to the high-dimensional space, and constructs the optimal classification hyperplane (optimal decision function). It is also a modeling method that can handle linear and nonlinear information simultaneously. In addition, the LS-SVM overcomes the structure complexity and error-prone nature of neural network networks. It does not only decompose the linearity of the original space, but also realizes the classification of the data. It is especially suitable for small sample sizes in quantitative and qualitative analysis.
The principle of this method is as follows [20]:
Assuming the given training set is x i , y i , , x N , y N , the objective optimization function of LS-SVM is:
J 1 w , e = μ 2 w T w + γ 2 i = 1 n e i 2 y i = w T φ x i + b + e i , i = 1 , 2 , , N
where the mapping function of the φ x i kernel space is the weight vector; e is the error variable; b is the offset; and μ and γ are adjustable parameters.
The Lagrange function is:
L = J w , e i = 1 n a i w T φ x i + b + e i y i
where a i is the Lagrange operator; a i R is the input vector x i corresponding 0 < a i < C . Then x i is the support vector.
Calculate the partial derivative of Equation (3) to obtain:
L w = 0 w = i = 1 n a i φ x i L b = 0 i = 1 N a i = 0 L e i = 0 a i = γ e i L a i = 0 w T φ x i + b + e i , i = 1 , 2 , , N
The mapping function of kernel space is defined as:
K x , x k = Φ ( x ) T Φ ( x k )
This study uses the RBF function as the kernel function of LS-SVM. The calculation formula is as follows:
K ( x , x k ) = exp x x k 2 2 σ 2
where σ 2 is the square of the band width.
The variables w and a are eliminated to obtain the Equation (7):
0 1 v T 1 v Ω + 1 γ I N × b a = 0 y
where y = y 1 , , y N , 1 v = 1 , , 1 , a = a 1 , , a N , and Ω = k x i , x l , i , l = 1 , 2 , , N .
If the LS-SVM algorithm is used to determine the category of unknown vector x , the corresponding discriminant function is Equation (8):
y ( x ) = s i g n k = 1 N a k y k K ( x , x k ) + b

2.7. Image Analysis Methods

A mask is use on the selected image, and a figure is used to block the image (all or part) in order to control the area or process of image processing. In digital image processing, the mask is a two-dimensional matrix array; occasionally a multi-value image is also used. The mask is primarily used to extract the region of interest or structural features. The “imfill” function is used to fill the empty area in the image. The “Bwareopen” function is used to delete small area objects from the binary image. The “Canny” function is a very popular edge detection algorithm, whose function is to find an optimal edge for the target object. The “imadd” function is used to add two images together or add a constant to an image.

3. Results and Discussion

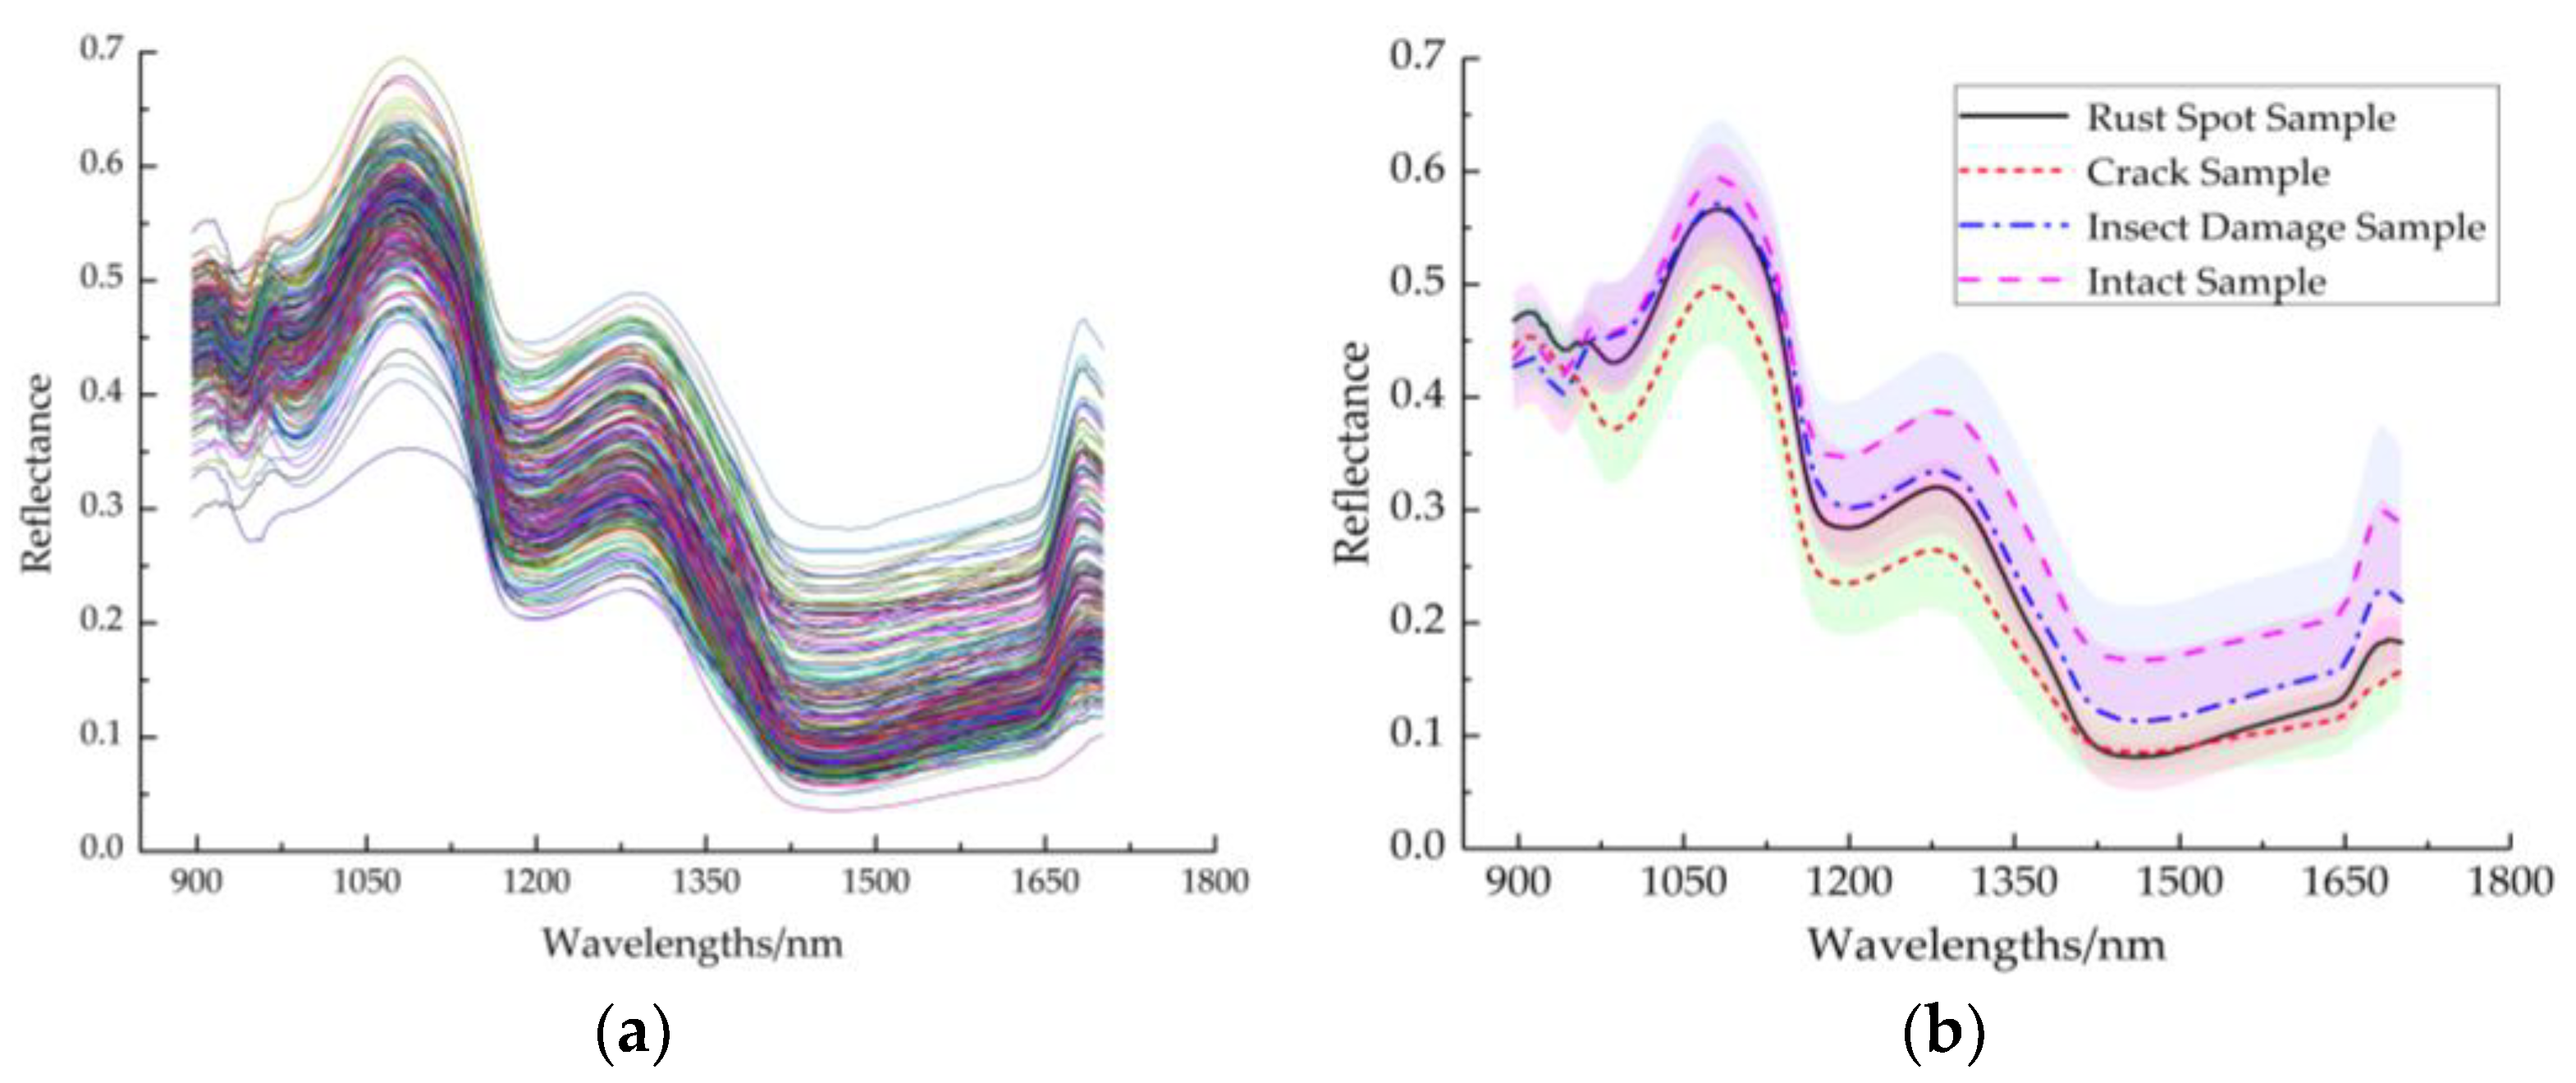
3.1. Spectral Characteristics Analyses

Figure 3a depicts the spectrum curves of the 420 Cerasus humilis fruit samples in the range of 895~1700 nm. The average spectra reflectance and standard deviation (SD) of various samples were obtained, and are shown in Figure 3b. Because the original hyperspectral data contain a large amount of random noise at the head and tail, the wavelength range of 945~1675 nm was selected for further research.
As can be seen in Figure 3b, the average spectral curves of the four types of Cerasus humilis fruit samples were quite different, but the trends of spectra were similar. the spectral curve shows that the four types of samples have obvious absorption peaks at around 980 and 1195 nm. Among them, the absorption peak at 980 nm was primarily caused by the absorption of water in Cerasus humilis fruit [21], and the absorption peak at 1195 nm was related to the absorption of chlorophyll in the epidermis of Cerasus humilis fruit [22]. Another strong absorption peak, at 1460 nm, is related to the internal water and sugar absorption of the Cerasus humilis fruit [23]. As can be seen in Figure 3b, the spectral reflectance values of all the defective samples are significantly lower than those of the intact samples; this may be because the gray value of defective regions is usually lower, reducing the reflection of the incident light [24]. Compared with the two other types of defective samples, the damaged region of insect-damaged fruits is relatively small, and the reflectance value of the insect-damaged samples was slightly lower than that of the intact samples in the wavelength region below 1160 nm. This may be because the insect damage on the surface of the fruit provides more opportunities for light to interfere with the cellular material, causing more light to be absorbed and scattered. The reflectance of the cracked samples was significantly lower than that of the other three types of Cerasus humilis fruit samples, which may be related to the rupture of the fruits’ epidermis. The reflectance of rust spot fruit samples was lower than that of intact fruit samples; this may be caused by the difference in the cell structure between the rust spot fruit epidermis and intact fruit epidermis.

3.2. Spectral Pretreatment

The spectral data obtained by each preprocessing method are used as the input variables of PLS model, and the corresponding prediction model is established. The results are shown in Table 2.
Table 2 shows that the performance of the PLS model established by the original spectral data without pretreatment, the performance of the correction set, and prediction set of the PLS model established by the four pretreatment methods (S-G, SNV, MSC, BC) were not conducive to improving the model’s capability. This may be because these pretreatments remove some important spectral information about the Cerasus humilis fruit samples. Conversely, the use of De-T achieved the best results, and the De-T performed best with Rp of 0.8571 and RMSEP of 0.2964. Therefore, the spectral data processed by De-T were used for further analyses in this study.

3.3. Effective Wavelength Selection

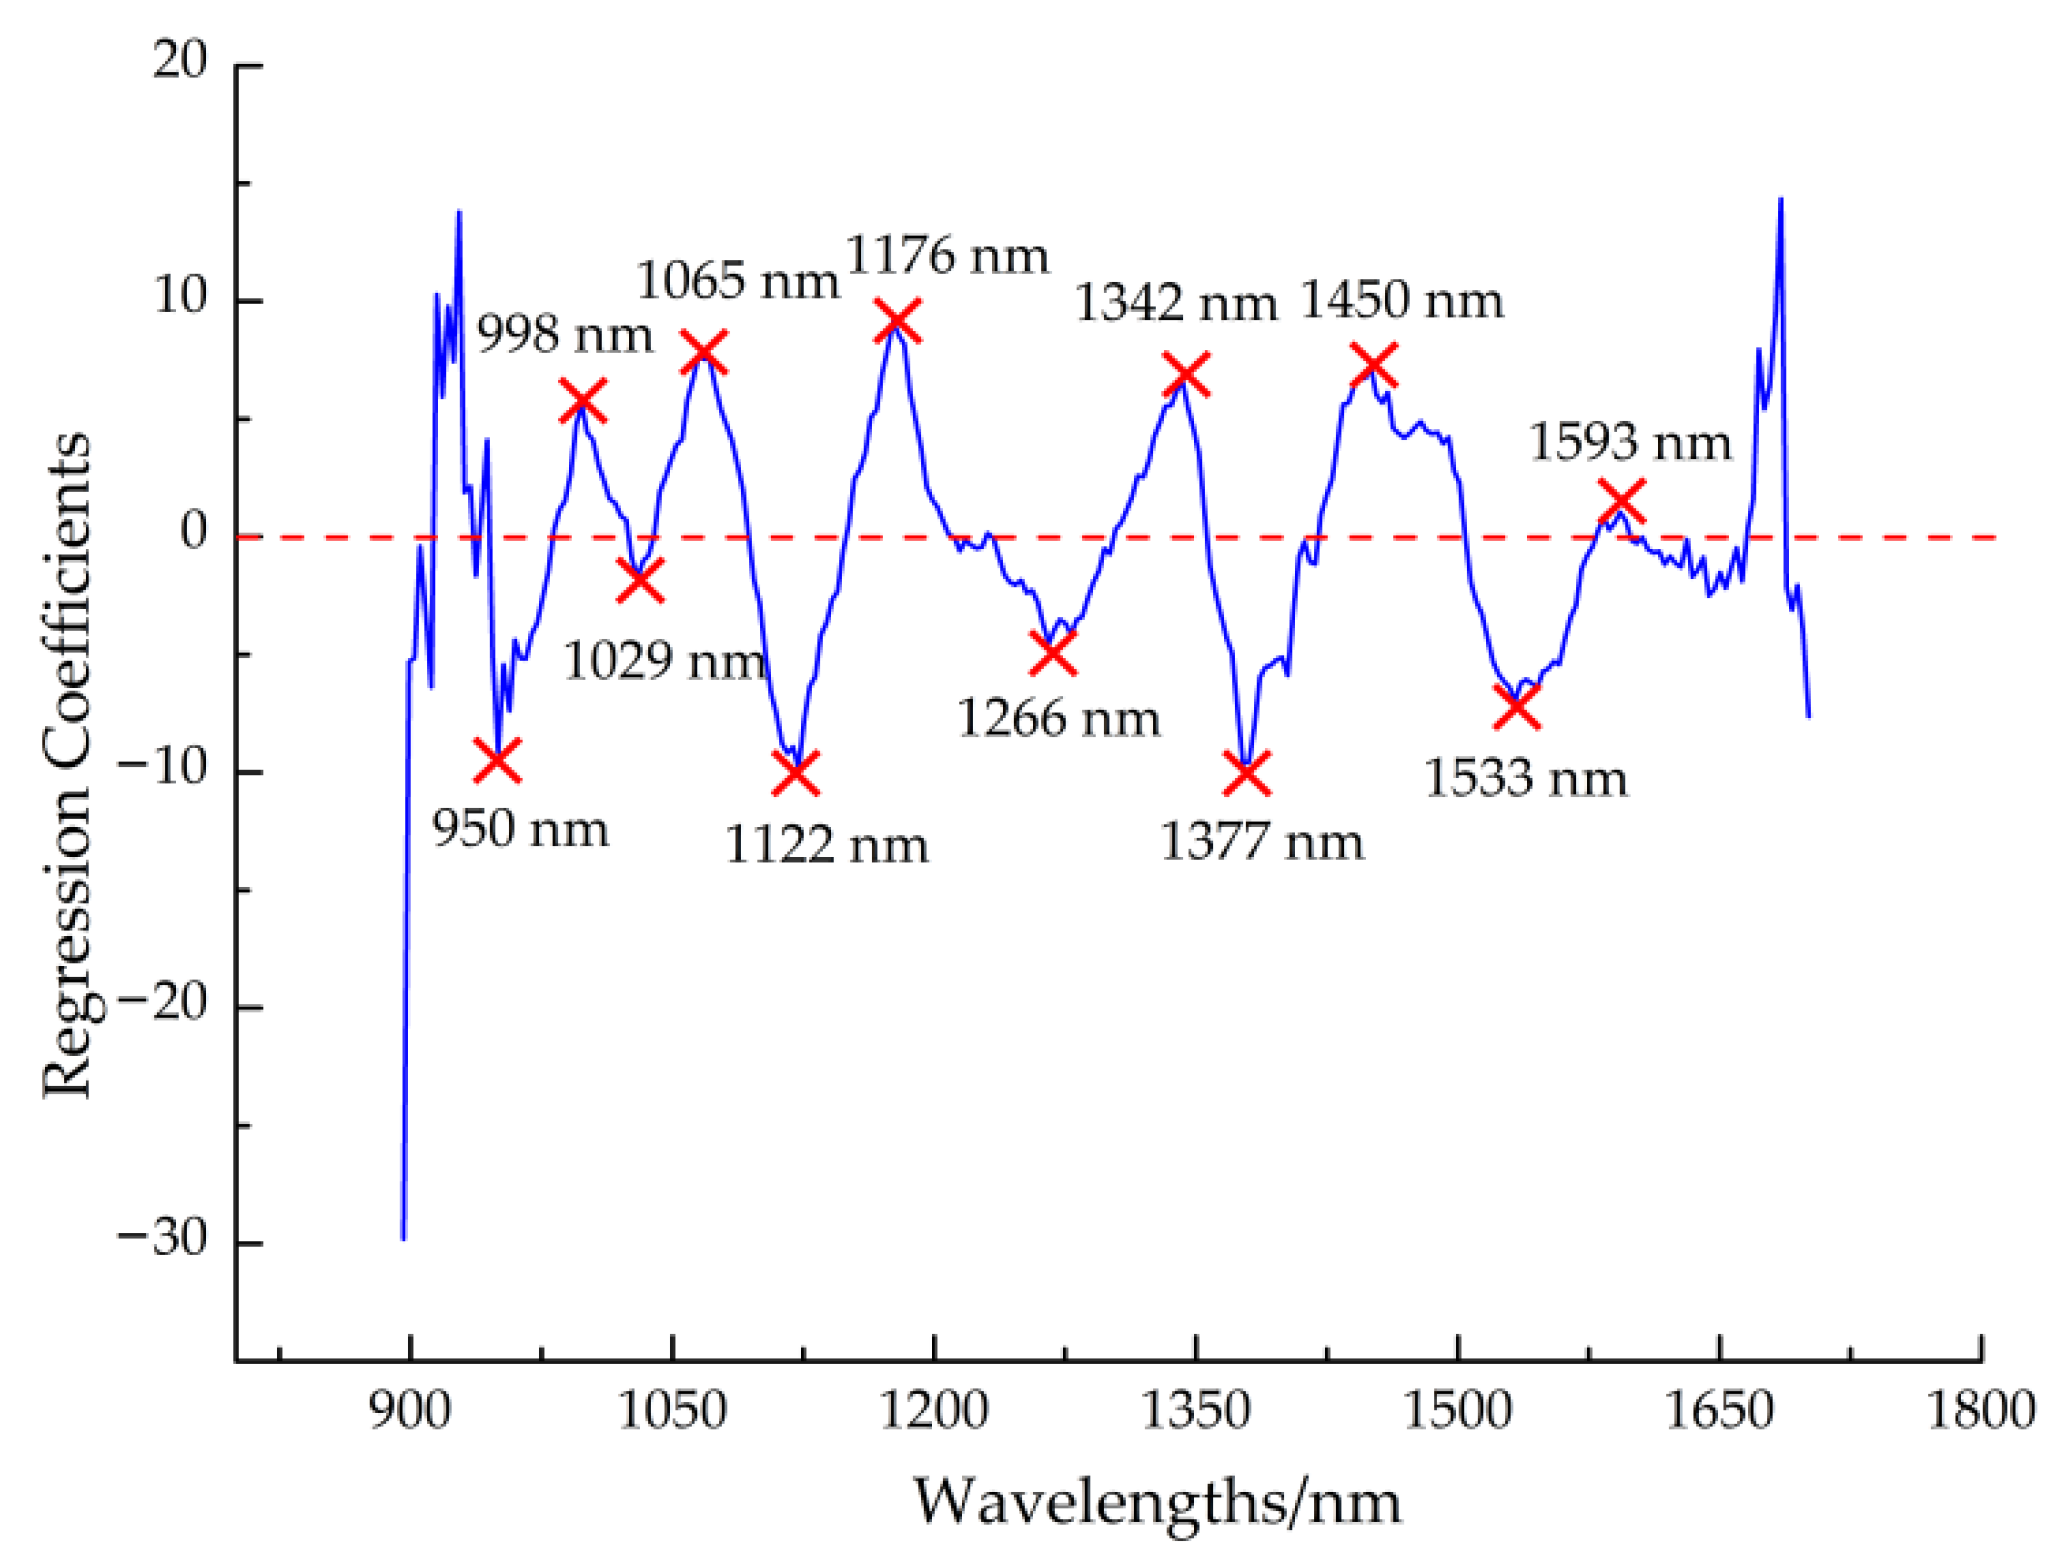
3.3.1. Regression Coefficient Method

From the RC curve shown in Figure 4, 12 characteristic wavelengths were selected: 950, 998, 1029, 1065, 1122, 1176, 1266, 1342, 1377, 1450, 1533, and 1593 nm.

3.3.2. Successive Projections Algorithm

In this study, the SPA algorithm was used to extract the characteristic wavelength. The minimum and maximum values of the wavelength variable were 2 and 30, respectively. Figure 5a shows the RMSE change curve under different variables. When the 17 characteristic wavelengths were selected (marked as an open blue square), the RMSE reached its optimal value (RMSE = 0.6548). Figure 5b shows the distribution of the selected 17 characteristic wavelengths in the full spectrum band. The seventeen characteristic wave lengths were 1135, 1122, 1342, 1380, 1596, 1545, 1662, 1495, 1148, 957, 1317, 953, 1628, 1675, 1408, 1463, and 1189 nm, and the importance of the wavelength decreases in turn.

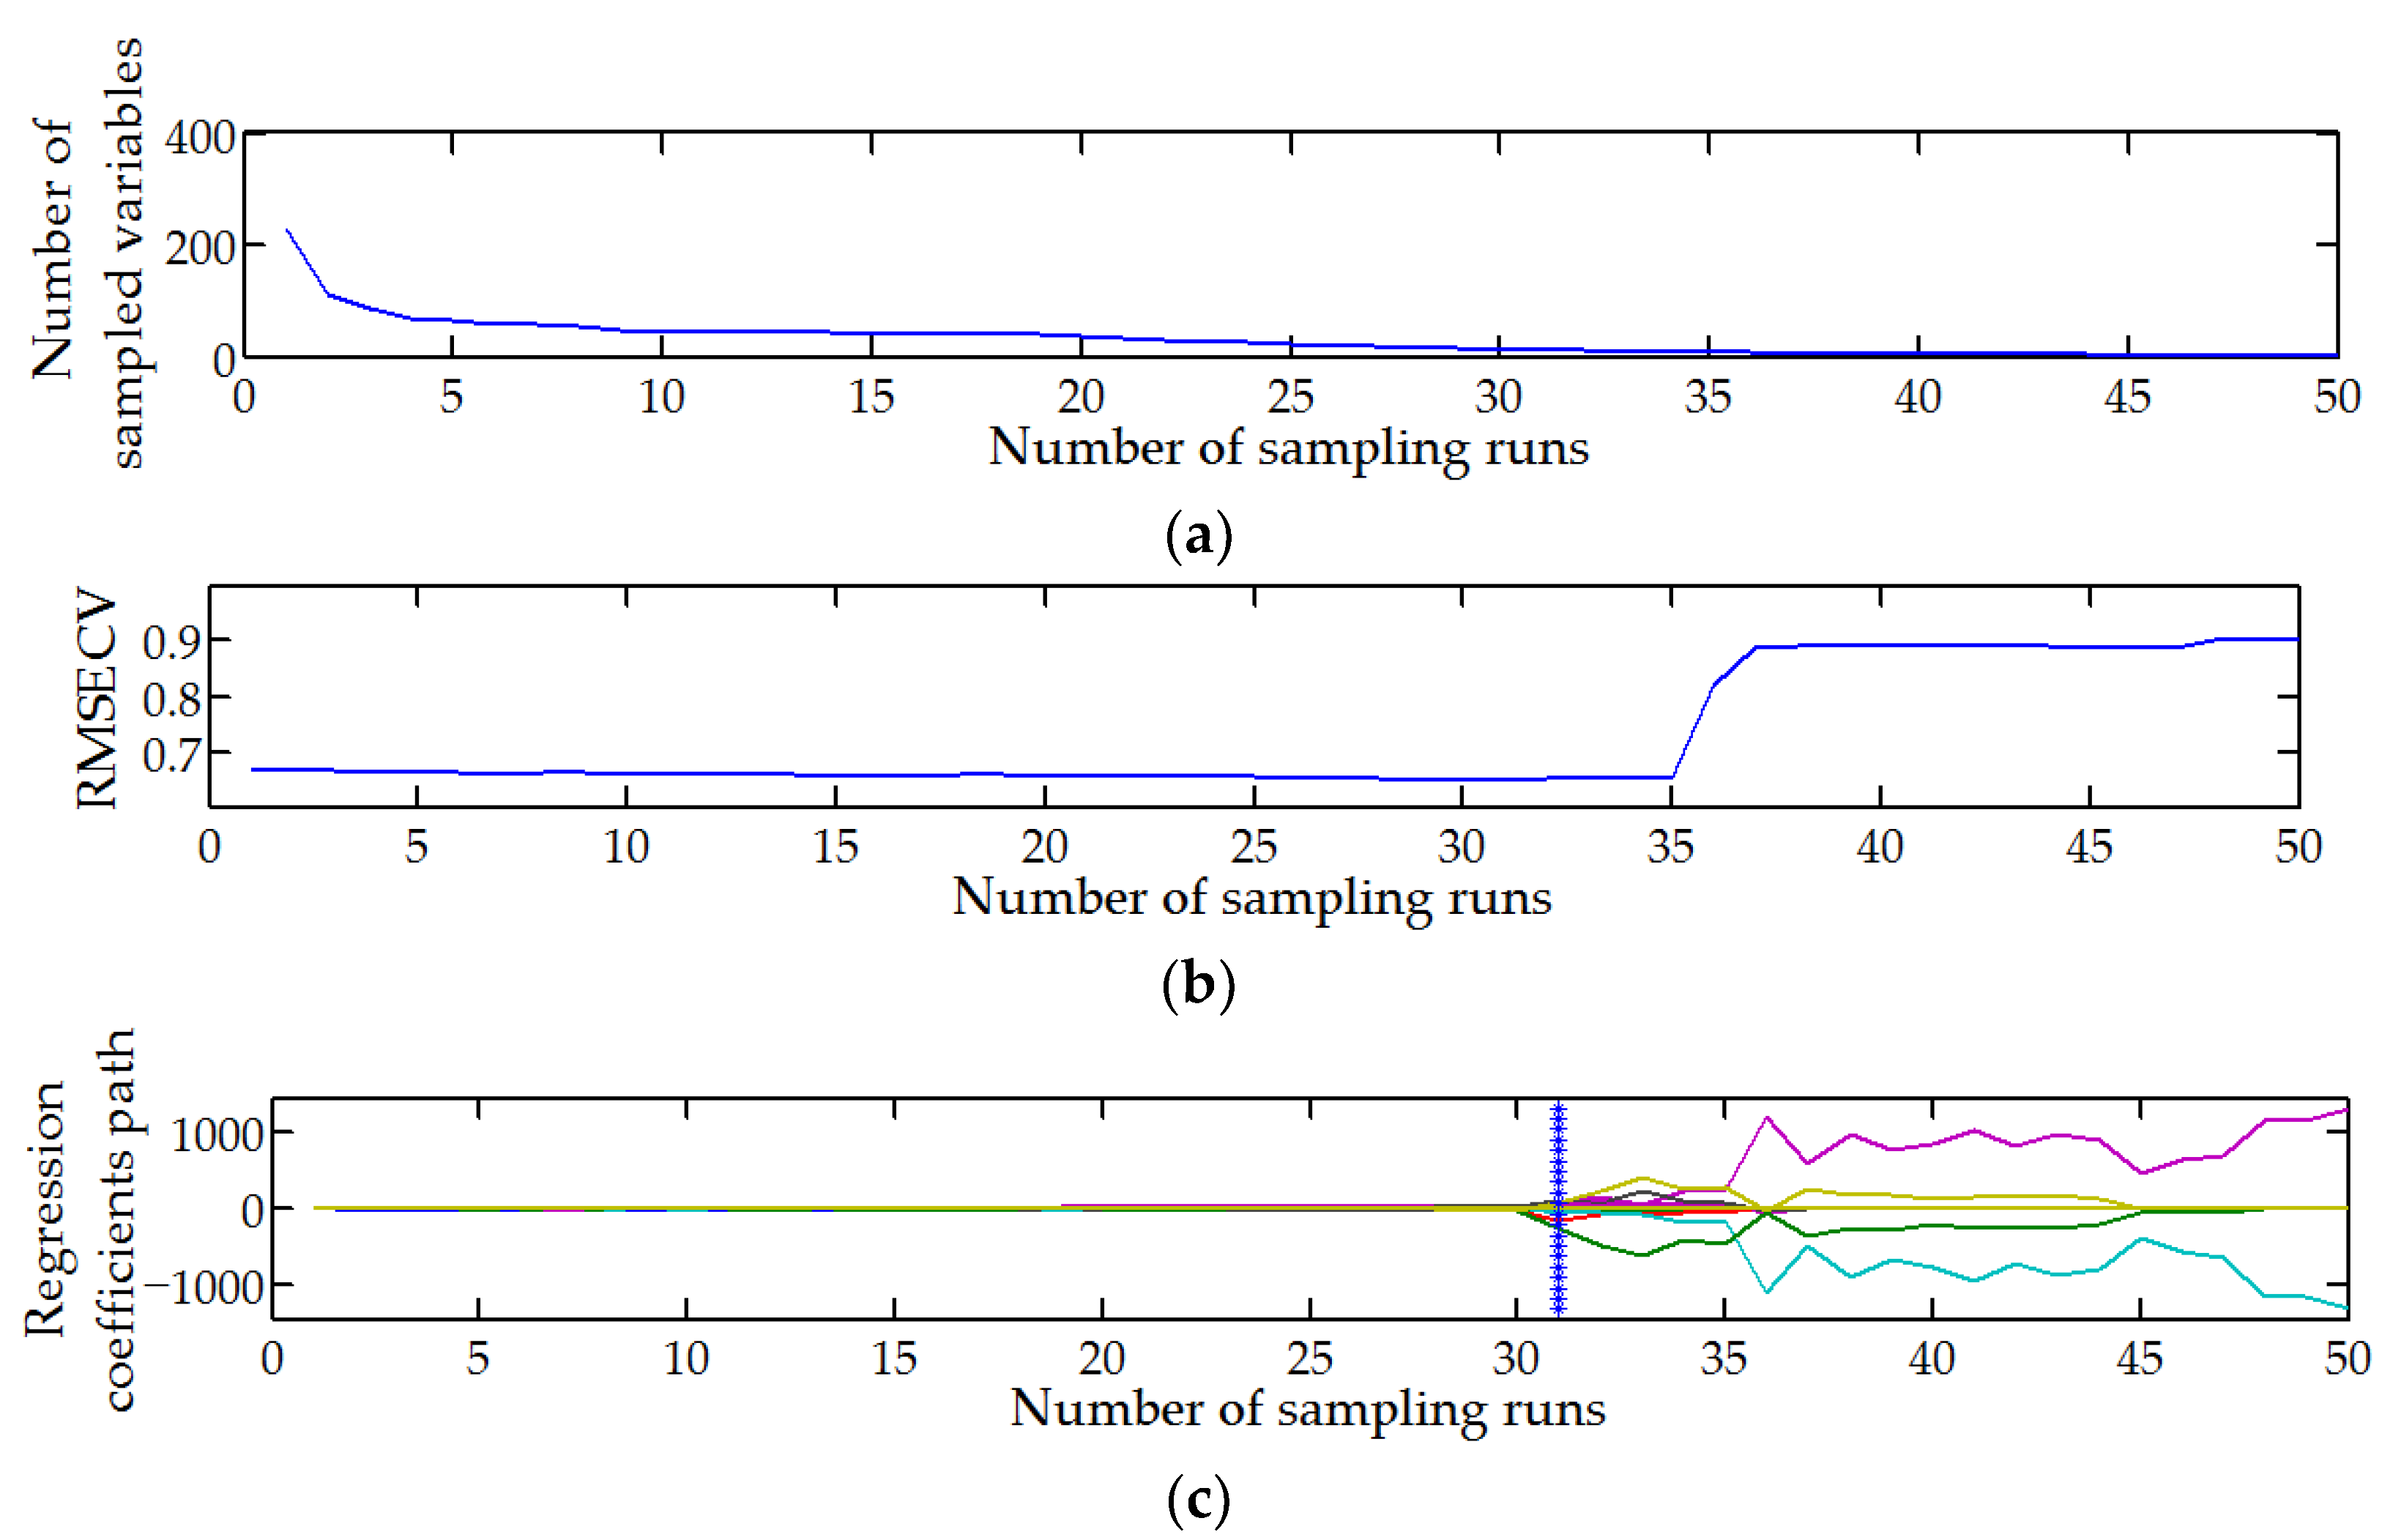
3.3.3. Competitive Adaptive Reweighted Sampling

The algorithm imitates the “survival of the fittest” principle of Darwin’s evolution theory and selects the variable combination with the smallest RMSE through cross verification.
In the process of selecting characteristic wavelength using CARS, Monte Carlo cross-validation was used to select the optimal variable; the number of sampling variables was set to 50. Figure 6a show the number of characteristic wavelengths selected with the variation of sampling variables. Figure 6b show the change of RMSECV with the number of sampling variables. Figure 6c show the regression coefficient curves for each variable. As can be seen in Figure 6a, with the gradual increase of the number of sampling runs, the number of wavelengths gradually decreases and finally tends to be stable. Figure 6b shows that the RMSECV is lowest at the 31st sampling run (RMSECV = 0.6494). Figure 6c shows that the position corresponding to “*” is the minimum value of RMSECV. With minimum RMSECV as the optimal variable selection principle, 13 characteristic wavelengths were selected: 950, 994, 998, 1071, 1263, 1336, 1447, 1450, 1457, 1530, 1539, 1542, and 1628 nm.

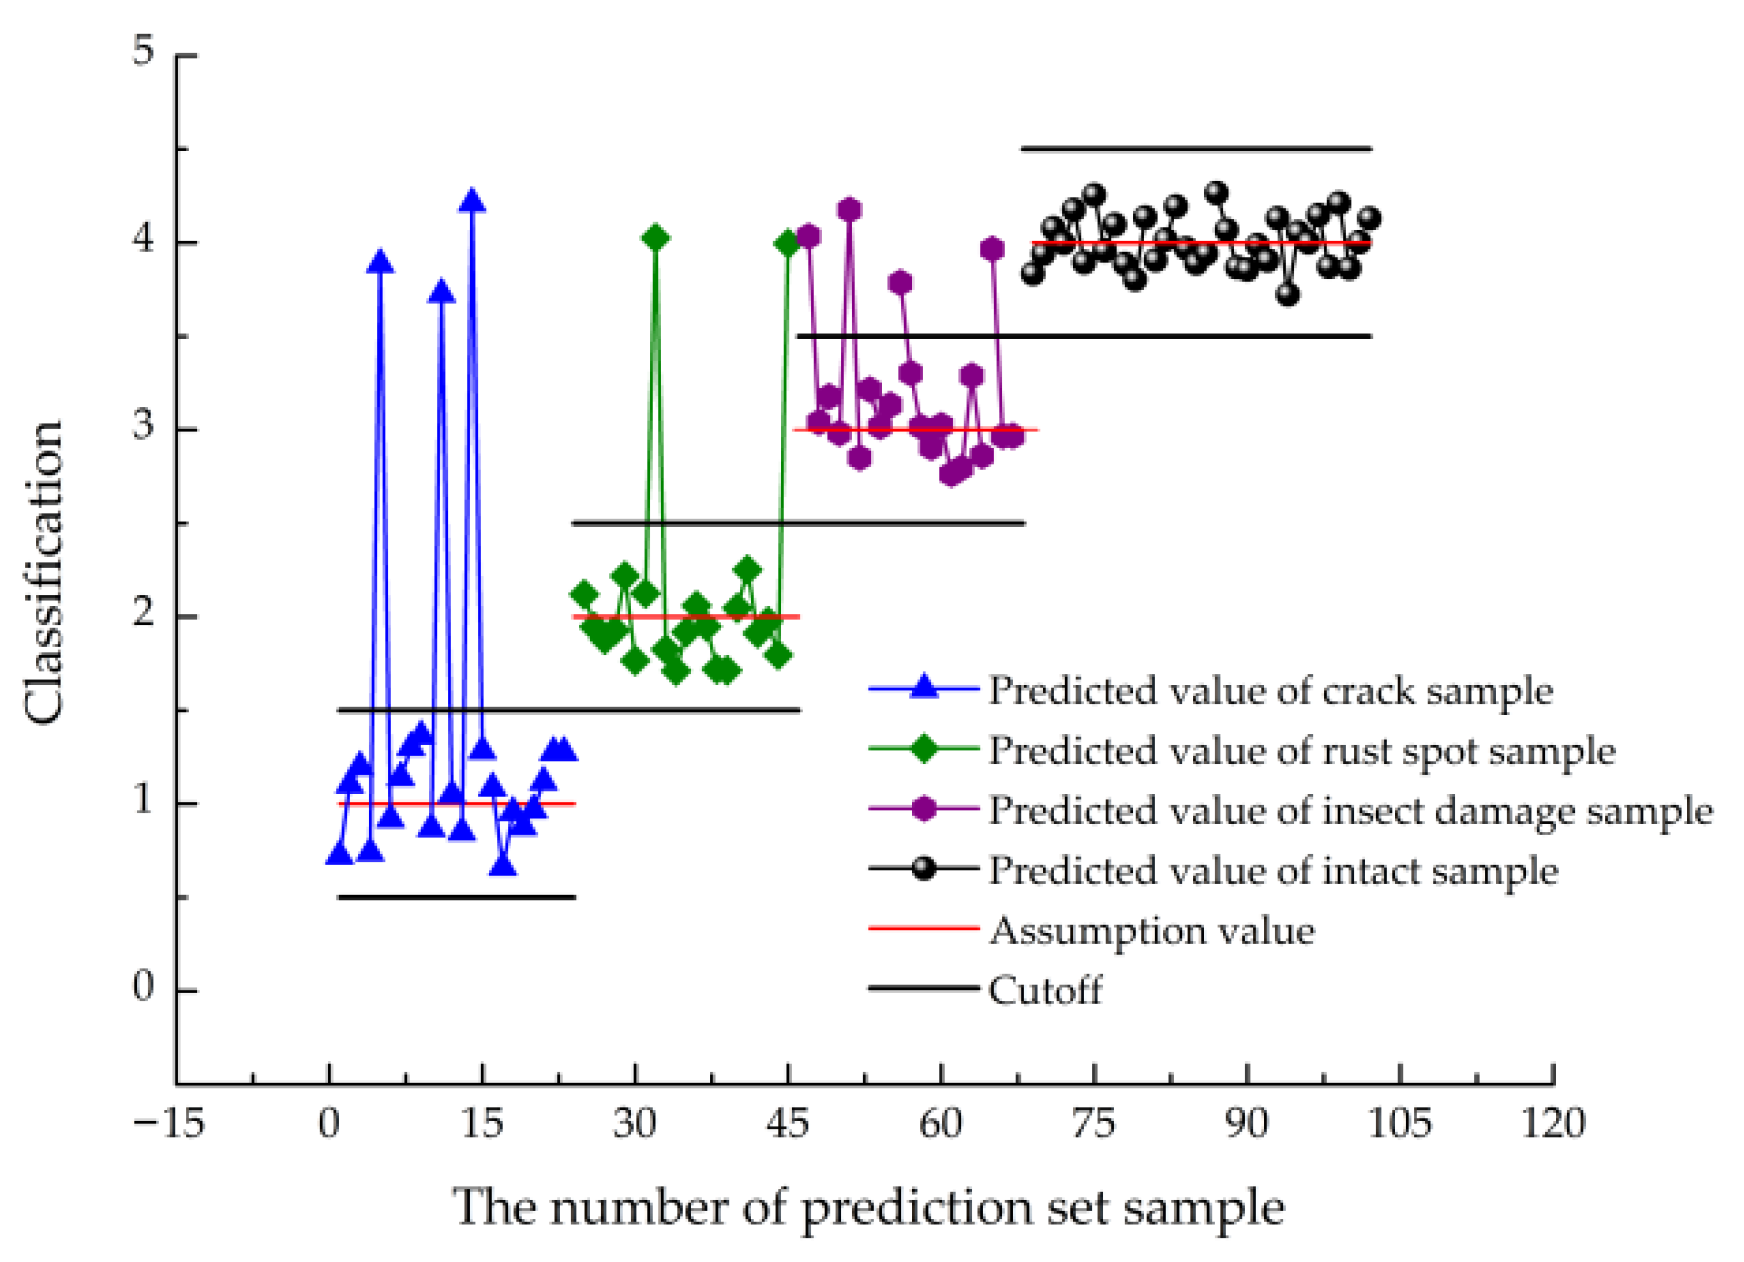
3.3.4. LS-SVM Discriminant Model

Based on the characteristic wavelength extracted by RC, SPA, and CARS algorithm, the LS-SVM discriminant model for the defect category of Cerasus humilis fruit was established. The model discrimination results are shown in Table 3.
As can be seen in Table 3, when γ = 2.47 × 10³, σ 2 = 1.19 × 10³, the prediction set classification accuracy of the RC-LS-SVM model is lowest; its value was 84.76%. This may be because the RC algorithm was the characteristic wavelength extracted based on PLS model, and so it was not necessarily suitable for nonlinear discriminant models. When γ = 5.82 × 10³, σ 2 = 2.04 × 10³, the CARS-LS-SVM model was the best for the classification of Cerasus humilis fruit defects. The classification accuracy of the calibration set and prediction set was 86.35% and 91.43%, respectively. It showed that the characteristic wavelength extracted by the CARS algorithm retained the important characteristic spectral information related to the defect category of Cerasus humilis fruit to the greatest extent.
In order to further analyze the discriminant accuracy of each type of defective Cerasus humilis fruit samples, the prediction results of different defect categories under the CARS-LS-SVM model are shown in Figure 7. A total of nine samples were misjudged. Among them, four insect-damaged fruits were misclassified as intact fruits due to the small area of insect damage, three rust spot fruits were misclassified as intact fruits due to the small area of russeting, and two cracked fruits were misclassified as intact fruits; this is probably due to the inconspicuous location of the crack on the surface of the fruit and the small size of the crack.

3.4. Image Information Detection

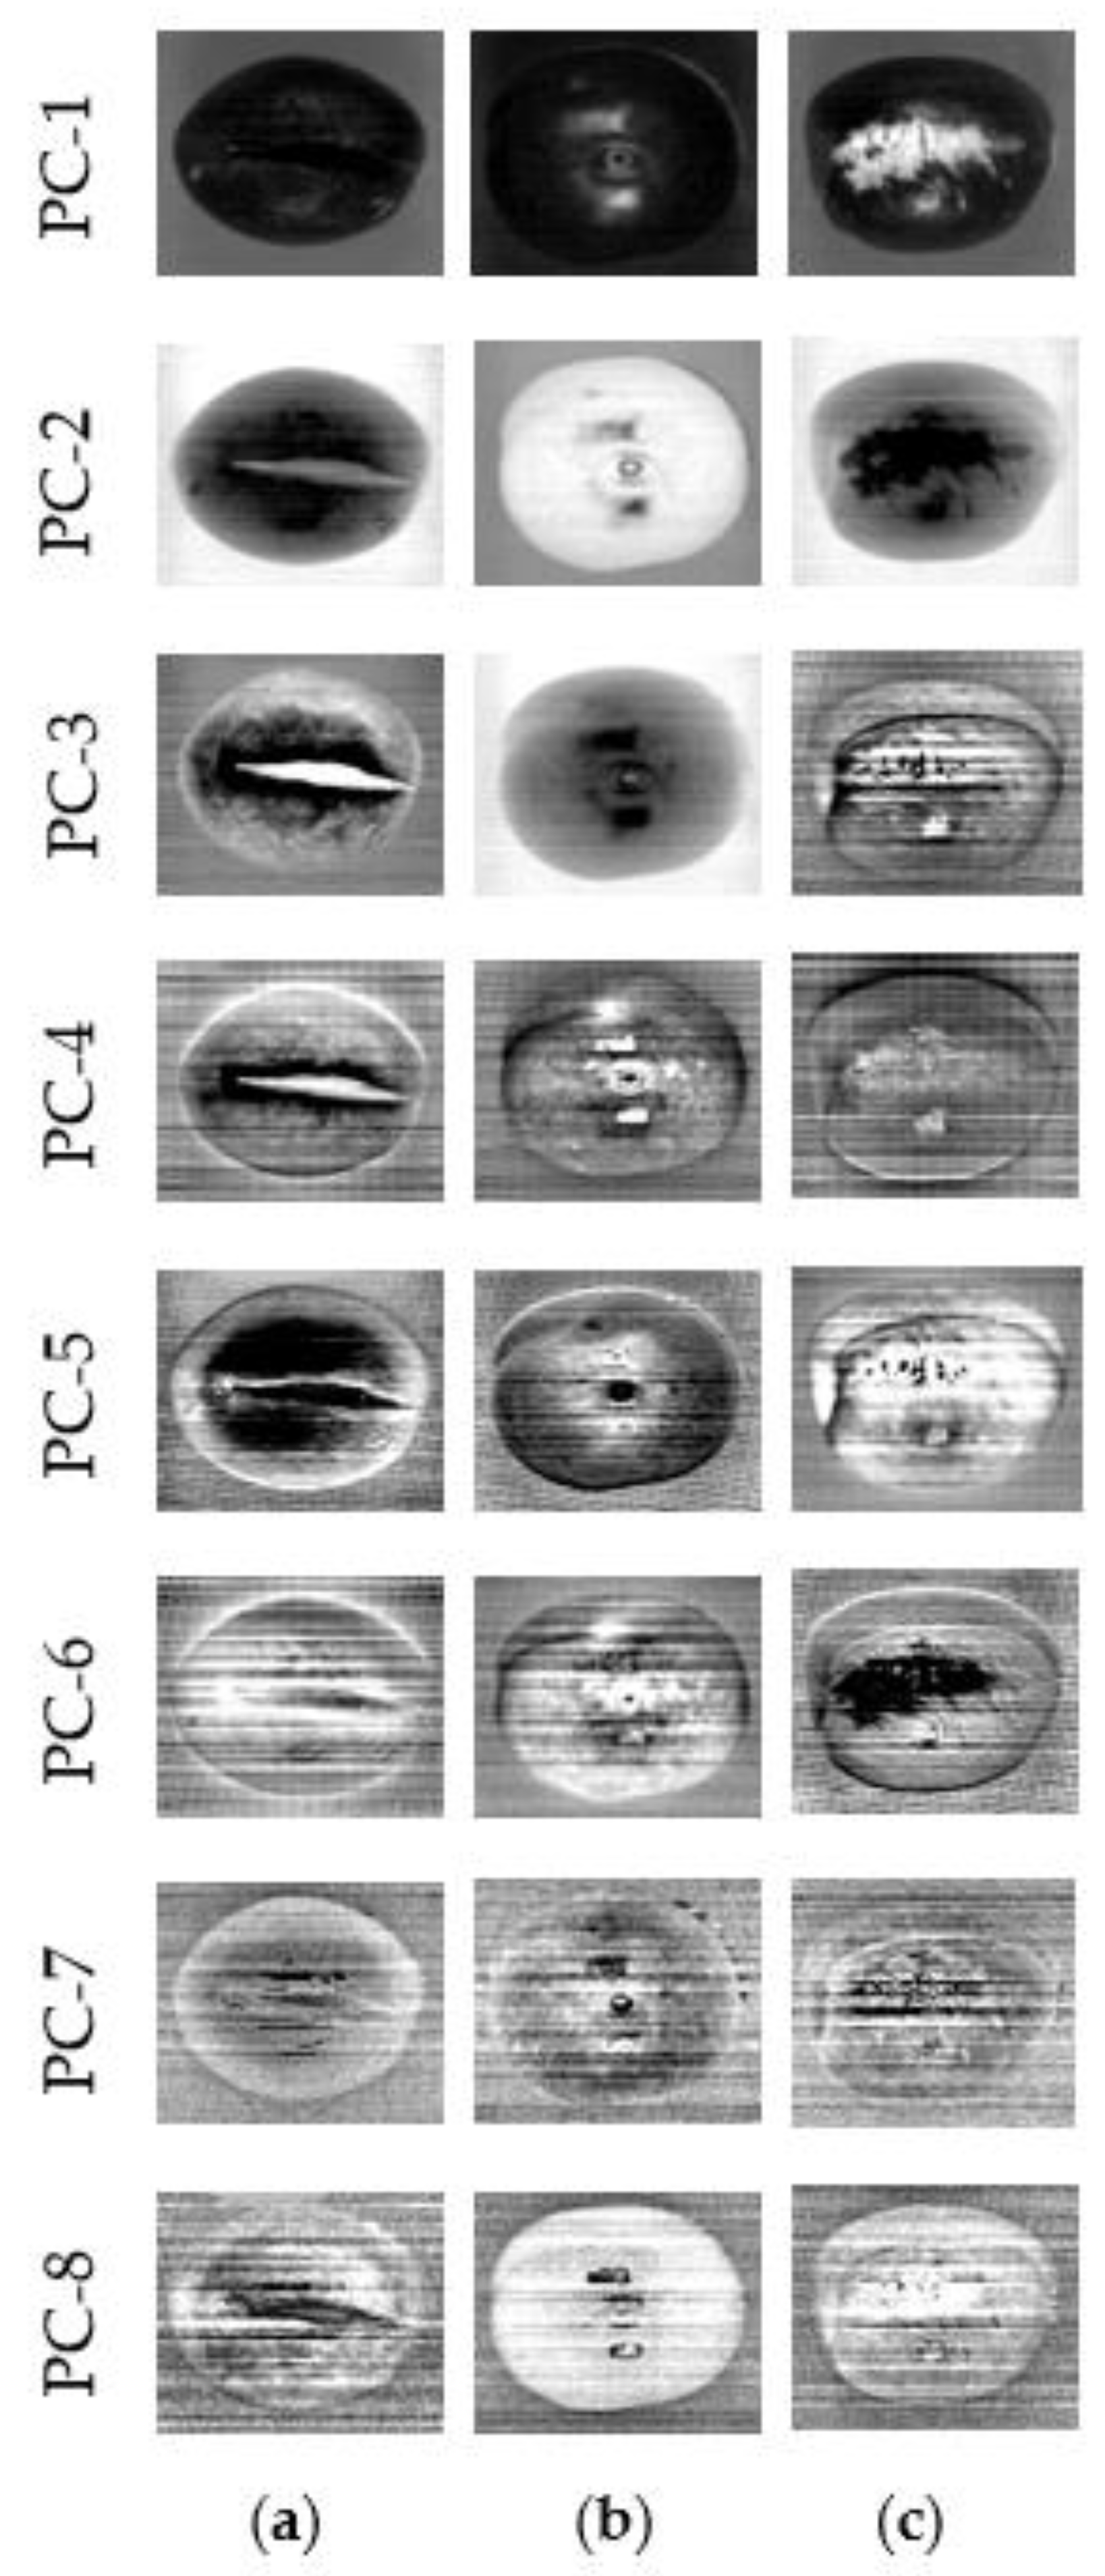
3.4.1. Principal Component Analysis

Because the bands are not correlated with each other, the principal component band can produce more color and better-saturated color composite images [25]. The hyperspectral images of intact and defective Cerasus humilis fruits corresponding to the 13 characteristic wavelengths selected by the CARS algorithm were analyzed for PCA. The results are shown in Table 4.
As can be seen in Table 4, the cumulative contribution rate of the first six principal components (PC) images reached 99.96%. In this research, the first eight PC images of intact and defective Cerasus humilis fruits based on characteristic wavelengths revealed the main characteristics of Cerasus humilis fruits (all images are shown in Figure 8). These PC images are ranked according to the degree of decreasing variance, with the 1st PC image having the largest proportion of variance and containing the most original information. It can be seen in Figure 8 that the first six PC images (PC-1 to PC-6) of four different defect types of Cerasus humilis fruit contain the most original image information, while PC-7 and PC-8 images were primarily filled with noise.
Through the rapid visual inspection of the first six PC images, we found that the primary defect features became more obvious in some of the converted PC images, proving that PCA could extract useful features. Take the cracked fruit as an example: in the PC-1 image, the gray value difference between the crack and the surrounding regions was small; this cannot provide more unique features than the original unconverted hyperspectral image. Images PC-2, PC-3, and PC-4 enhance useful crack features. In particular, the information in the cracked regions of the PC-3 image was remarkable, meaning the cracked regions could be clearly identified. The black information around the cracked regions of the PC-3 image was because the skin of the Cerasus humilis fruit becomes darker and even rotten over a prolonged time. Thus, the PC-3 image was more suitable for crack region segmentation. In the PC image of the rust spot fruit sample, the rust spot regions in PC-6 are the most obvious, allowing it to be used for defect segmentation. Similarly, PC-5 could be used to identify insect damage defects.

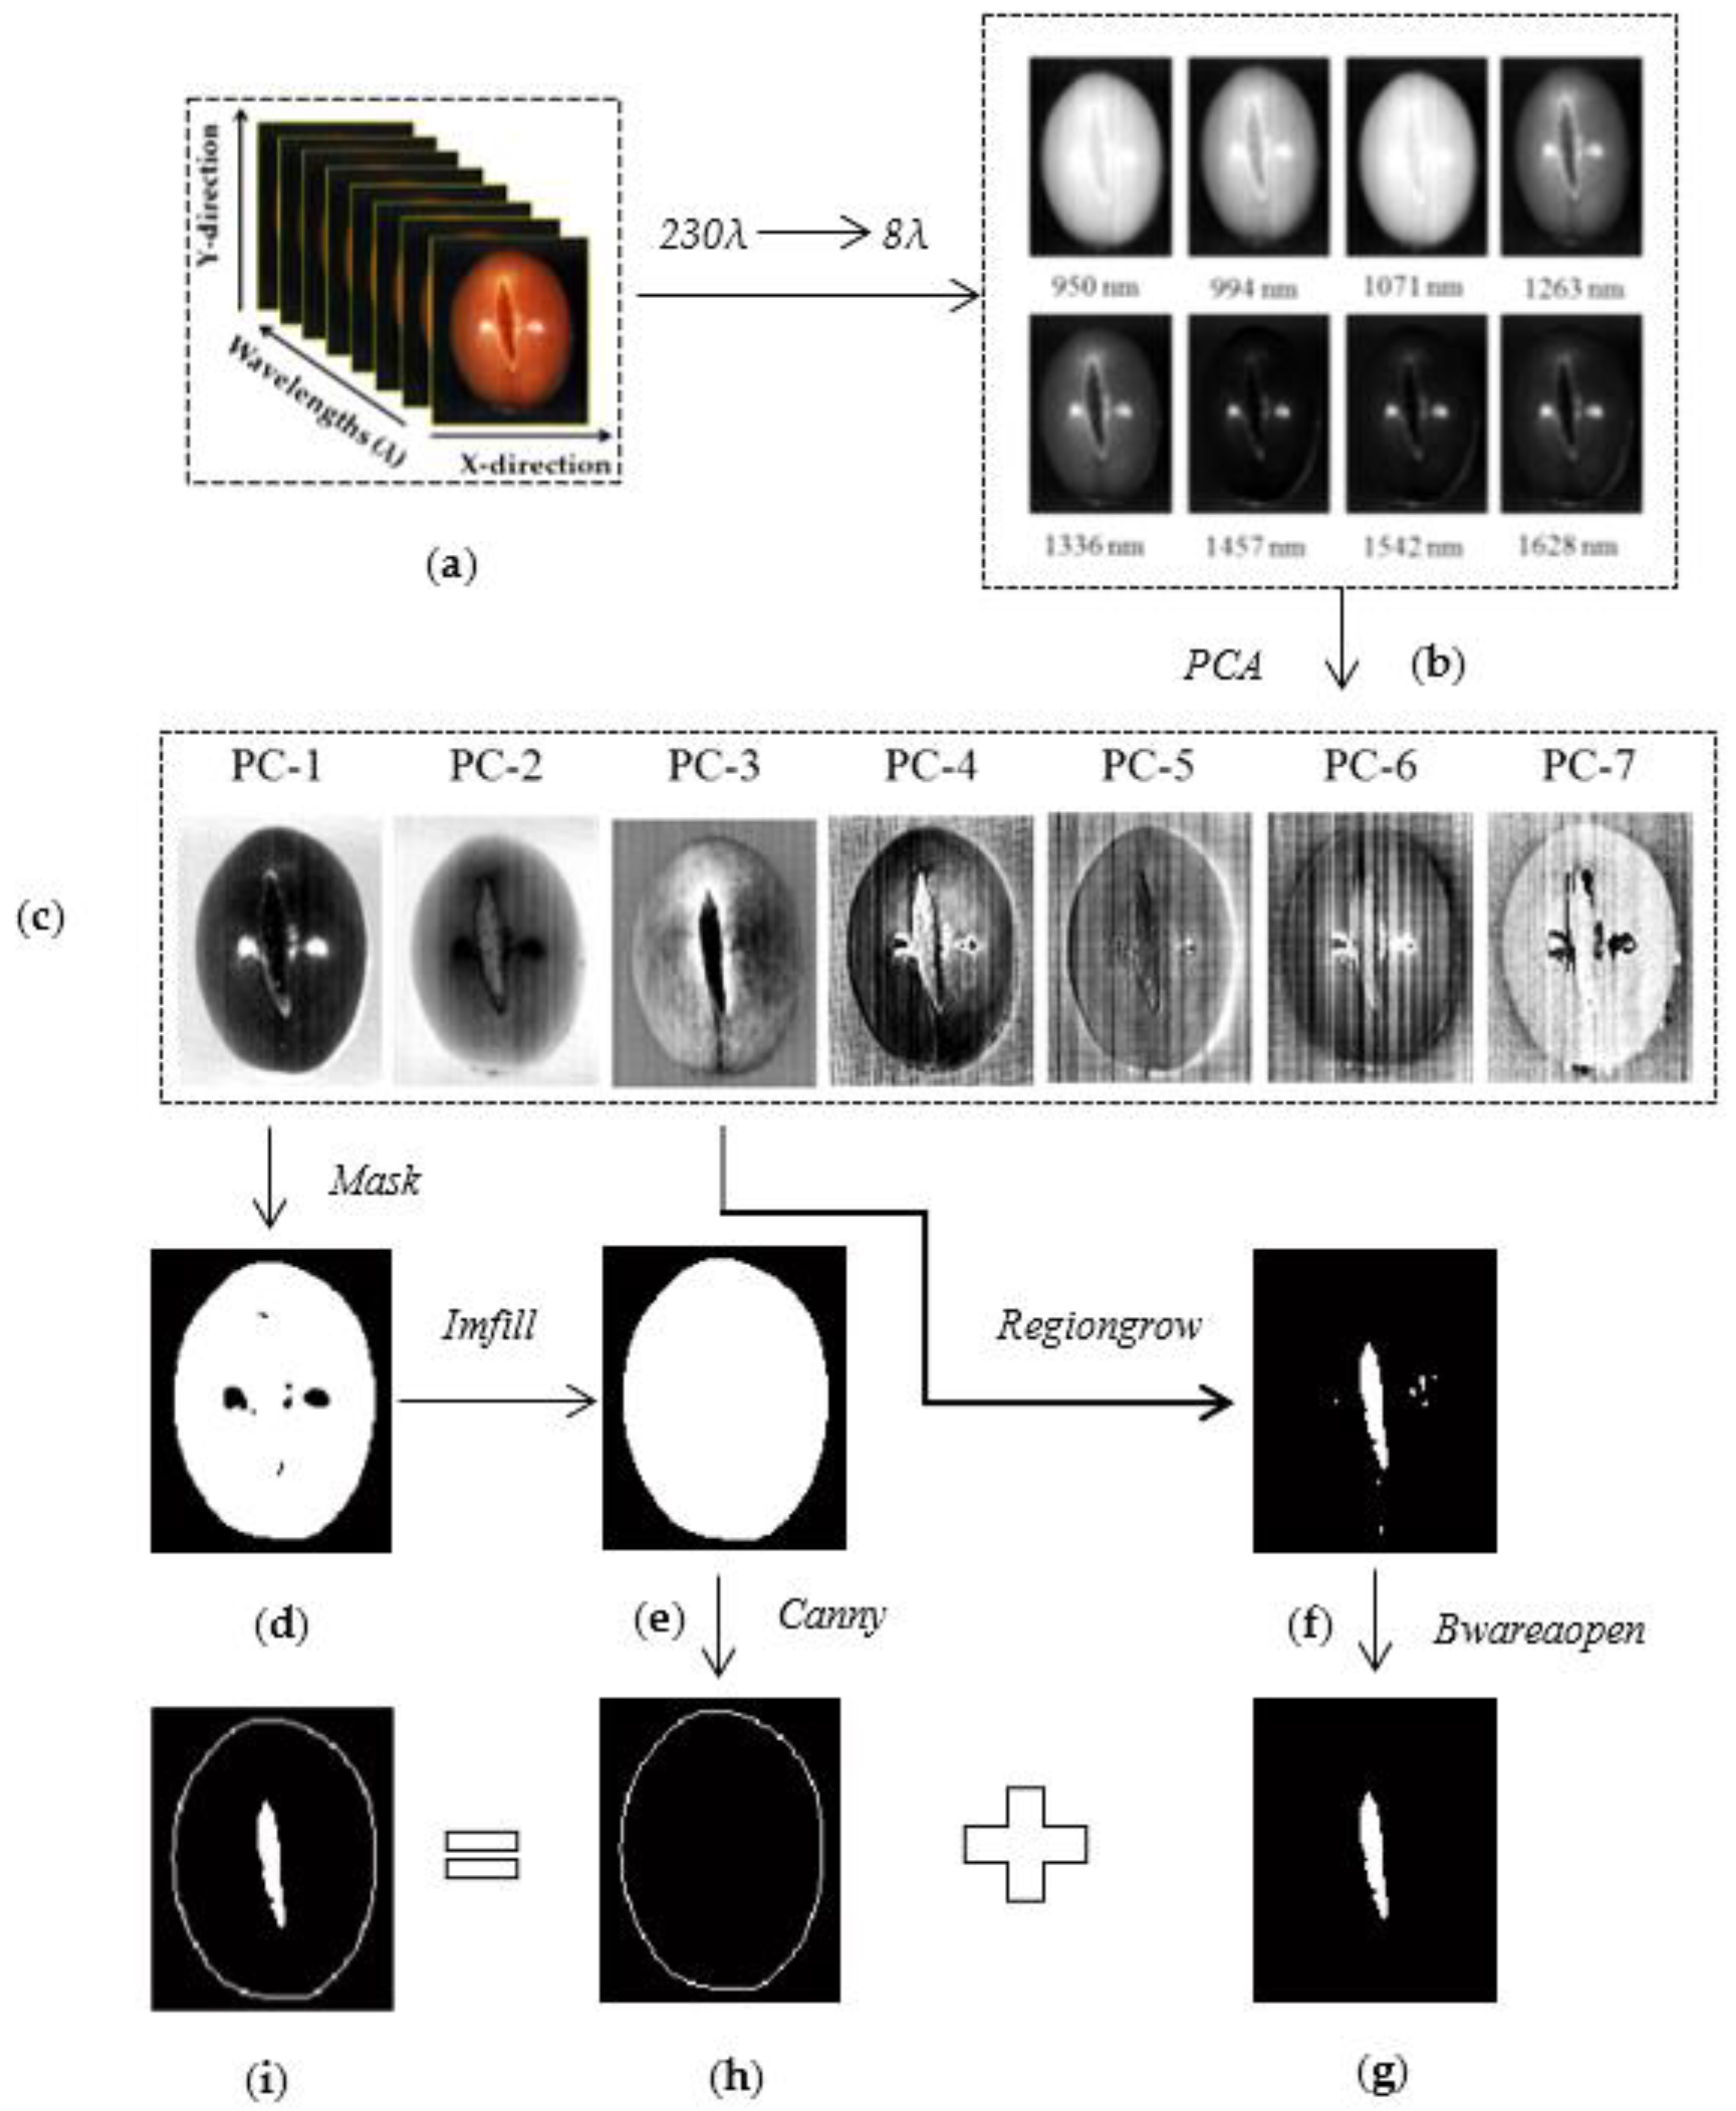
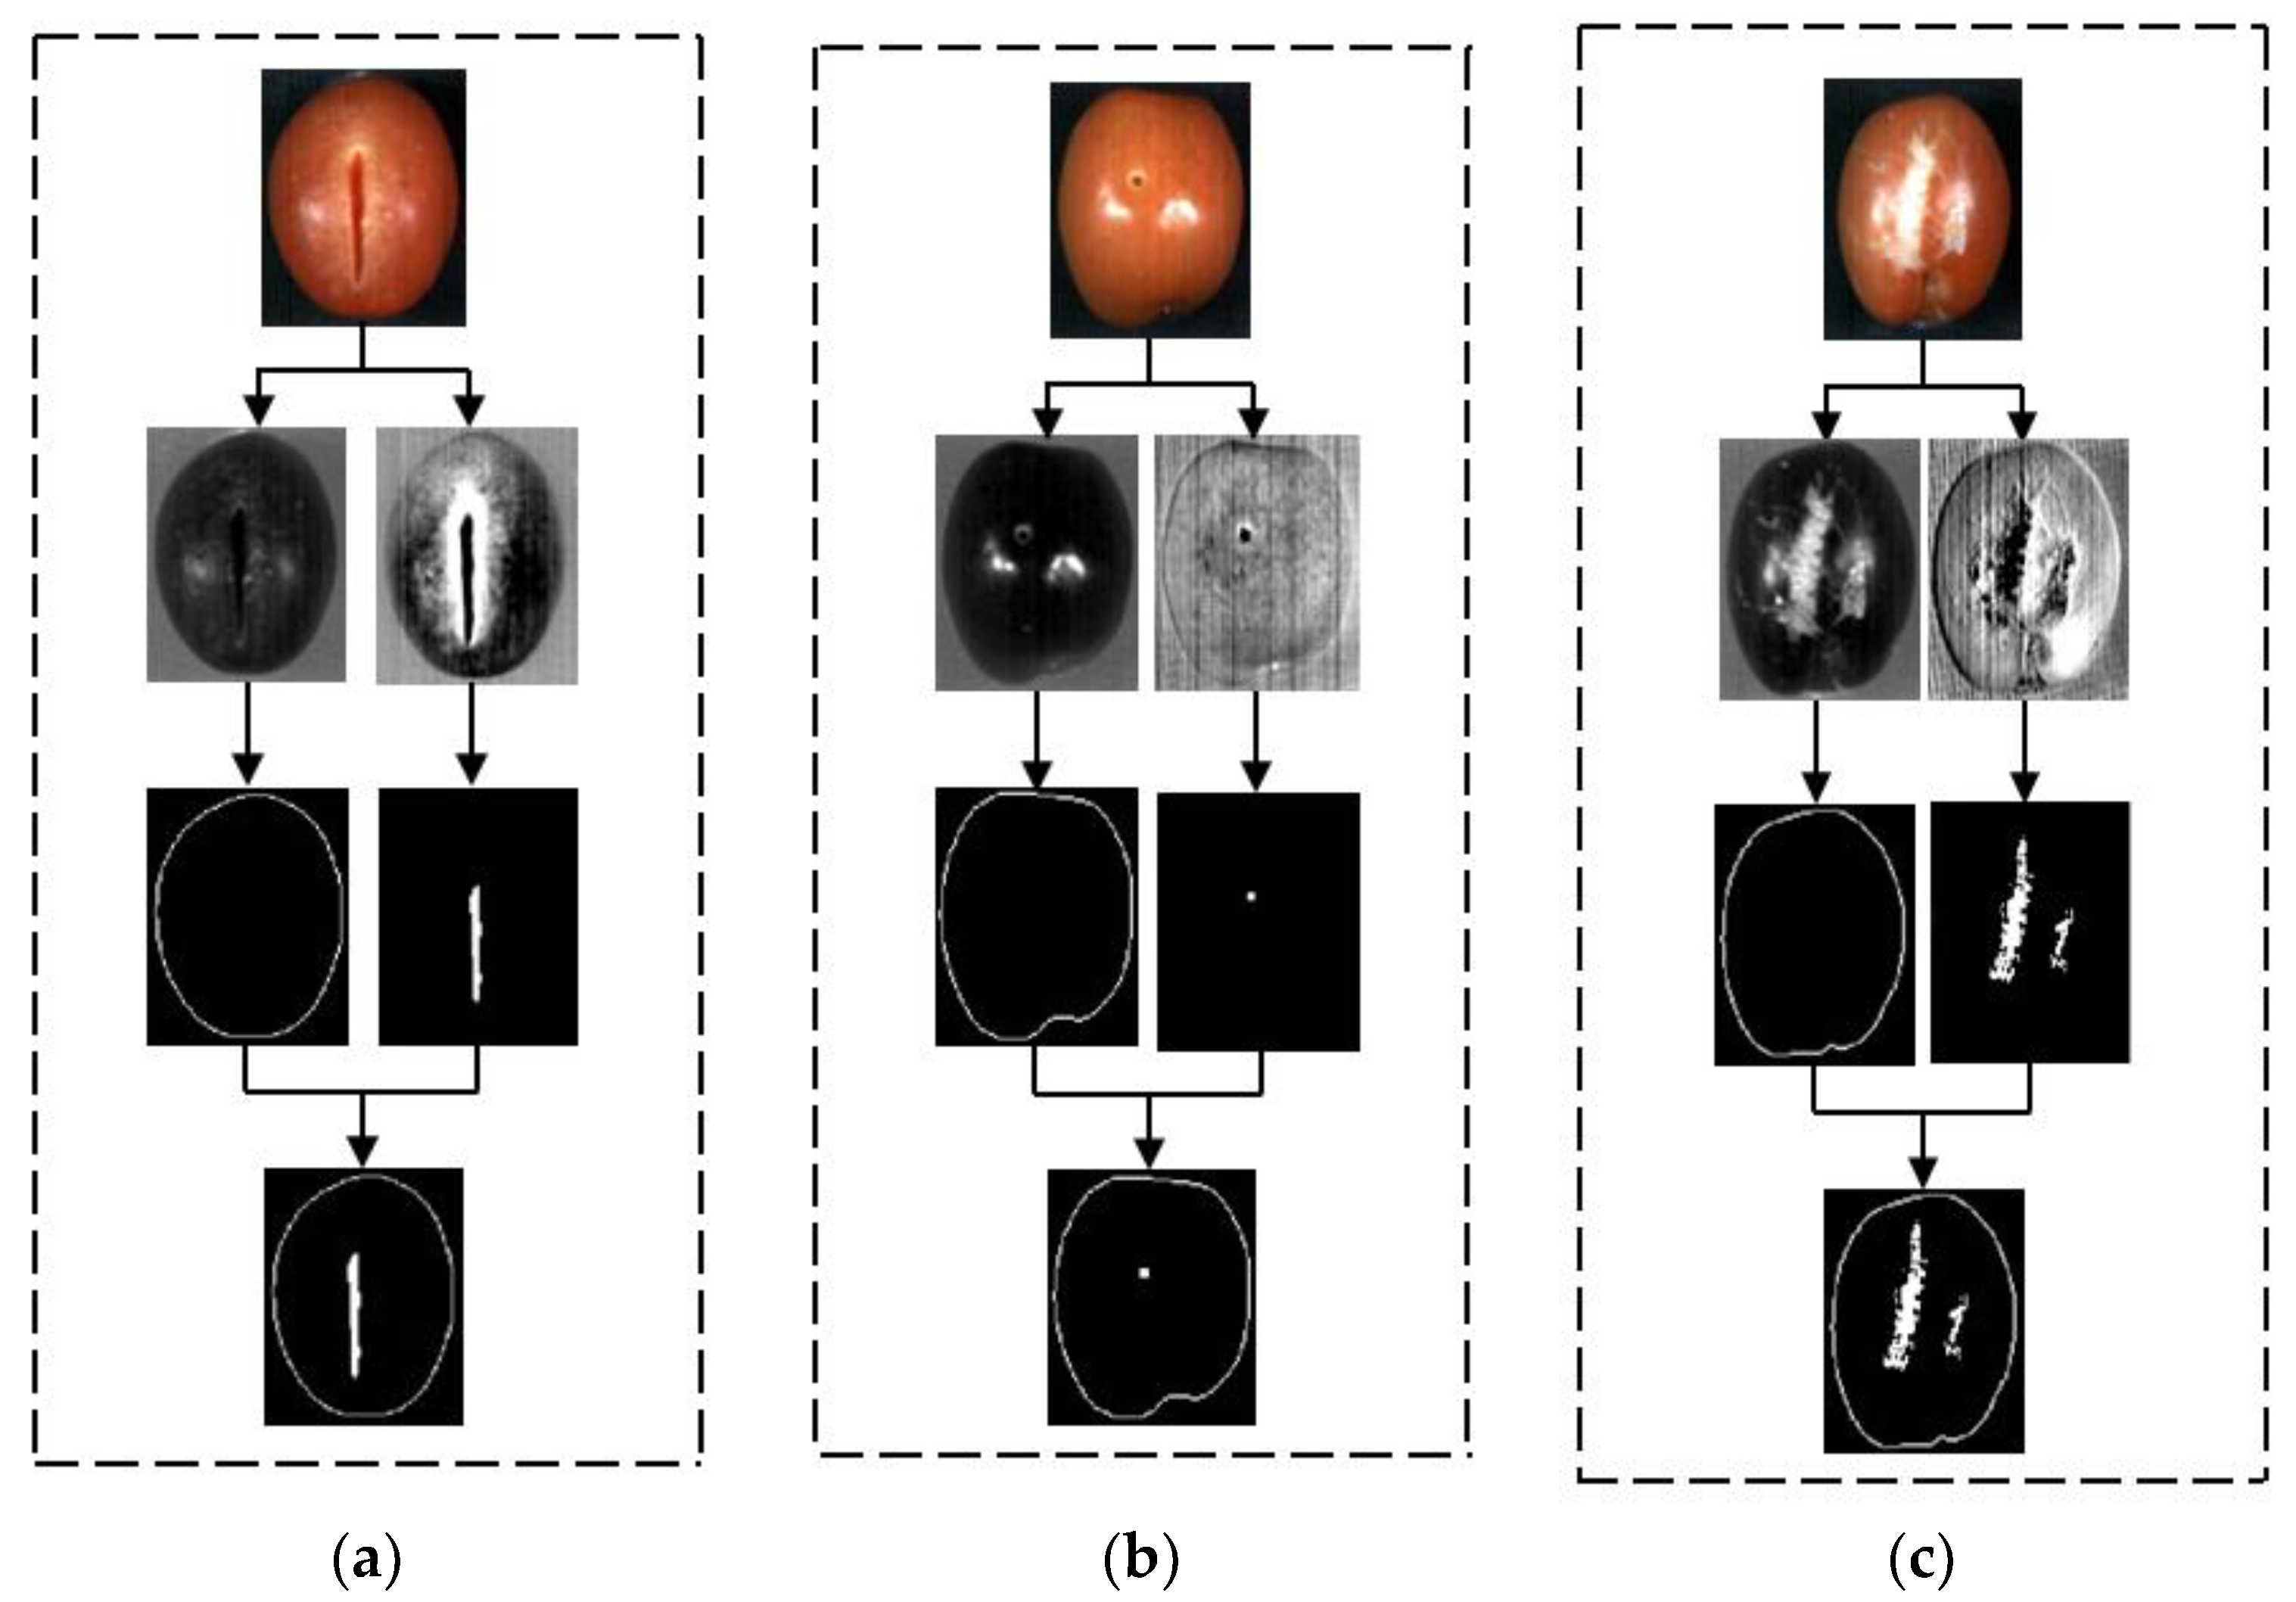
3.4.2. Defective Features Identification Algorithm

It can be seen from the above studies that the characteristic wavebands extracted by CARS are more suitable for the natural damage detection of Cerasus humilis fruit. Considering that there are adjacent bands in the 13 characteristic wavebands extracted by the CARS algorithm, the problem of strong collinearity exists between these adjacent wavebands. According to the corresponding reflectivity value of different wavebands, the waveband with a higher reflectivity value is selected as the optimal characteristic waveband [26]. Therefore, images with characteristic wavebands of 950, 994, 1071,1263, 1336, 1457, 1542, and 1628 nm were selected for the PCA to obtain the first eight PC images of the samples. These were combined with image processing technology and the defect sample of Cerasus humilis fruit was segmented. Take the cracked fruit sample as an example to explain the steps of the defect feature identification algorithm, as shown in Figure 9. Figure 9a shows a hyperspectral image of a cracked fruit sample at the full wavelength range. Figure 9b shows the single-band grayscale images corresponding to the eight characteristic wavebands. It can be seen that the cracked features in the images at 950 nm and 1071 nm are not obvious, meaning they could not be used as feature images. After subjecting the feature band images to PCA, the first seven PC images were obtained, as shown in Figure 9c. PC-1 contains the most original data information, but most of this information concerned the surface contour. The information on the cracked region in the PC-3 image is the most obvious, and the cracked region can be clearly identified. We can select the gray-scale image at PC-1 for mask processing and obtain the mask templates seen in Figure 9d. However, there are two gaps in the mask template image, which might be caused by strong light shining on the smooth skin of the Cerasus humilis fruit. The two vacant areas that exist are filled using the “Imfill” function, resulting in a complete mask template, as shown in Figure 9e. Then, the ‘‘Canny’’ edge detection operator was used to identify the edge of the mask image to obtain the contour image of the Cerasus humilis fruit, as shown in Figure 9h. In addition, the cracked region feature of the sample is extracted from the PC-3 image using the ‘‘Regiongrow’’ function (the value of the threshold was set as 50). However, there are some small white dots (noise) around the crack characteristics (as shown in Figure 9f), which may be caused by the unreasonable selection of threshold value in the process of “Regiongrow”. Here, the white dots are removed using the “Bwareaopen” function. After this processing, the location of the cracked region features in the sample was obtained, as shown in Figure 9g. Using the “Imadd” function, the sample edge contour image (Figure 9g) and the crack feature images (Figure 9h) are added. Finally, we obtain the cracked sample recognition image (Figure 9i), in which the location of the cracked features is provided.

3.4.3. Verification of The Defect Feature Identification Algorithm

To verify the effectiveness of the defect feature identification algorithm seen in Figure 9, image recognition of defective and intact samples is carried out according to the detection algorithm. The typical sample identification diagram of three types of external defects are shown in Figure 10.
A prediction set of 105 samples with different defect feature types was used to evaluate the above defect feature detection algorithm. Among them, 23 Cerasus humilis fruits with rust spots, 21 Cerasus humilis fruits with cracks, 21 Cerasus humilis fruits with insect damage, and 40 undamaged samples were used. The identification results are shown in Table 5.
As can be seen in Table 5, a total of 12 samples were undetected; the correct identification rate for all prediction set samples was 88.57%. It is shown that the method was feasible for detecting all types of defective samples of Cerasus humilis fruits. The undetected samples include four samples with rust spots, four samples with cracks, two samples with insect damage, and two undamaged samples. For the four rust spot samples, the possible reason was that the rust spot defects on the samples were too small to be detected. The four undetected crack samples were not found because the cracked regions of the samples were rotten, rather than because the sample cracks were too small to be used in this discriminant algorithm. For insect damage samples, the insect damage area was too small and reflective, so it was not completely identified. Two undamaged samples were mistakenly detected as a rust spot defects; the possible reason was the reflective and uneven colors of the skin of the fruit. The classification accuracy of cracked Cerasus humilis fruits was the lowest. This was because the cracked region in Cerasus humilis fruits was rotten.

3.4.4. Discussion

In this work, the image information of defective and intact Cerasus humilis fruit was collected by hyperspectral imaging system and combined with chemometrics and image processing methods. The defect features of Cerasus humilis fruits were detected from both the hyperspectral and image information systems, and satisfactory test results were obtained. In addition to discrimination accuracy, classification time also plays an important role in the sorting system. Compared with the machine vision classification system, the hyperspectral imaging system has a significant amount of spectral information and a relatively complex image acquisition method. Therefore, the HSI system has a relatively slow sample defect identification time. In this study, the imaging time is about 25.0 s, and the average analysis time of classifying Cerasus humilis fruit into normal fruit and defective fruit is 37.8 s with the use of a developed image processing algorithm of Cerasus humilis fruit defect features. Wu et al. [9] used hyperspectral imaging to classify the defects of jujube (intact, cracked, bruised, and insect-infested jujubes). The soft independent modeling of class analogies (SIMCA) is the best model based on raw data, and the classification accuracy was above 95%. Yu et al. [27] used the hyperspectral imaging system to obtain image information of loquat fruit defect features and developed an image processing method to discriminate the defect features with a detection rate of 92.3%. Hyperspectral imaging and machine learning techniques were combined to identify some common defects in “Algerian” loquat fruits, with a correct classification rate of 95.9% [28]. Wang et al. [29] analyzed the hyperspectral images of healthy and early decay tomatoes collected using spectral and image processing techniques. The results show that the recognition rates of early decay fruit and healthy fruit were 100% and 97.5%, respectively. When compared with the above research papers, this research has a good effect on recognition, though there is still the phenomenon of false and missed detection. The detection accuracy of our research results is slightly lower (88.57%). This may be due to the small volume of this research object and the small proportion of the defect area, resulting in a low recognition rate. In addition, as a spherical fruit, the uneven lighting distribution on the Cerasus humilis fruit is also one of the main problems causing low accuracy of defect detection. Subsequent research will improve the image detection algorithm to improve the recognition rate.

4. Conclusions

In this study, hyperspectral imaging technology was used to identify the defect region of Cerasus humilis fruit from qualitative analysis and feature recognition. Main research conclusions:
(1)
The de-trending (De-T) spectral pretreatment method can better optimize spectral data, and the PLS model of spectral data after pretreatment has a relatively high accuracy, with the correlation coefficient of prediction (Rp) of 0.8571 and root mean square error of prediction (RMSEP) of 0.2964. Regression coefficient (RC), successive projections algorithm (SPA), and competitive adaptive reweighted sampling (CARS) algorithms were used to extract the characteristic wavebands of spectral data after baseline pretreatment, and the least squares-support vector machine (LS-SVM) model was established. It is concluded that the CARS-LS-SVM model was the best at detecting the defective (rust spot, insect damage, crack) and normal Cerasus humilis fruit samples, with an accuracy rate of 93.2%. As can be seen from the detection results of spectral technology, it was impossible to detect all three defect types proposed in the paper using a single spectral technology. Therefore, the analysis and detection of the three defect types were also considered from the perspective of image processing technology.
(2)
On the other hand, images corresponding to eight sensitive bands (950, 994, 1071, 1263, 1336, 1457, 1542, and 1628 nm) selected by CARS were subjected to principal component analysis (PCA). Then, using the “Imfill” function, “Canny” operator, “Regiongrow” algorithm, “Bwareaopen” function and the images of PCA, the edge and defect feature of 105 Cerasus humilis fruits could be recognized. The result of image discrimination shows that the detection precision of the algorithm was 88.57%. It can be seen from the research results that the image processing techniques could not identify all the defect samples.
This study provides theoretical support and a basis for the online detection equipment of Cerasus humilis fruit. However, in this study, fruits of similar weight and size were selected as research objects and the influence of different colors shades and sizes of fruits on the detection accuracy was not considered. Further research will consider adding fruits with different colors shades, sizes, and more types of defect characteristics, as well as collecting samples of Cerasus humilis fruit from different varieties and locations to improve the robustness of the model, optimize the detection algorithm, and apply this processing to other fruits.

Author Contributions

Conceptualization, B.W.; methodology, B.W. and L.L.; software, B.W. and L.L.; data curation, B.W. and L.L.; writing—original draft, B.W. and S.Z.; writing—review and editing, B.W., S.Z. and H.Y. All authors have read and agreed to the published version of the manuscript.

Funding

This research was funded by Basic Research Project of Shanxi Province (Free Exploration) (Grant NO. 20220302123641).

Institutional Review Board Statement

Not applicable.

Informed Consent Statement

Not applicable.

Data Availability Statement

Data are contained within the article.

Acknowledgments

The authors thank the editor and anonymous reviewers for providing helpful suggestions for improving the quality of this manuscript.

Conflicts of Interest

The authors declare no conflict of interest.

References

  1. Wang, B.; He, J.L.; Li, L.L. On-line detection of cerasus humilis fruit based on VIS/NIR spectroscopy combined with variable selection methods and GA-BP model. INMATEH-Agric. Eng. 2021, 63, 199–210. [Google Scholar] [CrossRef]
  2. Tian, Y.; Sun, J.; Zhou, X.; Wu, X.H.; Lu, B.; Dai, C.X. Research on apple origin classification based on variable iterative space shrinkage approach with stepwise regression–support vector machine algorithm and visible-near infrared hyperspectral imaging. J. Food Process Eng. 2020, 43, e13432. [Google Scholar] [CrossRef]
  3. Li, X.; Liu, Y.D.; Jiang, X.G.; Wang, G.T. Supervised classification of slightly bruised peaches with respect to the time after bruising by using hyperspectral imaging technology. Infrared Phys. Technol. 2021, 113, 103557. [Google Scholar] [CrossRef]
  4. Ji, Y.; Sun, L.; Li, Y.; Li, J.; Liu, S.; Xie, X.; Xu, Y. Non-destructive classification of defective potatoes based on hyperspectral imaging and support vector machine. Infrared Phys. Technol. 2019, 99, 71–79. [Google Scholar] [CrossRef]
  5. Zhang, M.; Zhang, B.; Li, H.; Shen, M.; Tian, S.; Zhang, H.; Zhao, J. Determination of bagged ‘Fuji’apple maturity by visible and near-infrared spectroscopy combined with a machine learning algorithm. Infrared Phys. Technol. 2020, 111, 103529. [Google Scholar] [CrossRef]
  6. Cui, J.; Yang, M.; Son, D.; Cho, S.I.; Kim, G. Hyperspectral imaging for tomato bruising damage assessment of simulated harvesting process impact using wavelength interval selection and multivariate analysis. Appl. Eng. Agric. 2020, 36, 533–547. [Google Scholar] [CrossRef]
  7. Huang, F.H.; Liu, Y.H.; Sun, X.; Yang, H. Quality inspection of nectarine based on hyperspectral imaging technology. Syst. Sci. Control Eng. 2021, 9, 350–357. [Google Scholar] [CrossRef]
  8. Lü, Q.; Tang, M. Detection of hidden bruise on kiwi fruit using hyperspectral imaging and parallelepiped classification. Procedia Environ. Sci. 2012, 12, 1172–1179. [Google Scholar] [CrossRef] [Green Version]
  9. Wu, L.; He, J.; Liu, G.; He, X. Detection of common defects on jujube using Vis-NIR and NIR hyperspectral imaging. Postharvest Biol. Technol. 2016, 112, 134–142. [Google Scholar] [CrossRef]
  10. Yuan, R.; Liu, G.S.; He, J.G.; Kang, N.B.; Ma, L.M. Quantitative Damage Identification of Lingwu Long Jujube Based on Visible Near-Infrared Hyperspectral Imaging. Spectrosc. Spectr. Anal. 2021, 41, 1182–1187. [Google Scholar] [CrossRef]
  11. Galvao, R.K.H.; Araujo, M.C.U.; José, G.E.; Pontes, M.J.C.; Saldanha, T.C.B. A method for calibration and validation subset partitioning. Talanta 2005, 67, 736–740. [Google Scholar] [CrossRef]
  12. Wang, B.; He, J.; Zhang, S.; Li, L. Nondestructive prediction and visualization of total flavonoids content in Cerasus Humilis fruit during storage periods based on hyperspectral imaging technique. J. Food Process Eng. 2021, 44, e13807. [Google Scholar] [CrossRef]
  13. Zhao, X.; Zhang, J.; Huang, Y.; Tian, Y.; Yuan, L. Detection and discrimination of disease and insect stress of tea plants using hyperspectral imaging combined with wavelet analysis. Comput. Electron. Agric. 2022, 193, 106717. [Google Scholar] [CrossRef]
  14. Sioma, A.; Socha, J.; Klamerus-Iwan, A. A new method for characterizing bark microrelief using 3D vision systems. Forests 2018, 9, 30. [Google Scholar] [CrossRef] [Green Version]
  15. Zhang, B.; Dai, D.; Huang, J.; Zhou, J.; Gui, Q.; Dai, F. Influence of physical and biological variability and solution methods in fruit and vegetable quality nondestructive inspection by using imaging and near-infrared spectroscopy techniques: A review. Crit. Rev. Food Sci. Nutr. 2018, 58, 2099–2118. [Google Scholar] [CrossRef]
  16. Sun, H.; Zhang, S.; Ren, R.; Xue, J.; Zhao, H. Detection of Soluble Solids Content in Different Cultivated Fresh Jujubes Based on Variable Optimization and Model Update. Foods 2022, 11, 2522. [Google Scholar] [CrossRef]
  17. Sen, P.K. Estimates of the regression coefficient based on Kendall’s tau. J. Am. Stat. Assoc. 1968, 63, 1379–1389. [Google Scholar] [CrossRef]
  18. Tang, G.; Huang, Y.; Tian, K.; Song, X.; Yan, H.; Min, S. A new spectral variable selection pattern using competitive adaptive reweighted sampling combined with successive projections algorithm. Analyst 2014, 139, 4894–4902. [Google Scholar] [CrossRef]
  19. Li, H.; Liang, Y.; Xu, Q.; Cao, D. Key wavelengths screening using competitive adaptive reweighted sampling method for multivariate calibration. Anal. Chim. Acta 2009, 648, 77–84. [Google Scholar] [CrossRef]
  20. Wang, Z.; Li, J.; Zhang, C.; Fan, S. Development of a General Prediction Model of Moisture Content in Maize Seeds Based on LW-NIR Hyperspectral Imaging. Agriculture 2023, 2, 359. [Google Scholar] [CrossRef]
  21. Liu, Y.; Sun, X.; Zhang, H. Nondestructive measurement of internal quality of Nanfeng mandarin fruit by charge coupled device near infrared spectroscopy. Comput. Electron. Agric. 2010, 71, S10–S14. [Google Scholar] [CrossRef]
  22. Shinzawa, H.; Ritthiruangdej, P.; Ozaki, Y. Kernel analysis of partial least squares (PLS) regression models. Appl. Spectrosc. 2011, 65, 549–556. [Google Scholar] [CrossRef] [PubMed]
  23. Osborne, B.G. Near-infrared spectroscopy in food analysis. Encycl. Anal. Chem. 2006, 15, 1–14. [Google Scholar] [CrossRef]
  24. Li, J.; Rao, X.; Ying, Y. Development of algorithms for detecting citrus canker based on hyperspectral reflectance imaging. J. Sci. Food Agric. 2012, 92, 125–134. [Google Scholar] [CrossRef] [PubMed]
  25. Lin, H.; Zhao, J.; Sun, L.; Chen, Q.; Zhou, F. Freshness measurement of eggs using near infrared (NIR) spectroscopy and multivariate data analysis. Innov. Food Sci. Emerg. Technol. 2011, 12, 182–186. [Google Scholar] [CrossRef]
  26. Gonzalez, R.C.; Woods, R.E.; Eddins, S.L. Digital Image Processing Using MATLAB, 2nd ed.; Prentice Hall: Upper Saddle River, NJ, USA, 2009; pp. 107–118. [Google Scholar]
  27. Yu, K.Q.; Zhao, Y.R.; Liu, Z.Y.; Li, X.L.; Liu, F.; He, Y. Application of visible and near-infrared hyperspectral imaging for detection of defective features in loquat. Food Bioprocess Technol. 2014, 7, 3077–3087. [Google Scholar] [CrossRef]
  28. Munera, S.; Gómez-Sanchís, J.; Aleixos, N.; Vila-Francés, J.; Colelli, G.; Cubero, S.; Blasco, J. Discrimination of common defects in loquat fruit cv.‘Algerie’using hyperspectral imaging and machine learning techniques. Postharvest Biol. Technol. 2021, 171, 111356. [Google Scholar] [CrossRef]
  29. Wang, H.; Hu, R.; Zhang, M.; Zhai, Z.; Zhang, R. Identification of tomatoes with early decay using visible and near infrared hyperspectral imaging and image-spectrum merging technique. J. Food Process Eng. 2021, 44, e13654. [Google Scholar] [CrossRef]
Figure 1. The intact and defective samples of Cerasus humilis fruits: (a) Intact sample; (b) Rust spot sample; (c) Insect damage sample; (d) Crack sample.
Applsci 13 03279 g001
Figure 2. Experiment platform of hyperspectral imaging system.
Applsci 13 03279 g002
Figure 3. Spectral curves of four different Cerasus humilis fruit samples: (a) Original spectral curve; (b) Average raw spectra curve.
Applsci 13 03279 g003
Figure 4. Characteristic wavelength selection results of RC.
Applsci 13 03279 g004
Figure 5. Characteristic wavelengths selection results of SPA: (a) Distribution of RMSE; (b) Distribution of the selected 17 variables.
Applsci 13 03279 g005
Figure 6. Characteristic wavelengths selection by CARS: (a) Number of sampled variables; (b) RMSECV values; (c) Regression coefficients of each wavelength variable.
Applsci 13 03279 g006
Figure 7. The discriminant result of the CARS-LS-SVM model.
Applsci 13 03279 g007
Figure 8. The first eight PCs grayscale image of defect feature of Cerasus humilis fruit samples: (a) Crack sample; (b) Insect damage sample; (c) Rust spot sample.
Applsci 13 03279 g008
Figure 9. Flow chart of the involvement of the cracked feature algorithm in the Cerasus humilis fruit sample: (a) hyperspectral image; (b) grayscale image; (c) PCA; (d) mask; (e) imfill; (f) regiongrow; (g) bwareaopen; (h) canny; (i) imadd.
Applsci 13 03279 g009
Figure 10. The identification of Cerasus humilis fruit with defective features: (a) cracked sample; (b) insect damage sample; (c) rust spot sample.
Applsci 13 03279 g010
Table 1. The sample set results were divided by the SPXY algorithm.
Defect TypesNo. of SamplesCalibration SetPrediction Set
Rust spot926923
Crack846321
Insect damage846321
Intact16012040
Total420315105
Table 2. Results of PLS models based on different spectral pretreatment methods.
Pretreatment MethodsLvsCalibration SetPrediction Set
RcRMSECRpRMSEP
Original spectra120.78570.26380.84960.3073
S-G100.76810.27310.83430.3247
SNV90.69020.30860.80690.3986
MSC90.68630.31010.80450.4011
BC90.72090.29550.80650.3692
De-T90.80470.25450.85710.2964
Lvs: latent variables. Rc: correlation coefficient of calibration. Rp: correlation coefficient of prediction. RMSEC: root mean square error of calibration. RMSEP: root mean square error of prediction.
Table 3. Effects of discriminant models based on different characteristic wavelength methods.
Modeling MethodsVariable Selection Methods (No.) Calibration SetPrediction Set
( γ , σ 2 ) Number of MisjudgmentsClassification Accuracy (%)Number of MisjudgmentsClassification Accuracy (%)
LS-SVMRC (11)(2.47 × 10³, 1.19 × 10³)5482.861684.76
SPA (17)(4.64 × 10³, 1.98×10³)4585.711189.52
CARS (13)(5.82 × 10³, 2.04 × 10³)4386.35991.43
γ represents the penalty factor, σ 2 represents the nuclear parameter.
Table 4. The cumulative contribution rate of the first eight principal components of the image.
PCsCharacteristic ValueContribution Rate (%)
136,533.029382.59
29624.030498.23
31429.661999.67
4820.736599.89
5213.865899.93
687.816599.96
711.396999.99
82.3585100.00
Table 5. Test results by applying the developed algorithm to 105 independent samples with different defect types.
ClassDefect TypesSample NumberDetected (Undetected)Accuracy (%)
Defective (n = 65)Rust Spot2319 (4)82.61
Crack2117 (4)80.95
Insect Damage2119 (2)90.48
Normal (n = 40)Intact4038 (2)95.00
Total410593 (12)88.57
Disclaimer/Publisher’s Note: The statements, opinions and data contained in all publications are solely those of the individual author(s) and contributor(s) and not of MDPI and/or the editor(s). MDPI and/or the editor(s) disclaim responsibility for any injury to people or property resulting from any ideas, methods, instructions or products referred to in the content.

