1. Introduction
In 2019, it was estimated that 113 million people were living with cardiovascular diseases (CVD) in the 57 European Society of Cardiology member countries [
1]. To reduce the risk of cardiovascular acute events and improve outcomes, the management of risk factors such as hypertension, smoking habits, lipid metabolism, etc. is vital.
Hypertension is one of the most prevalent risk factors for most of the cardiovascular diseases [
1,
2]. Blood pressure measurement devices are commonly used daily by patients at home, however, one cannot be certain of the way the devices are used. Indeed, the European Society of Hypertension advised to avoid any physical activity during the previous 30 min and to stay still for 3 to 5 min prior to the measurement to avoid biases [
3]. Therefore, monitoring physical activity in the context of blood pressure measurement might help to assess the recorded values’ validity.
Regular moderate to intense physical activity also plays an important role in the prevention of cardiovascular diseases. For stroke, it has a significant impact on the age of occurrence of the first stroke event but also on its long-term outcomes [
4]. Indeed, Kramer et al. emphasized in their review that post-stroke physical activity is also of high importance for survivors, indicating that “The recommendation now clearly states that increasing PA [Physical Activity] and exercises to improve CRF [Cardio-Respiratory Fitness] should be included in stroke rehabilitation programs” [
5]. Furthermore, regular physical activity has beneficial effects on other risk factors or concomitant chronic diseases such as diabetes mellitus [
6].
Finally, the introduction of a digital tool as a support for care and rehabilitation has been shown to significantly reduce the risk of acute events and to improve patient adherence, as described by Zhou et al. in the context of post-stroke prevention [
7].
Therefore, all these points testify for the relevance to monitor physical activity in a digital care support system which aims to reduce the risk of cardiovascular events.
The presented method, primarily based on the standard version of the Euclidean norm minus one algorithm (ENMO), is adjusted to account for off-the-shelf accelerometers with imprecise performances. Furthermore, the approach is individualized by estimating subject-dependent thresholds for activity intensity. The method is then validated on a referenced data set collected on healthy subjects.
After recapitulating the state of the art, the paper will describe in detail the experimental framework and the proposed algorithm in
Section 2. Results are summarized in
Section 3 and finally discussed in
Section 4, while a conclusion is given in
Section 5.
1.1. State of the Art
Physical activity is a wide concept which can be defined, according to the World Health Organization, as “any bodily movement produced by skeletal muscles that requires energy expenditure” [
8]. In our increasingly sedentary lives, it is important to make sure that a certain level of moderate to high level of physical activity is maintained to reduce risk for several diseases. The question of how physical activity shall be monitored has been studied for decades now, but recent studies can be divided into two main approaches:
Activity recognition (walking, running, sleeping, etc.)
Physical activity quantification (usually frequency, magnitude of effort or duration)
Note that activity recognition can also be used as part of quantification. Both approaches are currently studied and numerous methods were published amongst which, those based on raw accelerometer signals are of interest for this work. Therefore, studies using devices which directly provide activity counts or step counts as well as behavioural mapping and video observations are not within the scope of this paper. Such parameters are usually not directly comparable with each others. Here, we focus on methods that allow for device independence, since this leads to much more consistent results in a bring-your-own-device setting, which is important for interpretability by medical experts. For more information on these topics, we recommend consulting the detailed 2015 review from Fini et al. [
9].
1.1.1. Activity Recognition
Most of the recent methods are based on machine learning approaches which would ideally have the following general framework: (i) gather a significant amount of referenced data, e.g., accelerometer signals and type of activity performed while measuring, (ii) pre-processing of the signals, for instance by denoising, correlation testing, etc., (iii) extract features vectors from the collected signals, although some neural network-based methods directly use the signals instead, (iv) train a classifier based on the collected data, usually by creation and use of data subsets for training, test and validation and finally (v) validate it on a new and independent set of data.
For instance, Zeng et al. presented a k-means and Hidden Markov Model based method to recognize arm positions of a person holding a smartphone [
10]. Here, the use case was to remotely teach arm movements to a learner, where both teacher and learner, used reconstructed traces in space. The article reported positive results in recognizing different basic motions, yet this is not exactly what one could refer to as daily activity. However, in the continuation of this study, Burns et al. in 2018 published a proof of concept for the recognition of shoulder specific physiological exercises using machine learning and inertial signals from smartwatches [
11]. Among the different classifiers tested, a Convolutional Recurrent Neural Network provided the best performance. The study was performed on healthy subjects and, due to daily life a use case was restricted to rather simple exercises. It is for instance similar to what Lee et al. proposed [
12].
In that same perspective, Kyritsis et al. developed a smartwatch-based system able to classify gait types such as limping or walking with or without help, even including crutches and frames [
13]. Data from a three-axis accelerometer and three-axis gyroscope of the smartwatch were collected, processed and used to train multiple machine learning algorithms. The best algorithm (Light Gradient Boosting Machine) performed with an accuracy of 94.9%.
1.1.2. Physical Activity Quantification
Bailey et al. introduced a simple and efficient accelerometry-based methodology for the assessment activity of both arms [
14]. A sensor was placed on each upper limb of subjects and accelerometry was recorded while they were preforming specific tasks. After data collection, two variables of interest were computed: the Magnitude Ratio and the Bilateral Magnitude. The first one was a representation of the acceleration ratio between the two arms and the latter reflected the overall intensity of the activity performed with both arms. The same team applied this concept in a study involving non-disabled patients and stroke patients [
15].
Similar solutions to our method were proposed in past studies. Notably in [
16], the authors present a smartwatch-based system for real-time and online mobility monitoring. The tri-axial accelerometer data was used to compute a vector magnitude, the angle between the forearm and the horizontal line and some other simple spectral parameters. These parameters were then used to monitor the min spent in light, moderate or vigorous activity or even performing sedentary activities.
Introduced by van Hees et al. in 2013, the ENMO metric was recently used by Bakrania et al. for a comparison to the ActiGraph GT3X to monitor physical activity. The device is one of the major references in the field of physical activity monitoring [
17,
18]. The ENMO is a simple and straightforward tool to analyse physical activity via accelerometry without any filtering or complex computation. The study from Bakrania et al. emphasized that this metric, computed on hip and wrist accelerometers, could discriminate between sedentary behaviours and light activity.
As our final application will involve elderly and potentially impaired post stroke patients, it is reasonable to consider that any machine learning algorithm trained on healthy subjects may provide poor results. Furthermore, to the best of our knowledge, the large data sets, in the “Big Data” sense, specialized on disabled subjects and needed to train machine learning algorithms are seldom and difficult to obtain in the framework of feasibility studies. Here, a simpler approach is preferable which can be easily adapted to the use case of stroke patients and effortlessly implemented on a mobile system, such as smartwatches or smartphones.
However, the main flaw of the ENMO is its sensitivity to imprecisely calibrated sensors. Such sensors usually lead to biased measurements, which can be problematic with method requiring the subtraction of a fixed offset, as with ENMO and its hypothesis of a 1 g constant gravitational acceleration. To tackle this problem, van Hees et al. proposed a calibration method to be applied after data collection but before the ENMO computation [
19]. In fact, it was also used by Bakrania et al. in [
18]. The proposed method considers the acceleration signals when the sensors are close to immobility to estimate the error bias and gain on each axis. It also takes into consideration the local temperature during measurement to compensate for thermally induced errors. The efficiency of the algorithm is demonstrated in the article, however strong limitations remain, namely: (i) the necessity to have a certain amount of data (a 72 h long signal seems to be an important boundary in the approach) and (ii) the method reaches its full potential when temperature measurements are provided, which are not always available.
In that regard, we decided to base our method on a modified version of the ENMO metric, which we refer to as the Euclidean norm minus the estimated gravity (ENMEG) and which integrate a straightforward internal compensation for imprecise sensors.
2. Methods
2.1. Experiment and Data
The method was evaluated using a reference data set, previously acquired for the purpose of assessing new methods. Data collection was performed using a consumer smartwatch (Microsoft Band 2, Microsoft Corporation, Redmond, Washington, USA), a smartphone (Samsung Galaxy S7, Samsung, Schwalbach, Germany) and a custom app. The inertial measurement unit of the smartwatch was used to measure its acceleration, given in g unit and sampled at 30 Hz. The purpose of the app was to collect the data from the smartwatch via Bluetooth transfer and to store them locally. Thirteen healthy and voluntary subjects were recruited to participate in the experiment. The four females and nine males (aged between 24 and 33) were asked to wear the smartwatch and to perform specific activities: rest on a chair, work at a desk, walk and run (both in a park). Each activity was asked to last for approximately 20 min. To help with later labelling of the signals, they were asked to perform a succession of 3 brief strikes with their wrist. The produced peaks were then selected as reference boundaries for each activity segment.
2.2. Algorithm
The regular ENMO, as its name indicates, is the Euclidean norm of the accelerometer data minus gravitational acceleration. The latter equals 1 g for signals measured in
g unit. For reliability purposes, accelerometers must first be calibrated to avoid an inaccurate internal approximation for the gravitational acceleration in the devices. In our case, the off-the-shelf smartwatches turned out to be imprecisely calibrated. To compensate for this, the gravitational acceleration was instead approximated by (i) low-pass filtering the Euclidean norm (Chebyshev type I IIR filter, third order,
Hz) and (ii) computing the median of the filtered signal values which were between
and
as the smartwatch approximation of the gravitational acceleration value is expected to be close to 1.
Figure 1 illustrates this method. The low-pass filtering step of this method was inspired by multiple previous studies, which showed notably good results [
20,
21].
The ENMEG,
, was then computed on the raw accelerometer data by calculating the Euclidean norm and by subtracting the previously estimated constant:
where
,
and
denote the
values of the acceleration vector along axis x, y and z and
the estimated gravitational acceleration. Negative values of
were set to 0.
It was observed that its dynamic was too fast for our application. To be meaningful, we defined that a physical activity of interest should be evaluated over the course of a timespan. Therefore, for smoothing purposes, a moving average was computed on a one-minute sliding window as:
with
in our case, which corresponds to 1 min sampled at 30 Hz. The sliding window size was decreased at the edges, where there were not enough samples to fill it. The sliding window length was empirically selected by considering that 1 min was enough to smooth brief and intense motions which should not be considered as intense activity (e.g., picking up a distant object, stretching while working, etc.), but also to preserve high frequency content.
Finally, three thresholds were applied to discriminate between the timestamps spent in four different categories of activity, as summarized in
Table 1.
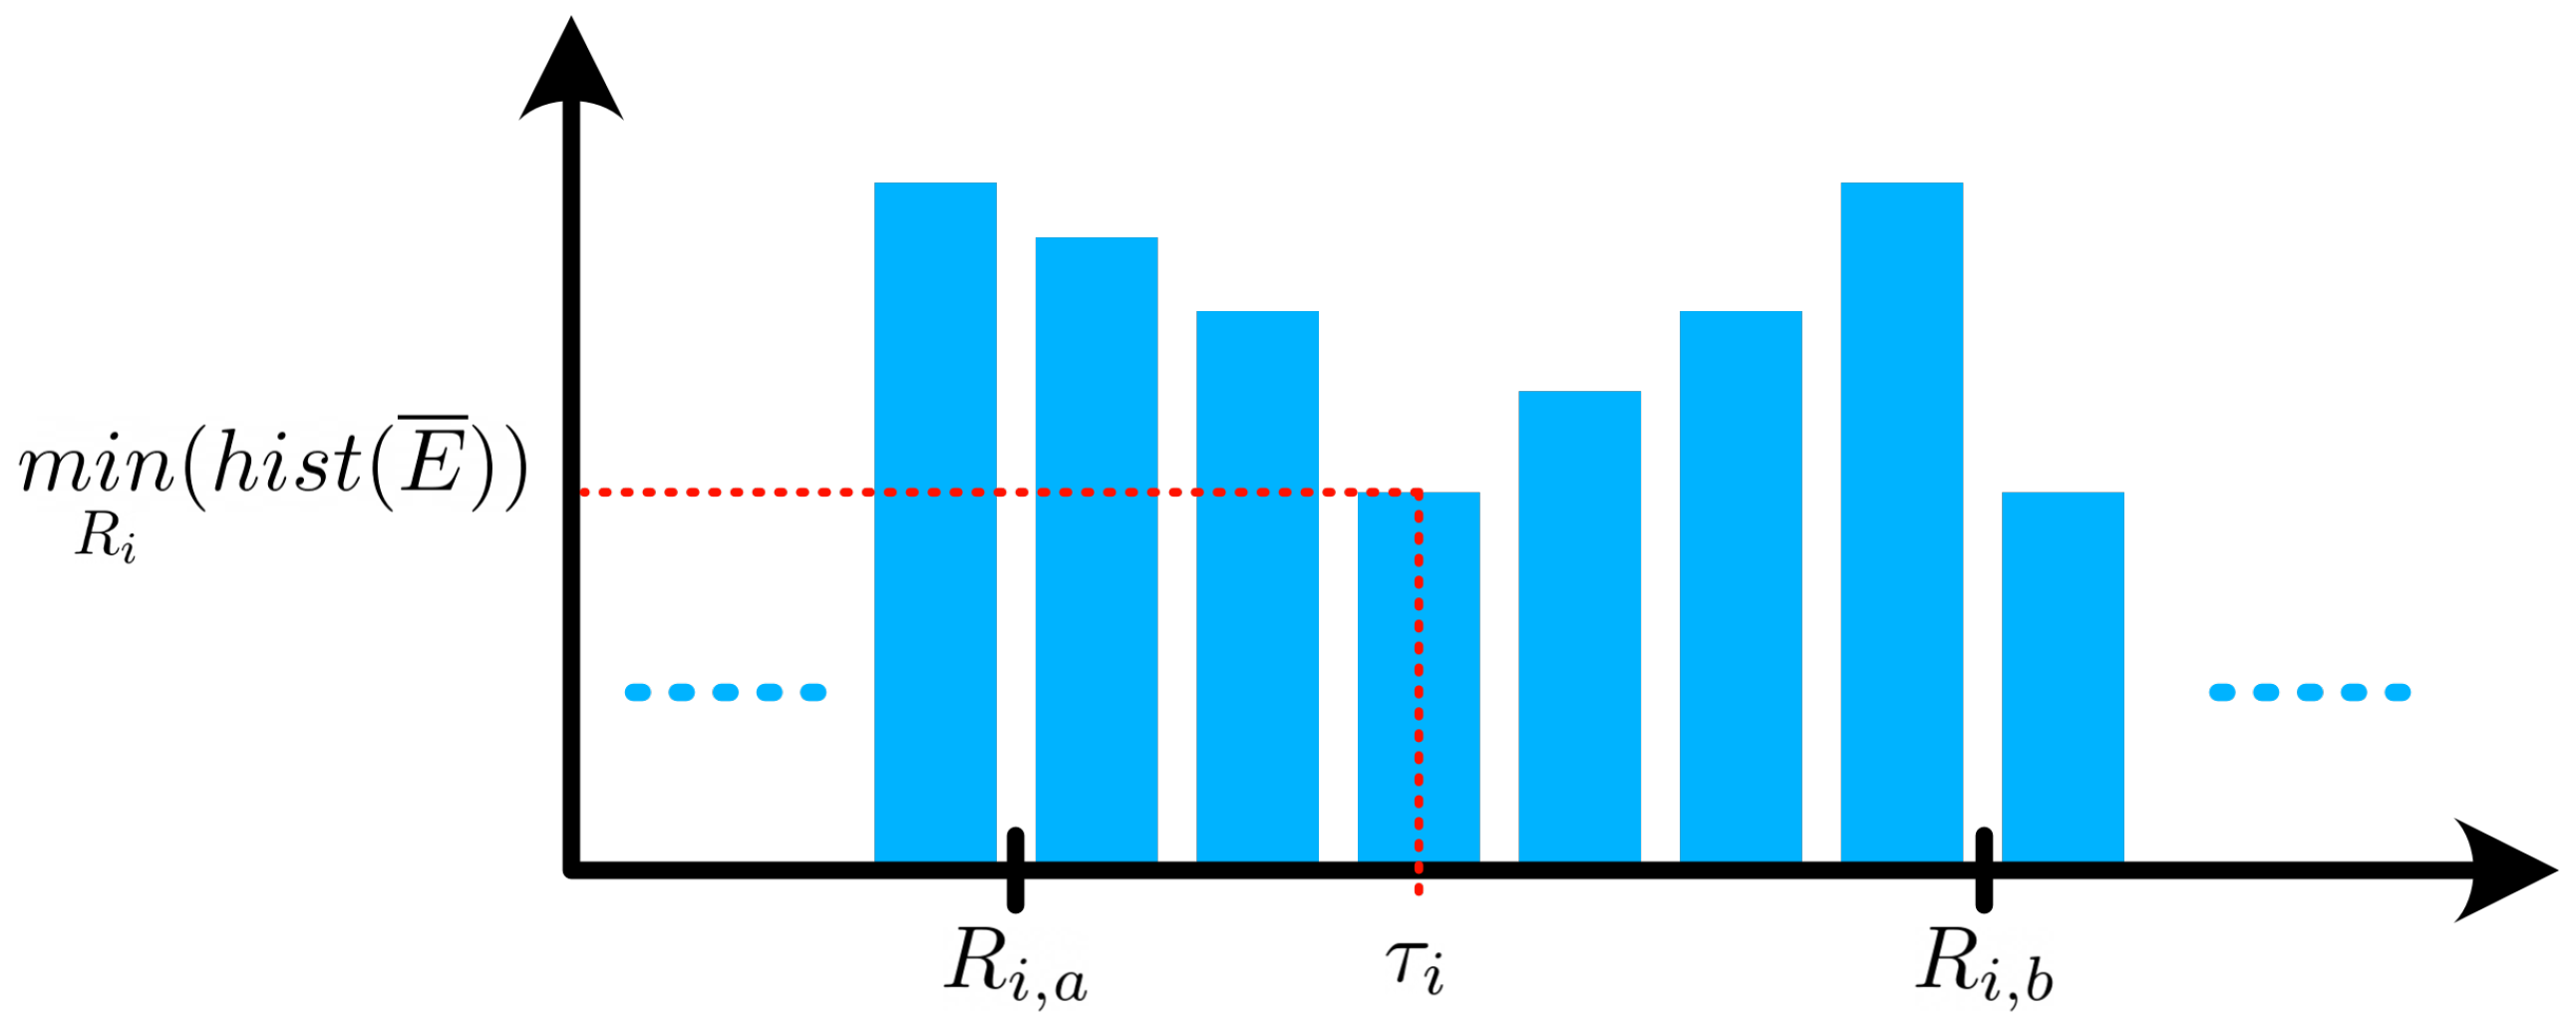
It is foreseen that the thresholds values are different for each individual. To personalize the method to each subject’s abilities, the thresholds were individually estimated by computing the histogram of
and by looking for the minimum value within certain ranges of magnitude, as illustrated in
Figure 2.
These ranges for individual threshold estimation were defined by the spread of valleys between each peak of activity type on the aggregated histogram of all time series across subjects. These ranges are summarized in
Table 2.
The activity categories and their interpretations can be developed as follows:
Rest: Laying in bed, watching TV, etc. (occasional and low amplitude movements)
Low intensity: Working at a desk, cooking, playing a video game, etc. (low amplitude and slow movements)
Moderate intensity: Walking, riding a bike, cleaning, stretching, etc. (moderate to high amplitude but slow movements)
High intensity: Running, intensive sport, etc. (moderate to high amplitude but rather fast movemens).
3. Results
Of the 13 subjects, two were excluded from the analysis since activities were not reported with sufficient accuracy. Finally, after cropping to the desired timestamps, the collected data set contained usable recordings for a total duration of approximately 35 h.
Figure 3 illustrates, as an example, the computed time series
for subject 3 and the estimated thresholds.
For each subject
s, the error assessment
was performed by comparing the reference total time spent in each activity type
and the corresponding detected time
. A coefficient of variation (
) is also computed per subject using the following equation:
with the duration of the measurement
in min. This metric provides the global error ratio with respect to the total duration of the measurement in percent.
From the Rest and Low intensity columns of
Table 3, one can observe that the algorithm had difficulties with very low amplitude motions since both intensities have similar ENMEG values. However, if amplitudes are similar, the dynamic ranges are different as resting usually means close to no motion at all. To improve the results, a moving standard deviation of
was computed over a 1 min sliding window, this signal will be noted
. An empirically defined threshold was then applied, which value was
g. Finally, to be fully considered as Rest, a timestamp must have a corresponding
and
. The new results are presented in
Table 4.
The overall accuracy is improved as the average
decreased from 16.2% to 10.6%. However, significantly more reliable results were achieved by merging the two lowest intensity activity types, as illustrated in
Table 5 the average
dropped to 3.7%.
4. Discussion
The first novelty of the method lies in the gravity acceleration estimation step which replaced the straightforward subtraction of 1g usually applied with the ENMO algorithm. It is illustrated in
Figure 3 where the standard version of the ENMO overestimates the activity intensity during the second Rest phase. To maintain this paper conciseness, the complete original method results were not presented but it was nonetheless assessed and produced an average
of 93%. This is mainly due to the imprecise calibration of the consumer accelerometers which leads to a gravity acceleration value slightly different from 1g. The addition of our gravity acceleration estimation method proved to drastically improve the results by decreasing the average
to 16.2%.
Table 3 demonstrates that the method had difficulties with the discrimination of Rest and Low intensity activity. This was expected as in both cases the acceleration magnitudes are similarly small, with very tenuous difference between desk work and resting on a chair. This is in line with the conclusion of Bakrania et al. [
18].
However, we have implemented a workaround to improve the Rest vs Low intensity discrimination. Averaged levels of activity are similar but their dynamics differ. Therefore, the proposed step, based on an information fusion between the ENMEG detection and a sliding standard deviation detection, helped by decreasing the average
to 10.6%, as illustrated in
Table 4.
Finally, merging both intensities improved the results further by producing an average of 3.7%. This is possible under the reasonable hypothesis that there are no drastic metabolic differences between Resting and Low intensity activities.
Analysing
Table 4, one can observe that subject 4 results are significantly worse than the others. During the experiment the subject had to deviate from the planned tasks and climbed stairs. Therefore, during approximately 10 min, subject 4 was not resting but the motion intensity of their arms did not correlate with the intensity of the activity. Hence, despite being labeled as moderate activity, the algorithm detected this part as low intensity activity. The same flaw was observed for physical activities where the arms did not have large amplitudes of motion, e.g., riding a bike. This limitation is directly linked to the locational placement of the sensor on the body. Here, the detectability of activities is tightly bound to arm movements.
Close examination of
Table 3 and
Table 4 will reveal that although the overall performance of the method is improved, for some subjects (4, 7 and 9) it decreases, notably for Rest and Low intensities. This phenomenon can be explained by visually inspecting the signals where it is observable that some of the labelled segments did not exactly correspond to the instructions. This is a limitation of experiments performed in an uncontrolled environment. Nonetheless, we decided to include those subjects in the study anyway as these divergences were minimal and were later negated by the last step of the method.
The main weakness of the study is the data set size, as 11 subjects are not enough to draw conclusion on efficiency or precision. Although it is more prone to biases, it is enough to demonstrate a proof of concept. However, as in many studies in the field of human activity recognition or quantification, the data set used to develop the method was collected on healthy subjects. Its performances are expected to be slightly decreased when applied to aged and/or impaired subjects, as described in [
22]. However, Straiton et al. showed that simple metrics as duration of activities are more robust than others like steps counting and it is expected that the adaptive thresholds will help in personalizing the method to each subject [
23].
The efficiency of the method relies on the assumption that the subject experienced sufficient amount of all activities such that the thresholds to can be correctly estimated. If this requirement is not fulfilled, the activity duration might be over- or underestimated. To mitigate this issue, default values could be proposed in the case of insufficient number of samples of a specific activity. In the context of a longitudinal study, the thresholds could be estimated during an initialization phase of the study, with specific activities asked to be performed by the subject. Another solution would be that the thresholds value would have to be reevaluated at different stages as the study continues. This would each time allow for an increase in the number of samples considered for the histogram computation, hence reducing the uncertainties.
5. Conclusions
The present paper introduces a variation of the standard Euclidean norm minus one method for the assessment of physical activity intensity and duration based on accelerometry. The proposed approach relies on a modification of the gravitational acceleration value hypothesis, which was originally considered as equal to 1 g. We introduced a comprehensible gravity acceleration amplitude estimation method, that allows to improve the robustness of the method in case of imprecise accelerometers calibration, as it can be the case for consumer smartwatch sensors. Furthermore, a data-driven personalization of the method is allowed by the estimation of subject-dependent thresholds for the different levels of activity intensity.
The proposed method was assessed on a test data set collected on healthy subjects wearing a smartwatch and who were asked to perform specific activities.The study showed that the method was able to discriminate between Low, Moderate and High intensity activities. It proved to work on relatively low sampled wrist acceleration data provided by a consumer sensor, and with a limited number of computations, making it ideal for mobile application with off-the-shelf sensors such as smartwatches.
This paper presents the preliminary tests and the validation of a proof of concept for a physical activity quantification algorithm. Although the results are not directly generalizable to patients, the algorithm has been designed with high variance of individual capabilities in mind. Later it will be integrated in a larger project involving real life data from post-stroke patients [
24]. In this later project, the patients will wear commercially available smartwatches to daily monitor how much time they have spent doing activities of different intensities. This method will be adapted and implemented within our larger experimental framework and its efficiency will be assessed on potentially elderly and impaired post-stroke patients. It will be used as part of the assessment of daily physical activity but also to check the intensity of activities performed before ECG and blood pressure measurements. Finally, the method will be used during the study as one of the indicators for patients’ health status improvement or deterioration. Physical activity intensities will be assessed in regard of other risk factors such as impairment, medication intake or depression. In this context, the physical activity intensity feedback is not intended for the patients, but for the medical experts. Indeed, all of these factors may have an effect on the patients’ will to perform physical activity, and vice versa.
Author Contributions
Conceptualization, J.-B.T. and G.I.; methodology, J.-B.T.; software, J.-B.T.; validation, J.-B.T. and G.I.; formal analysis, J.-B.T.; investigation, J.-B.T.; resources, G.I.; data curation, J.-B.T. and M.S.; writing—original draft preparation, J.-B.T.; writing—review and editing, J.-B.T., M.S., D.M., J.C. and G.I.; visualization, J.-B.T.; supervision, G.I.; project administration, G.I.; funding acquisition, D.M.; J.C. and G.I. All authors have read and agreed to the published version of the manuscript.
Funding
Parts of the study are funded by the state government of Saxony (directive eHealthSax, project “PostStroke Manager”, grant no. 100334901). This publication was partially funded by the Open Access Publishing Fund of Leipzig University, supported by the German Research Foundation within the program Open Access Publication Funding.
Institutional Review Board Statement
The experiment was approved by the ethics committee at the medical faculty of Leipzig University and was carried out in compliance with the Declaration of Helsinki (ID: 990101-111).
Informed Consent Statement
Informed consent was obtained from all subjects involved in the study.
Data Availability Statement
The dataset used for this paper is available upon request.
Acknowledgments
The authors would like to thank Katrin Rothmaler for the conception and the data collection of the data set. They would also like to thank Till Handel for the integration of the devices and the acquirement software development.
Conflicts of Interest
The authors declare no conflict of interest.
References
- Timmis, A.; Vardas, P.; Townsend, N.; Torbica, A.; Katus, H.; De Smedt, D.; Gale, C.P.; Maggioni, A.P.; Petersen, S.E.; Huculeci, R.; et al. European Society of Cardiology: Cardiovascular Disease Statistics 2021. Eur. Heart J. 2022, 43, 716–799. [Google Scholar] [CrossRef] [PubMed]
- Wajngarten, M.; Silva, G.S. Hypertension and Stroke: Update on Treatment. Eur. Cardiol. Rev. 2019, 14, 111–115. [Google Scholar] [CrossRef] [PubMed] [Green Version]
- Stergiou, G.S.; Palatini, P.; Parati, G.; O’Brien, E.; Januszewicz, A.; Lurbe, E.; Persu, A.; Mancia, G.; Kreutz, R. 2021 European Society of Hypertension Practice Guidelines for Office and Out-of-Office Blood Pressure Measurement. J. Hypertens. 2021, 39, 1293–1302. [Google Scholar] [CrossRef]
- Morovatdar, N.; Di Napoli, M.; Stranges, S.; Thrift, A.G.; Kapral, M.; Behrouz, R.; Farzadfard, M.T.; Andalibi, M.S.S.; Oskooie, R.R.; Sawant, A.; et al. Regular Physical Activity Postpones Age of Occurrence of First-Ever Stroke and Improves Long-Term Outcomes. Neurol. Sci. 2021, 42, 3203–3210. [Google Scholar] [CrossRef]
- Kramer, S.F.; Hung, S.H.; Brodtmann, A. The Impact of Physical Activity Before and After Stroke on Stroke Risk and Recovery: A Narrative Review. Curr. Neurol. Neurosci. Rep. 2019, 19, 28. [Google Scholar] [CrossRef] [PubMed]
- Fiuza-Luces, C.; Santos-Lozano, A.; Joyner, M.; Carrera-Bastos, P.; Picazo, O.; Zugaza, J.L.; Izquierdo, M.; Ruilope, L.M.; Lucia, A. Exercise Benefits in Cardiovascular Disease: Beyond Attenuation of Traditional Risk Factors. Nat. Rev. Cardiol. 2018, 15, 731–743. [Google Scholar] [CrossRef]
- Zhou, X.; Du, M.; Zhou, L. Use of Mobile Applications in Post-Stroke Rehabilitation: A Systematic Review. Top. Stroke Rehabil. 2018, 25, 489–499. [Google Scholar] [CrossRef]
- WHO. Physical Activity Fact Sheet; Technical Report; WHO: Genewa, Switzerland, 2021. [Google Scholar]
- Fini, N.A.; Holland, A.E.; Keating, J.; Simek, J.; Bernhardt, J. How Is Physical Activity Monitored in People Following Stroke? Disabil. Rehabil. 2015, 37, 1717–1731. [Google Scholar] [CrossRef]
- Zeng, H.; Hu, Y.; Fan, J.; Hu, H.; Gao, Z.; Fang, Q. Arm Motion Recognition and Exercise Coaching System for Remote Interaction. Mob. Inf. Syst. 2016, 2016, 1–14. [Google Scholar] [CrossRef] [Green Version]
- Burns, D.M.; Leung, N.; Hardisty, M.; Whyne, C.M.; Henry, P.; McLachlin, S. Shoulder Physiotherapy Exercise Recognition: Machine Learning the Inertial Signals from a Smartwatch. Physiol. Meas. 2018, 39, 075007. [Google Scholar] [CrossRef] [Green Version]
- Lee, G.; Kang, B.; Nho, K.; Sohn, K.A.; Kim, D. MildInt: Deep Learning-Based Multimodal Longitudinal Data Integration Framework. Front. Genet. 2019, 10, 617. [Google Scholar] [CrossRef] [PubMed]
- Kyritsis, A.I.; Willems, G.; Deriaz, M.; Konstantas, D. Gait Pattern Recognition Using a Smartwatch Assisting Postoperative Physiotherapy. Int. J. Semant. Comput. 2019, 13, 245–257. [Google Scholar] [CrossRef]
- Bailey, R.R.; Klaesner, J.W.; Lang, C.E. An Accelerometry-Based Methodology for Assessment of Real-World Bilateral Upper Extremity Activity. PLoS ONE 2014, 9, e103135. [Google Scholar] [CrossRef] [PubMed] [Green Version]
- Bailey, R.R.; Klaesner, J.W.; Lang, C.E. Quantifying Real-World Upper-Limb Activity in Nondisabled Adults and Adults With Chronic Stroke. Neurorehabilit. Neural Repair 2015, 29, 969–978. [Google Scholar] [CrossRef] [PubMed] [Green Version]
- Kheirkhahan, M.; Nair, S.; Davoudi, A.; Rashidi, P.; Wanigatunga, A.A.; Corbett, D.B.; Mendoza, T.; Manini, T.M.; Ranka, S. A Smartwatch-Based Framework for Real-Time and Online Assessment and Mobility Monitoring. J. Biomed. Inform. 2019, 89, 29–40. [Google Scholar] [CrossRef] [PubMed]
- van Hees, V.T.; Gorzelniak, L.; Dean León, E.C.; Eder, M.; Pias, M.; Taherian, S.; Ekelund, U.; Renström, F.; Franks, P.W.; Horsch, A.; et al. Separating Movement and Gravity Components in an Acceleration Signal and Implications for the Assessment of Human Daily Physical Activity. PLoS ONE 2013, 8, e61691. [Google Scholar] [CrossRef] [PubMed] [Green Version]
- Bakrania, K.; Yates, T.; Rowlands, A.V.; Esliger, D.W.; Bunnewell, S.; Sanders, J.; Davies, M.; Khunti, K.; Edwardson, C.L. Intensity Thresholds on Raw Acceleration Data: Euclidean Norm Minus One (ENMO) and Mean Amplitude Deviation (MAD) Approaches. PLoS ONE 2016, 11, e0164045. [Google Scholar] [CrossRef] [Green Version]
- van Hees, V.T.; Fang, Z.; Langford, J.; Assah, F.; Mohammad, A.; da Silva, I.C.M.; Trenell, M.I.; White, T.; Wareham, N.J.; Brage, S. Autocalibration of Accelerometer Data for Free-Living Physical Activity Assessment Using Local Gravity and Temperature: An Evaluation on Four Continents. J. Appl. Physiol. 2014, 117, 738–744. [Google Scholar] [CrossRef] [Green Version]
- Bourke, A.K.; O’Donovan, K.; Clifford, A.; Olaighin, G.; Nelson, J. Optimum Gravity Vector and Vertical Acceleration Estimation Using a Tri-Axial Accelerometer for Falls and Normal Activities. In Proceedings of the 2011 Annual International Conference of the IEEE Engineering in Medicine and Biology Society, Boston, MA, USA, 30 August–3 September 2011; pp. 7896–7899. [Google Scholar] [CrossRef]
- Bayat, A.; Pomplun, M.; Tran, D.A. A Study on Human Activity Recognition Using Accelerometer Data from Smartphones. Procedia Comput. Sci. 2014, 34, 450–457. [Google Scholar] [CrossRef] [Green Version]
- Floegel, T.A.; Florez-Pregonero, A.; Hekler, E.B.; Buman, M.P. Validation of Consumer-Based Hip and Wrist Activity Monitors in Older Adults With Varied Ambulatory Abilities. J. Gerontol. Ser. A Biol. Sci. Med. Sci. 2017, 72, 229–236. [Google Scholar] [CrossRef] [Green Version]
- Straiton, N.; Alharbi, M.; Bauman, A.; Neubeck, L.; Gullick, J.; Bhindi, R.; Gallagher, R. The Validity and Reliability of Consumer-Grade Activity Trackers in Older, Community-Dwelling Adults: A Systematic Review. Maturitas 2018, 112, 85–93. [Google Scholar] [CrossRef] [PubMed] [Green Version]
- Michalski, D.; Prost, A.; Handel, T.; Schreiber, M.; Tylcz, J.B.; Geisler, D.; Urban, D.; Schramm, S.; Lippmann, S.; Gullnick, J.; et al. The PostStroke-Manager—Combining Mobile, Digital and Sensor-Based Technology with Personal Assistance: Protocol of the Feasibility Study. Neurol. Res. Pract. 2021, 3, 53. [Google Scholar] [CrossRef] [PubMed]
| Disclaimer/Publisher’s Note: The statements, opinions and data contained in all publications are solely those of the individual author(s) and contributor(s) and not of MDPI and/or the editor(s). MDPI and/or the editor(s) disclaim responsibility for any injury to people or property resulting from any ideas, methods, instructions or products referred to in the content. |
© 2023 by the authors. Licensee MDPI, Basel, Switzerland. This article is an open access article distributed under the terms and conditions of the Creative Commons Attribution (CC BY) license (https://creativecommons.org/licenses/by/4.0/).


 ,
, 

