1. Introduction
In the field of surface roughness, roughness parameters are used to evaluate the surface roughness [
1,
2]. From the roughness profile, roughness parameters are calculated. The roughness profile is calculated from the primary profile (measurement data) and the mean line (shape and waviness component). Then, applying the low-pass filter to the primary profile, the mean line is obtained. In addition, subtracting the mean line from the primary profile, the roughness profile is obtained. The Gaussian filter (GF, ISO 16610-21 [
3] and JIS B 0634 [
4]) and spline filter (SF, ISO 16610-22 [
5,
6]) are used as one of the standard low-pass filters. However, when these filters apply to the primary profile that includes outliers such as spikes, the waviness and shape components cannot be extracted accurately. To solve this problem, a robust filter that extracts the mean line without the effect of the outlier is proposed. The standard for robust Gaussian filter, ISO 16610-31: Robust profile filters: Gaussian regression filters (GRF) [
7,
8,
9,
10], was established and published in 2016. However, ISO/TS 16610-32 [
11], a robust spline filter (RSF) standard in the technical specifications stage, has a serious deficiency. Therefore, it was withdrawn in 2015.
ISO 16610-31, which was an already established standard, has problems. It only shows the method and a few examples, such as normal roughness and spike. Therefore, the known characteristics of this filter are insufficient. Moreover, the data of robustness to spike showed as a robustness example does not include the roughness component in the primary profile. In roughness measurement, the roughness component is always included. The presence or absence of the roughness component may change the characteristics of the filter. If the characteristics are different, the no roughness component case information is useless; on the contrary, it will only cause confusion in the measurement sites.
ISO 16610-30 [
12] is the robust filter basic concept standard. ISO 16610-30 shows spikes, steps, and slopes as outlier examples: the robust filters should behave robustly to these outliers. However, ISO 16610-31, a robust filter standard, can only behave robustly to the spikes and cannot behave robustly to steps and slopes [
13]. The specifications required in the robust filter basic concept standard are not satisfied in the actual robust filter standard, resulting in inconsistencies between standards. Therefore, ISO 16610-31 needs to update the standard.
In this way, a filter that cannot satisfy the specifications required by the basic concept standard may be established as a standard. Therefore, additional validation and clarification of the characteristics of the filters that have already been proposed are important for the establishment of standards while also avoiding confusion in filter selection at the measurement sites [
13,
14,
15].
Therefore, this paper clarifies the characteristics of the SF-based robust filters, summarizes the points to be considered when using RSF, and identifies the criteria for RSF selection.
2. Target Filters
Currently, no robust SF-based filter is established in ISO because ISO/TS 16610-32 was rejected in the Technical Specifications stage. Furthermore, the new ISO 16610-32 was being redeveloped from the first stage, and its filter specifications are not yet provided. Due to these circumstances, the filter specifications of the new ISO 16610-32 are unknown. Therefore, these filters are not verified in this paper.
The RSFs that are verified in this paper are the L2-norm type regression RSF proposed by Goto et al. [
16] (hereinafter referred to as RL2-RSF: Regression-type L2-norm Robust Spline Filter) and a re-quantization type RSF using the fast M-estimation method proposed by Kondo et al. [
17] (hereinafter referred to as FMSF: Fast M-estimation Spline Filter).
The RL2-RSF filter has periodic and aperiodic types as a normal SF and calculates the solution of an inverse matrix similar to that of a normal SF. The RL2-RSF realizes robustness by regression calculation which changes weights based on the deviation between the primary profile and the mean line of each repetition, the same as ISO 16610-31. In the RL2-RSF, weights are defined by:
where
zk is the input value,
is the output value in the
m-th iteration step,
σ is the standard deviation of residuals
zk −
, and
c is the parameter that should be set at the appropriate constant value depending on target data characteristics. The RL2-RSF continues the regression calculation until the median deviation between the primary profile and the mean line of each repetition is below the set repetition threshold. Therefore, the results of RL2-RSF vary depending on the value of the repetition threshold.
The FMSF is the re-quantization type RSF using the fast M-estimation method [
18,
19]. The re-quantization type filter executes convolution with the primary profile and the weight function. For example, the FMSF uses the following weight function.
where
λc is the cutoff wavelength. The FMSF uses the characteristics of the fast M-estimation method to realize robustness only to outliers. When outliers are not included in the primary profile, the output of the FMSF is equal to the output of the normal SF with high accuracy. This characteristic is rare in robust filters. The FMSF uses a convolution method, unlike normal SF, because of using the fast M-estimation method. The convolution method causes the end-effect problem at both ends of the data [
20]. However, the FMSF solves the end effect problem by using point symmetric expansion with the calculated optimal reference point [
21]. Furthermore, the filter width is equivalent to infinity in calculating the solution of the inverse matrix, such as normal SF; however, because the filter width is finite in the convolutional method such as FMSF, deviation due to the filter width occurs. However, FMSF realizes a characteristic that matches the output of normal SF with high precision when no outlier is included by changing the filter width of the FMSF to be wider than the
λc used in the normal convolution method.
The calculation method of the FMSF is unique compared to other robust filters. Therefore, the calculation method of the FMSF is shown below. First, create the 2-dimensional array (measurement x-direction and height z-direction). Second, re-quantize in the height z-direction and vote the weight to the cell corresponding to the height value. Then, the convolution calculation is executed along the measurement x-direction using the voted weights and the weight function of SF. Subsequently, in each x-coordinate, in the z-direction, a 2nd-order B-spline basis function is applied to the weight, and the FMSF outputs the z-coordinate value with the maximum weight. When voting the weights and the output process, using linear interpolation, re-quantization error is prevented. Note that when calculating via the least-squares method in each x-coordinate after the convolution calculation of the voted weights and weight function of the SF, the output is equal to normal SF. The 2nd-order B-spline basis function used in the loss function of FMSF has characteristics that the range of basic widths near the center is equal to the quadratic function. In addition, this 2nd-order B-spline basis function has the characteristic that when the weight exists further away from the basic width, the weights converge to 0. Therefore, the weight of spikes does not exist inside the basic width. The FMSF realizes robustness. On the other hand, when there are no spikes, the weight of non-outlier data exists only within the range of the basic width, and the mean line of the FMSF is equal to that of the SF. Thus, FMSF realizes compatibility with SF when outliers are not included.
3. Experiments
In this section, the characteristics of each filter are verified using the primary profiles that include spikes and components with various shapes. The primary profiles to be verified in this paper are as follows. First, normal roughness surfaces are verified. Next, the spike typical outlier is verified. Further, the general geometric shape components are verified: the rectangular wave (Step, one of the outliers. Typical examples: semiconductors and calibration standards) and the arc (Typical examples: lenses and shafts).
3.1. Verifying the Characteristics of Each Filter to Normal Roughness Surface
First, the characteristic of the normal roughness of each filter is verified.
Figure 1a shows the primary profile measured for the machining surface and the mean line calculated using each filter.
Figure 1b shows the deviation between the mean line calculated using SF and the mean line calculated using each filter.
Figure 1b shows that the mean lines calculated using SF and FMSF are equal (green line). In contrast, the mean lines calculated using SF and RL2-RSF are different, confirming that these filters are incompatible (red-dashed line). When offsets were added, no particular change was observed because these filters have no end effect.
Compare the Ra (the arithmetical mean deviation of the roughness profile [
2]) of each filter. Ra is calculated by averaging the absolute height values of the roughness profile.
where
z(
x) is the roughness profile,
le is the evaluation length.
Ra of SF and FMSF are equal at 0.5029 μm; however, that of RL2-RSF is 0.5024 μm (for reference, Pa of the primary profile is 0.5652 μm).
The height of the spike to be added in the later verification is set as a multiple of the reference value, using the value of the maximum height of the roughness profile at this time as the reference value. When the deviation between the value of spikes and the value of normal roughness is small, there arises a dilemma of whether it should be judged as a spike or a normal roughness component. Therefore, the height of a spike would start at twice the reference value. On the other hand, the width of a spike or step is based on the cut-off wavelength λc (0.8 mm).
3.2. Verifying the Characteristics of Each Filter When Spikes Are Included in the Primary Profile
In this section, the characteristics of each filter to spike that is the most major outlier are verified. The spikes are caused by speckles or fine dust.
The spikes are added to the primary profile in
Figure 1 for verification.
Figure 2 shows the primary profile after the addition of spikes with four different heights and the mean line calculated using each filter; the heights of the spikes, from left to right, are two, three, five, and ten times that of the reference value. The width of the spikes is set to 0.02
λc.
Figure 3 shows the deviation between the mean line in
Figure 1 (before the addition of the spike) and the mean line in
Figure 2 (after the addition of the spike).
Figure 2 and
Figure 3 shows that the mean line calculated using SF is affected by the spikes, and the effect depends on the height of the spikes. The region between the spikes is also affected in the direction opposite to the spikes, and the influence of the spikes can be observed throughout. In contrast, the mean lines calculated using RL2-RSF and FMSF are less affected by the spikes. Comparing the size of the deviation from
Figure 3, the deviation of RL2-RSF is lower when the height of the spike is low, whereas that of FMSF is lower when the height of the spike is high. This is because the 2nd-order B-spline basis function used in FMSF can eliminate the effect of high-height spikes. However, low-height spikes cannot be eliminated entirely, and some marginal effect occurs.
On the other hand, the RL2-RSF changes the weights according to the deviation between the mean line and the primary profile; however, the first mean line is affected by the spikes same as the mean line calculated using SF. Therefore, the effect of spikes decreases with each repetition of the calculation. However, if the first mean line is highly affected by the spike, the effect of the spike cannot be eliminated even if the number of repetitions is increased, which is why this result was shown.
The roughness parameter Ra of SF is 0.9339 μm, RL2-RSF is 0.7576 μm, and FMSF is 0.7583 μm (For reference, Pa of the primary profile is 0.8258 μm). Compared with Ra before the spike was added, all filters significantly increased. Even if the mean line is calculated without the effect of the spike, the roughness profile will still be affected by the spike because the roughness profile is the subtraction of the primary profile and the mean line [
22]. To properly evaluate the roughness without the effect of a spike, only the range of spikes from the roughness profile calculated by the robust filter is removed [
22]. Calculating Ra excluding the range of spikes, SF is 0.6917 μm, RL2-RSF is 0.4954 μm, and FMSF is 0.4961 μm. When compared with Ra before the addition of the spike, the Ra of SF increased by approximately 37.6%. In comparison, RL2-RSF and FMSF remained within an increase of less than 1.5%, confirming that both these RSFs can be evaluated properly when spikes are included in the primary profile.
From these results, it can be said that the RL2-RSF and FMSF can derive a mean line that excludes the effect of spikes that are more than twice the height of the normal roughness component to a practical use level.
3.3. Verifying the Characteristics of Each Filter When the Step (Rectangular Wave) Is Included in the Primary Profile
This section verifies the characteristics of each filter to step (rectangular wave). Steps are commonly found in semiconductors and standard specimens. The step is a shape component; however, in ISO 16610-30, the step is classified as an outlier. If the width of the spike is wide, it becomes a step. The results of calculating the ideal mean line are different; in the case of the spike, the effect should be removed, whereas for the step, it should be extracted as a shape component. In this paper, anything difficult to judge as a spike or a step is labeled as an outlier. The width boundary between the spike and step is not defined; however, the width of the boundary for each filter, whether it is removed as a spike or extracted as a step, is also verified.
Figure 4 is the primary profile with three different widths of step added to
Figure 1, and the mean line is calculated using each filter. The height of the steps is unified, and the width of the steps are 0.1
λc, 0.5
λc, and 1
λc, from left to right. From
Figure 4, for a width of 0.1
λc outlier, the mean line of RL2-RSF and FMSF is calculated without the effect of it as a spike. On the other hand, for a width of 0.5
λc outlier, RL2-RSF calculated the mean line without the effect of it as a spike; however, FMSF was extracted as the step. For a width of 1
λc outlier, both RSFs try to extract the shape component as a step. The FMSF extracts the shape components without blunting the step boundary area. On the other hand, the output of RL2-RSF has no overshoot compared to the output of SF; however, near the step boundary area is blunter than SF.
It is verified with a wider step whether the RL2-RSF can extract the step shape component if the width of the step is wider.
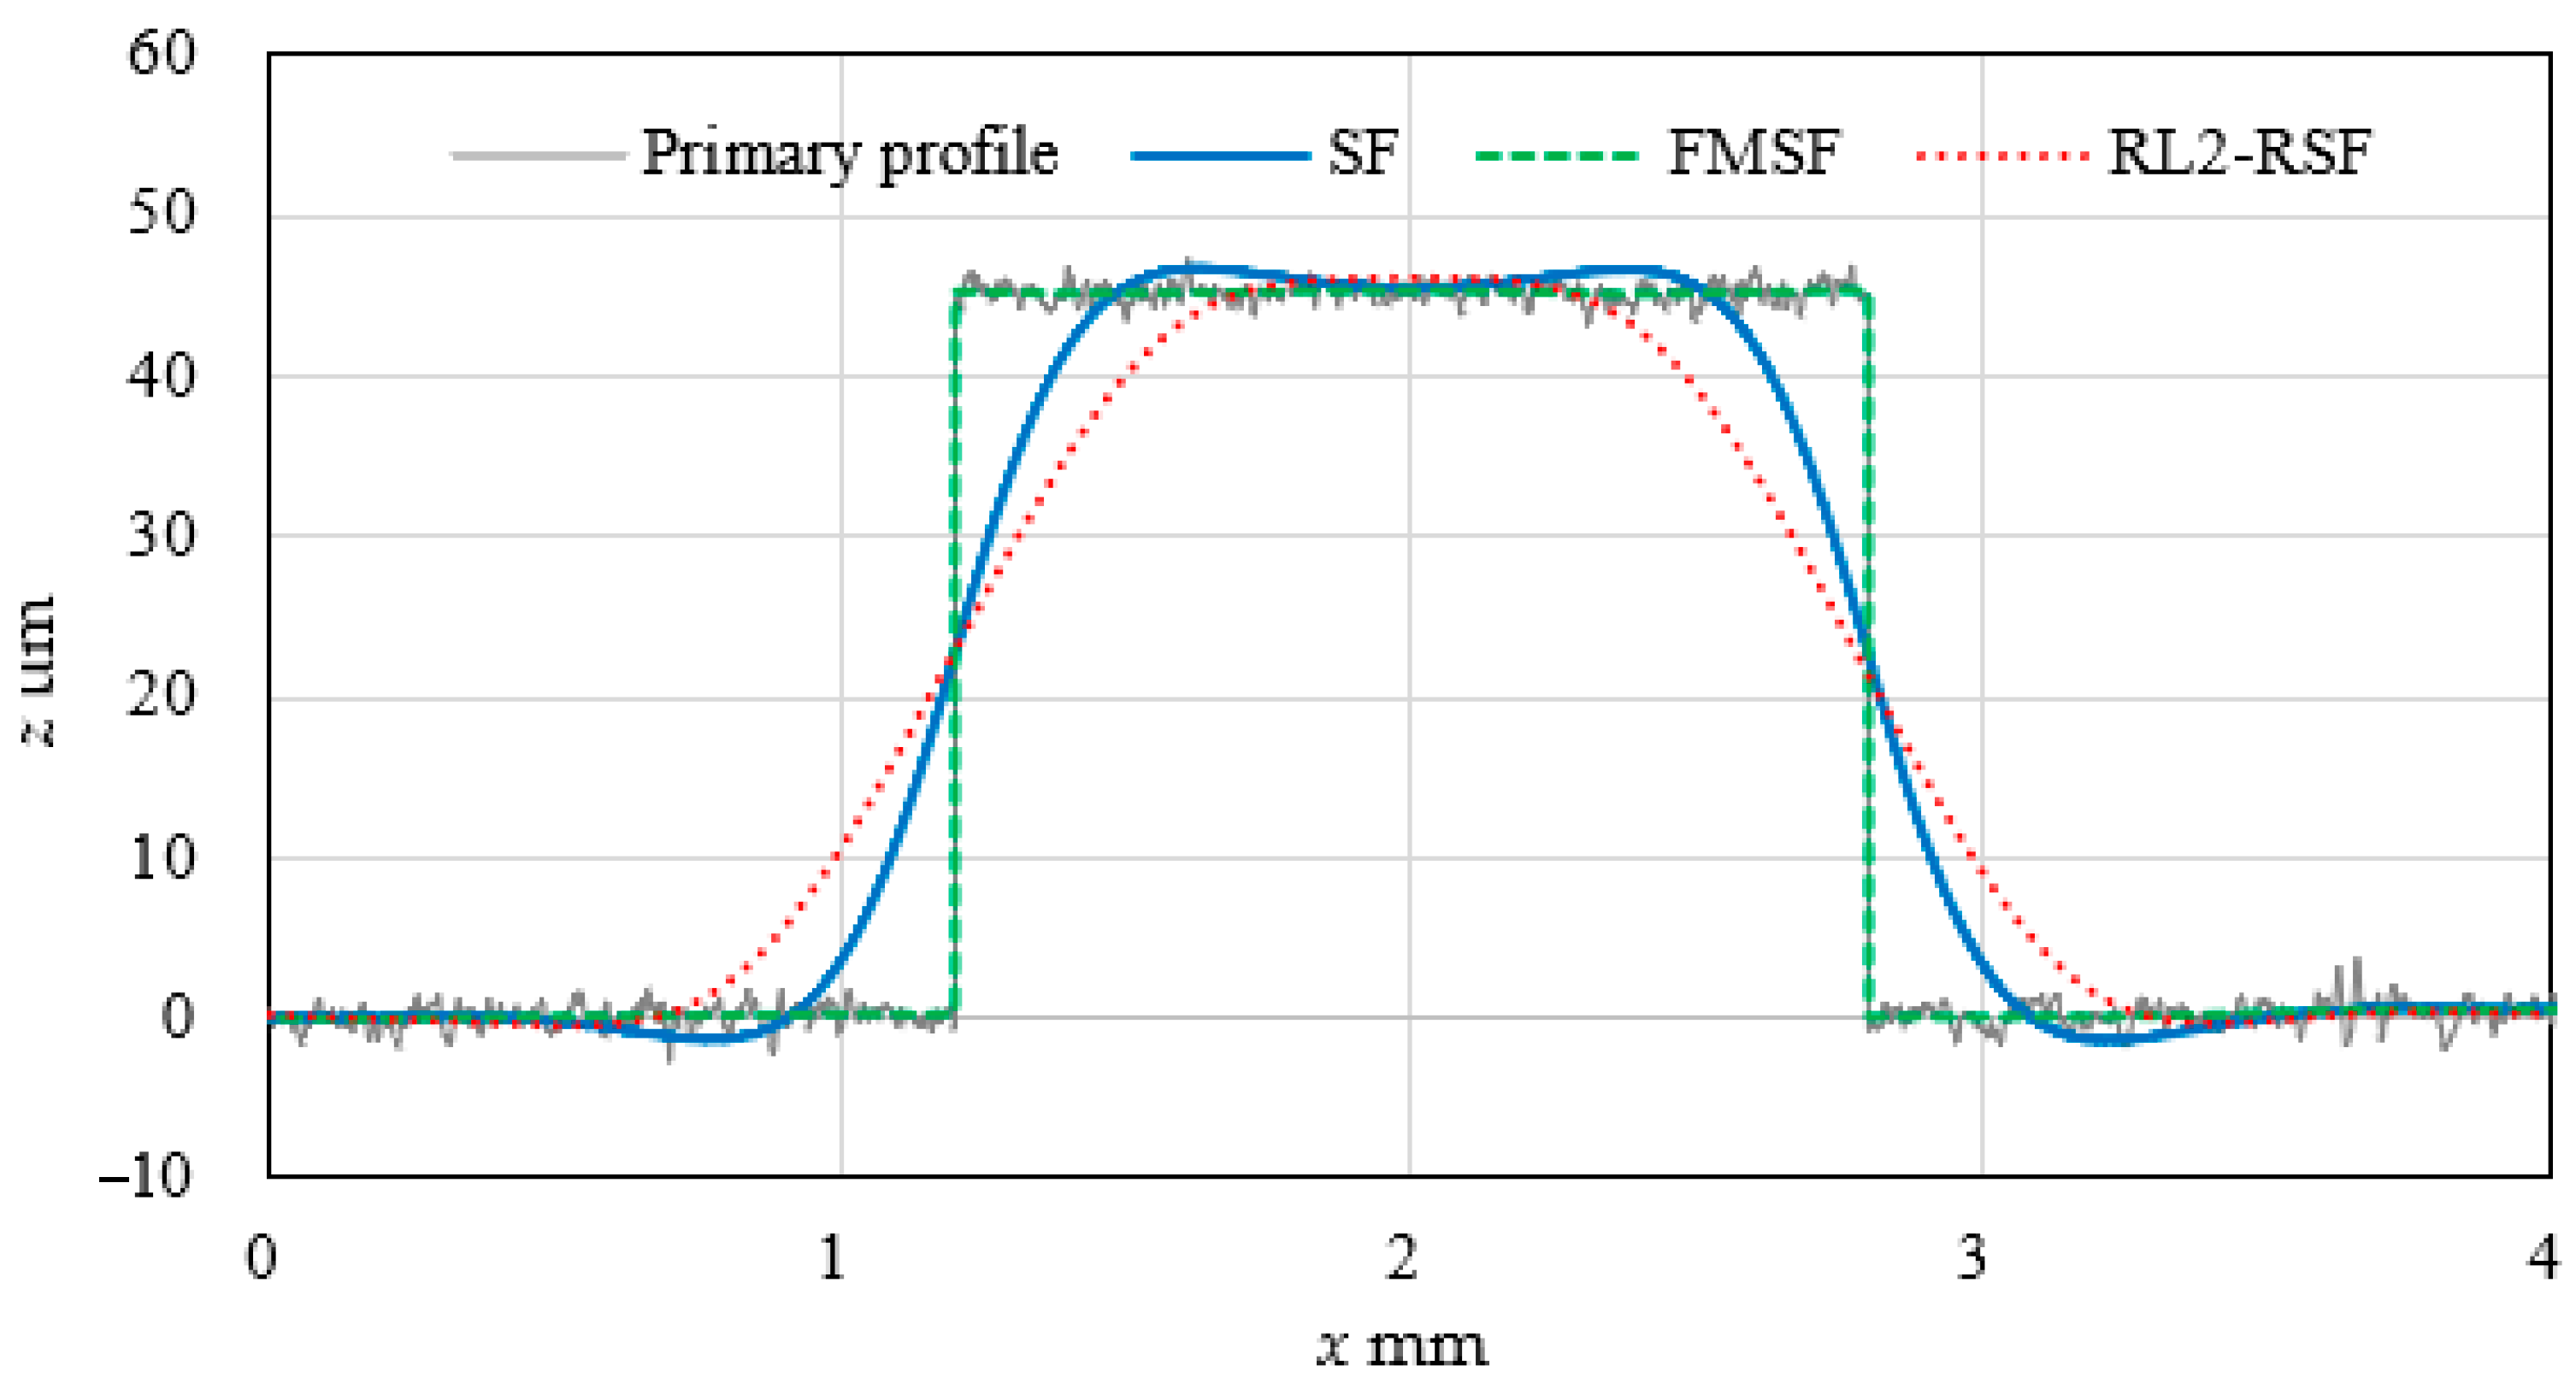
Figure 5 shows the primary profile, including the step component of width 2
λc and the mean line calculated using each filter. It can be observed that the FMSF extracts the shape components without blunting the step boundary area, same as 0.5
λc and 1
λc, whereas the output of RL2-RSF blunts the step boundary area, similar to when the step width is 1.0
λc. From this result, it can be concluded that the RL2-RSF cannot extract the step shape component accurately even when the width of the step is widened.
The width boundary of whether the FMSF removes as a spike or extracts the shape component as a step is verified.
Figure 6 shows the primary profile after adding the step components with widths 0.2
λc, 0.25
λc, and 0.3
λc, from left to right, and the mean line calculated using each filter. The RL2-RSF removes all of them as spikes. On the other hand, the FMSF is removed as a spike for width 0.2
λc outlier. However, the FMSF outputs the values of the upper side of the step only near the center for a width 0.25
λc outlier. For the width 0.3
λc outlier, the FMSF has a wider range of outputting the upper side value of the step; however, the extracted width of the step is narrower than the width of the step.
The results shown in
Figure 6 are discussed here. In the case of FMSF, when the width of the outlier is less than 0.2
λc, the FMSF outputs only from the data on the lower side because the cumulative sum of weights of the lower side is larger for all points. Therefore, the FMSF removed this as a spike. As the width of the outlier becomes wider, the point appears where the cumulative sum of the upper side weights is larger than the cumulative sum of the weights on the lower side. First, it appears in the middle of the upper side, and as the width of the outlier becomes wider, the output points of the upper side increase. Eventually, it will extract the same width as the outlier (step) width. The boundary’s width value of the outlier depends on the roughness components’ distribution. As a result of the verification, all of them were removed as spikes when the width of the outlier was less than 0.2
λc, and all of them were extracted as steps when the width of the outlier was more than 0.5
λc. From this result, it seems that the FMSF removes as the spike when the width of the outlier is less than 0.2
λc and extracts as the step component when the width of the outlier is more than 0.5
λc. It is noteworthy that for widths of outlier between 0.2
λc and 0.5
λc, the FMSF has the risk of outputting half-heartedly.
3.4. Verifying the Characteristics of Each Filter When the Arc Is Included in Primary Profile
The characteristics of each filter to arc are verified. The typical examples of arc are lenses and, cylinders, shafts.
Figure 7 is the primary profile, including an arc (Radius: 50 mm) and the mean lines calculated using each filter. None of the roughness profiles is particularly distorted. All filters extracted the arc-shaped components without any problems, and it was confirmed that these filters did not cause any problems.
3.5. Verifying the Characteristics of Each Filter When the Spike and Step Arc Are Included in Primary Profile
Finally, it is verified whether the characteristics change with the combined arc and outliers.
Figure 8 is the primary profile and the mean lines calculated using each filter. The primary profile includes spikes, same as in
Figure 2, a step, same as in
Figure 5, and an arc, same as in
Figure 7. For all filters, the same characteristics were confirmed as those for each alone.
4. Summary of the Characteristics of RL2-RSF and FMSF
Figure 9 summarizes the characteristics of RL2-RSF and FMSF concerning outliers (spike and step). The horizontal axis is the magnification of the width of the outliers (spike and step) with reference to
λc, and the vertical axis is the magnification of the height of the outliers (spike and step) with reference to the maximum roughness component. When the height value of the outlier is less than twice the height value of the maximum roughness component, this outlier becomes impossible for the human eye to distinguish between outlier and roughness. Therefore, in
Figure 9, the area corresponding to the height value less than twice is written as “Cannot distinguish from roughness”.
From
Figure 9a, RL2-RSF removes spikes whose height values of the spike are more than twice the height values of the maximum roughness component. The width of the outlier depends on the primary profile. However, the widths of the outlier narrow to about 0.5
λc and are removed as spikes. When the width of the outlier is wider than 0.5
λc, RL2-RSF tries to extract the shape component as a step; however, this causes problems because the area near the step boundary cannot extract an accurate step.
From
Figure 9b, the robustness of the FMSF to the height of the spike is the same as that of RL2-RSF. The FMSF removes the effect as a spike when the width of the outlier is less than 0.2
λc and extracts the shape component as a step when the width of the outlier is wider than 0.5
λc. Therefore, the FMSF may cause problems if the width of the outlier is between 0.2
λc and less than 0.5
λc.
Based on the above results, guidelines for the usage of RL2-RSF and FMSF are shown. When it is known that the step component is included in the measurement data or when a visual inspection is performed before the measurement, and it is assumed that dust or dirt wider than 0.2λc is eliminated, using the FMSF is preferable; because the FMSF is capable of extracting steps and is compatible with the SF when no outlier exist. On the other hand, the situations in which it is desirable to select RL2-RSF are as follows. Note that full compatibility with SF in the case where no outliers are included in the primary profile is not required as a precondition. When it is known that the primary profile does not include the step component and there is a possibility that it may contain large outliers due to negligent dust removal. In this case, RL2-RSF, which removes even larger width outliers as spikes, is suitable.
Figure 10 presents a flowchart demonstrating these results.
5. Conclusions
This paper clarified the characteristics of SF-based robust filters, which filters can deal with outliers and shape components, and verified the cases in which problems arise. Consequently, it was confirmed that each RSF, RL2-RSF and FMSF, could remove the effect of spikes to a practically acceptable level when their height is more than twice the maximum of the normal roughness component. On the other hand, when the height of the spike is less than twice the height of the maximum roughness component, this spike is impossible for the human eye to distinguish between spike and roughness. In this case, the effect on the roughness profile is marginal, even when using SF. Therefore, RL2-RSF and FMSF have no practical problems with spike height.
In the case of the widths of outliers (spike and step), RL2-RSF removes width 0.5λc or less outlier as a spike. However, this criterion varies slightly depending on the primary profile (roughness component, waviness component, and shape component). When the width exceeds 0.5λc, the RL2-RSF blunted the step around the boundary. Therefore, if the purpose is to extract as a step, the RL2-RSF cannot extract the step accurately and should be used with caution. On the other hand, when the width is less than 0.2λc outlier, the FMSF removes it as a spike, whereas when the width of the outlier is more than 0.5λc, the FMSF extracts the shape component as a step. Therefore, the FMSF may cause problems if the width of the outlier is between 0.2λc and less than 0.5λc.
The arc was verified as another example of a realistic shape component likely to cause problems; no problems were encountered with either RSF.
The primary profile, including all spikes, steps and arcs, is verified. As a result, the same characteristics were confirmed for each of them alone.
From these results, a figure that shows the characteristics of RL2-RSF and FMSF (
Figure 9) is created. And a flowchart regarding which RSF should be used in which situations (
Figure 10) is created. Those outcomes did not exist prior to this paper in the authors’ knowledge. These results are expected to contribute not only to the spread and use of each RSF in the industrial world but also to avoid confusion at the measurement site and to help establish new RSF standards.
Author Contributions
Conceptualization, I.Y.; methodology, I.Y. and Y.K.; software, Y.K.; validation, Y.K. and I.Y.; formal analysis, Y.K. and I.Y.; investigation, Y.K., I.Y., R.S. and K.F.; resources, Y.K., I.Y. and M.N.; data curation, Y.K., R.S. and K.F.; writing—original draft preparation, Y.K.; writing—review and editing, I.Y., Y.K., R.S., K.F., M.N. and H.K.; visualization, Y.K. and I.Y.; supervision, I.Y.; project administration, I.Y.; funding acquisition, I.Y. and M.N. All authors have read and agreed to the published version of the manuscript.
Funding
This work was partly supported by the Precise Measurement Technology Promotion Foundation (PMTP-F).
Institutional Review Board Statement
Not applicable.
Informed Consent Statement
Not applicable.
Data Availability Statement
The data presented in this study are available in article.
Conflicts of Interest
The authors declare no conflict of interest.
References
- ISO 4287; Geometrical Product Specifications (GPS)—Surface Texture: Profile Method—Terms, Definitions and Surface Texture Parameters. International Organization for Standardization: Geneva, Switzerland, 1997.
- ISO 21920-2; Geometrical Product Specifications (GPS)—Surface Texture: Profile—Part 2: Terms, Definitions and Surface Texture Parameters. International Organization for Standardization: Geneva, Switzerland, 2021.
- ISO 16610-21; Geometrical Product Specifications (GPS)—Filtration—Part 21: Linear Profile Filters: Gaussian Filters. International Organization for Standardization: Geneva, Switzerland, 2011.
- JIS B 0634; Geometrical Product Specifications (GPS)—Filtration—Linear Profile Filters: Gaussian Filters. International Organization for Standardization: Geneva, Switzerland, 2017.
- Krystek, M. Form filtering by splines. Measurement 1996, 18, 9–15. [Google Scholar] [CrossRef]
- ISO 16610-22; Geometrical Product Specifications (GPS)—Filtration—Part 22: Linear Profile Filters: Spline Filters. International Organization for Standardization: Geneva, Switzerland, 2015.
- ISO 16610-31; Geometrical Product Specifications (GPS)—Filtration—Part 31: Robust Profile Filters: Gaussian Regression Filters. International Organization for Standardization: Geneva, Switzerland, 2016.
- Seewig, J. Linear and robust Gaussian regression filters. J. Phys. Conf. Ser. 2005, 13, 254–257. [Google Scholar] [CrossRef] [Green Version]
- Corless, R.M.; Gonnet, G.H.; Hare, D.E.G.; Jeffrey, D.J.; Knuth, D.E. On the LambertW function. Adv. Comput. Math. 1996, 5, 329–359. [Google Scholar] [CrossRef]
- Brinkmann, S.; Bodschwinna, H.; Lemke, H.W. Accessing roughness in three-dimensions using Gaussian regression filtering. Int. J. Mach. Tools Manuf. 2001, 41, 2153–2161. [Google Scholar] [CrossRef]
- ISO/TS 16610-32; Geometrical Product Specifications (GPS)—Filtration—Part 32: Robust Profile Filters: Spline Filters. International Organization for Standardization: Geneva, Switzerland, 2009.
- ISO 16610-30; Geometrical Product Specifications (GPS)—Filtration—Part30: Robust Profile Filters: Basic Concepts. International Organization for Standardization: Geneva, Switzerland, 2015.
- Kondo, Y.; Yoshida, I.; Nakaya, D.; Numada, M.; Koshimizu, H. Verification of Characteristics of Gaussian Filter Series for Surface Roughness in ISO and Proposal of Filter Selection Guidelines. Nanomanuf. Metrol. 2021, 4, 97–108. [Google Scholar] [CrossRef]
- Markov, B.N.; Shulepov, A.V. Robust Filtering Algorithms for Roughness Profiles. Meas. Tech. 2020, 58, 730–735. [Google Scholar] [CrossRef]
- Lou, S.; Zeng, W.-H.; Jiang, X.-Q.; Scott, P.J. Robust Filtration Techniques in Geometrical Metrology and Their Comparison. Int. J. Autom. Comput. 2013, 10, 1–8. [Google Scholar] [CrossRef] [Green Version]
- Goto, T.; Miyakura, J.; Umeda, K.; Kadowaki, S.; Yanagi, K. A Robust Spline Filter on the basis of L2-norm. Precis. Eng. 2005, 29, 157–161. [Google Scholar] [CrossRef]
- Kondo, Y.; Numada, M.; Takahashi, K.; Yoshida, I.; Koshimizu, H. A Proposal of Spline Filter that Achieve Both Robustness and Lower Compatibility. Nanomanuf. Metrol. 2021, 4, 77–85. [Google Scholar] [CrossRef]
- Kondo, Y.; Numada, M.; Koshimizu, H.; Yoshida, I. A Study on Four Major Characteristics of Two-dimensional Fast M-Estimation Based Gaussian Filter (FMGF). Jpn. Soc. Precis. Eng. 2015, 81, 170–175. [Google Scholar] [CrossRef] [Green Version]
- Kondo, Y.; Numada, M.; Koshimizu, H. A Transmission Characteristic of the Robust Gaussian Filter by Using Fast M-Estimation Method. Jpn. Soc. Precis. Eng. 2013, 79, 659–664. [Google Scholar] [CrossRef] [Green Version]
- ISO 16610-28; Geometrical Product Specifications (GPS)—Filtration—Part 28: End Effects. International Organization for Standardization: Geneva, Switzerland, 2010.
- Kondo, Y.; Numada, M.; Koshimizu, H.; Kamiya, K.; Yoshida, I. Low-pass filter without the end effect for estimating transmission characteristics—Simultaneous attaining of the end effect problem and guarantee of the transmission characteristics. Precis. Eng. 2017, 48, 243–253. [Google Scholar] [CrossRef]
- Kondo, Y.; Yoshida, I.; Numada, M.; Koshimizu, H. Outlier Detection and Exclusion Method Applying Property of Fast M-Estimation Gaussian Filter and Gaussian Filter. Jpn. Soc. Precis. Eng. 2020, 86, 778–783. [Google Scholar] [CrossRef]
| Disclaimer/Publisher’s Note: The statements, opinions and data contained in all publications are solely those of the individual author(s) and contributor(s) and not of MDPI and/or the editor(s). MDPI and/or the editor(s) disclaim responsibility for any injury to people or property resulting from any ideas, methods, instructions or products referred to in the content. |
© 2023 by the authors. Licensee MDPI, Basel, Switzerland. This article is an open access article distributed under the terms and conditions of the Creative Commons Attribution (CC BY) license (https://creativecommons.org/licenses/by/4.0/).

 ,
, 

