Author Contributions
Conceptualization, H.L., Y.C. and Z.G.; methodology, H.L. and Y.C.; software, H.L., Y.Y., Y.B. and Z.G.; validation, H.L., Y.C., Y.B. and Z.G.; formal analysis, H.L., Y.Y., Y.B. and Y.C.; investigation, H.L. and X.L.; resources, H.L., Y.Y. and Z.G.; data curation, Y.C.; writing—original draft preparation, H.L. and Y.C.; writing—review and editing, H.L., Y.C., Y.B., Y.Y. and X.L.; visualization, H.L.; supervision, Y.C. and Z.G. All authors have read and agreed to the published version of the manuscript.
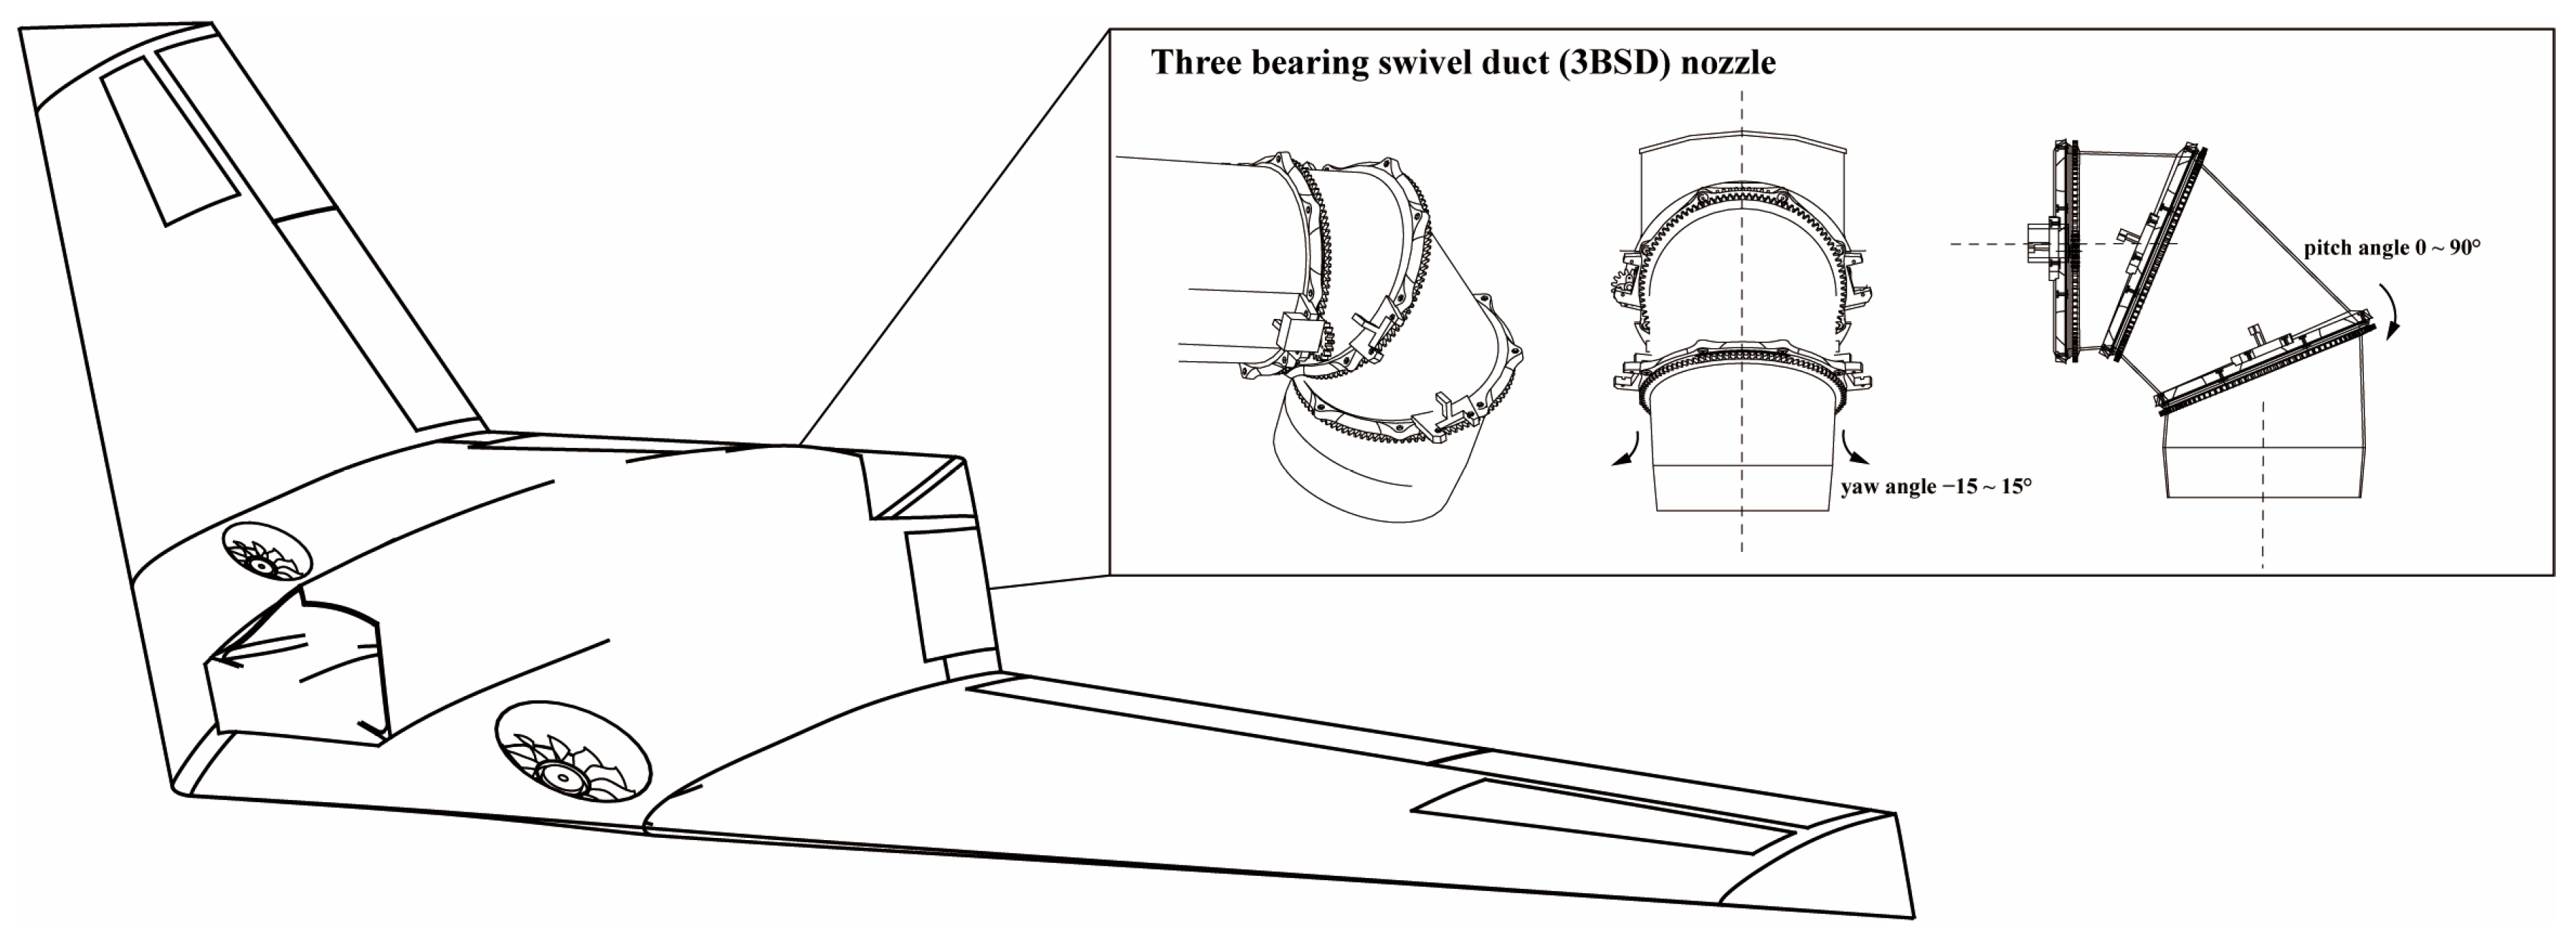
Figure 1.
General diagram of the configuration of the subject flyingwing UAV.
Figure 1.
General diagram of the configuration of the subject flyingwing UAV.
Figure 2.
Top view of the flying-wing UAV.
Figure 2.
Top view of the flying-wing UAV.
Figure 3.
Bench test results for lift fans. (a) Lift fan static force test results and fitting curve; the estimated results are Ct = 4.2278. (b) Lift fan static torque test results and fitting curve; the estimated results are Cq = 0.2303. (c) Recorded dynamic electric power change with rotation speed. (d) Calculated results of the dynamic lift-fan torque.
Figure 4.
Longitudinal force analysis.
Figure 4.
Longitudinal force analysis.
Figure 5.
Pressure contour of the aircraft.
Figure 5.
Pressure contour of the aircraft.
Figure 6.
Longitudinal aerodynamic coefficients: (a) lift coefficient (sideslip angle β = 0), (b) drag coefficient (sideslip angle β = 0), (c) pitch-moment coefficient, and (d) directional static stability derivative (per radian).
Figure 6.
Longitudinal aerodynamic coefficients: (a) lift coefficient (sideslip angle β = 0), (b) drag coefficient (sideslip angle β = 0), (c) pitch-moment coefficient, and (d) directional static stability derivative (per radian).
Figure 7.
SSD yaw control moment derivative (per radian); the gray area is the continuous error bar for various angles of attack (angles of attack α = −6~12 deg).
Figure 7.
SSD yaw control moment derivative (per radian); the gray area is the continuous error bar for various angles of attack (angles of attack α = −6~12 deg).
Figure 8.
Trim procedure for short-landing performance analysis.
Figure 8.
Trim procedure for short-landing performance analysis.
Figure 9.
Reachable area for different angles of attack (angle of attack, α = 3~12 deg).
Figure 9.
Reachable area for different angles of attack (angle of attack, α = 3~12 deg).
Figure 10.
Control input matrix for acceleration (angle of attack α = 4 deg); the gray area is the continuous error bar for various sink rates (0~−4m/s): (a) G11, (b) G12, (c) G21, and (d) G22.
Figure 10.
Control input matrix for acceleration (angle of attack α = 4 deg); the gray area is the continuous error bar for various sink rates (0~−4m/s): (a) G11, (b) G12, (c) G21, and (d) G22.
Figure 11.
AAS and AMS calculation for short landing (angle of attack = 6 deg): (a) AAS area results, (b) AAS area and AMS results, (c) normalized AAS area and AMS results, and (d) equilibrium points for different sink rates.
Figure 11.
AAS and AMS calculation for short landing (angle of attack = 6 deg): (a) AAS area results, (b) AAS area and AMS results, (c) normalized AAS area and AMS results, and (d) equilibrium points for different sink rates.
Figure 12.
AAS area and equilibrium points curve: (a) AAS area (angle of attack = 6 deg, sink rate = −1 m/s, and velocity = 35 m/s) and (b) equilibrium points curve.
Figure 12.
AAS area and equilibrium points curve: (a) AAS area (angle of attack = 6 deg, sink rate = −1 m/s, and velocity = 35 m/s) and (b) equilibrium points curve.
Figure 13.
Trim results for short landing (angle of attack = 3 deg): (a) throttle and nozzle angle trim results and (b) throttle and lift fan trim results.
Figure 13.
Trim results for short landing (angle of attack = 3 deg): (a) throttle and nozzle angle trim results and (b) throttle and lift fan trim results.
Figure 14.
Complete control diagram for inner and outer loop control.
Figure 14.
Complete control diagram for inner and outer loop control.
Figure 15.
Pitch channel control allocation.
Figure 15.
Pitch channel control allocation.
Figure 16.
Diagram of the angle of attack controller.
Figure 16.
Diagram of the angle of attack controller.
Figure 17.
Sink rate control diagram: (a) control sink rate obtained using pitch attitude angle and (b) control sink rate obtained using the throttle.
Figure 17.
Sink rate control diagram: (a) control sink rate obtained using pitch attitude angle and (b) control sink rate obtained using the throttle.
Figure 18.
Overall control structure for short landing.
Figure 18.
Overall control structure for short landing.
Figure 19.
Short-landing process.
Figure 19.
Short-landing process.
Figure 20.
Sink rate and bank angle command calculation.
Figure 20.
Sink rate and bank angle command calculation.
Figure 21.
Three-dimensional trajectory of short landing.
Figure 21.
Three-dimensional trajectory of short landing.
Figure 22.
Nominal simulation results of short landing: (a) AGL (Above Ground Level)response, (b) angle-of-attack response, (c) velocity response, (d) roll-angle response, (e) sink-rate response, (f) roll-angular-rate response, (g) pitch-angle response, (h) side-slip-angle response, (i) pitch-angle-rate response, (j) Yaw-angle-rate response, (k) actuator response, (l) nozzle-pitch-angle response, (m) lift-fan-rotation-speed response, and (n) throttle response.
Figure 23.
Simulation and analysis for the angle-of-attack control: (a) fixed angle-of-attack command simulation results, with Case 1 as −20% perturbation of the nominal lift coefficient and Case 2 as +20% perturbation of the nominal lift coefficient; and (b) trim results for different angles of attack and sink rates (at 80 percent of lift fan’s maximum rotation speed).
Figure 24.
Sink rate control under the wind gust.
Figure 24.
Sink rate control under the wind gust.
Figure 25.
States response of the MC simulation: (a) angle-of-attack response and (b) throttle response.
Figure 25.
States response of the MC simulation: (a) angle-of-attack response and (b) throttle response.
Figure 26.
Angle-of-attack response of successful landing without the flight boundary protection.
Figure 26.
Angle-of-attack response of successful landing without the flight boundary protection.
Figure 27.
Monte Carlo simulation trajectory.
Figure 27.
Monte Carlo simulation trajectory.
Figure 28.
Landing error diagram: (a) CEP error and (b) histogram with a distribution fit for CEP.
Figure 28.
Landing error diagram: (a) CEP error and (b) histogram with a distribution fit for CEP.
Table 1.
Physical parameters of the target aircraft.
Table 1.
Physical parameters of the target aircraft.
| Parameter | Explanation | Value |
|---|
| m | Mass | 62 kg |
| S | Wing area | 1.8 m2 |
| b | Wingspan | 3.2 m |
| Tv max | Maximum thrust of the turbojet engine | 270 N |
| Tf max | Maximum force per lift fan | 75 N |
| Ixx | Moment of inertia around body x-axis | 72.1 kg·m2 |
| Iyy | Moment of inertia around body y-axis | 63.7 kg·m2 |
| Izz | Moment of inertia around body z-axis | 112.3 kg·m2 |
Table 2.
Physical parameters of the lift fan.
Table 2.
Physical parameters of the lift fan.
| Parameter | Explanation | Value |
|---|
| mf | Mass of blade culvert fan | 0.092 kg |
| Df | Diameter of fan | 0.15 m |
| Irf | Inertia moment of blade culvert fan | 0.0004 kg·m2 |
| N | Pole pairs of the electric motor | 6 |
Table 3.
Effector characteristics of the UAV.
Table 3.
Effector characteristics of the UAV.
| Effector | Explanation | Damping Ratio | Natural Frequency | Position Limit | Rate Limit |
|---|
| δe | Elevator angle | 0.8 | 30 rad/s | [−30°, +30°] | ±110 °/s |
| δa | Aileron angle | 0.8 | 30 rad/s | [−30°, +30] | ±110 °/s |
| δLSSD | Left SSD deflection angle | 0.8 | 30 rad/s | [0°, 60°] | ±110 °/s |
| δRSSD | Right SSD deflection angle | 0.8 | 30 rad/s | [0°, 60°] | ±110 °/s |
| δvq | 3BSD nozzle pitch angle | 1 | 10 rad/s | [0°, 90°] | ±30 °/s |
| δvr | 3BSD nozzle yaw angle | 1 | 10 rad/s | [−15°, +15°] | ±30 °/s |
| δvT | Turbojet engine throttle | 1 | 1 rad/s | [0, 1] | 0.3 |
Table 4.
Inner and outer loop control parameters.
Table 4.
Inner and outer loop control parameters.
| Parameter | Explanation | Value | Parameter | Explanation | Value |
|---|
| kp | p control bandwidth | 6 | kθ | Pitch angle control gain | 1.2 |
| kq | q control bandwidth | 10 | kβ | Side slip angle control gain | 0.8 |
| kr | r control bandwidth | 6 | ksr | Sink rate control gain | 0.4 |
| ωo,p | p observation bandwidth | 7 | ωo,sr | Sink rate observation bandwidth | 1 |
| ωo,q | q observation bandwidth | 5 | ωT | Velocity control bandwidth | 0.25 |
| ωo,r | r observation bandwidth | 10 | ωy | CTE control bandwidth | 0.15 |
| kϕ | Roll angle control gain | 1.2 | ωas | Course angle control gain | 0.5 |
Table 5.
Model parameters bias.
Table 5.
Model parameters bias.
| Parameter | Explanation | Bias Range |
|---|
| M | Mass | ±1 kg |
| cgx, cgy, cgz | Centre of gravity | ±5% |
| qbar | Dynamic pressure | ±15% |
| CLα | Lift coefficient derivative | ±20% |
| Clβ | Roll moment coefficient derivative | ±20% |
| Clδa, Cmδe, Cnδr | Roll, pitch, and yaw control derivatives | ±20% |
| T | Engine thrust | −20~0% |
| Tf | Lift fan force | −20~0% |
| Ixx, Iyy, Izz | Moment of inertia | ±20% |
| Clp, Cmq | Damping moment coefficient derivatives | ±50% |
| CD0 | Drag coefficient | 0~20% |

 ,
, 


