Article

Extraction of Flaw Signals from the Mixed 1-D Signals by Denoising Autoencoder

Department of Mechanical Engineering, College of Engineering, Sungkyunkwan University, Suwon 16419, Republic of Korea
*
Author to whom correspondence should be addressed.
Appl. Sci. 2023, 13(6), 3534; https://doi.org/10.3390/app13063534
Submission received: 4 February 2023 / Revised: 6 March 2023 / Accepted: 6 March 2023 / Published: 10 March 2023
(This article belongs to the Special Issue Recent Advances of Ultrasonic Testing in Materials)

Abstract

:
Ultrasonic testing (UT) is one of the most popular non-destructive evaluation (NDE) techniques used in many industries to evaluate structural integrity. The commonly used NDE techniques are basic inspection techniques, such as visual testing (VT), penetration testing (PT), and magnetic testing (MT), and advanced inspection techniques, such as UT, radiography testing (RT), eddy current testing (ECT), and phased array ultrasonic testing (PAUT). Among the numerous advanced techniques, ultrasonic testing (UT) is usually used for the inspection of welds in various industries. However, the application of UT still has some shortcomings to overcome. One major shortcoming that reduces the precision of UT is the extra signals from the geometrical interface of a specimen. UT uses the reflection indications of the ultrasonic beam. However, the reflection signals from the welding interface and geometry along with the target flaw signal produce mixed signals. The inspectors use a 1-D reflection outcome called the ultrasonic A-scan to evaluate the welding integrity. The mixed ultrasonic A-scan signals are often very difficult to analyze because inspectors must distinguish the target flaw signal of welding from the mixed ultrasonic A-scan signal, which includes the flaw indication as well as the background signal. Therefore, a method to distinguish between the flaw signal and the background signal must be developed for the efficiency of UT. Autoencoder is an artificial neural network that is made for feature extraction from the input. Denoising autoencoder (DAE) is one of the derivative models of the autoencoder which adds or eliminates random noise signals to extract the prominent features. DAE is already widely used in the denoising of images and sound data. The characteristics of DAE are used in this research to distinguish the ultrasonic flaw signal from the mixed ultrasonic A-scan signal. For the training, 2463 mixed A-scan signals were obtained from 45 different standard blocks in which 5 different types of flaws were embedded. For testing, we used 1000 mixed A-scan signals. The performance of the network was evaluated using a point-by-point comparison method. The autoencoder was trained to denoise the background signal from the mixed ultrasonic A-scan, and the target flaw signal was extracted from the original A-scan signal.

1. Introduction

Recently, the nondestructive evaluation (NDE) market worldwide has been growing rapidly due to strict regulations on public safety and product quality, continuous advances in electronics, automation, and robotics, high adoption rates of Internet of Things (IoT) devices, and the need to evaluate aging equipment [1]. NDE is a crucial and efficient method for evaluating structural integrity because it does not harm or damage the inspected subject. Among various NDE techniques, ultrasonic testing (UT) is the most commonly used technique, accounting for 31.10% of the market share [1]. While UT is a versatile NDE method, it is commonly used for inspecting welds in pipes or storage tanks and requires a skilled inspector for accuracy because the results highly depend on the inspector’s capabilities [2]. The main obstacle in using UT is that the method is highly sensitive to the testing environment and geometry of the testing material. UT uses the propagation of ultrasonic waves in a testing material, and the ultrasonic beams are reflected, deflected, and attenuated by internal flaws or the molecular structure of the testing material. The ultrasonic waves are also diffracted by the internal or external geometry and weld interface of the object, and these indications, other than those from flaws, are called background noise. Evaluating UT mainly involves distinguishing between the reflected ultrasonic waves that indicate flaws from those that do not. This evaluation requires the capability of the inspector. When there are too many indications other than the flaw indication, the evaluation becomes much more complex. Typically to overcome the obstacle, the Hilbert transform or the threshold setups are used. The most frequently used method of getting rid of the random noise is the threshold setup. However, the threshold setup only is useful when used in the field because it is only a method of showing signals that exceed the reference level, rather than removing noise or extracting the flaw signal. Additionally, the Hilbert transform is a phase-shifting method that multiplies h( f ) to a signal in the frequency domain. This method is not a frequently used method since it has a chance of distortion of the original signal due to the multiplication. There still does not exist a clear solution to getting rid of random noises.
An autoencoder is an artificial neural network (ANN) often used to extract input features. A denoising autoencoder (DAE) is one of the derivative models of the autoencoder that adds or eliminates random noise from the input to extract prominent features. DAE is already widely used for denoising noisy image or sound data. Munir et al. [3] used the autoencoder technique to enhance ultrasonic classification performance. Gondora et al. [4] used DAE to denoise medical images, and Ishii et al. [5] used DAE for the reconstruction of the clean speech spectrum from reverberant speech. Lee et al. [6] proposed a derivative of DAE called noise learning-based denoising autoencoder (nlDAE) to enhance the denoising performance of neural networks. Saad et al. [7] denoised seismic random noise to enhance the signal-to-noise ratio of seismic data using DAE.
Since DAE is often used to denoise noisy images or signal datasets, its implementation to the ultrasonic 1-D signal, known as ultrasonic A-scan, should be effective. Using DAE, it would be possible to get rid of random noise and extract the flaw signal from the mixed ultrasonic A-scan signal. Figure 1 shows an example of a mixed 1-D ultrasonic signal with a flaw indication and background noise. (a) The figure shows the region where the initial signal and wedge noise exist. (b) The figure presents the flaw signal, which is the target signal of this study. (c) The figure shows the welding interface signal and the geometrical signal from the specimen. As shown in Figure 1, an A-scan is a mixture of various signals from the UT procedure. Distinguishing the flaw indication from the ultrasonic 1-D outcome is very difficult because there are too many indications from other aspects of the inspected weldment.

2. Methods and Materials

2.1. Specimen Information

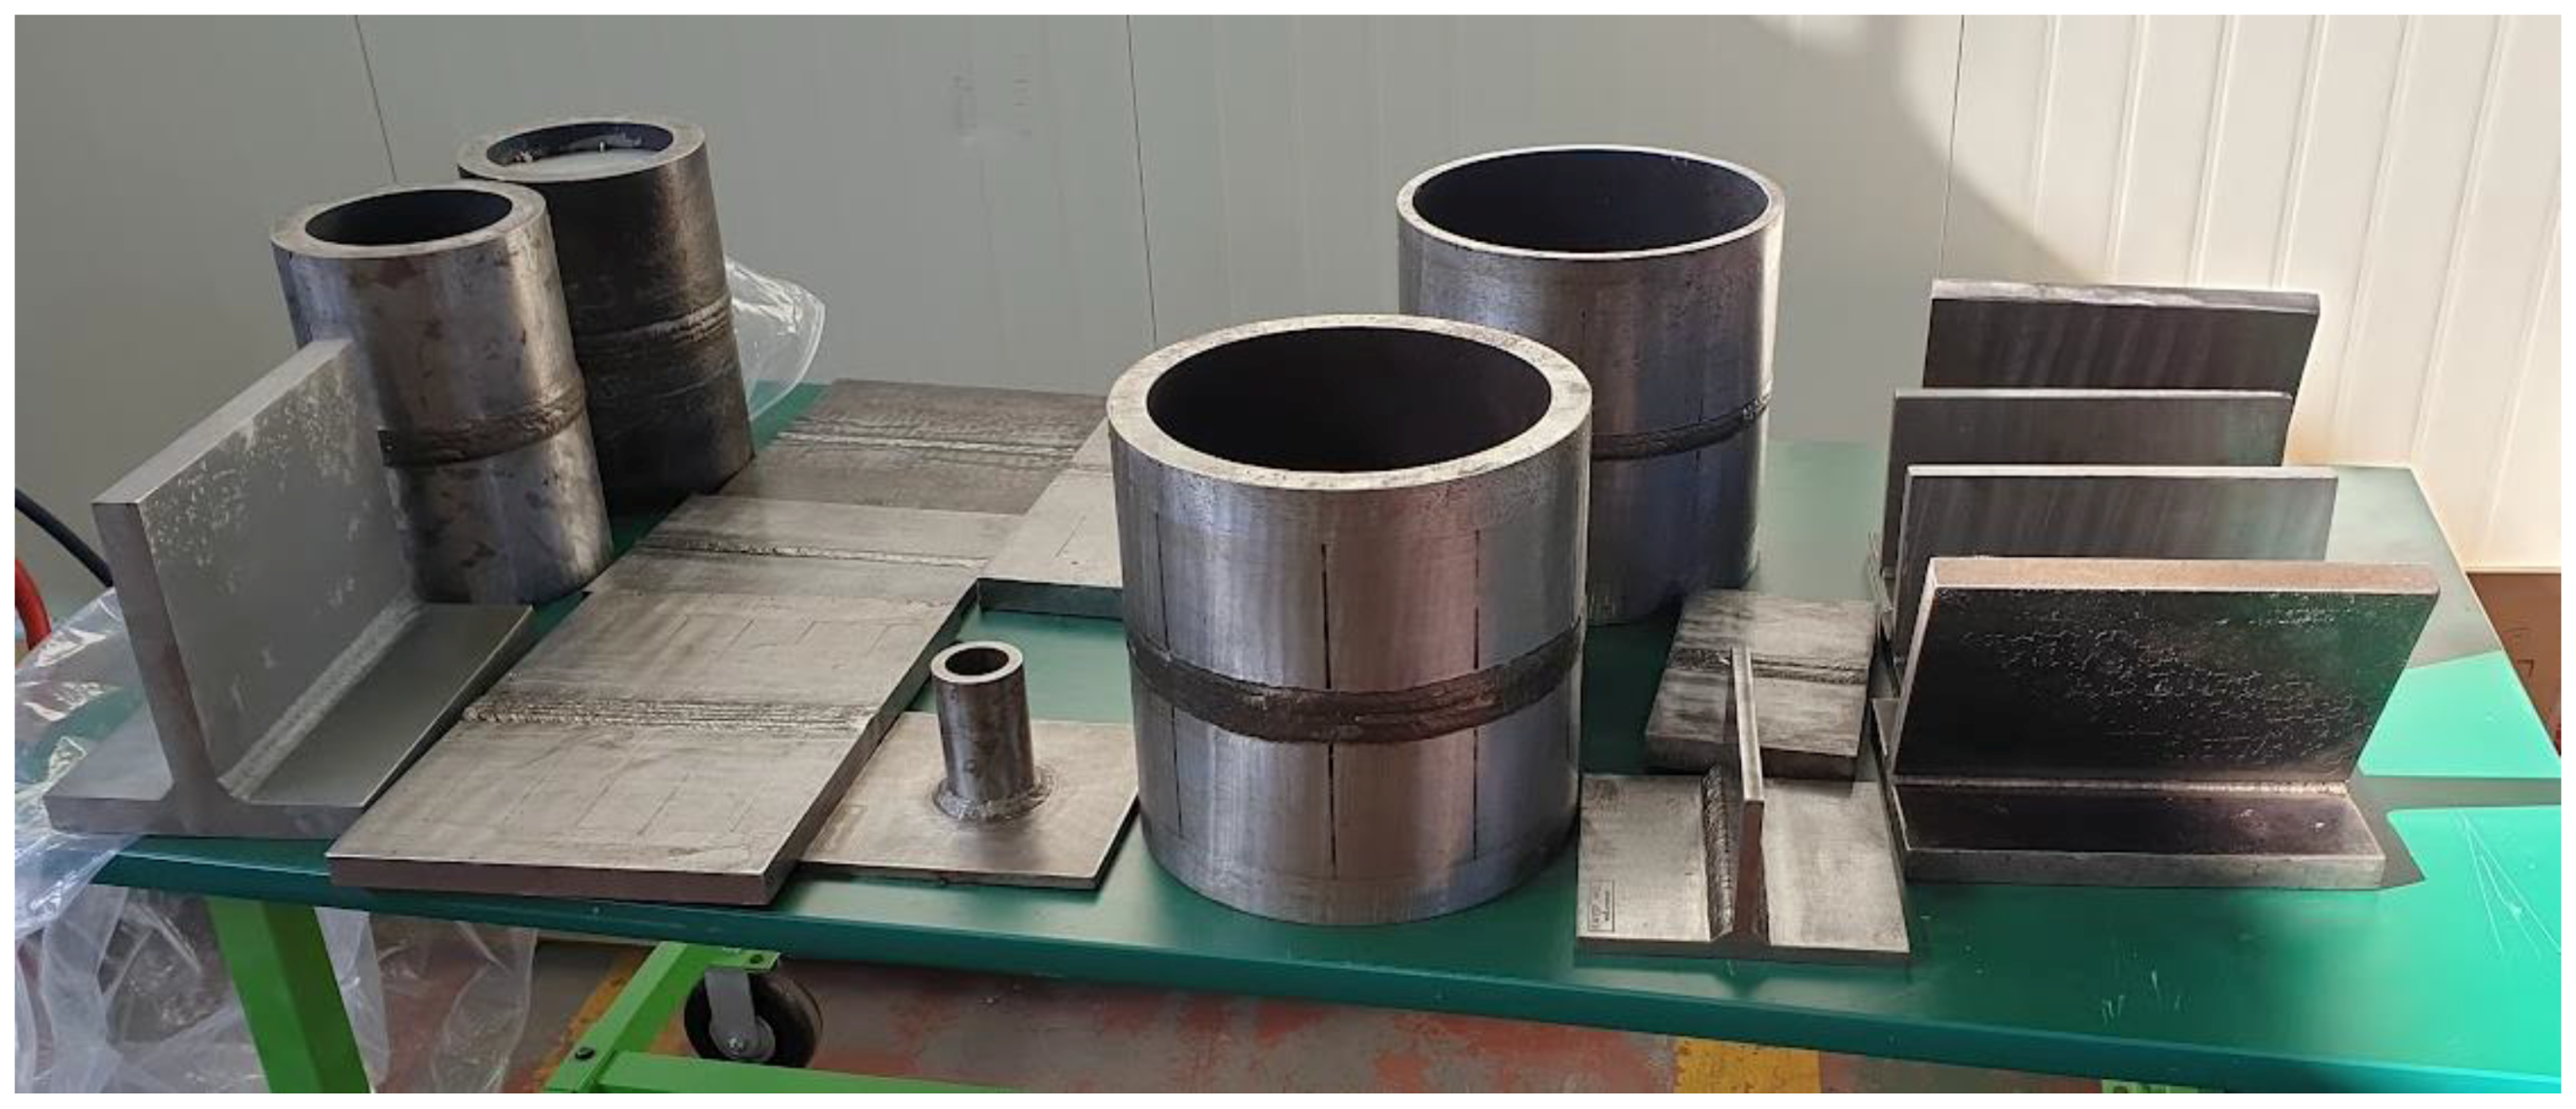
In this study, the A-scan flaw signals acquired from 45 different standard blocks that had 5 types of flaws were used for the dataset. The specimens were made by FlawTech [8] and Sonaspection [9]. Figure 2 shows the specimens used in this study to acquire the data.
The specimens illustrated in Figure 2, had 5 different types of flaws: crack, lack of fusion, slag inclusion, porosity, and incomplete penetration.

2.2. Data Acquisition

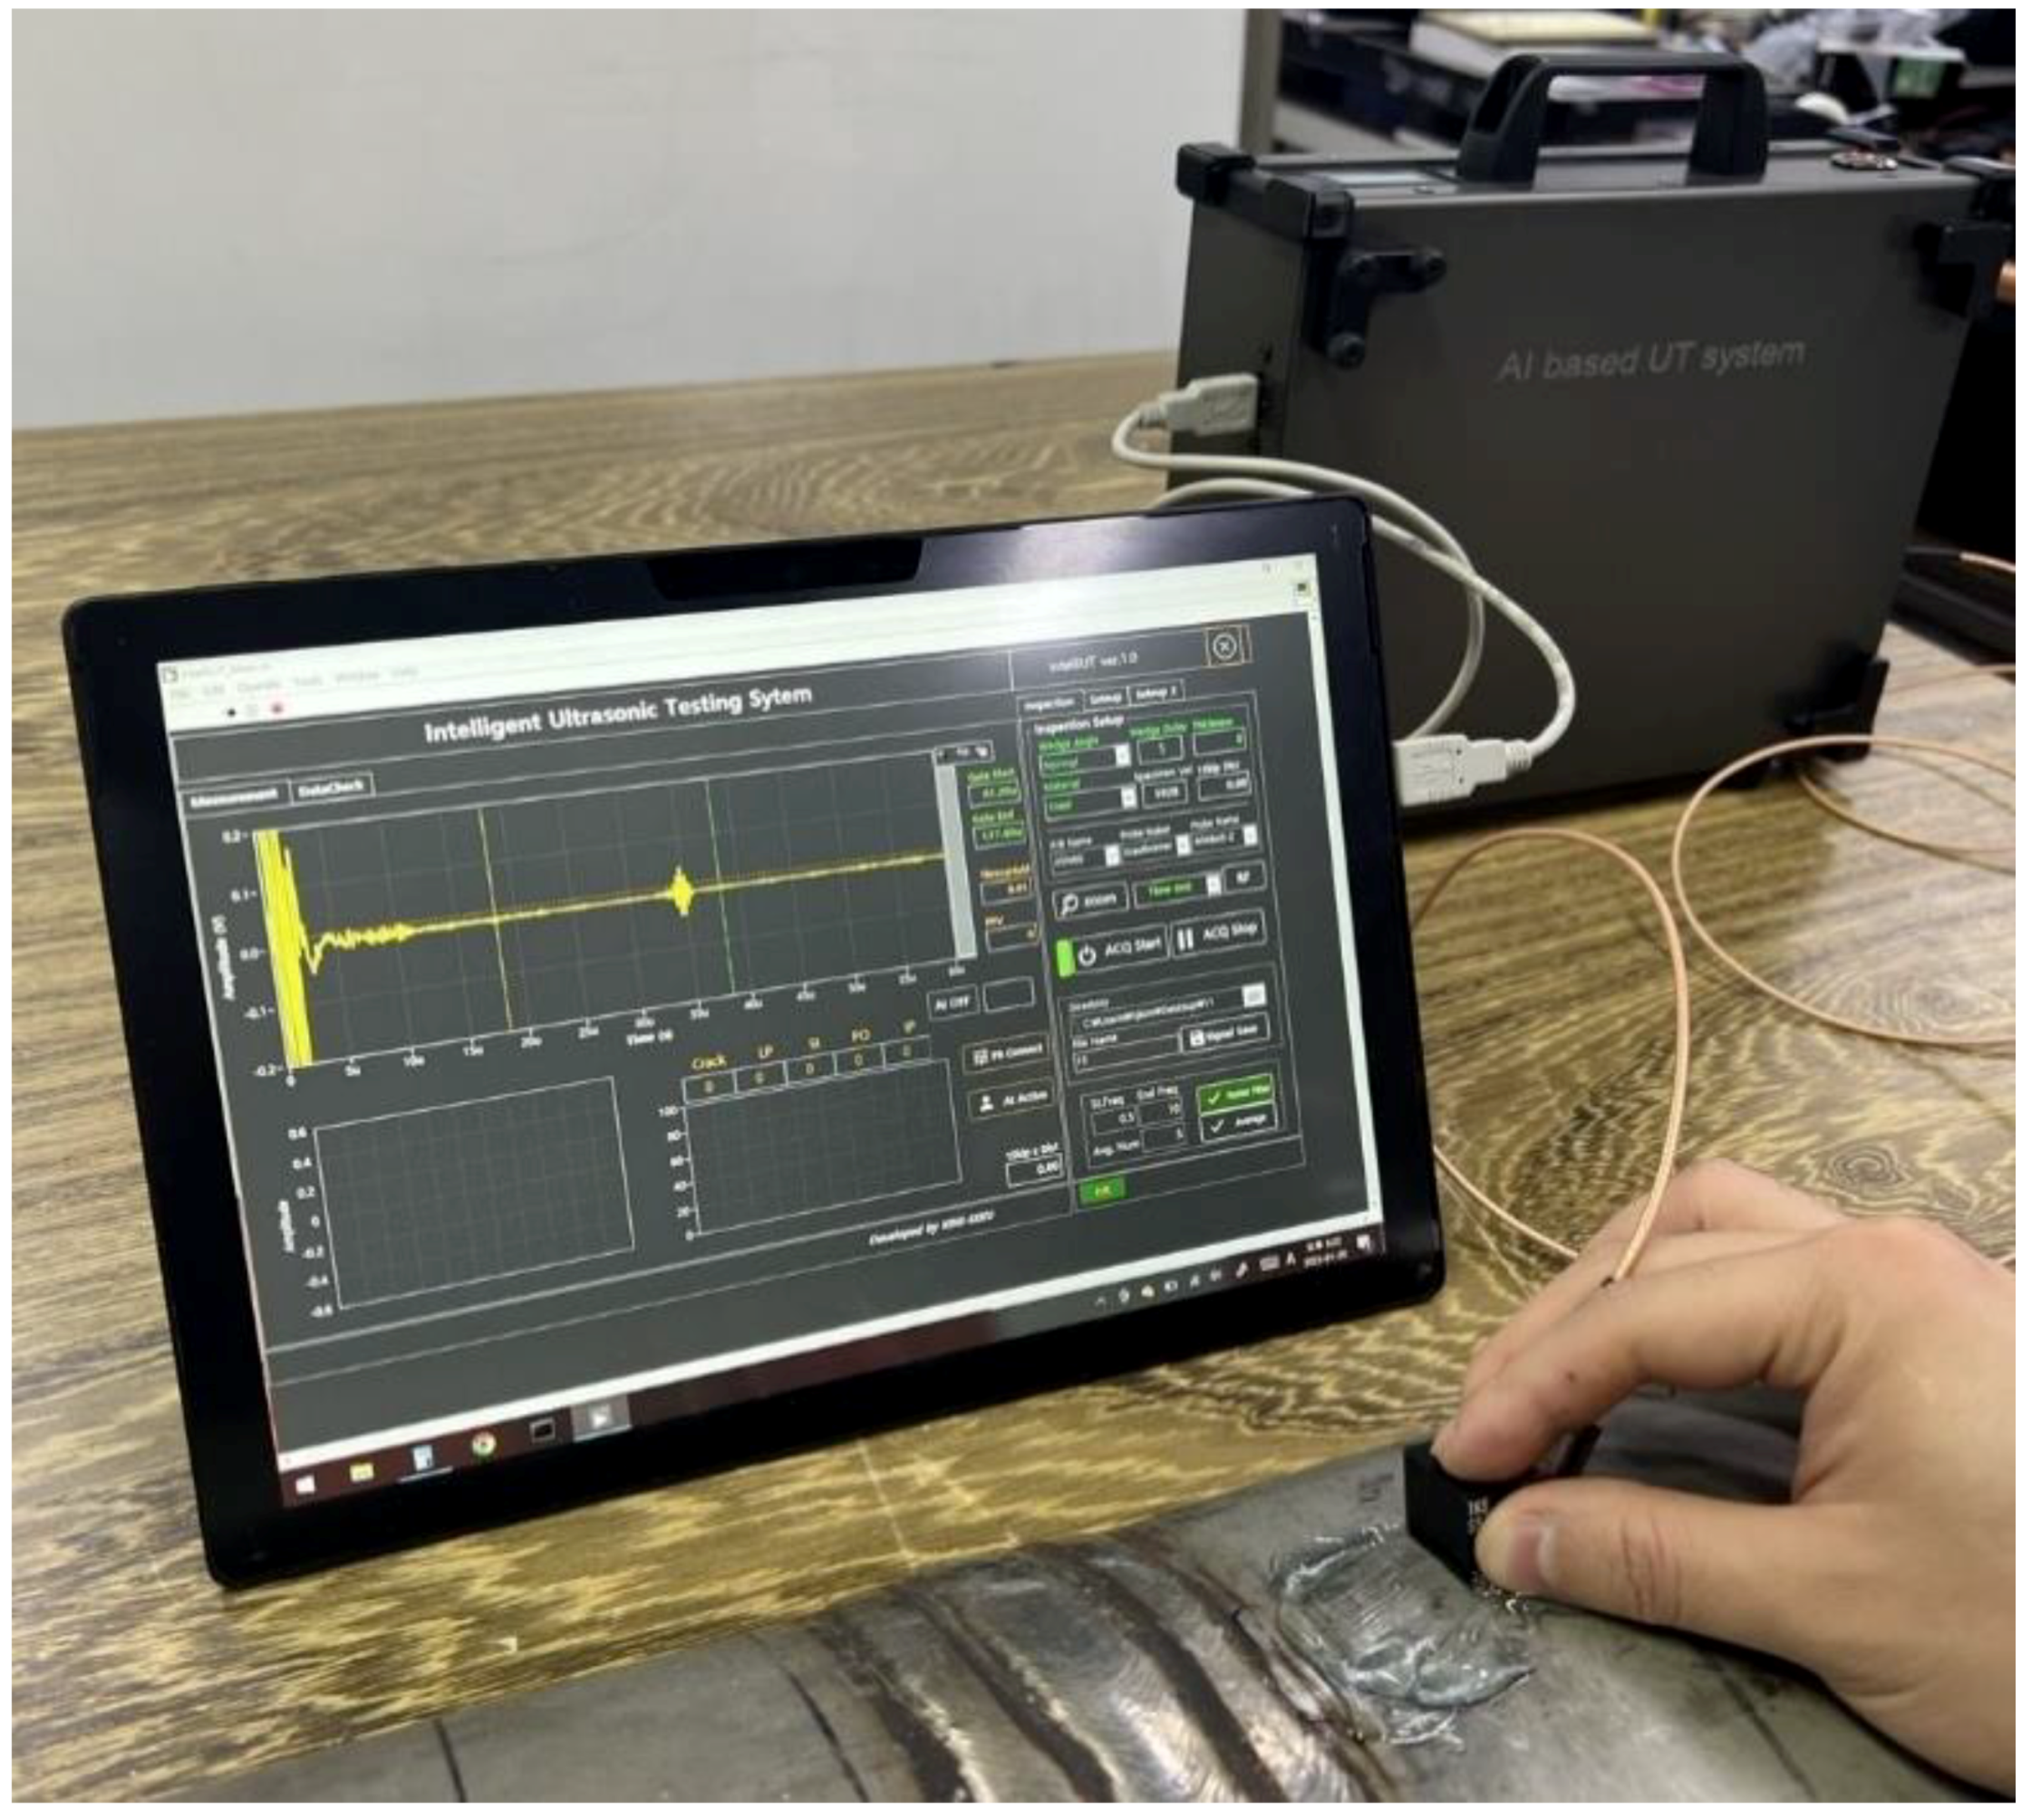
The A-scan data from the flaws were collected with an ultrasonic testing system shown in the figure below. Figure 3 presents the equipment used for the UT inspection of the pipe weldment specimen. The UT equipment used in this study digitalized the ultrasonic data so that it could be displayed on a laptop where a developed UT program was installed.
In addition to the ultrasonic testing system, a total of 18 types of ultrasonic testing probes or transducers were used to acquire the ultrasonic A-scan data. The ultrasonic transducers were made by three different companies, Krautkramer, GE, and Olympus. Each type of transducer included three angles of incidence, 45°, 60°, and 70°. Table 1 shows the probes used for the acquisition of the ultrasonic A-scan data.

2.3. Denoising Autoencoder

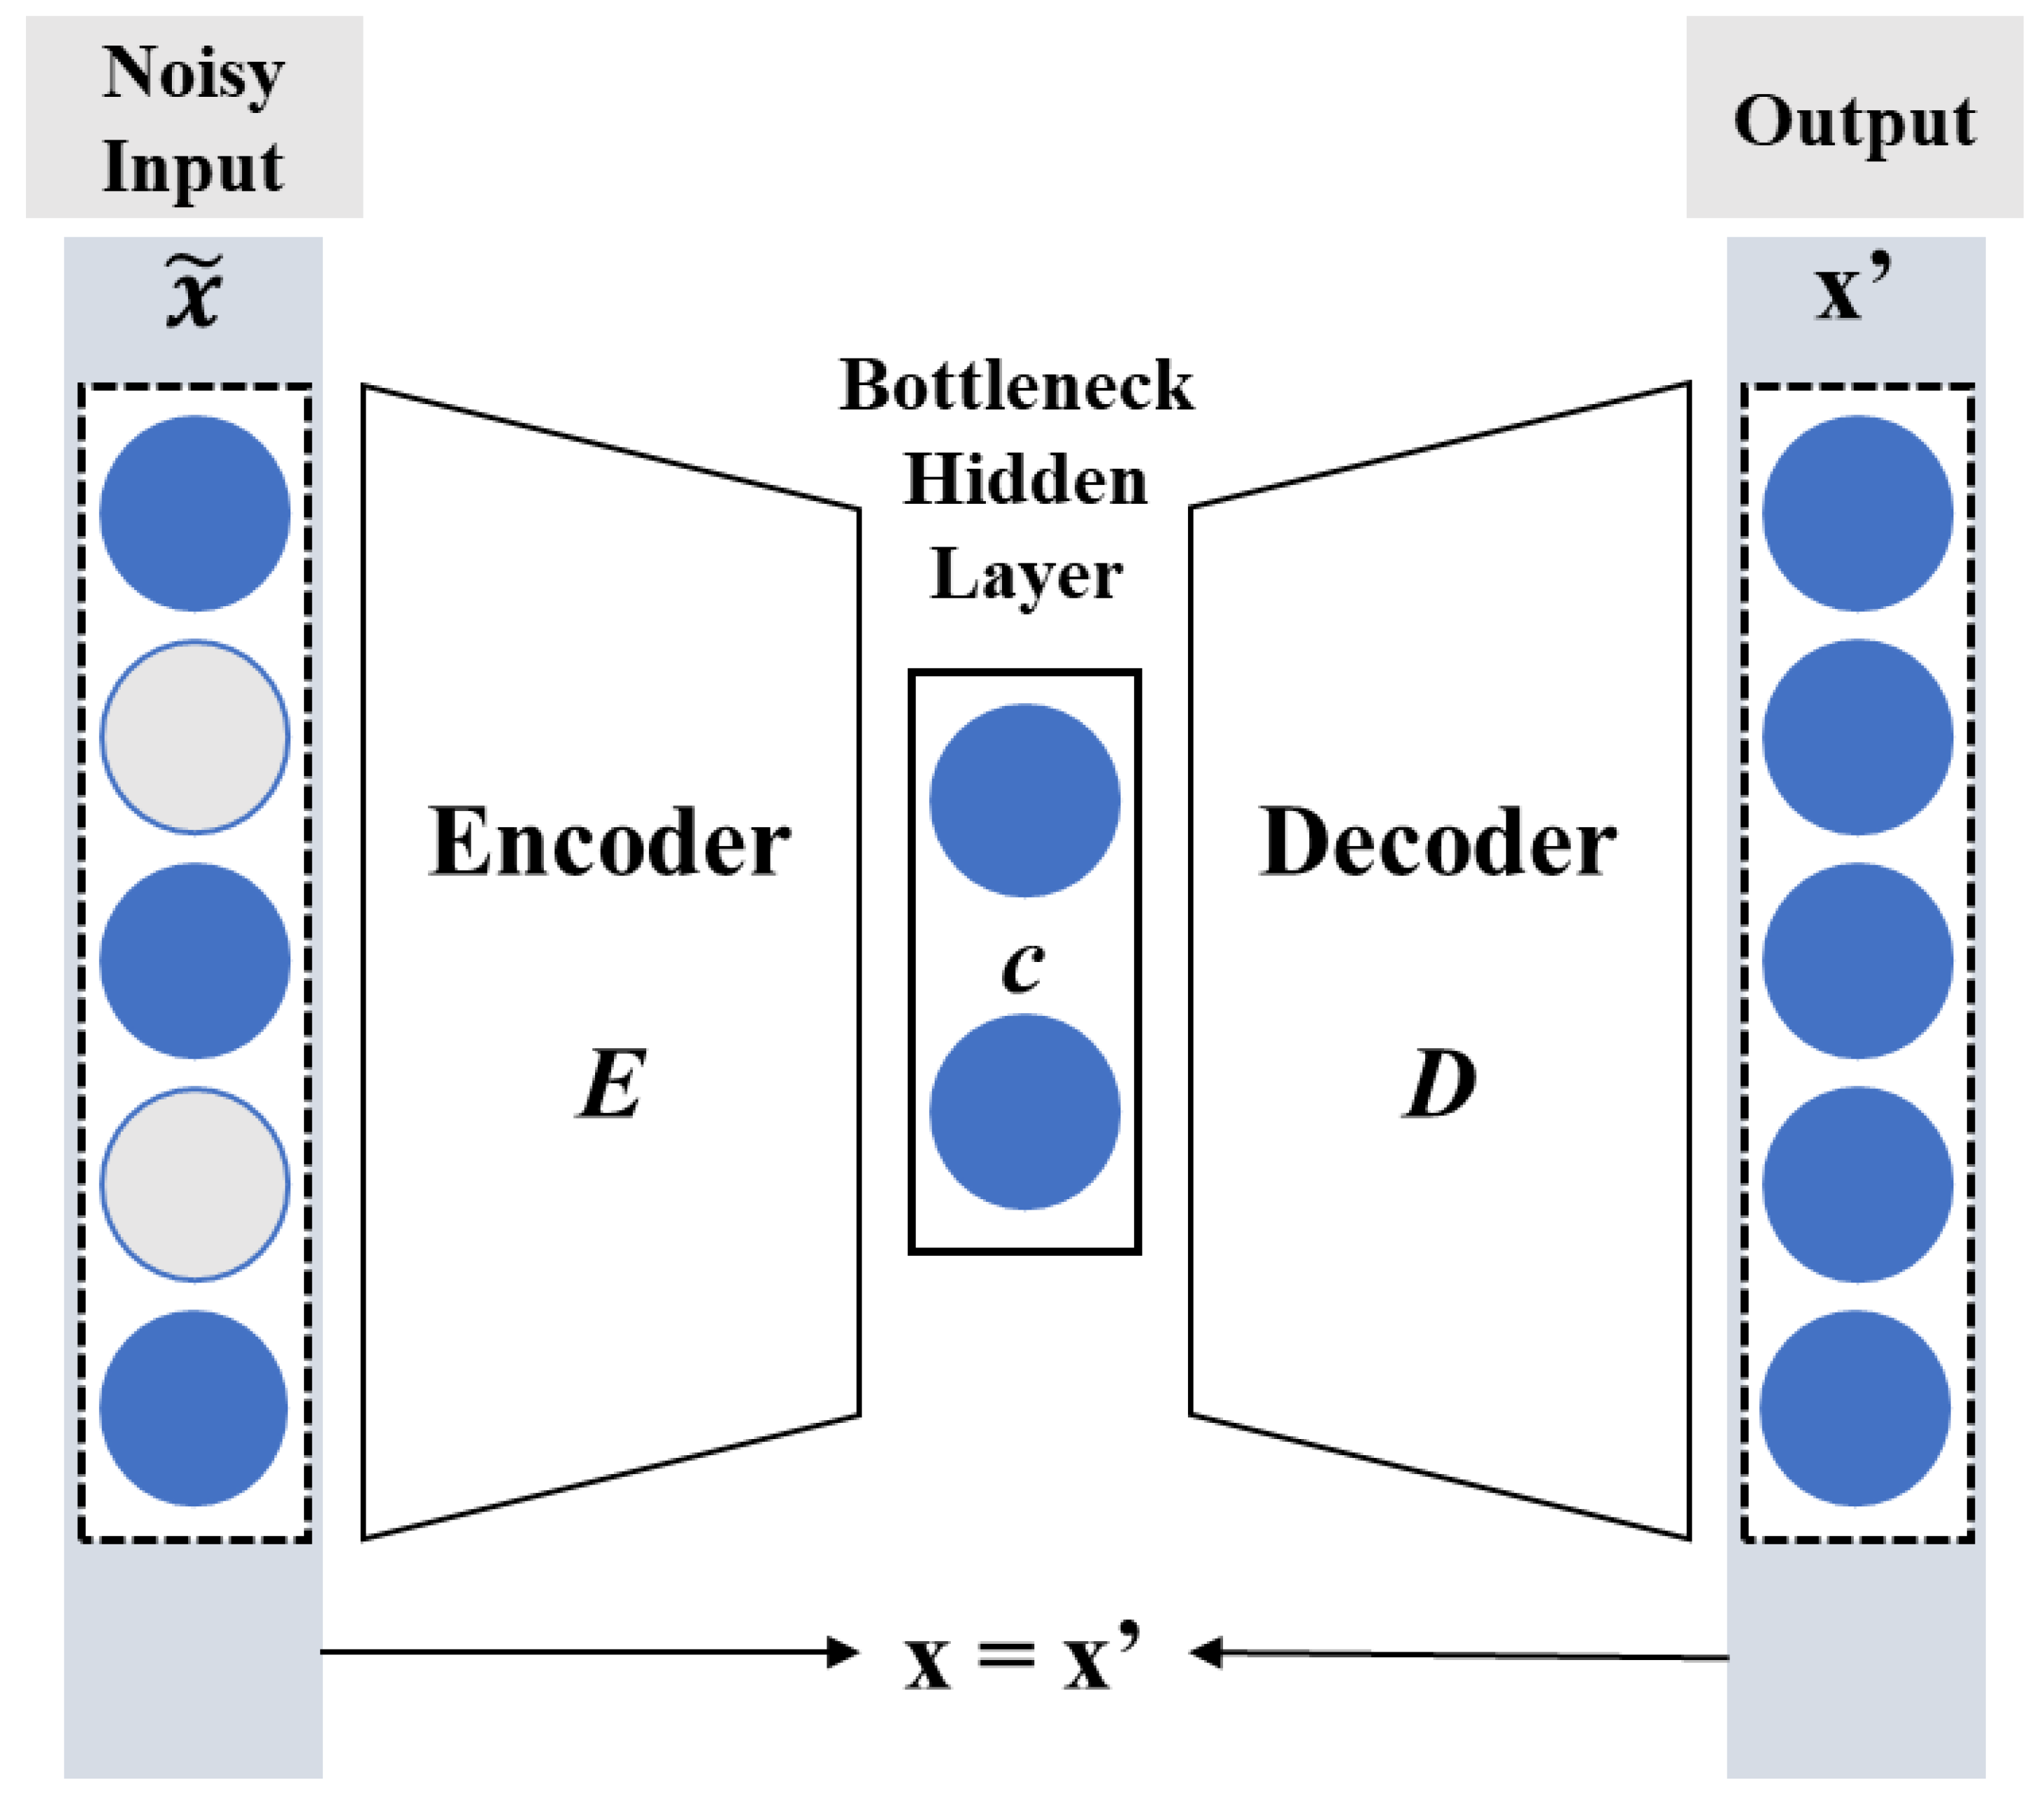
Autoencoder is a type of ANN that reconstructs the network inputs referring to its features. Most of the time, the autoencoder is used for dimension reduction and feature extraction. The overall goal of an autoencoder is to enable the network to learn how to reconstruct input data so that the reconstructed output is equal to the input. After the encoding process by the encoder, the latent space of the autoencoder learns the input features. After decoding in the decoder, the network reconstructs the input based on the features learned in the latent space.
The autoencoder explained above is prone to the risk of overfitting since it aims to reproduce or reconstruct the outputs from the inputs [10]. DAE is a derivative of many autoencoder techniques and is more robust than the ordinary autoencoder technique and can be used for correction of errors. It introduces random noise to the original input, and the noisy input becomes the new input and goes through the encoder so that the features of the input are learned or encoded. In the decoder, the non-noisy version of input is reconstructed by the features of the noisy input. Then, the loss is calculated by comparing the output to the original input without noise, and it is expected to reconstruct the clean input that does not contain the random noise. Suppose that there were two types of inputs, x , the non-noisy signal, and x ˜ , the noisy signal. In DAE, the encoder, as the x ˜ is compressed, tries to map the features of x ˜ to the latent space and the decoder reconstructs the non-noisy version of x ˜ which in this study is referred to as x . Then, the mean square error (MSE) between x and x is calculated. As the MSE decreases, the x becomes similar to x . Figure 4 schematically illustrates the architecture of the DAE. Equation (1) shows the mathematical expression of denoising process [11,12].
D e n o i s i n g x ,   x = m i n i m i z e M S E x ,   x ,
Further details of DAE can be found in Refs. [11,12,13,14].
The ordinary DAE extracts the features from the noisy input x ˜ . The features of the noisy input are saved in the bottleneck hidden layer, and the decoder reconstructs the signal with the saved features. Then, the output, which is the reconstructed input by the DAE, is compared to the validation (the original signal without noise) and the loss is calculated. The DAE learns to decrease the loss, and after sufficient training, the output should look like the original input. Nauman et al. [11] used this ordinary denoising autoencoder to denoise and classify various types of flaws with different noise levels.
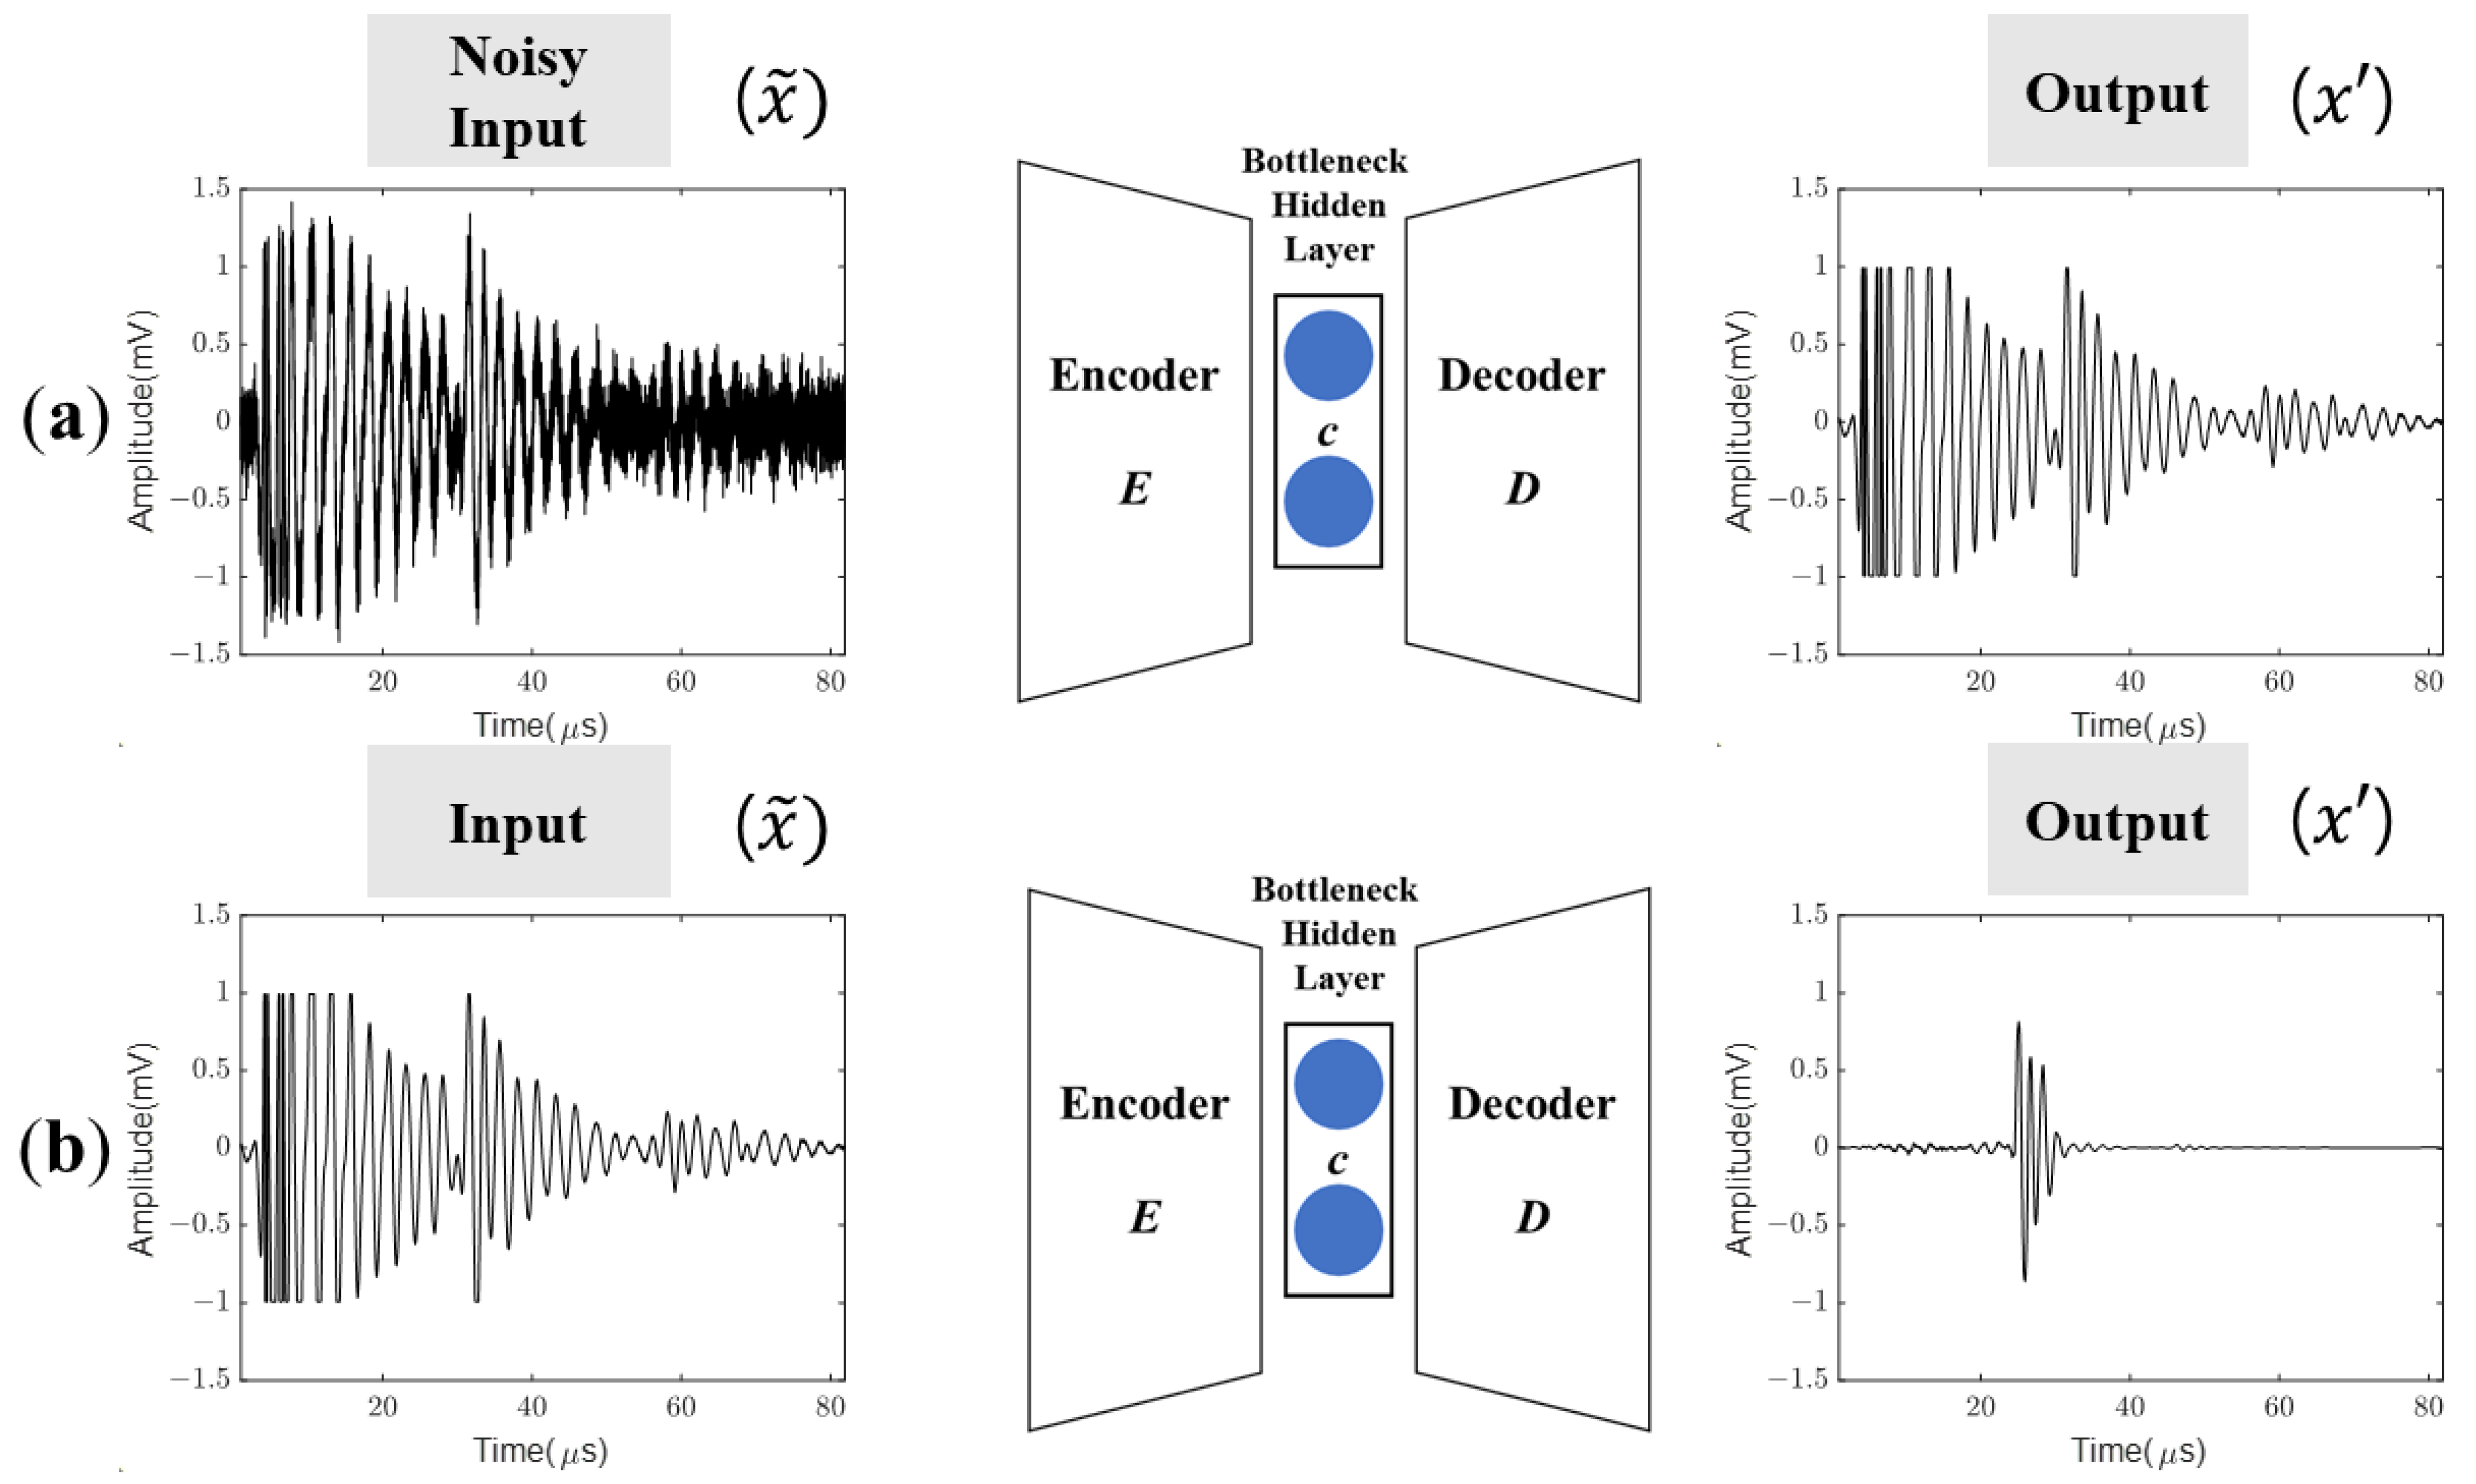
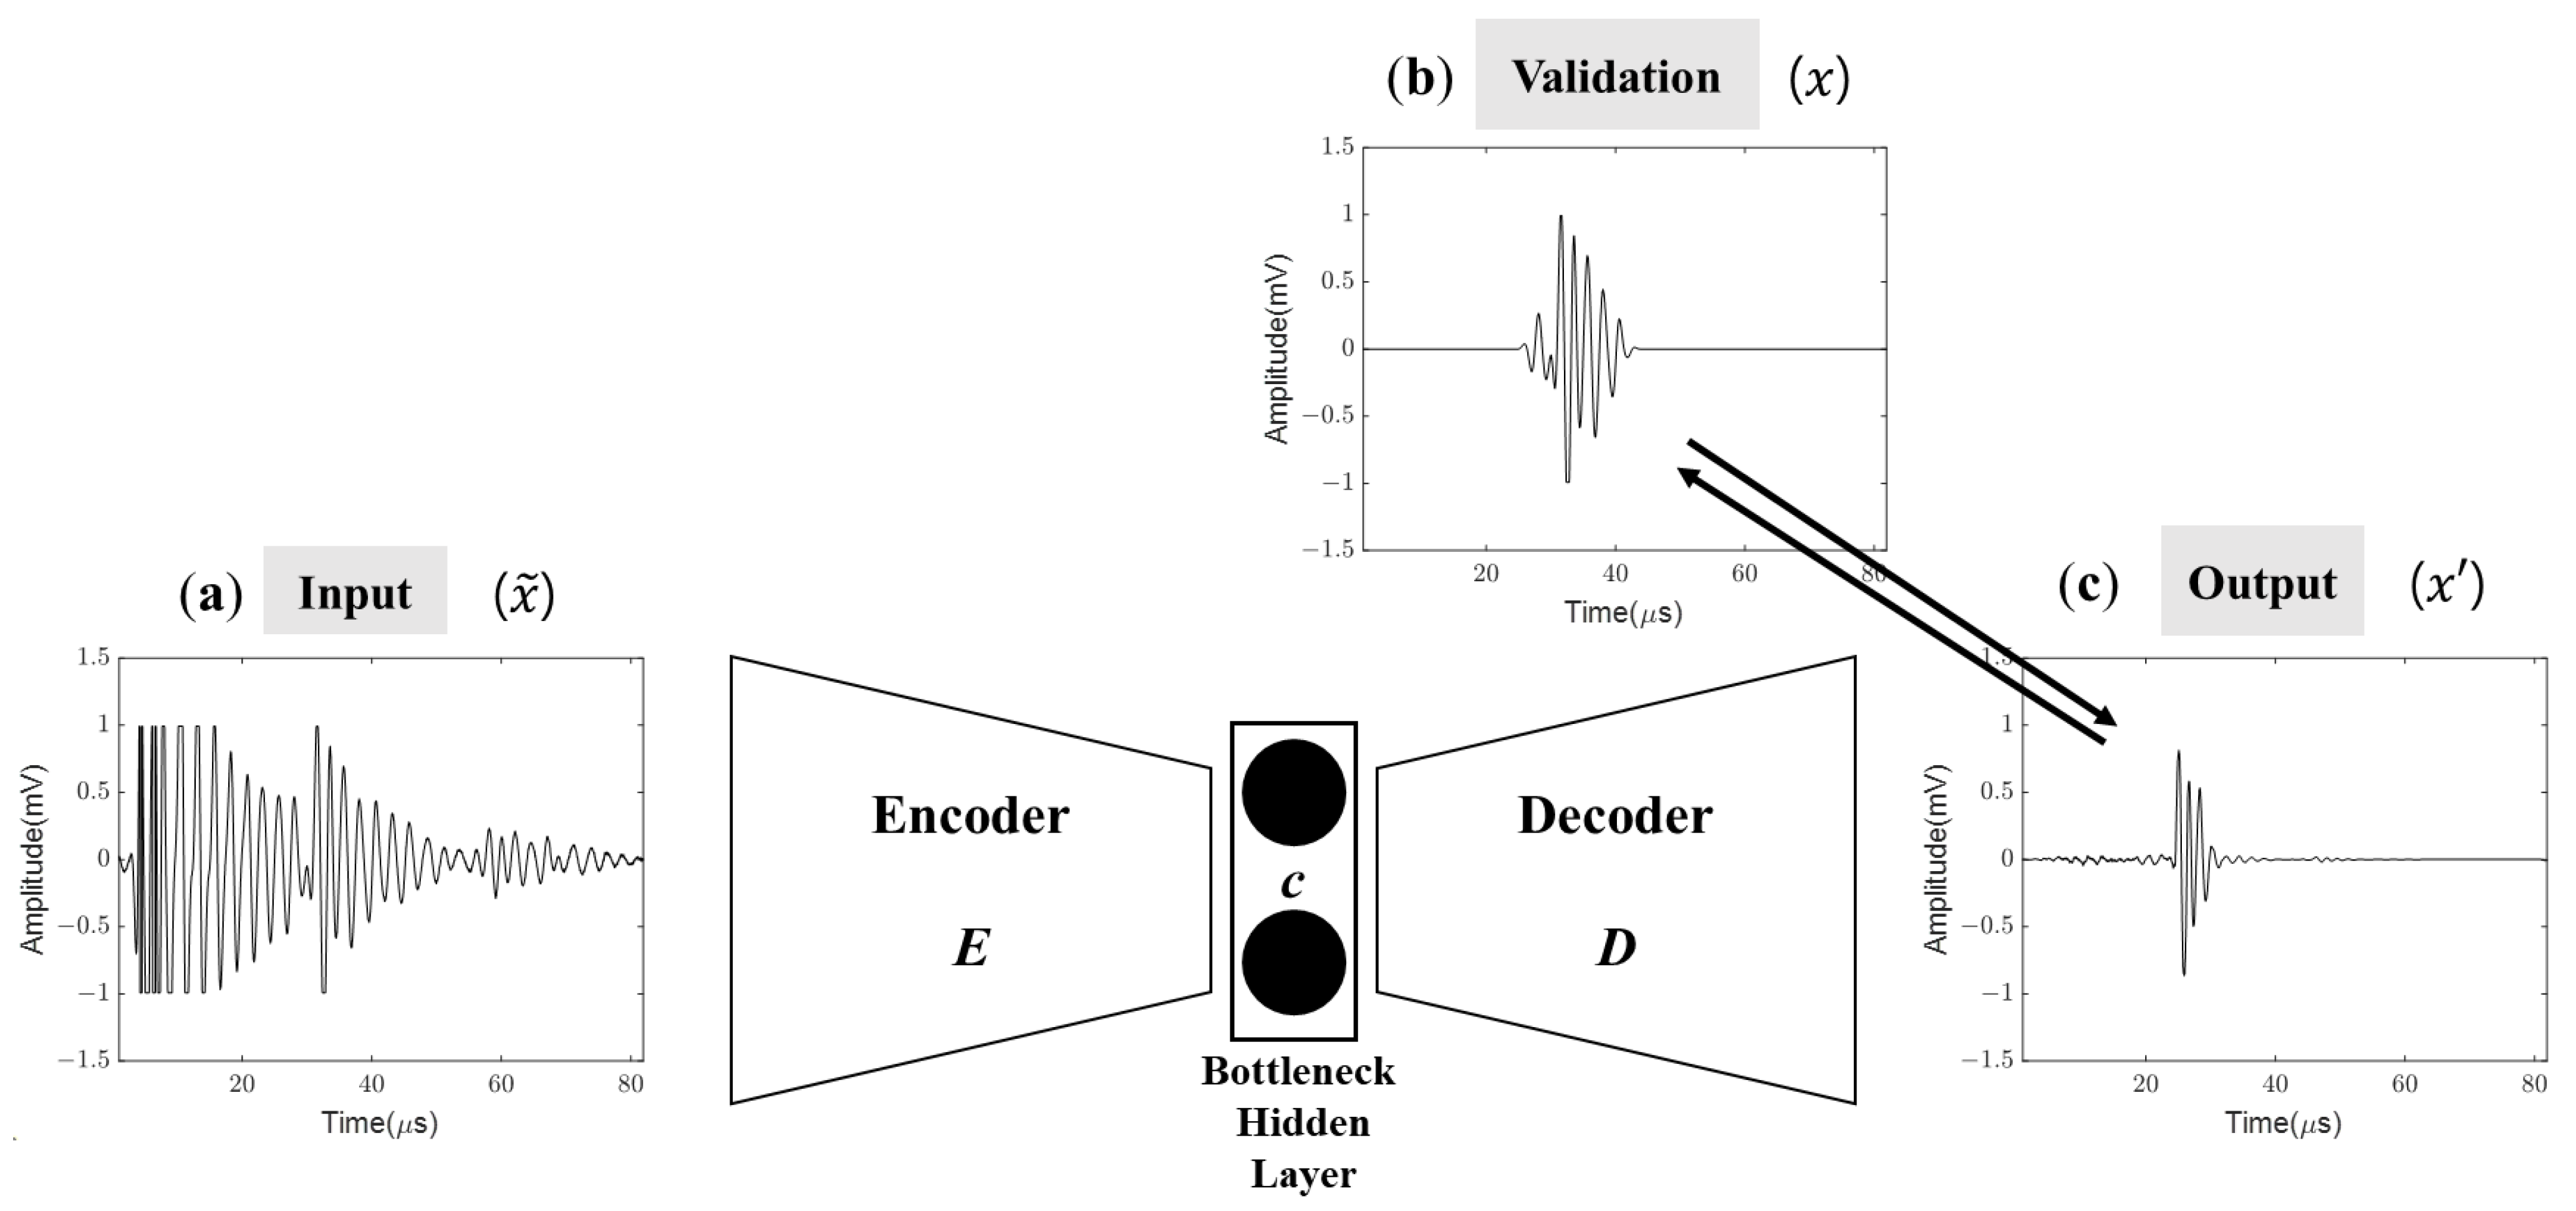
In this study, however, we utilized the characteristic of decoder, which compares the output to the validation. We used the original mixed A-scan signal as the corrupted input x ˜ , and the algorithm tried to reconstruct the non-noisy flaw signal from x ˜ . We used the zero-padded flaw signal ( x ) as the validation for calculation of MSE. Figure 5 shows the difference of ordinary DAE and proposed DAE. Also, Figure 6 presents the mechanism used in this study to extract the flaw signal from the mixed signal.
Before passing the input through the proposed DAE, a validation signal should be created from the input so that it can be used to minimize the loss. As explained earlier, the original A-scan signal used in this study is a mixture of the flaw signal and other signals, such as those from the geometrical interfaces. The additional signals are manually zero-padded, referring to the pre-marked gates indicating the location of the flaw during the acquisition of A-scan data. A sample validation signal is shown in (b) of Figure 6. The features of the input are encoded in the bottleneck hidden layer, as with the ordinary DAE. The decoder then uses these features to reconstruct the input and produce the output. The network then compares the output to the validation signal to reduce the mean squared error (MSE) loss. The comparison between the validation signal and output is represented by the arrows across (b) and (c) in Figure 6. As the MSE loss decreases, the output of the proposed DAE becomes more similar to the validation signal, and the DAE learns to extract the flaw signal.

3. Ultrasonic Signal Database

3.1. Database Construction

The ultrasonic A-scan data were acquired using the equipment and ultrasonic transducers introduced earlier. A total of 2463 A-scan flaw signals were acquired and used to create a database of various A-scans acquired from standard block specimens. The database is organized by the type of flaw each A-scan includes, with 630 different crack signals, 378 different lack of fusion signals, 623 different slag inclusion signals, 344 different porosity signals, and 488 different incomplete penetration signals. The number of flaw signals acquired from the standard block specimens using UT is presented in Table 2.
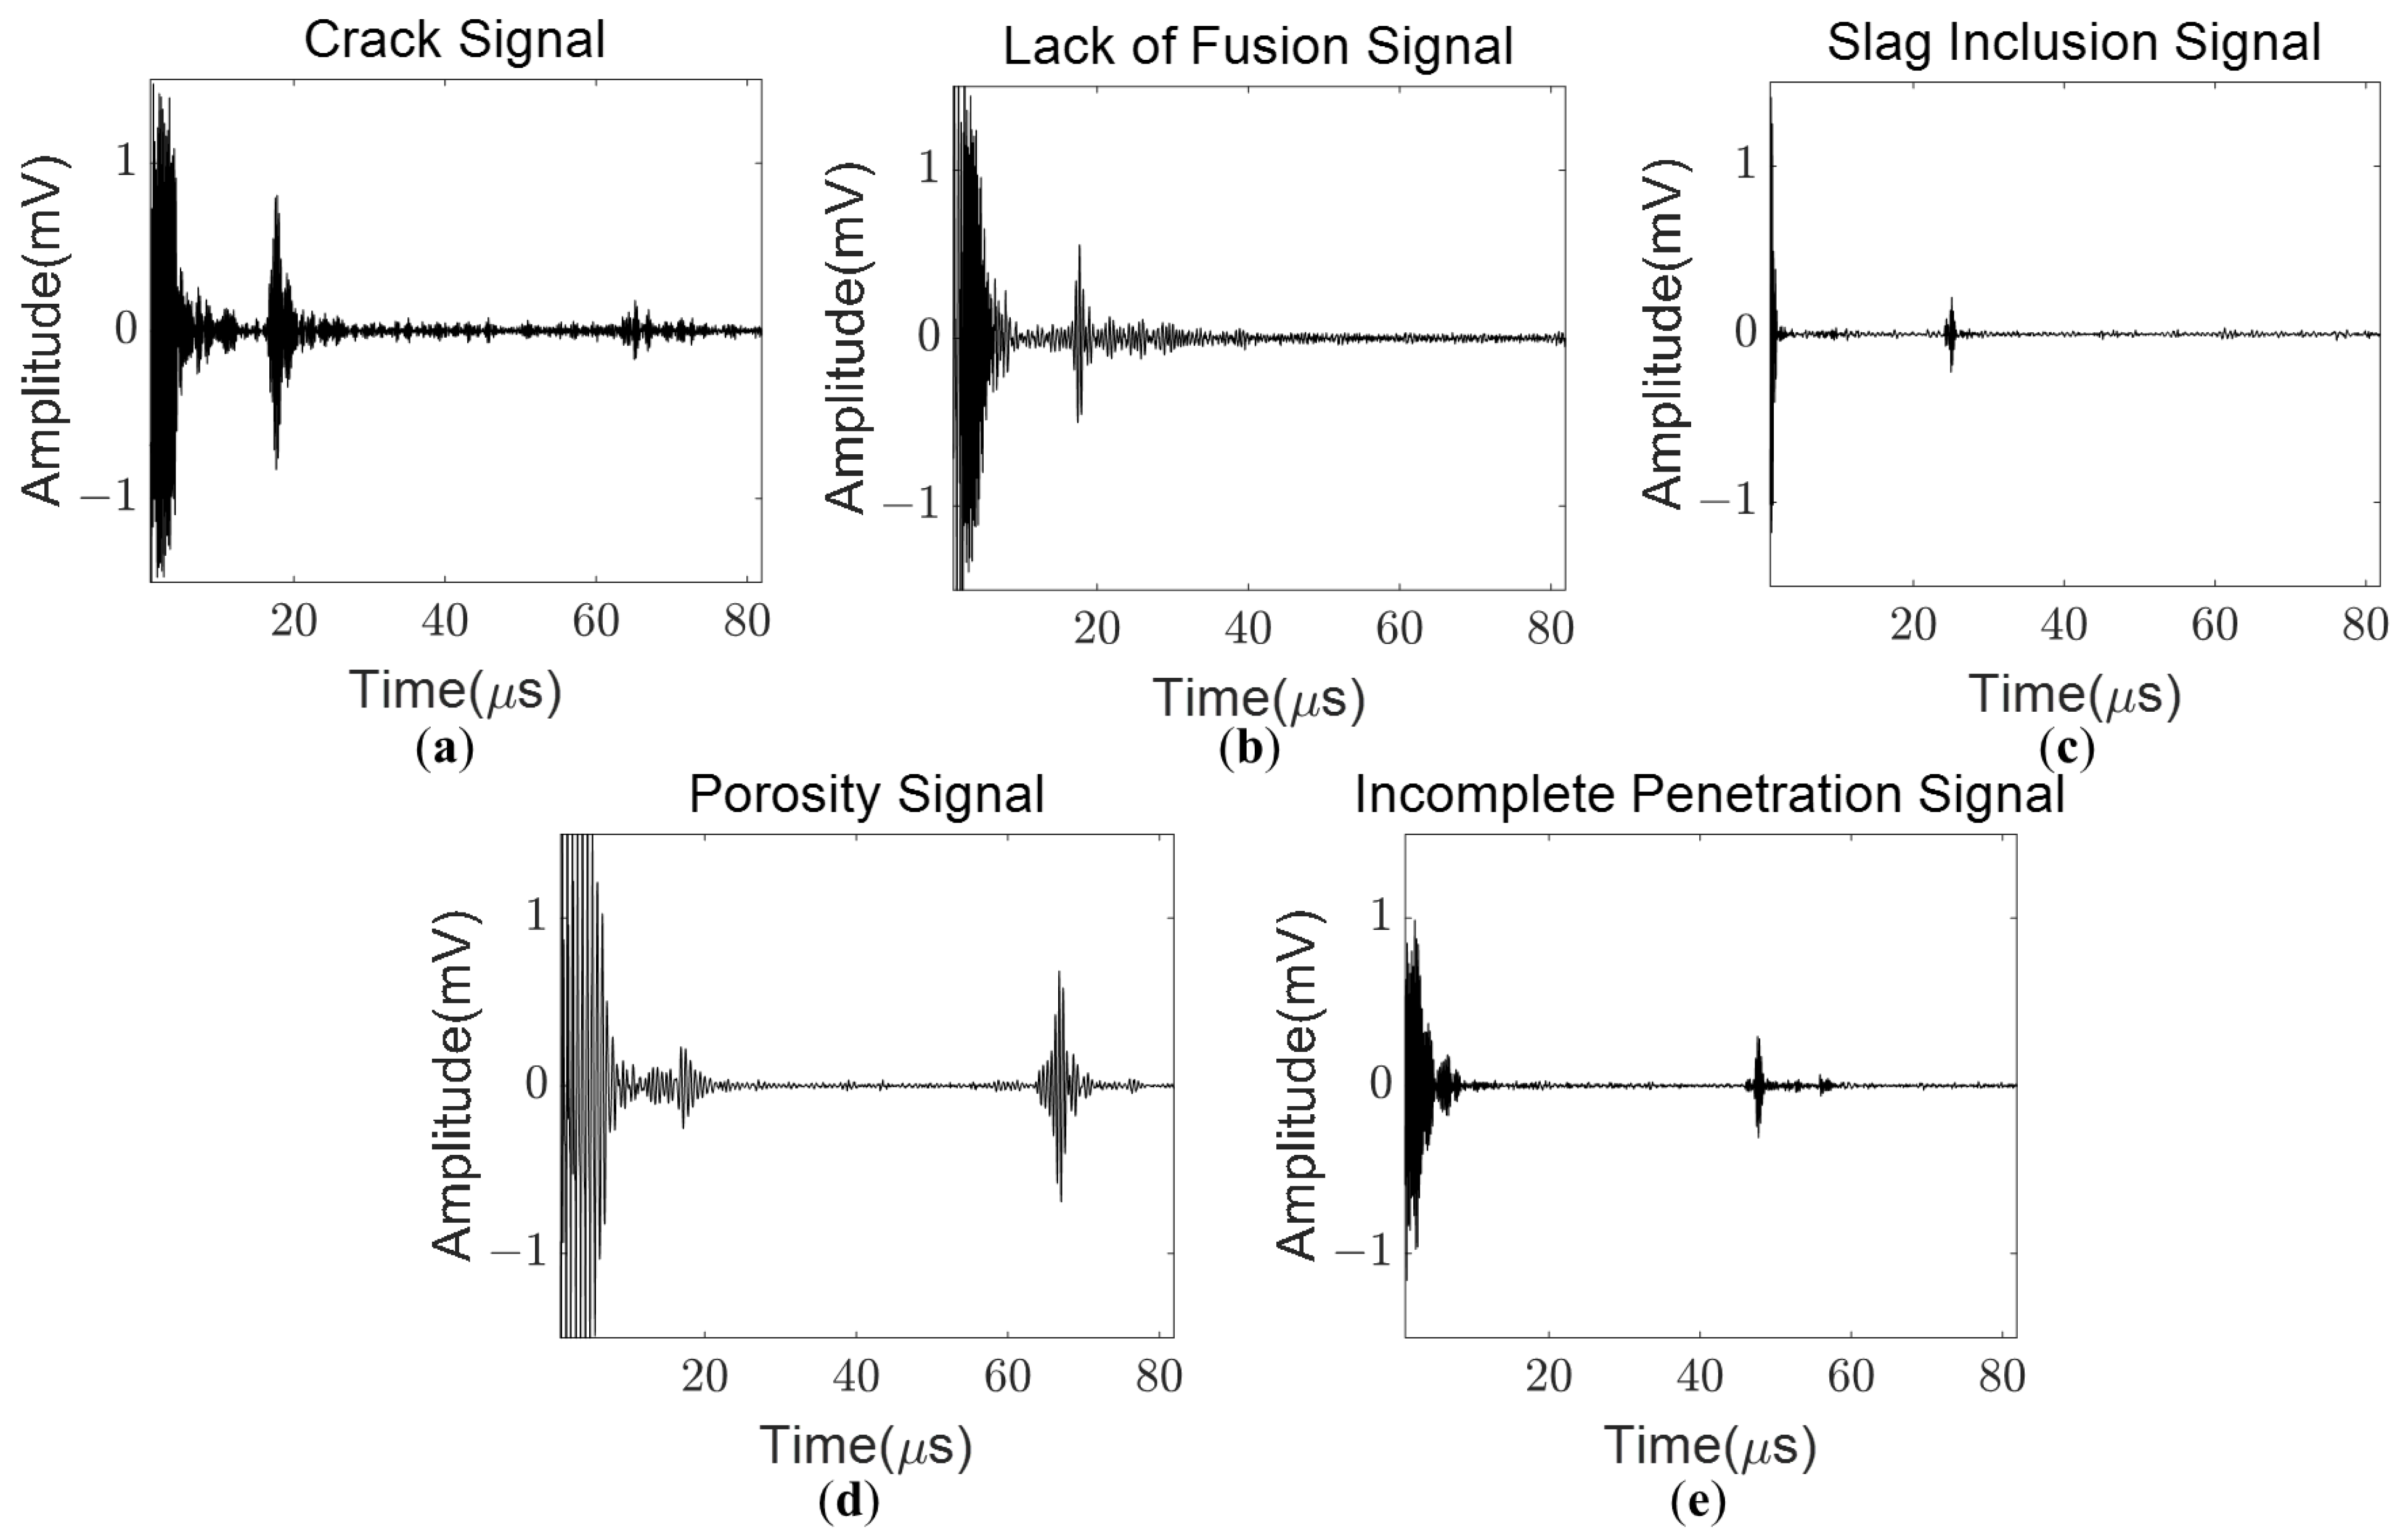
All 2463 A-scan signals consist of a mixture of the background signal from the weld interface and internal geometry, as well as the flaw signal. Figure 7 displays the mixed ultrasonic A-scan data for each type of flaw. During the acquisition process, the gates where each flaw signal is located in the mixed signal are marked. To train the DAE, the background signals for all 2463 data points were zero-padded based on the previously marked gates.
Figure 7 illustrates the five types of flaw signals used in this study, which are typical flaws in weldments. (a) Shows the typical crack signal in welding obtained by UT, which is the most fatal type of flaw that could occur in welding. (b) Presents the conventional lack of fusion signal in welding obtained by UT. (c) Shows the ordinary slag inclusion signal in welding obtained by UT. (d) Displays the typical porosity signal in welding obtained by UT, which is often difficult to evaluate as the amplitudes are relatively low. (e) Presents the typical incomplete penetration signal in welding obtained by UT. Flawless signal samples are not included as they do not contribute to the network’s goal of flaw signal extraction.

3.2. Neural Network Architecture

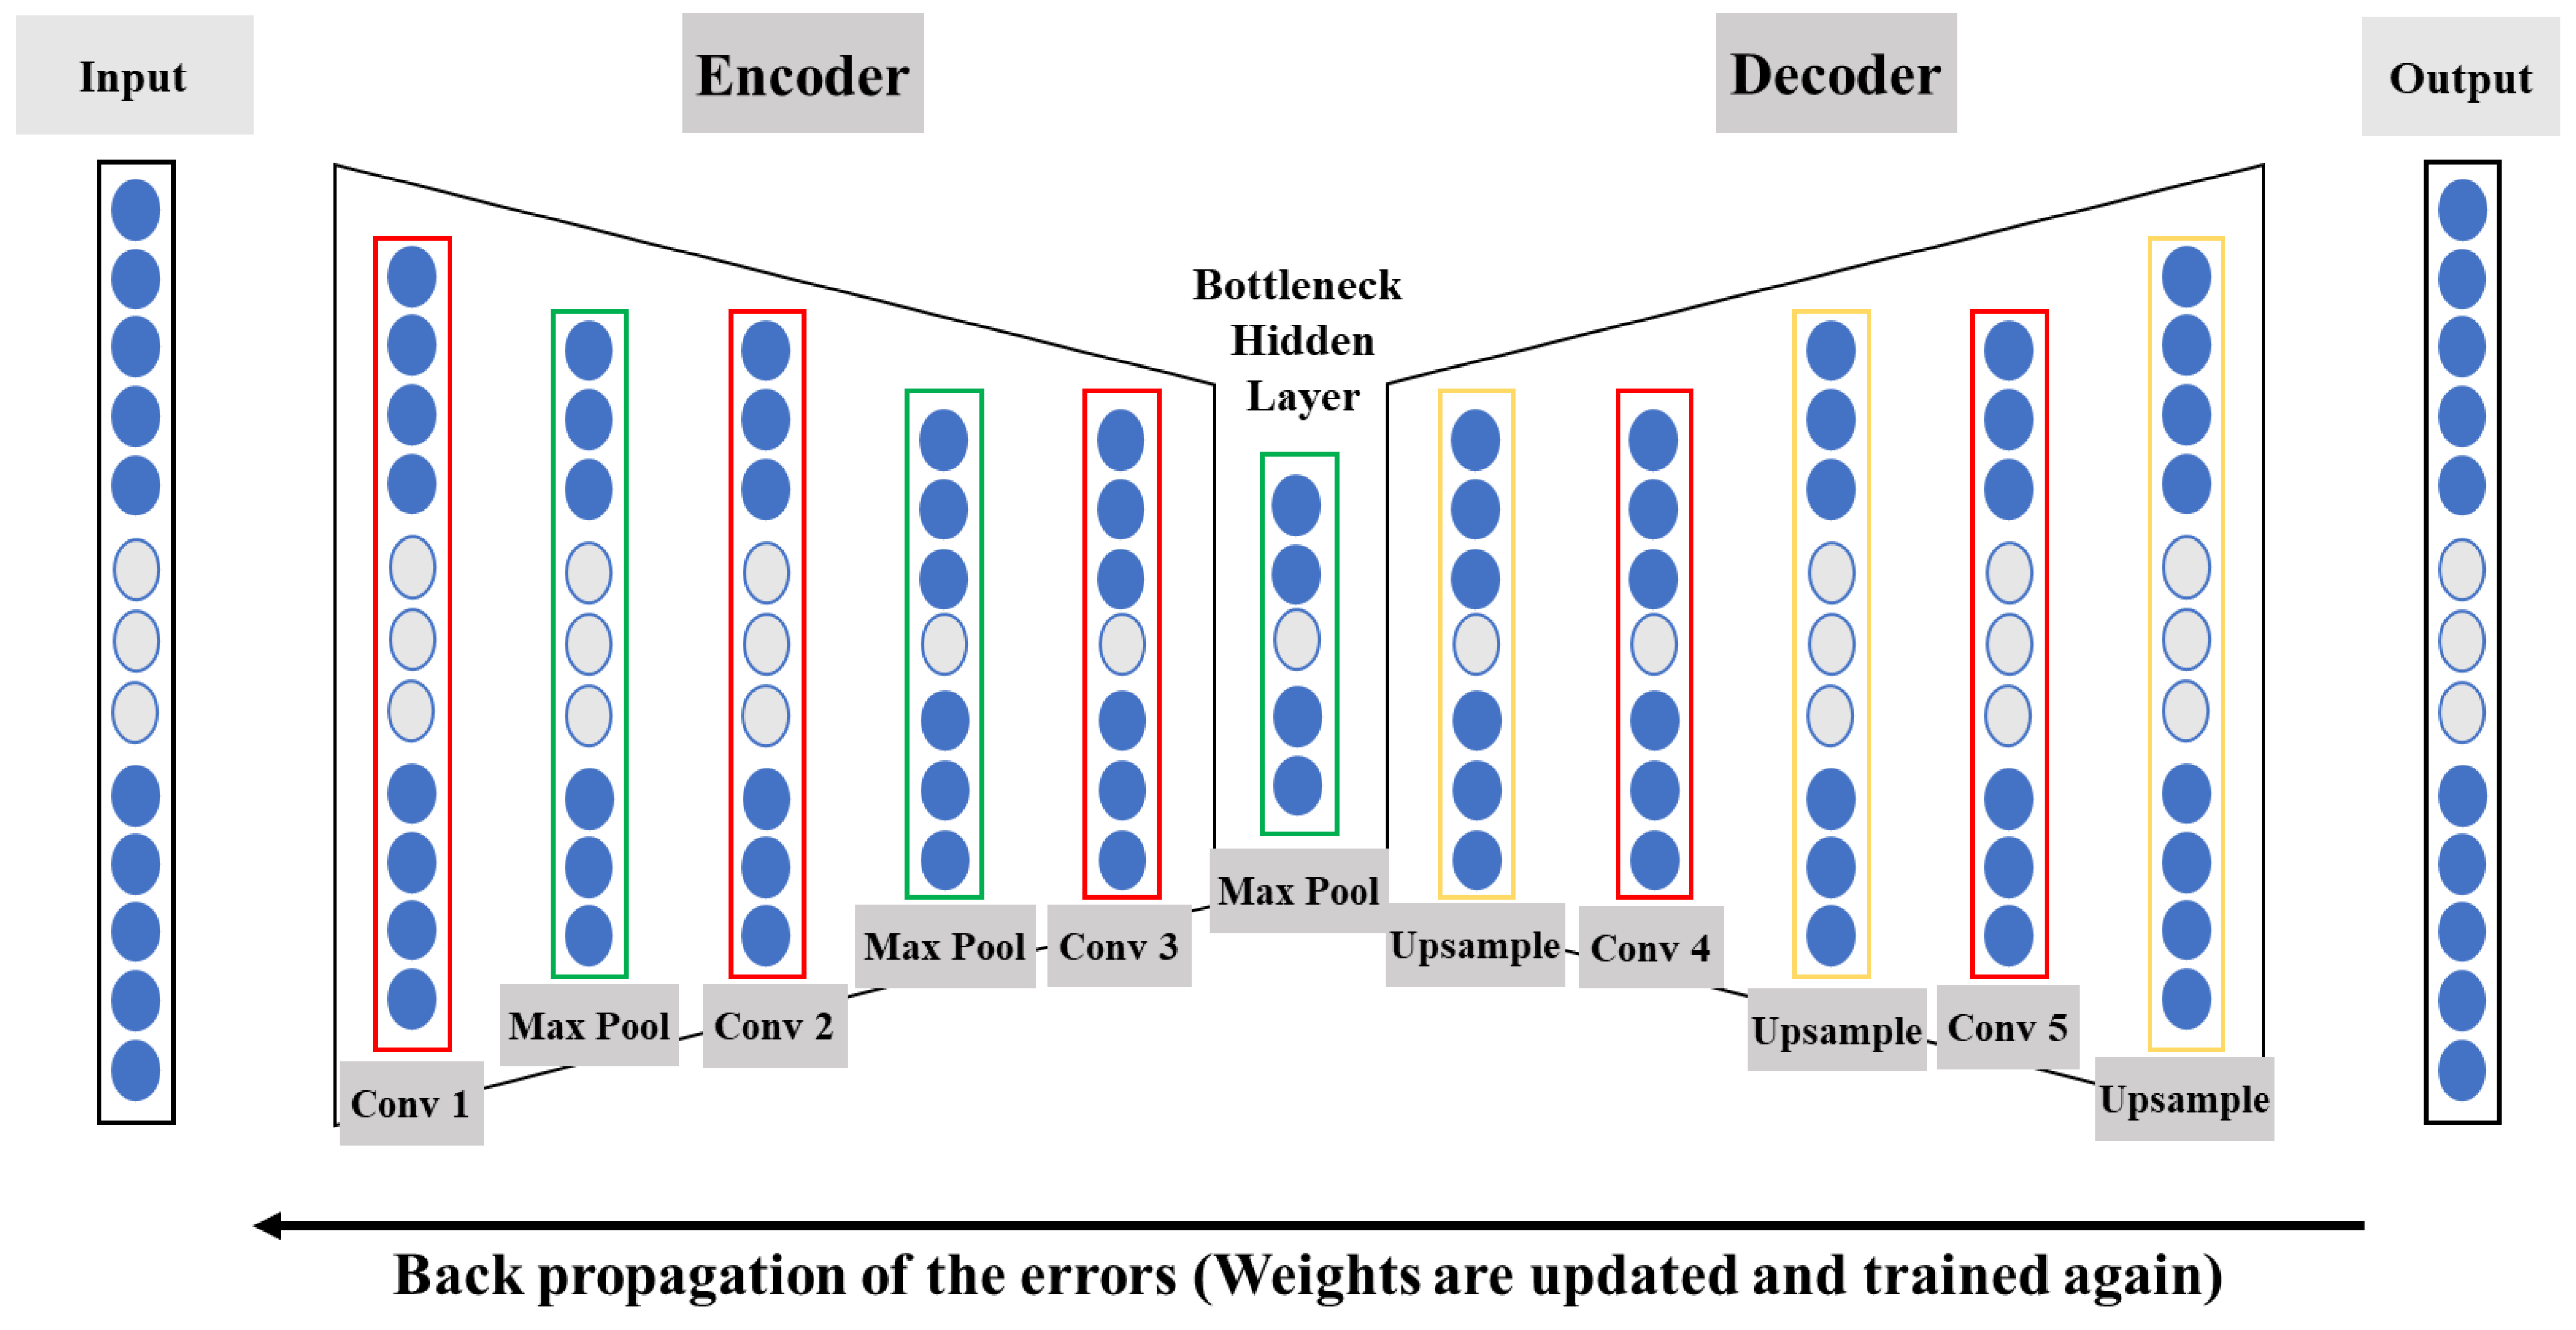
To implement 1-D A-scan flaw signal data into the neural network, a DAE was designed and modified. The DAE was designed in Keras of Tensorflow, an open-source deep learning software by Google. The algorithm included an input layer with the same number of nodes as the sampling point of the given signals, i.e., 4096. Next, the encoder with three convolutional layers and two max pool layers follows. The max pool layers are in between the first, second, and third convolutional layers. The bottleneck hidden layer as known as the latent space was designed with the max pool layer where the number of points of input is compressed to 512 points. Then, the decoder has two convolutional layers and three up-sampling layers. Through the decoder, the output becomes the same size as the input. For learning complex relationships of data, the rectified linear unit (ReLU) is used as an activation function for adding nonlinearity to the network [12]. Then, the mean square error is used for the calculation of loss between the reconstructed output and the zero-padded flaw signal that is manually made earlier. Figure 8 shows the training process of the DAE proposed in this study as a diagram. In addition, Figure 9 presents the architecture of the denoising autoencoder. The model is saturated at the 45th epoch. The dropout technique is added to the overall procedure of encoding and decoding because even though the denoising autoencoder is more robust than the ordinary autoencoder, there still exists a risk of over-fitting.

4. Results and Discussion

4.1. Performance of the Proposed DAE

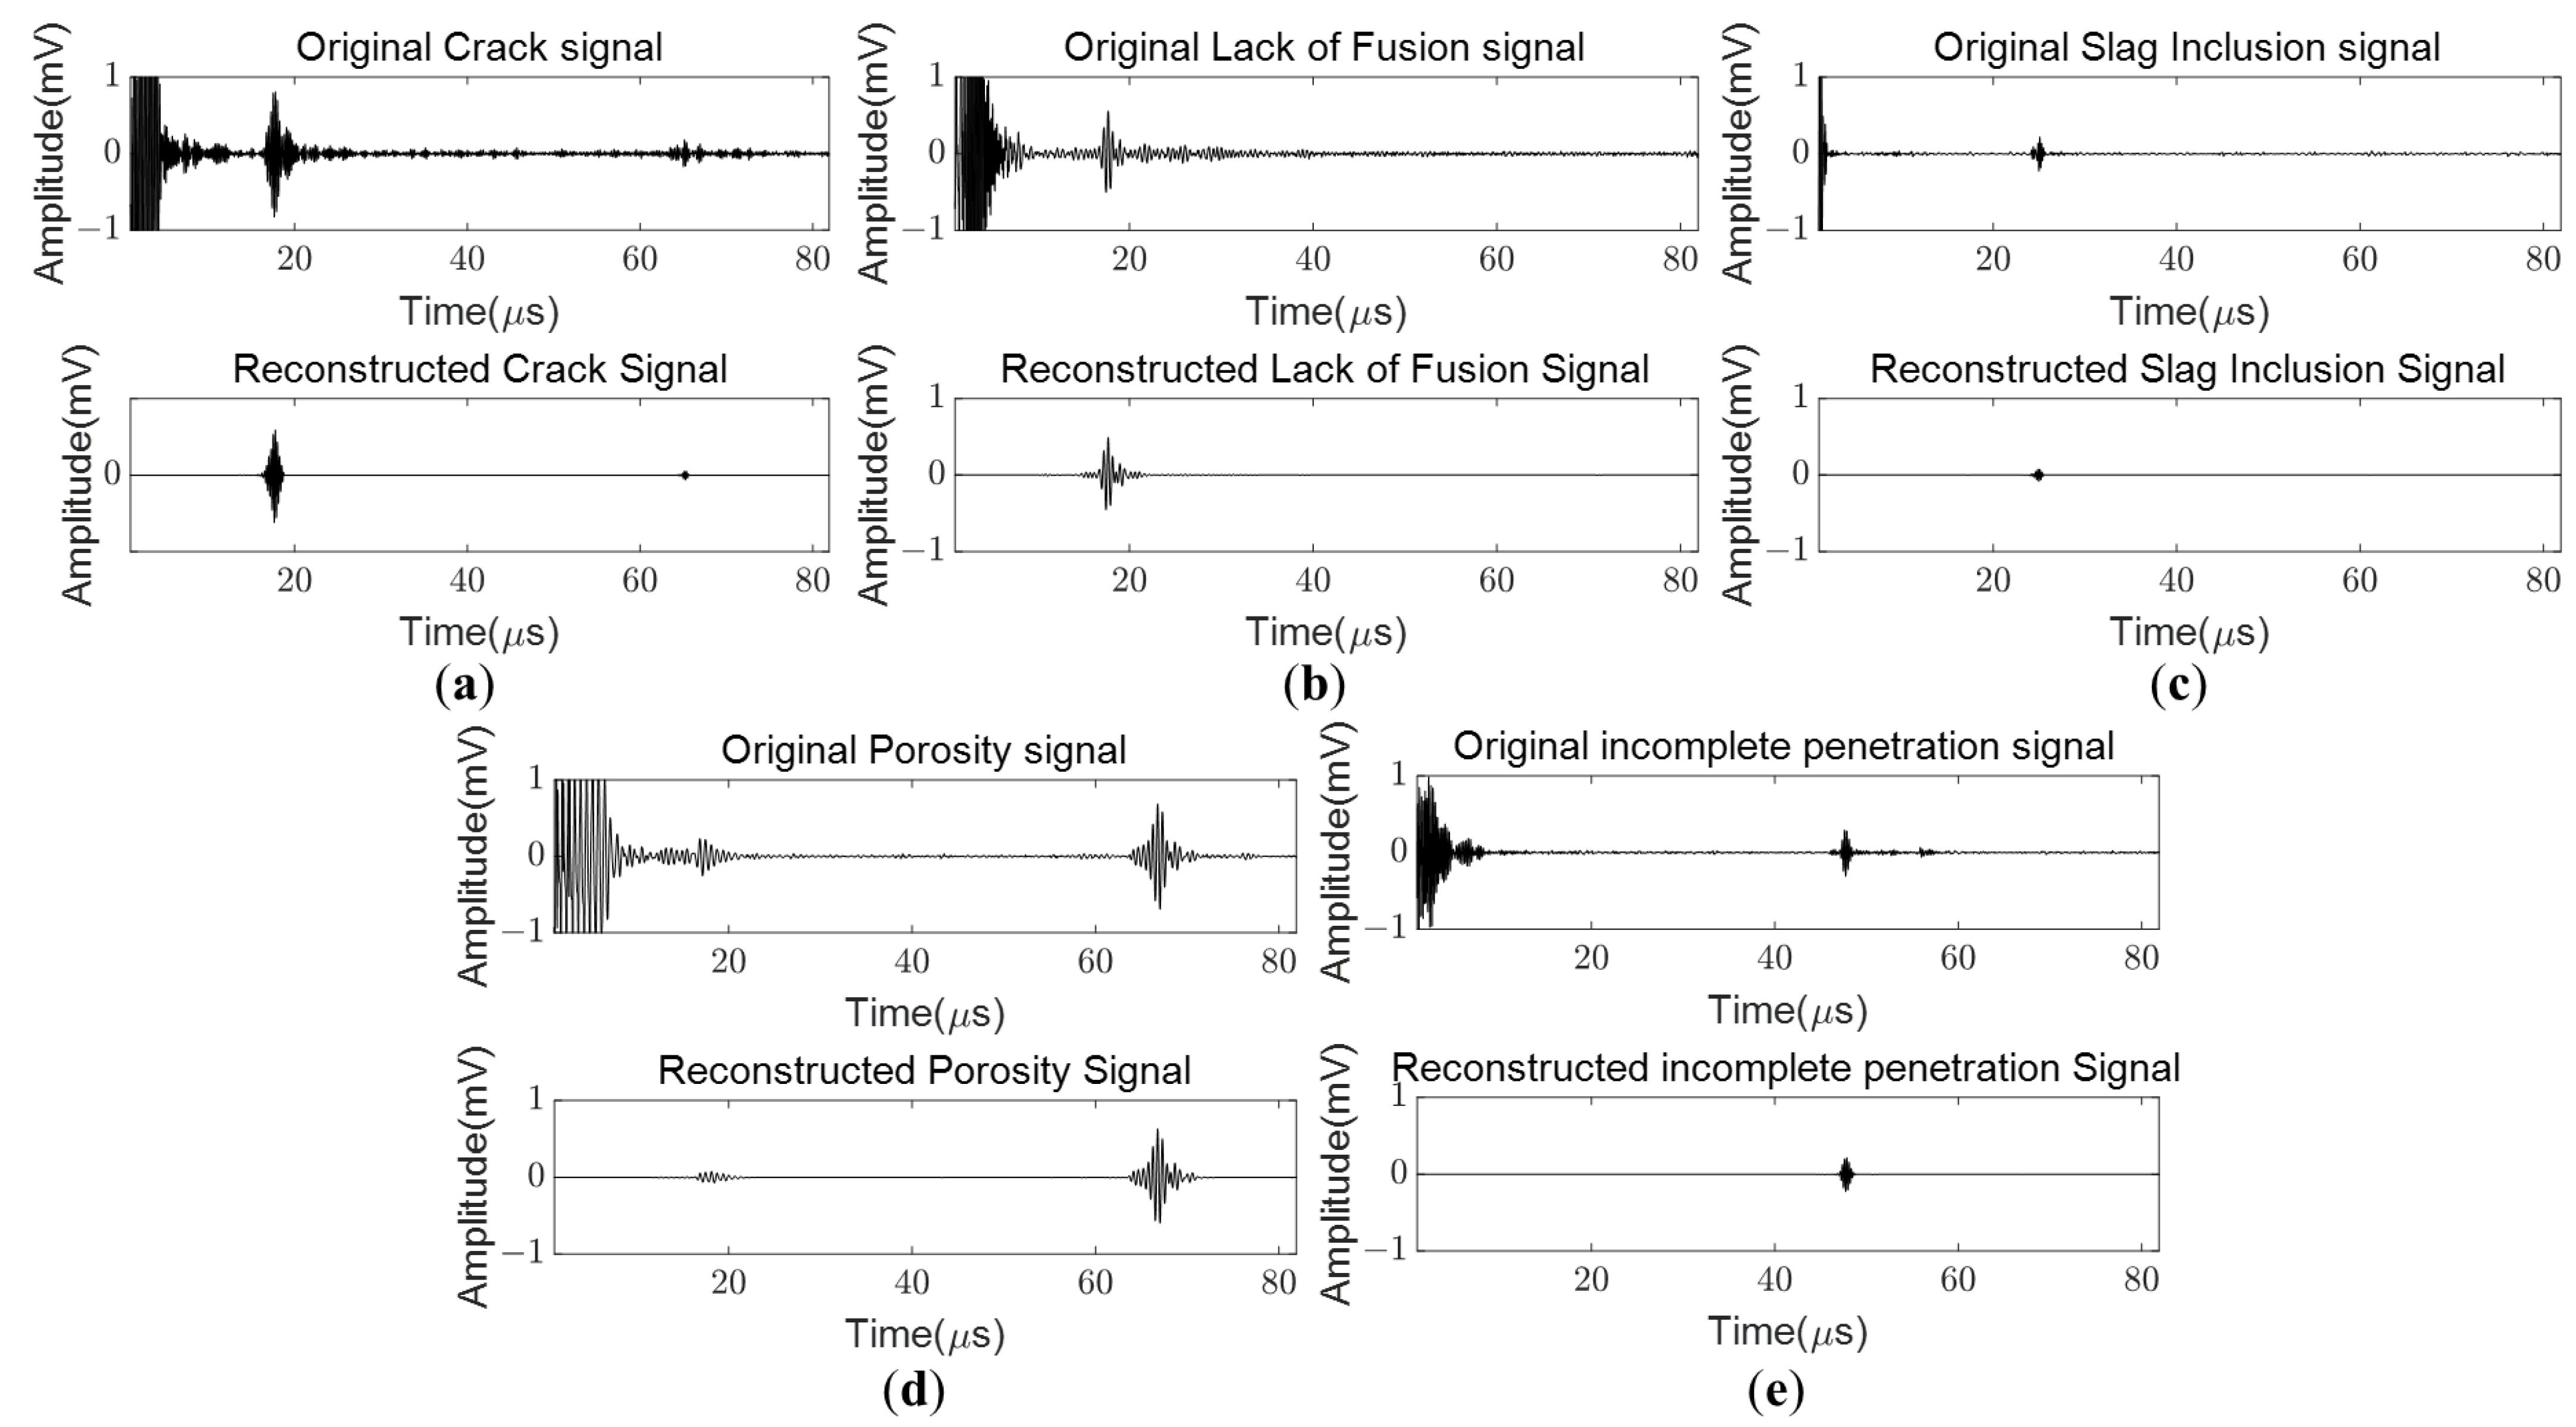
At training, the loss of the model started as 0.0019, but it is saturated at the 45th epoch to 0.0005 and it is early stopped at the end of the 50th epoch. After the training, 1000 mixed ultrasonic A-scan signals were used to test the performance of the DAE. Figure 10 shows some samples of the testing signals and the flaw signals extracted from the mixed signal via DAE. The upper signals of Figure 10 are the mixed A-scan signals that are named the original signals, and the bottom signals are the flaw signals that are extracted from the original signals via the DAE used in this study.
The flaw signals extracted from the original signals share some similarities. The amplitudes of the reconstructed flaw signals are reduced compared to those of the original signals, and some of the extracted flaw signals still contain remnants of the background signals beside the flaw signal.
To evaluate the extracted signal, a point-by-point comparison method is suggested. The validation dataset is zero-padded according to the pre-obtained gates by ultrasonic testing experts, which indicate the location of the flaw. The evaluation method, or point-by-point comparison method, involves subtracting all the data points in two different datasets and averaging the outcome by the number of data points. This helps evaluate the performance of the extracted signal dataset, where the better the performance, the smaller the value will be. Table 3 shows the point-by-point comparison of the extracted flaw signal and the flaw signal zero-padded by the pre-obtained gates.
Table 3 shows the point-by-point comparison of the extracted flaw signals and the zero-padded flaw signals in both training and testing. The training dataset demonstrated better performance, as the average difference value was lower. However, for the testing dataset, the average difference value was not significantly high. The average difference indicates that, on average, the data points have that amount of difference from the original flaw. If there were distortions in the data, the average difference would be much larger, considering the average of the maximum points.

4.2. Discussion

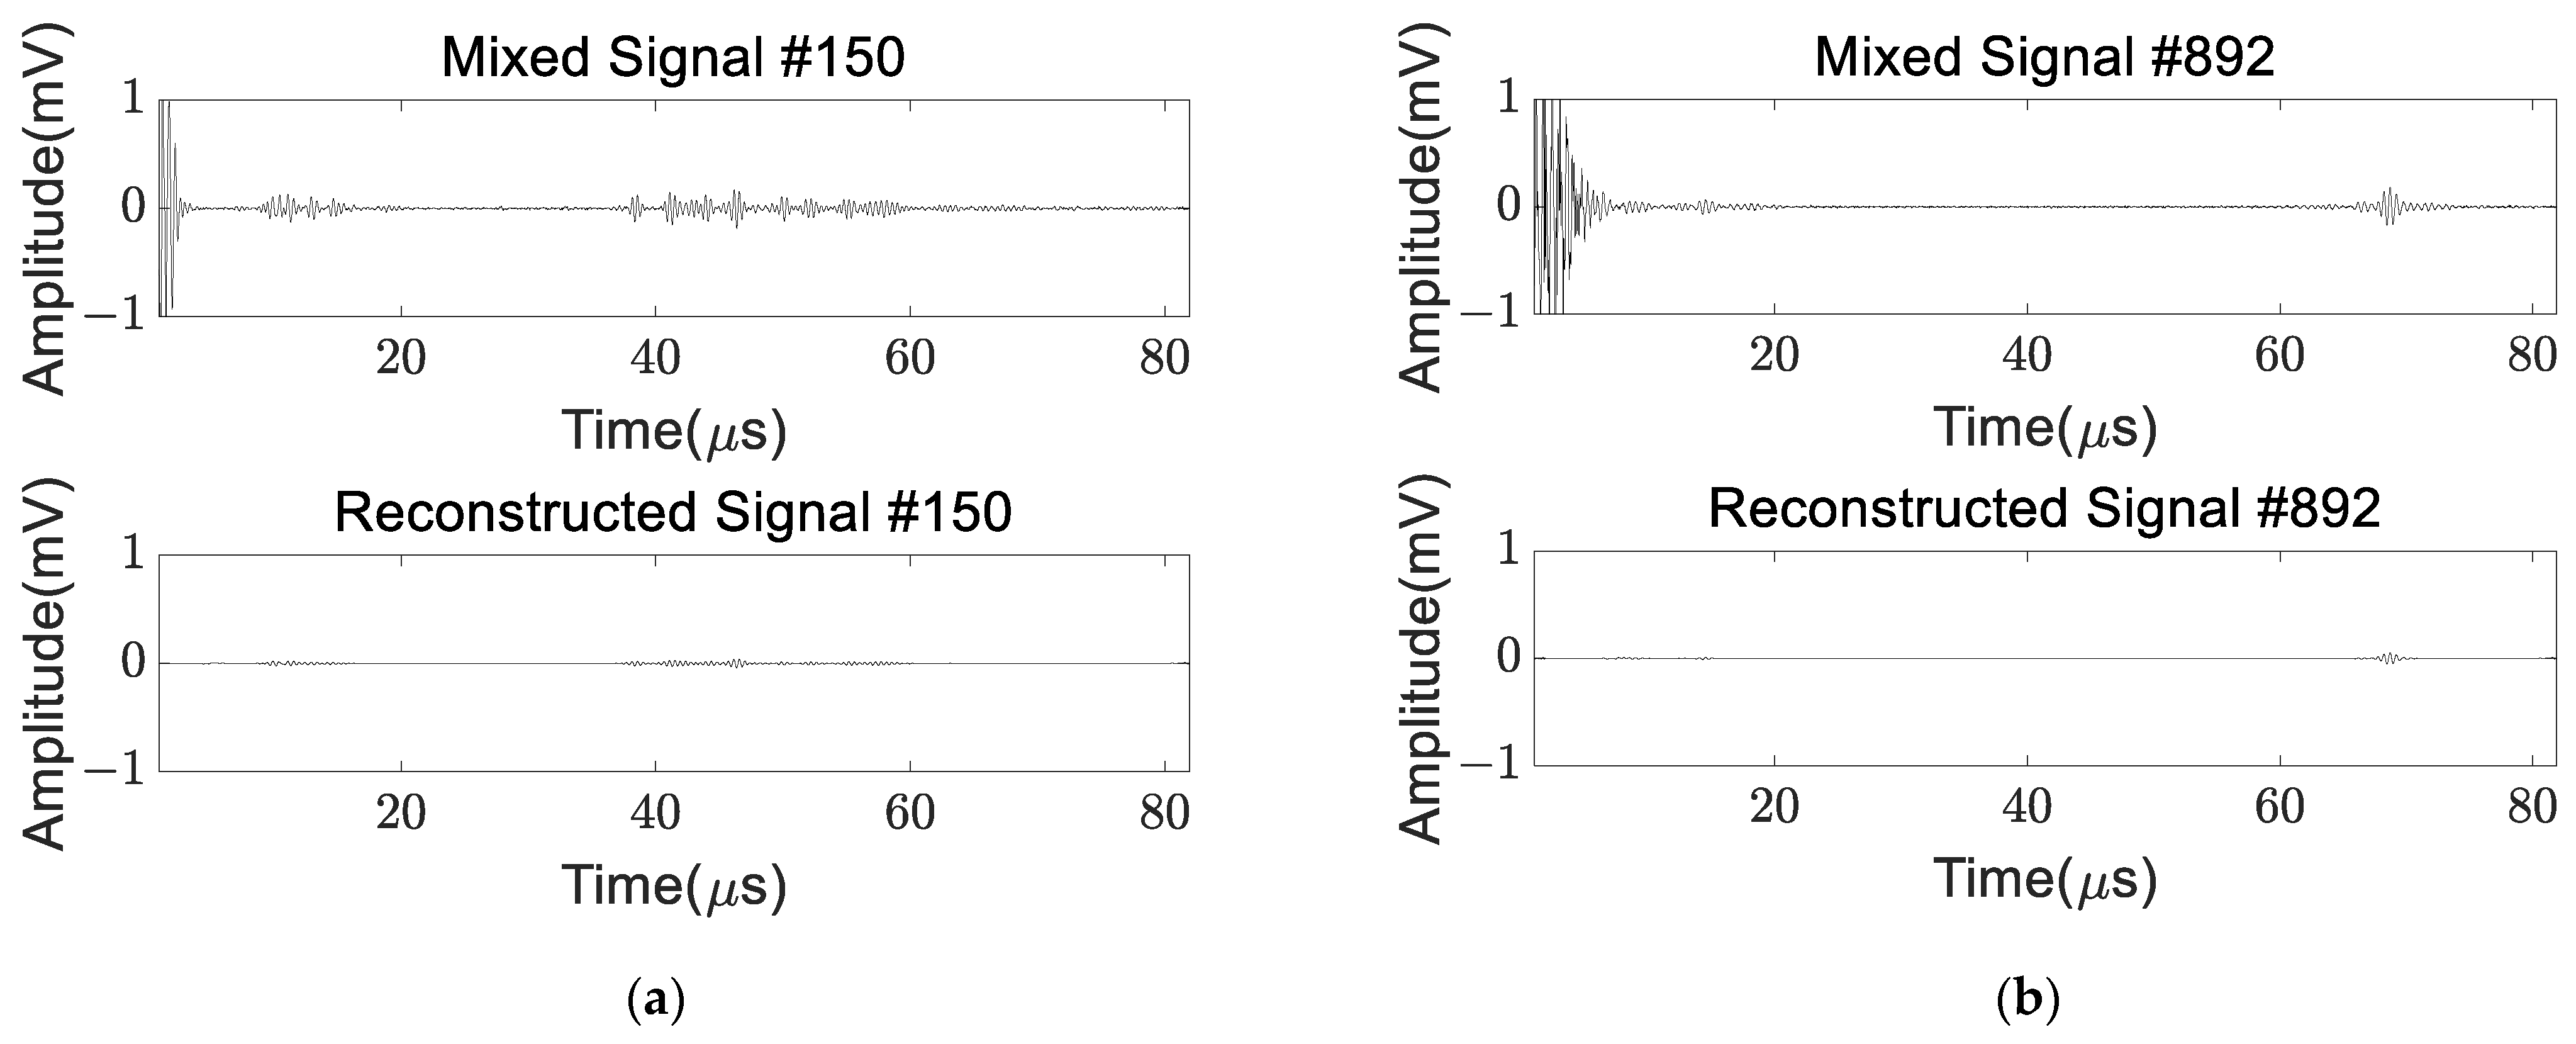
From the testing procedure, it was observed that most of the flaw signals were extracted properly. However, there were some reconstructed signals that failed to extract the flaw signals properly from the original signal. When the amplitude of the target signal is relatively small, the neural network could not extract the flaw signal as expected. Instead, the flaw signal as well as the background signal from the weld interface and the geometry are also denoised by the denoising autoencoder. Additionally, some loss of amplitude is witnessed. Figure 11 shows some examples that did not extract the flaw signal as expected.
Both signals (a) and (b) from Figure 10 share some characteristics in common. Firstly, the flaw signals have relatively low amplitude when observed in the mixed signal. Moreover, the peak amplitudes of denoised signals are low compared to that of signals in Figure 9.
There could be several reasons that the autoencoder used in this study did not perform well on signals with small peaks. One reason could be the shortage of samples or training data. The autoencoder learns the features of signals, and most of the signals are acquired from the peak amplitude. This means that the amount of data with particularly low amplitude is not enough for the neural network to learn. Another reason could be the pattern of signals. Most of the training data had a similarity when extracting the flaw signal. Most of the background signals have a smaller amplitude compared to that of the flaw signal. This characteristic of the training data would mislead the DAE to consider that all signals with small amplitude are extra signals to be deleted. Lastly, the original data were not regularized. Some of the original A-scan data had very low amplitude. By regularizing the signals with the flaw signal’s amplitude, the DAE used in this study would have learned much better.

5. Conclusions

In this study, an algorithm called denoising autoencoder (DAE) is developed to extract the flaw signal from the mixed A-scan signal obtained by ultrasonic testing (UT). Background signals have always been an obstacle to the evaluation of UT signals, especially for unskilled inspectors. Although many attempts have been made to extract flaw signals or denoise background signals using various techniques, these attempts have remained largely unsuccessful. Most attempts to combine UT with artificial neural networks (ANN) have focused on detecting flaws rather than extracting flaw signals from A-scan signals obtained by UT. Although autoencoder has been used in previous research to denoise 2-D image datasets or 1-D signal datasets, it was not particularly focused on the extraction of flaw signals. Therefore, in this study, we propose a newly developed derivative of the DAE that can be used to extract the target flaw signal from mixed A-scan signals.
For this research, a total of 45 weldment standard blocks, in which 5 types of flaws were embedded, were used. The 5 types of flaws used in this study are cracks, lack of fusion, slag inclusions, porosity, and incomplete penetration. The total number of A-scan signals used in the training of the DAE is 2463.
For the training of the DAE, we zero-padded the acquired A-scan signals and manually removed the background signals. The zero-padded data are used as validation data in the ordinary DAE process so that they can be compared to the output and update the weights, thereby reducing the loss. After training, most of the background signals from the original mixed A-scan signals disappeared, and the flaw signals were properly extracted from the mixed A-scan signals.
The MSE loss of the model started at 0.0019 but ended at 0.000508, which shows that the DAE used in this study worked well. A point-by-point comparison method was used to evaluate the performance of the network. For training data, there was an average difference of 0.02764, and for testing data, there was an average difference of 0.03282. The result of the point-by-point comparison also shows that the network worked well.
However, there remained some problems to be solved. First, the amplitude of the extracted flaw signals was reduced. Second, some parts of the mixed signal were not denoised well. Lastly, some flaw signals of the signals with low amplitude were not extracted as expected. The causes of these errors came from the shortage of data used in the training. The DAE was trained using A-scan data acquired from the peak amplitude, which caused a shortage of low amplitude data and became the reason for the error. Another reason could be the pattern of signals. The characteristic of the dataset could mislead the network to denoise every smaller signal. Lastly, the dataset was not regularized. The flaw signals with low amplitude could be regularized, and by regularizing signals with the amplitude of flaw signals, the DAE would be able to learn to treat the flaw signals with low amplitude.
The overall result of this study suggests that the proposed DAE is practical for extracting flaw signals from A-scan signals obtained by UT. Although some revisions should be made for the actual usage of the proposed model in the field, they can be completed in a short period of time. Through this model, experts who practice UT will be able to work more effectively and efficiently. The proposed DAE in this study would be a great solution for experts in the nondestructive evaluation (NDE) field, and the implementation of the proposed DAE in the NDE field is expected soon.

Author Contributions

Conceptualization, S.-J.S. and S.-E.L.; methodology, H.-J.K. and S.-E.L.; software, H.-J.K., S.-E.L., and J.P.; validation, S.-J.S., S.-E.L., J.P., and H.-J.K.; formal analysis, S.-E.L.; investigation, S.-E.L.; resources, S.-E.L. and J.P.; data curation, S.-E.L.; writing—original draft preparation, S.-E.L.; writing—review and editing, S.-E.L., J.P., and H.-J.K.; visualization, S.-E.L.; supervision, S.-J.S. and H.-J.K.; project administration, H.-J.K.; funding acquisition, H.-J.K. All authors have read and agreed to the published version of the manuscript.

Funding

This work has been supported by the National Research Foundation of Korea (NRF) grant funded by the Korean government (MSIT) (No. NRF-2020R1I1A1A01070133).

Institutional Review Board Statement

Not applicable.

Informed Consent Statement

Not applicable.

Data Availability Statement

The data that support the findings of this study are available from the corresponding author upon reasonable request.

Conflicts of Interest

The authors declare no conflict of interest.

Abbreviations

UTUltrasonic testing
NDENondestructive evaluation
VTVisual testing
PTPenetration testing
MTMagnetic testing
RTRadiographic testing
ECTEddy current testing
DAEDenoising autoencoder
IoTInternet of Things
ANNArtificial neural networks
nlDAELearning-based denoising autoencoder
MSEMean squared error

References

  1. Innopolis Foundation. Non-Destructive Testing and Inspection Market. 2019. Available online: https://innopolis.or.kr (accessed on 24 December 2022).
  2. Yoo, S.; Lim, I.S.; Kee-soo, E. A Study on the Capability Evaluation of an Unskilled Ultrasonic Testing Personnel after the Training Period: Carbon Steel Butt-welds Case. J. Korea Manag. Eng. Soc. 2019, 24, 89–98. [Google Scholar]
  3. Munir, N.; Kim, H.J.; Park, J.; Song, S.J.; Kang, S.S. Convolutional neural network for ultrasonic weldment flaw classification in noisy conditions. Ultrasonics 2019, 94, 74–81. [Google Scholar] [CrossRef] [PubMed]
  4. Gondara, L. Medical image denoising using convolutional denoising autoencoders. In Proceedings of the 2016 IEEE 16th International Conference on Data Mining Workshops (ICDMW), Barcelona, Spain, 12–15 December 2016; IEEE: Piscataway, NJ, USA, 2016; pp. 241–246. [Google Scholar] [CrossRef] [Green Version]
  5. Ishii, T.; Komiyama, H.; Shinozaki, T.; Horiuchi, Y.; Kuroiwa, S. Reverberant speech recognition based on denoising autoencoder. In Interspeech; ISCA: Singapore, 2013; pp. 3512–3516. [Google Scholar]
  6. Lee, W.H.; Ozger, M.; Challita, U.; Sung, K.W. Noise learning-based denoising autoencoder. IEEE Commun. Lett. 2021, 25, 2983–2987. [Google Scholar] [CrossRef]
  7. Saad, O.M.; Chen, Y. Deep denoising autoencoder for seismic random noise attenuation. Geophysics 2020, 85, V367–V376. [Google Scholar] [CrossRef]
  8. FlawTech. Specimen Catalogue. Vol. 10-1/2020. 2020. Available online: https://www.FlawTech.com (accessed on 13 January 2023).
  9. Sonaspection. Experts in Manufacturing Flawed Specimens and Mock-ups. 2022. Available online: https://www.sonaspection.com (accessed on 13 January 2023).
  10. Steck, H. Autoencoders that don’t overfit towards the Identity. Adv. Neural Inf. Process. Syst. 2020, 33, 19598–19608. [Google Scholar]
  11. Munir, N.; Park, J.; Kim, H.J.; Song, S.J.; Kang, S.S. Performance enhancement of convolutional neural network for ultrasonic flaw classification by adopting autoencoder. NDT E Int. 2020, 111, 102218. [Google Scholar] [CrossRef]
  12. Singh, H.; Ahmed, A.S.; Melandsø, F.; Habib, A. Ultrasonic image denoising using machine learning in point contact excitation and detection method. Ultrasonics 2023, 127, 106834. [Google Scholar] [CrossRef] [PubMed]
  13. Bank, D.; Koenigstein, N.; Giryes, R. Autoencoders. arXiv 2020, arXiv:2003.05991. [Google Scholar]
  14. Vincent, P.; Larochelle, H.; Lajoie, I.; Bengio, Y.; Manzagol, P.A.; Bottou, L. Stacked denoising autoencoders: Learning useful representations in a deep network with a local denoising criterion. J. Mach. Learn. Res. 2010, 11, 3371–3408. [Google Scholar]
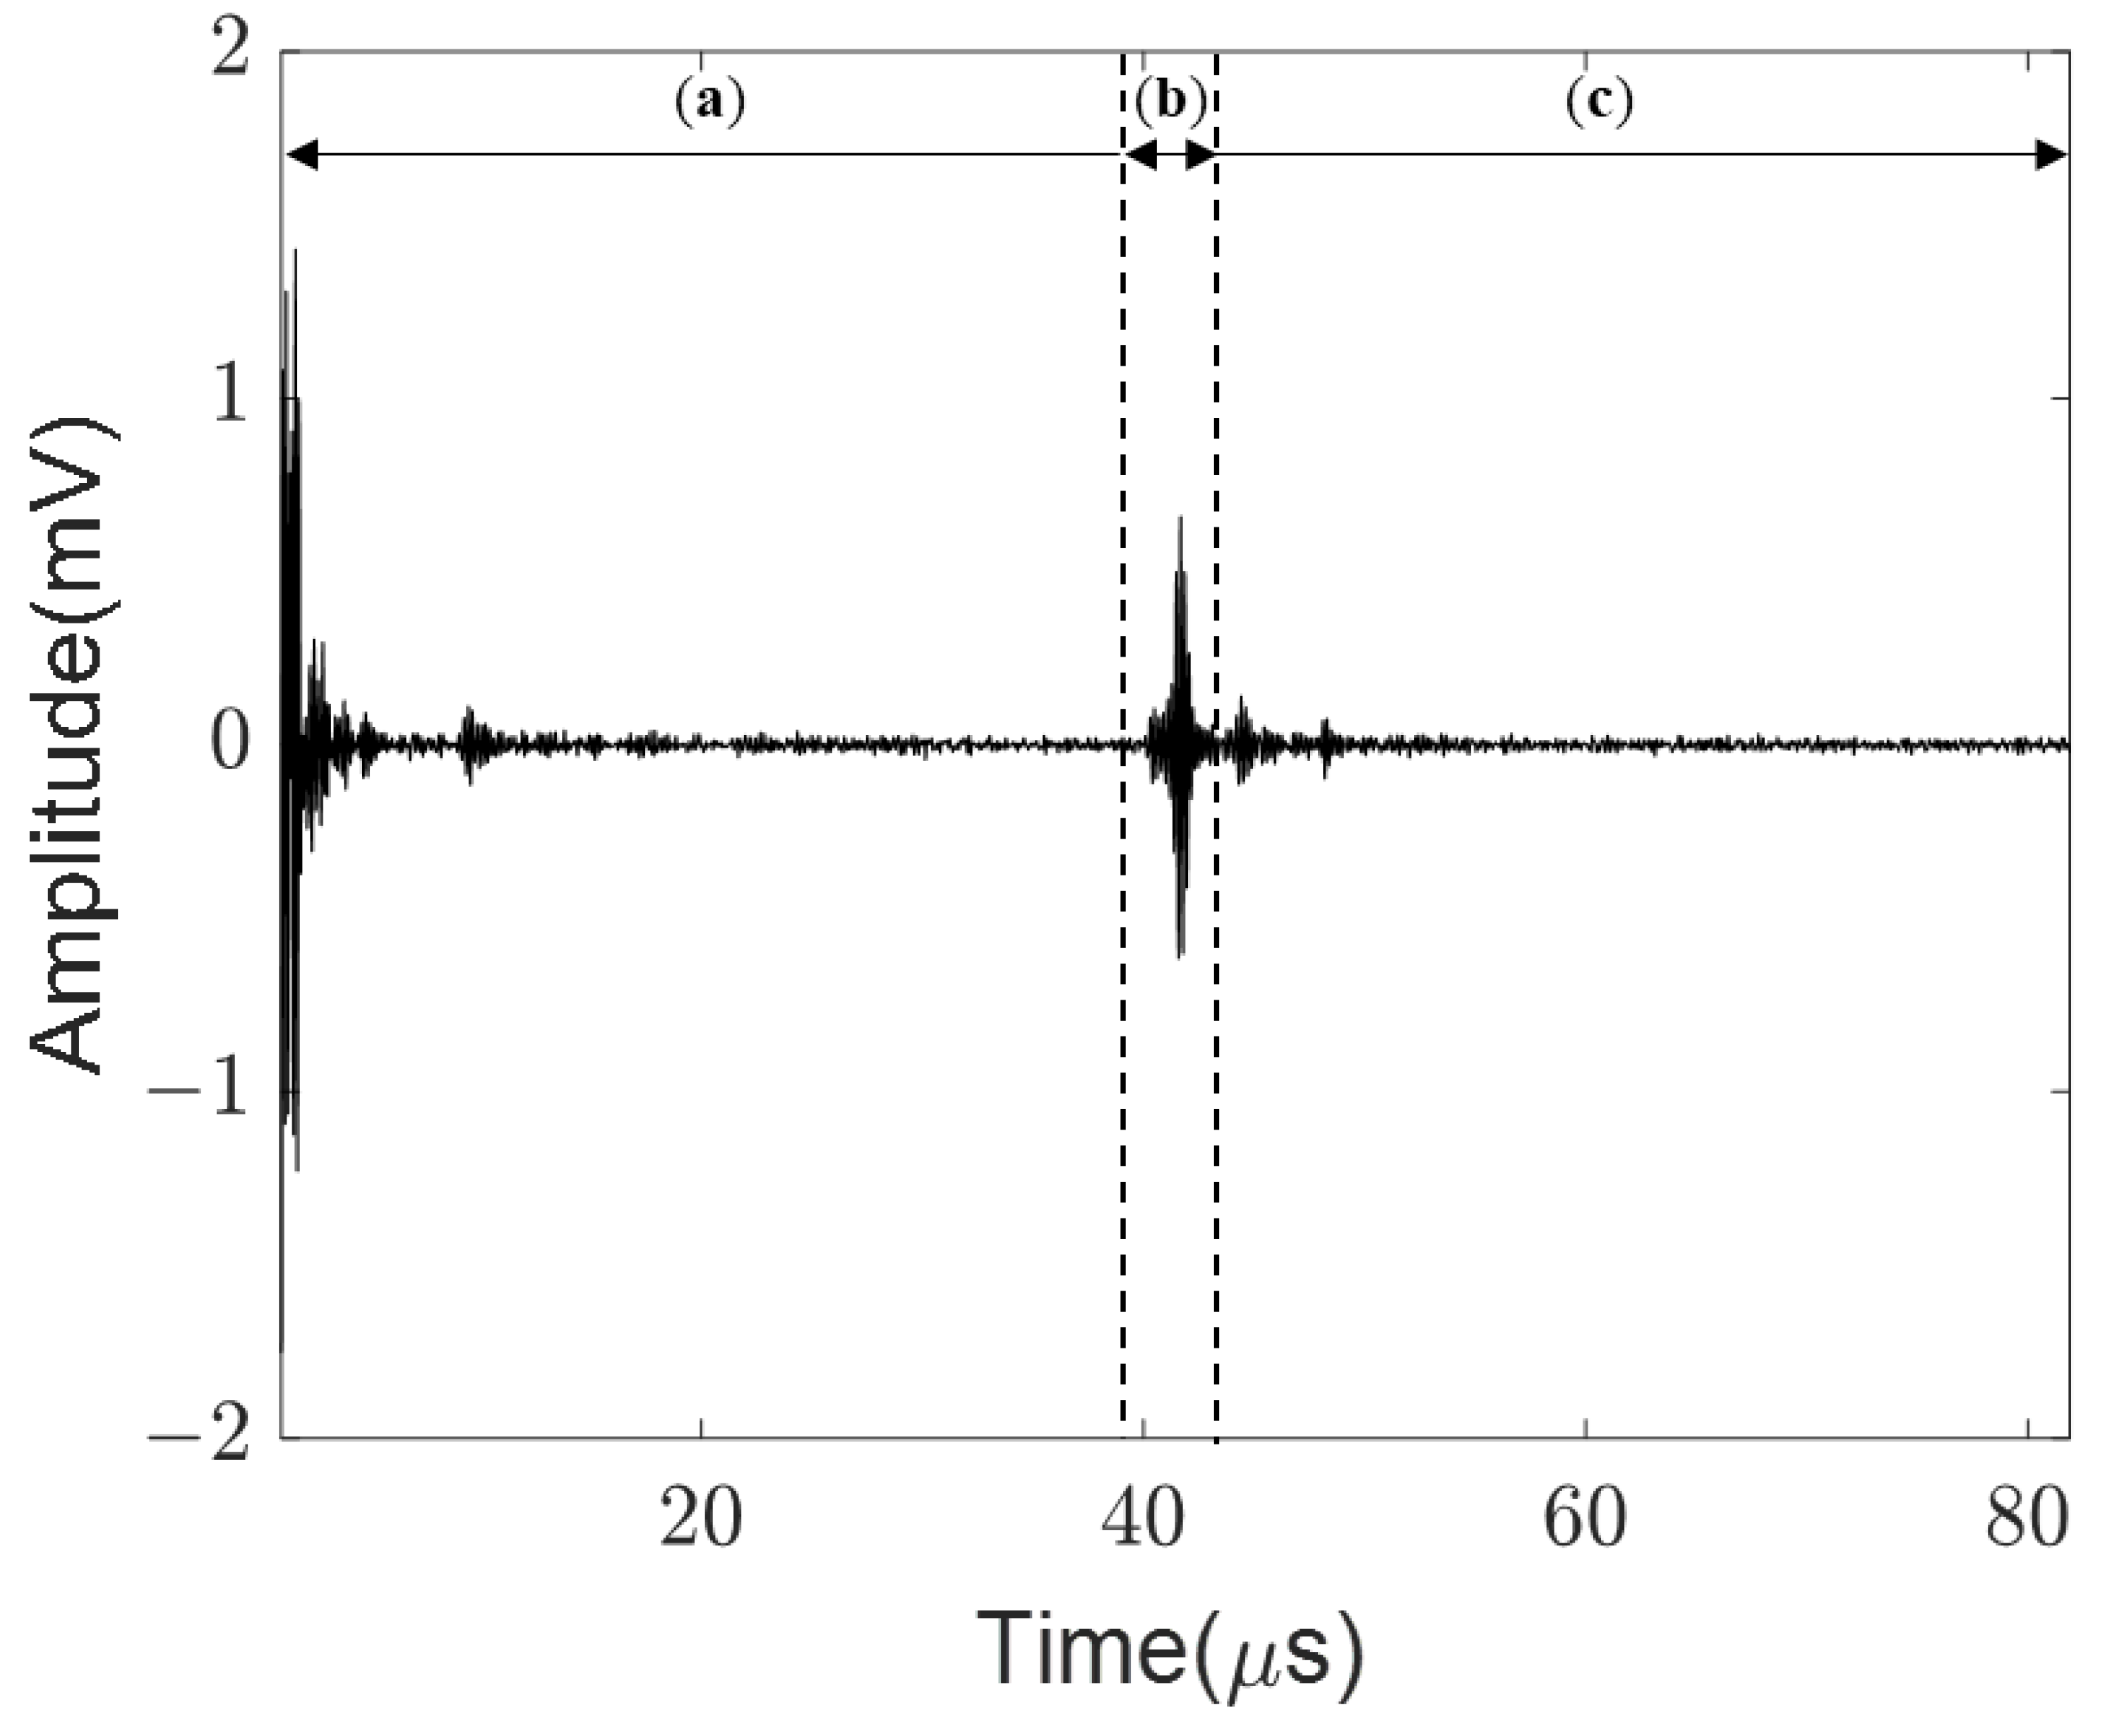
Figure 1. Ultrasonic A-scan signal with the flaw indication and the background: (a) initial signal and wedge noise; (b) flaw signal; (c) weldment interface signal and geometrical signal.
Applsci 13 03534 g001
Figure 2. Specimens used in the acquisition of data.
Applsci 13 03534 g002
Figure 3. Digitalized UT system and inspection of pipe weldment specimen.
Applsci 13 03534 g003
Figure 4. Architecture of the conventional denoising autoencoder.
Applsci 13 03534 g004
Figure 5. Difference between ordinary denoising autoencoder and one used in this study: (a) the inputs x ˜ and outputs x of the ordinary denoising autoencoder that the noisy input is denoised throughout the autoencoder; (b) the inputs x ˜ and outputs x of the DAE used in this study that the autoencoder extracts the flaw signal out of the mixed signal and denoises the other extra signals beside the flaw signal.
Applsci 13 03534 g005
Figure 6. The architecture of proposed denoising autoencoder in this study: (a) The input or x ˜ used in this study where it goes through the denoising autoencoder and its features are saved in the bottleneck hidden layer; (b) The flaw signal or x that is used as validation where all of the extra signals beside the flaw signal are zero-padded. The validation is used for the MSE calculation with the output; (c) The output or x that is reconstructed through the denoising autoencoder where it is compared to the validation signal and the autoencoder learns to extract the flaw signal.
Applsci 13 03534 g006
Figure 7. The sample flaw signals of every flaw types in the specimens: (a) the A-scan crack signal; (b) the A-scan lack of fusion signal; (c) the A-scan slag inclusion signal; (d) the A-scan porosity signal; (e) the A-scan incomplete penetration signal.
Applsci 13 03534 g007
Figure 8. The diagram of training procedure for the proposed DAE used in this study.
Applsci 13 03534 g008
Figure 9. The architecture of DAE used in this study.
Applsci 13 03534 g009
Figure 10. The examples of the performance testing of each flaw types: (a) A-scan mixed crack signal (original signal) and extracted crack flaw signal from the original signal; (b) A-scan mixed lack of fusion signal (original signal) and extracted lack of fusion flaw signal from the original signal; (c) A-scan mixed slag inclusion signal (original signal) and extracted slag inclusion flaw signal from the original signal; (d) A-scan mixed porosity signal (original signal) and extracted porosity flaw signal from the original signal; (e) A-scan mixed incomplete penetration signal (original signal) and extracted incomplete penetration flaw signal from the original signal.
Applsci 13 03534 g010
Figure 11. The examples of signals that are not extracted properly: (a) A-scan mixed crack signal data and extracted crack signal from flaw #150; (b) A-scan mixed slag inclusion signal data and extracted slag inclusion signal from flaw #892.
Applsci 13 03534 g011
Table 1. Probes used in acquisition of the data.
Krautkramer GE Olympus
MWB 45-2WB 45-2WB 45-4MWB 45-2WB 45-2A430S (45°)
MWB 60-2WB 60-2WB 60-4MWB 60-2WB 60-2A430S (60°)
MWB 70-2WB 70-2WB 70-4MWB 70-2WB 70-2A430S (70°)
Table 2. Data acquired from the ultrasonic testing.
Flaw TypeData (#)Total (#)
Crack6302463
Lack of Fusion378
Slag Inclusion623
Porosity344
Incomplete Penetration488
Table 3. Point-by-point comparison of extracted flaw data, training dataset, and testing dataset must.
PerformanceTrainingTesting
Number of data (#)24631000
Average of maximum amplitudes0.67290.6281
Average difference of data points0.027640.03282
Disclaimer/Publisher’s Note: The statements, opinions and data contained in all publications are solely those of the individual author(s) and contributor(s) and not of MDPI and/or the editor(s). MDPI and/or the editor(s) disclaim responsibility for any injury to people or property resulting from any ideas, methods, instructions or products referred to in the content.