
Effects of Blade Extension on Power Production and Ultimate Loads of Wind Turbines
Abstract
:1. Introduction
2. Evaluation Method and Transformation Scheme
2.1. Evaluation Method
2.2. Turbine Model and Transformation Scheme
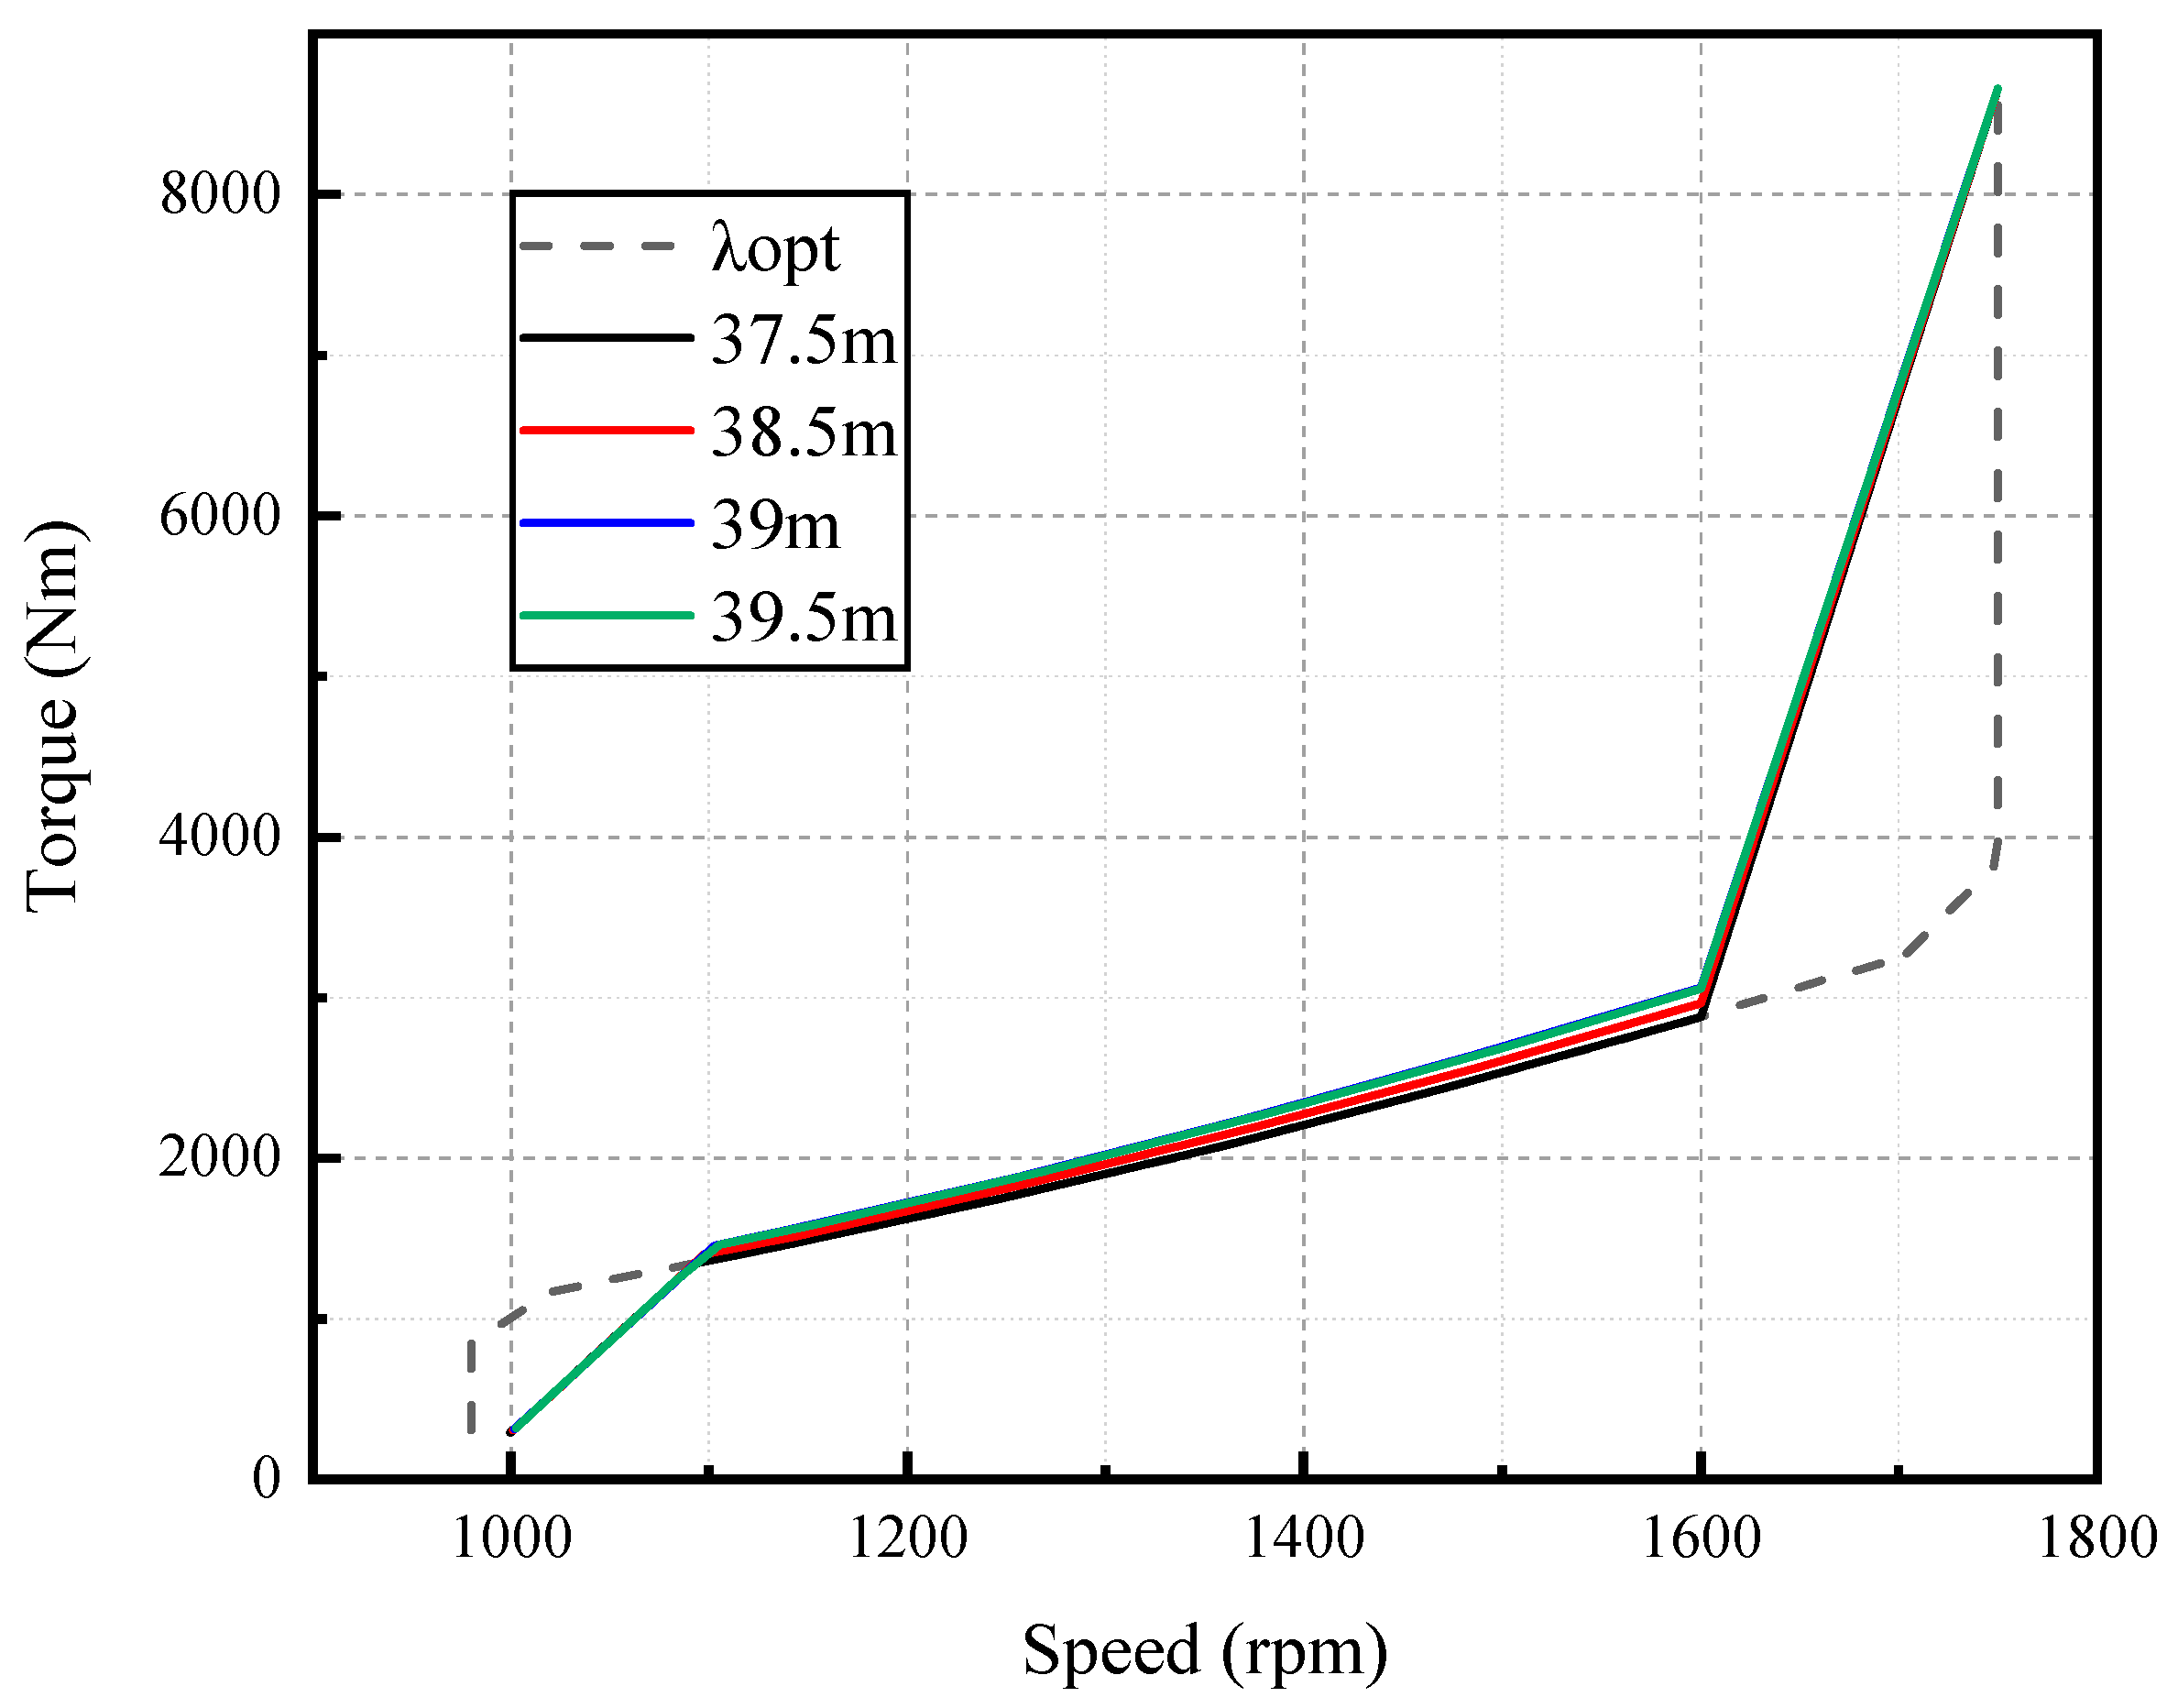
3. Steady Power Curve and Operational Loads
3.1. Wind Turbine Performance
3.2. Steady Operational Loads
4. Dynamic Load Evaluations
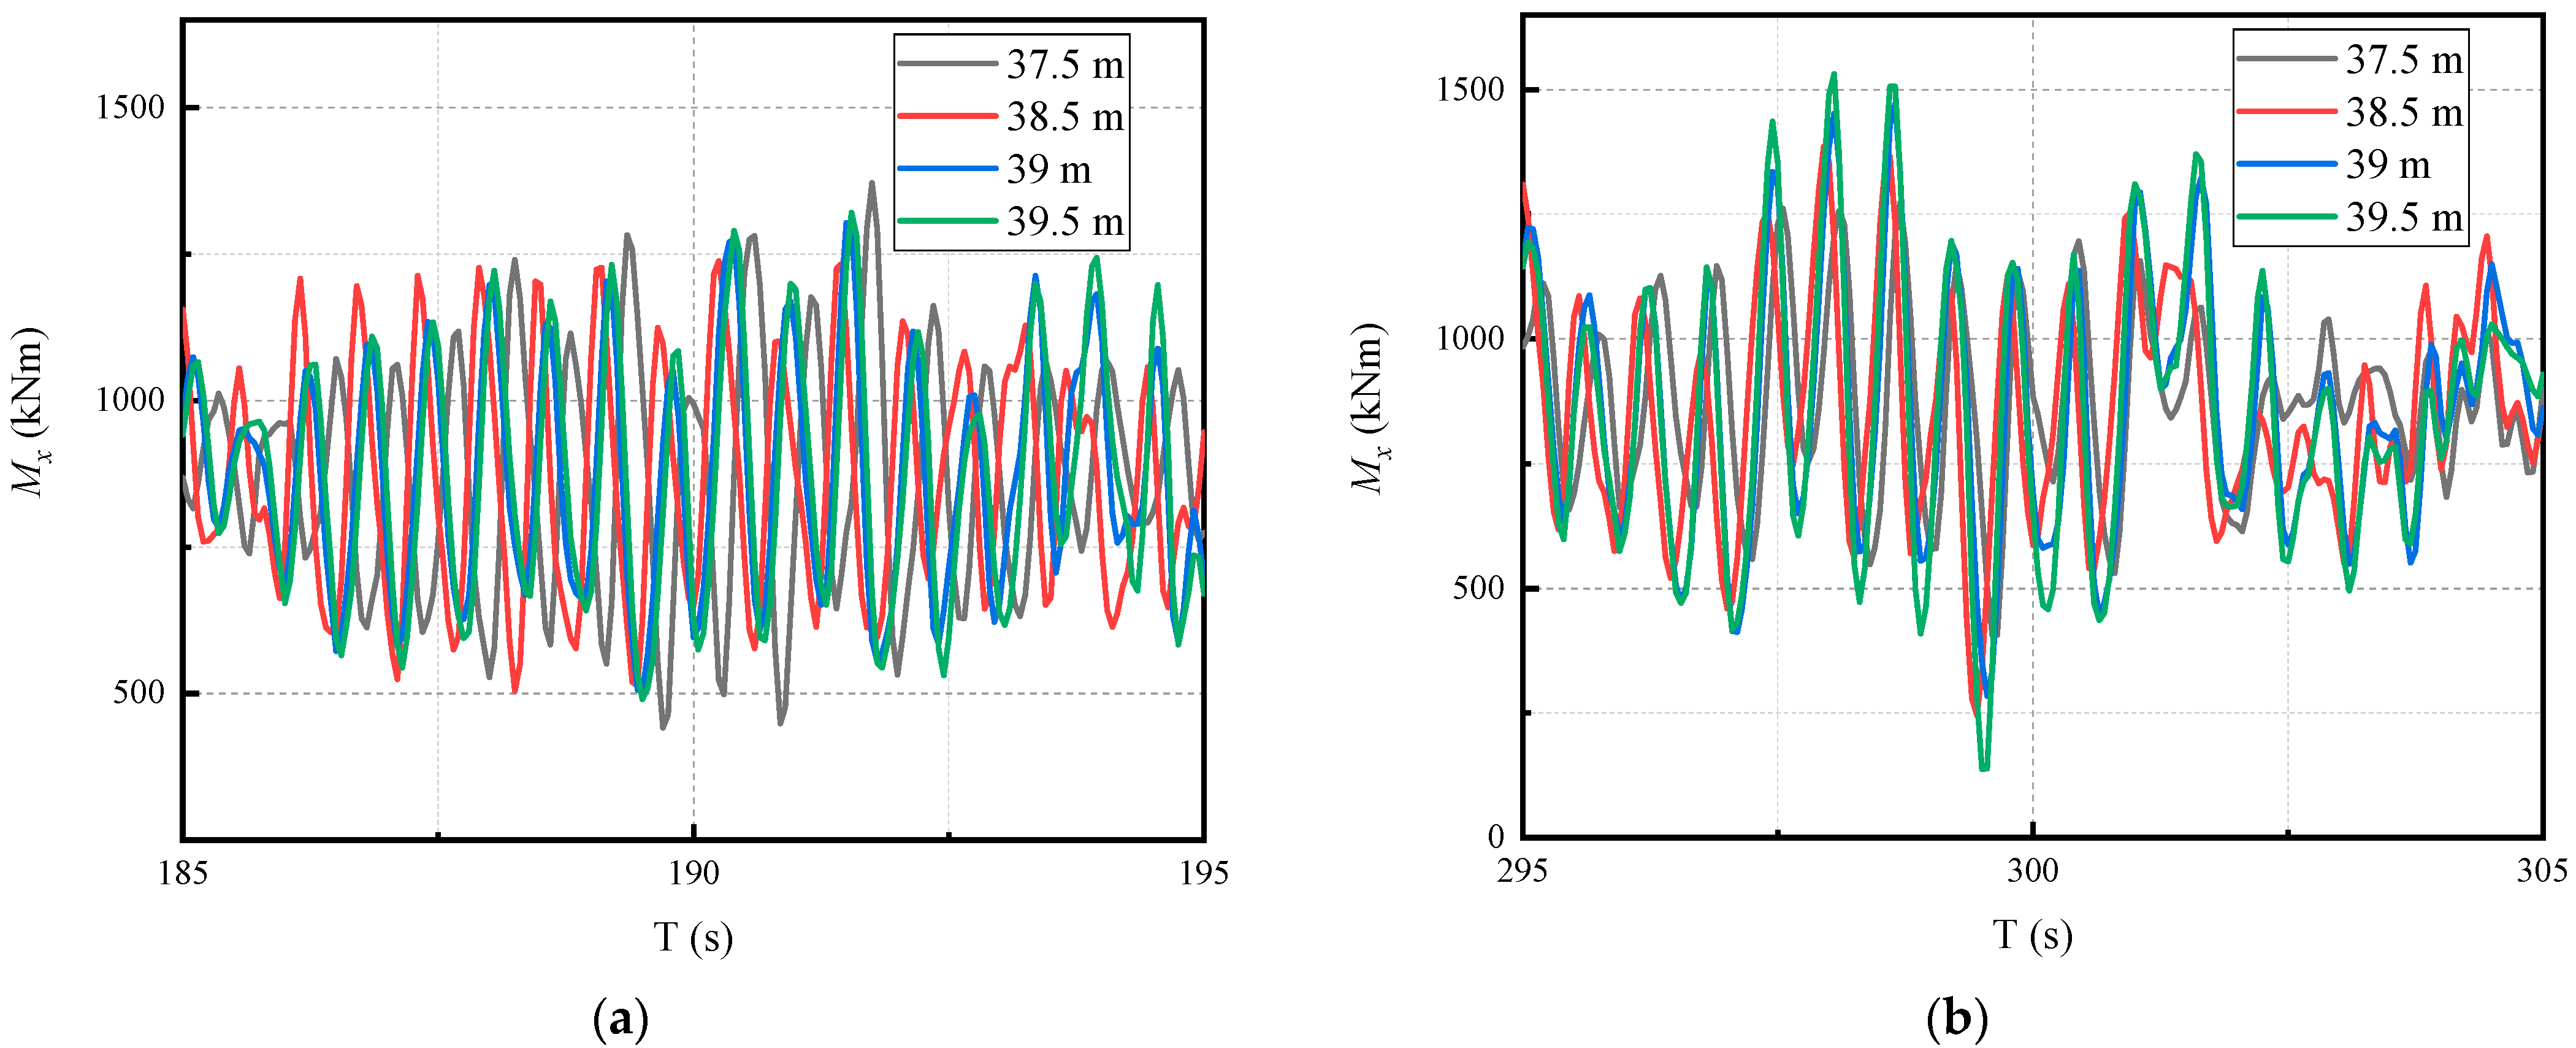
4.1. Ultimate Loads in Turbulence Wind Condition
4.2. Ultimate Loads in Gust Wind Condition
4.3. Ultimate Loads in All Operating Conditions
5. Discussion on the Economic Effect
6. Conclusions
- 1.
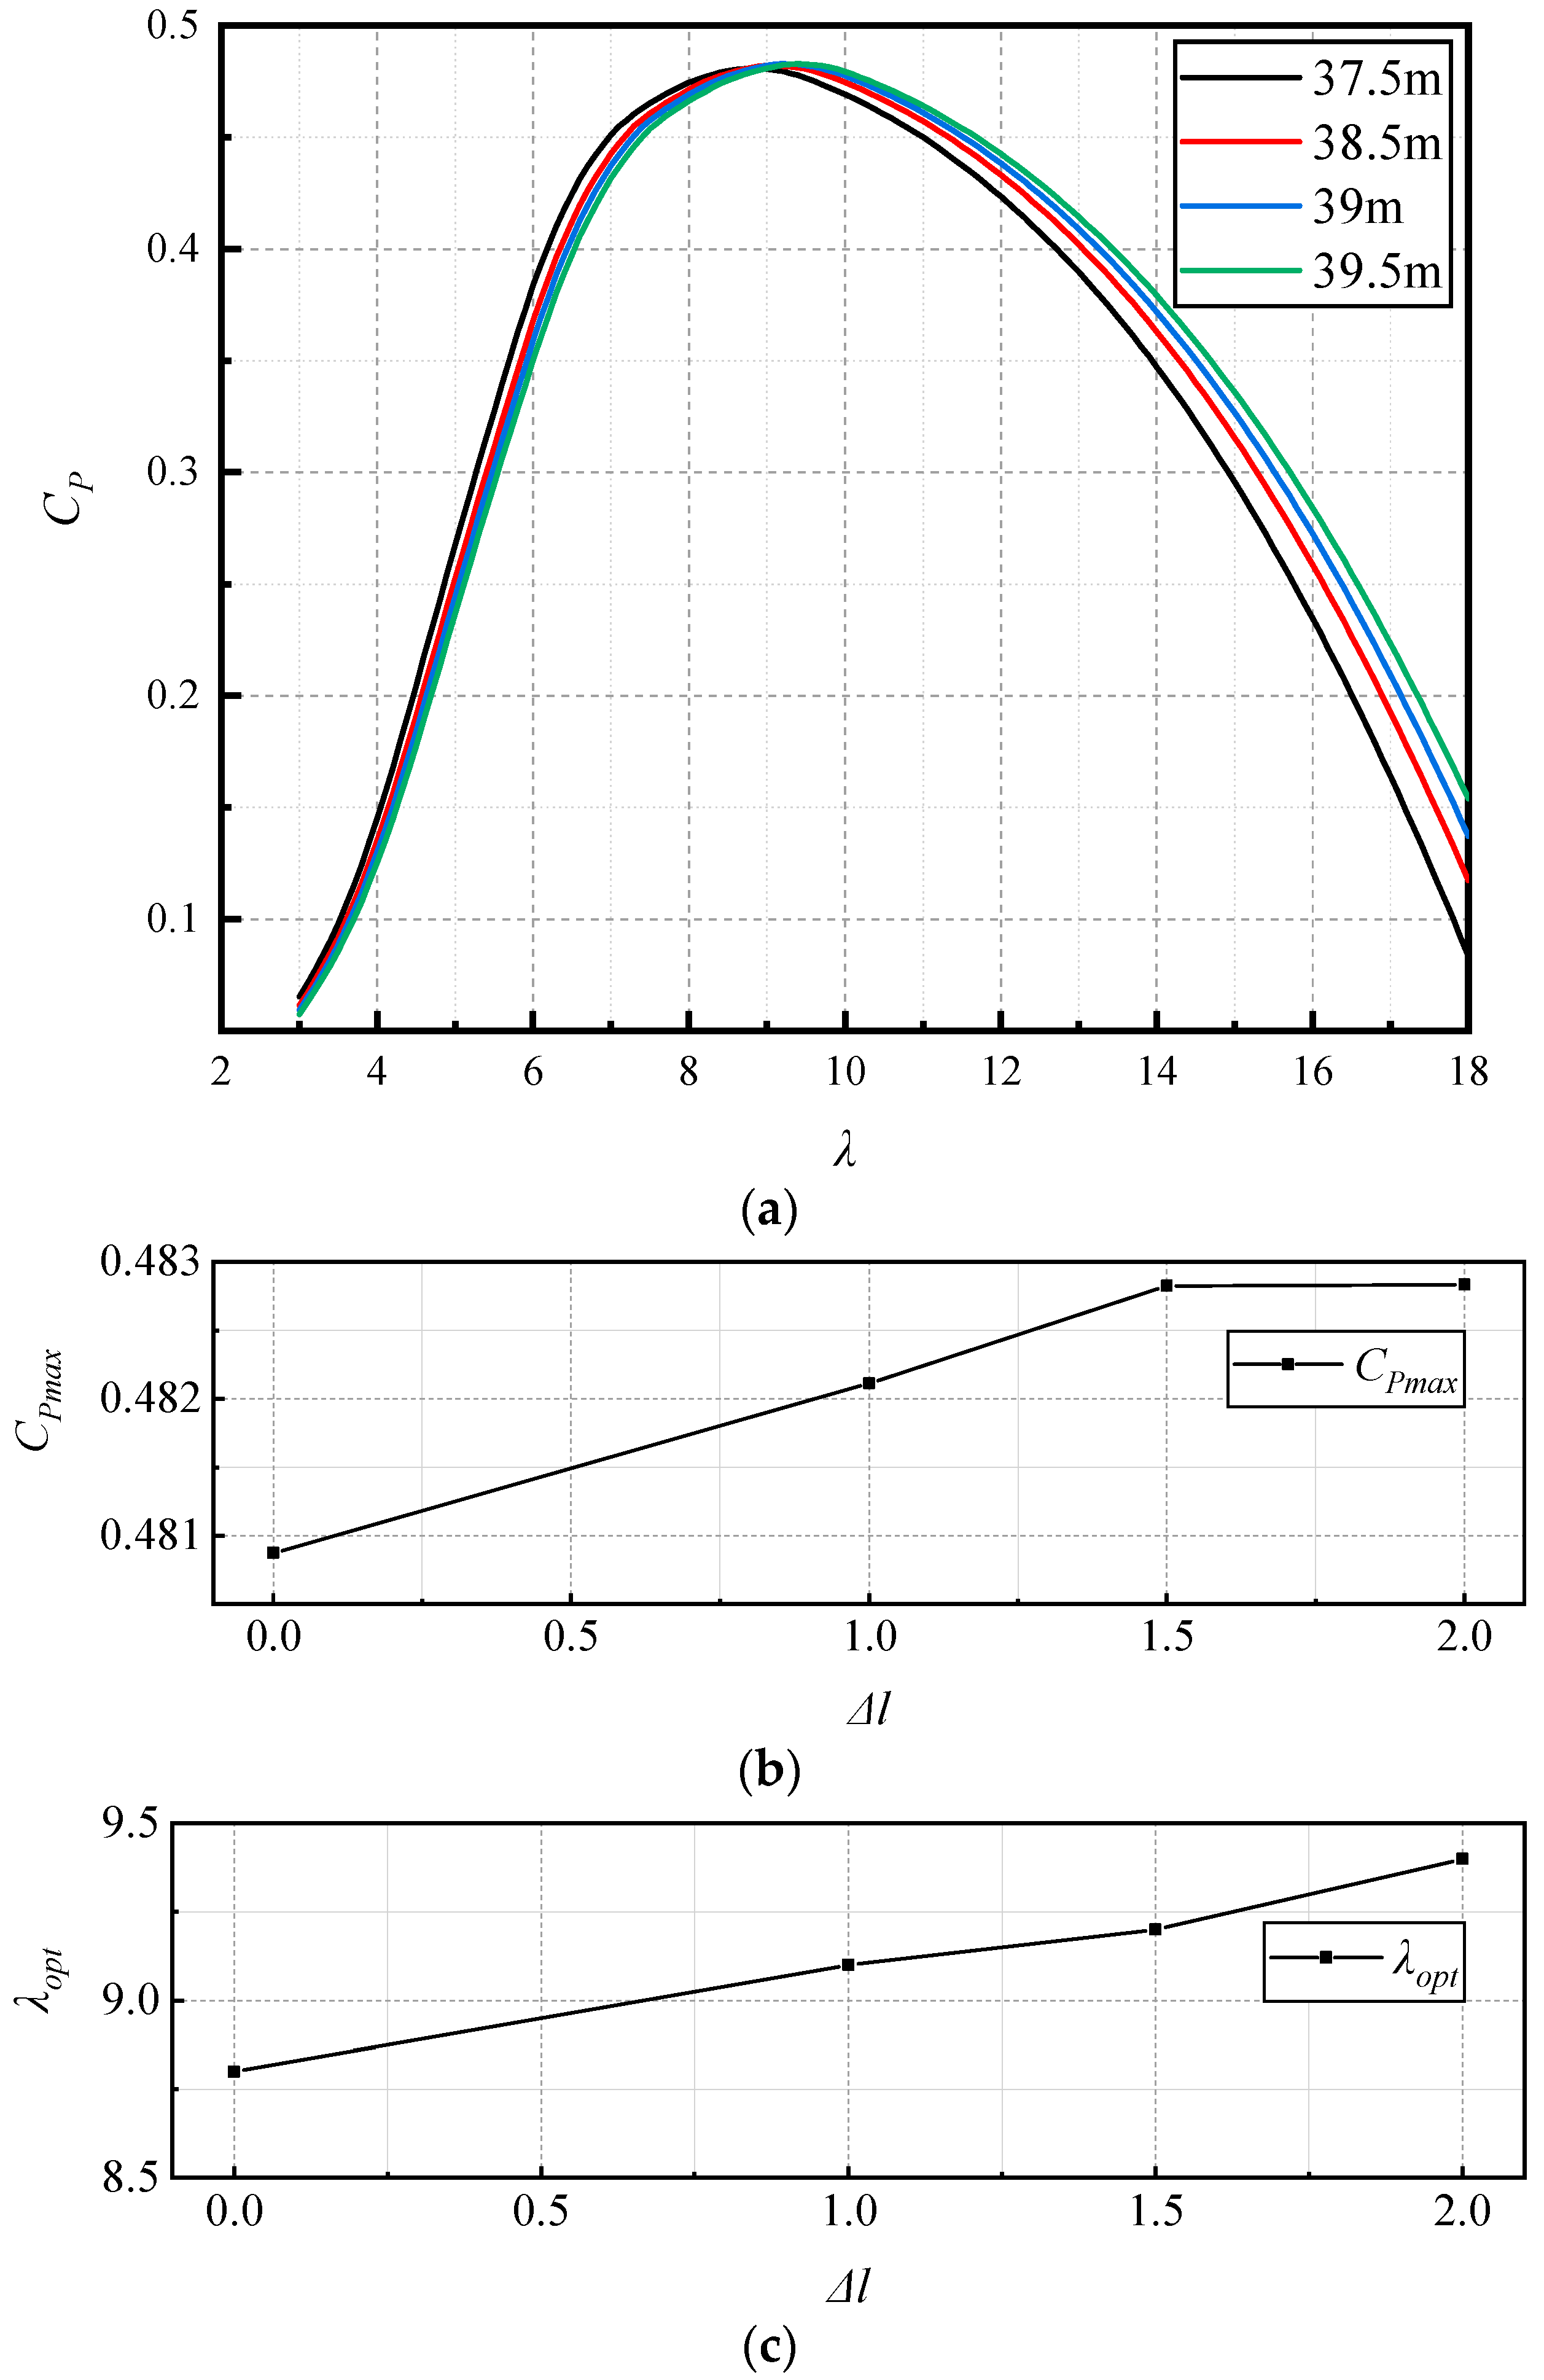
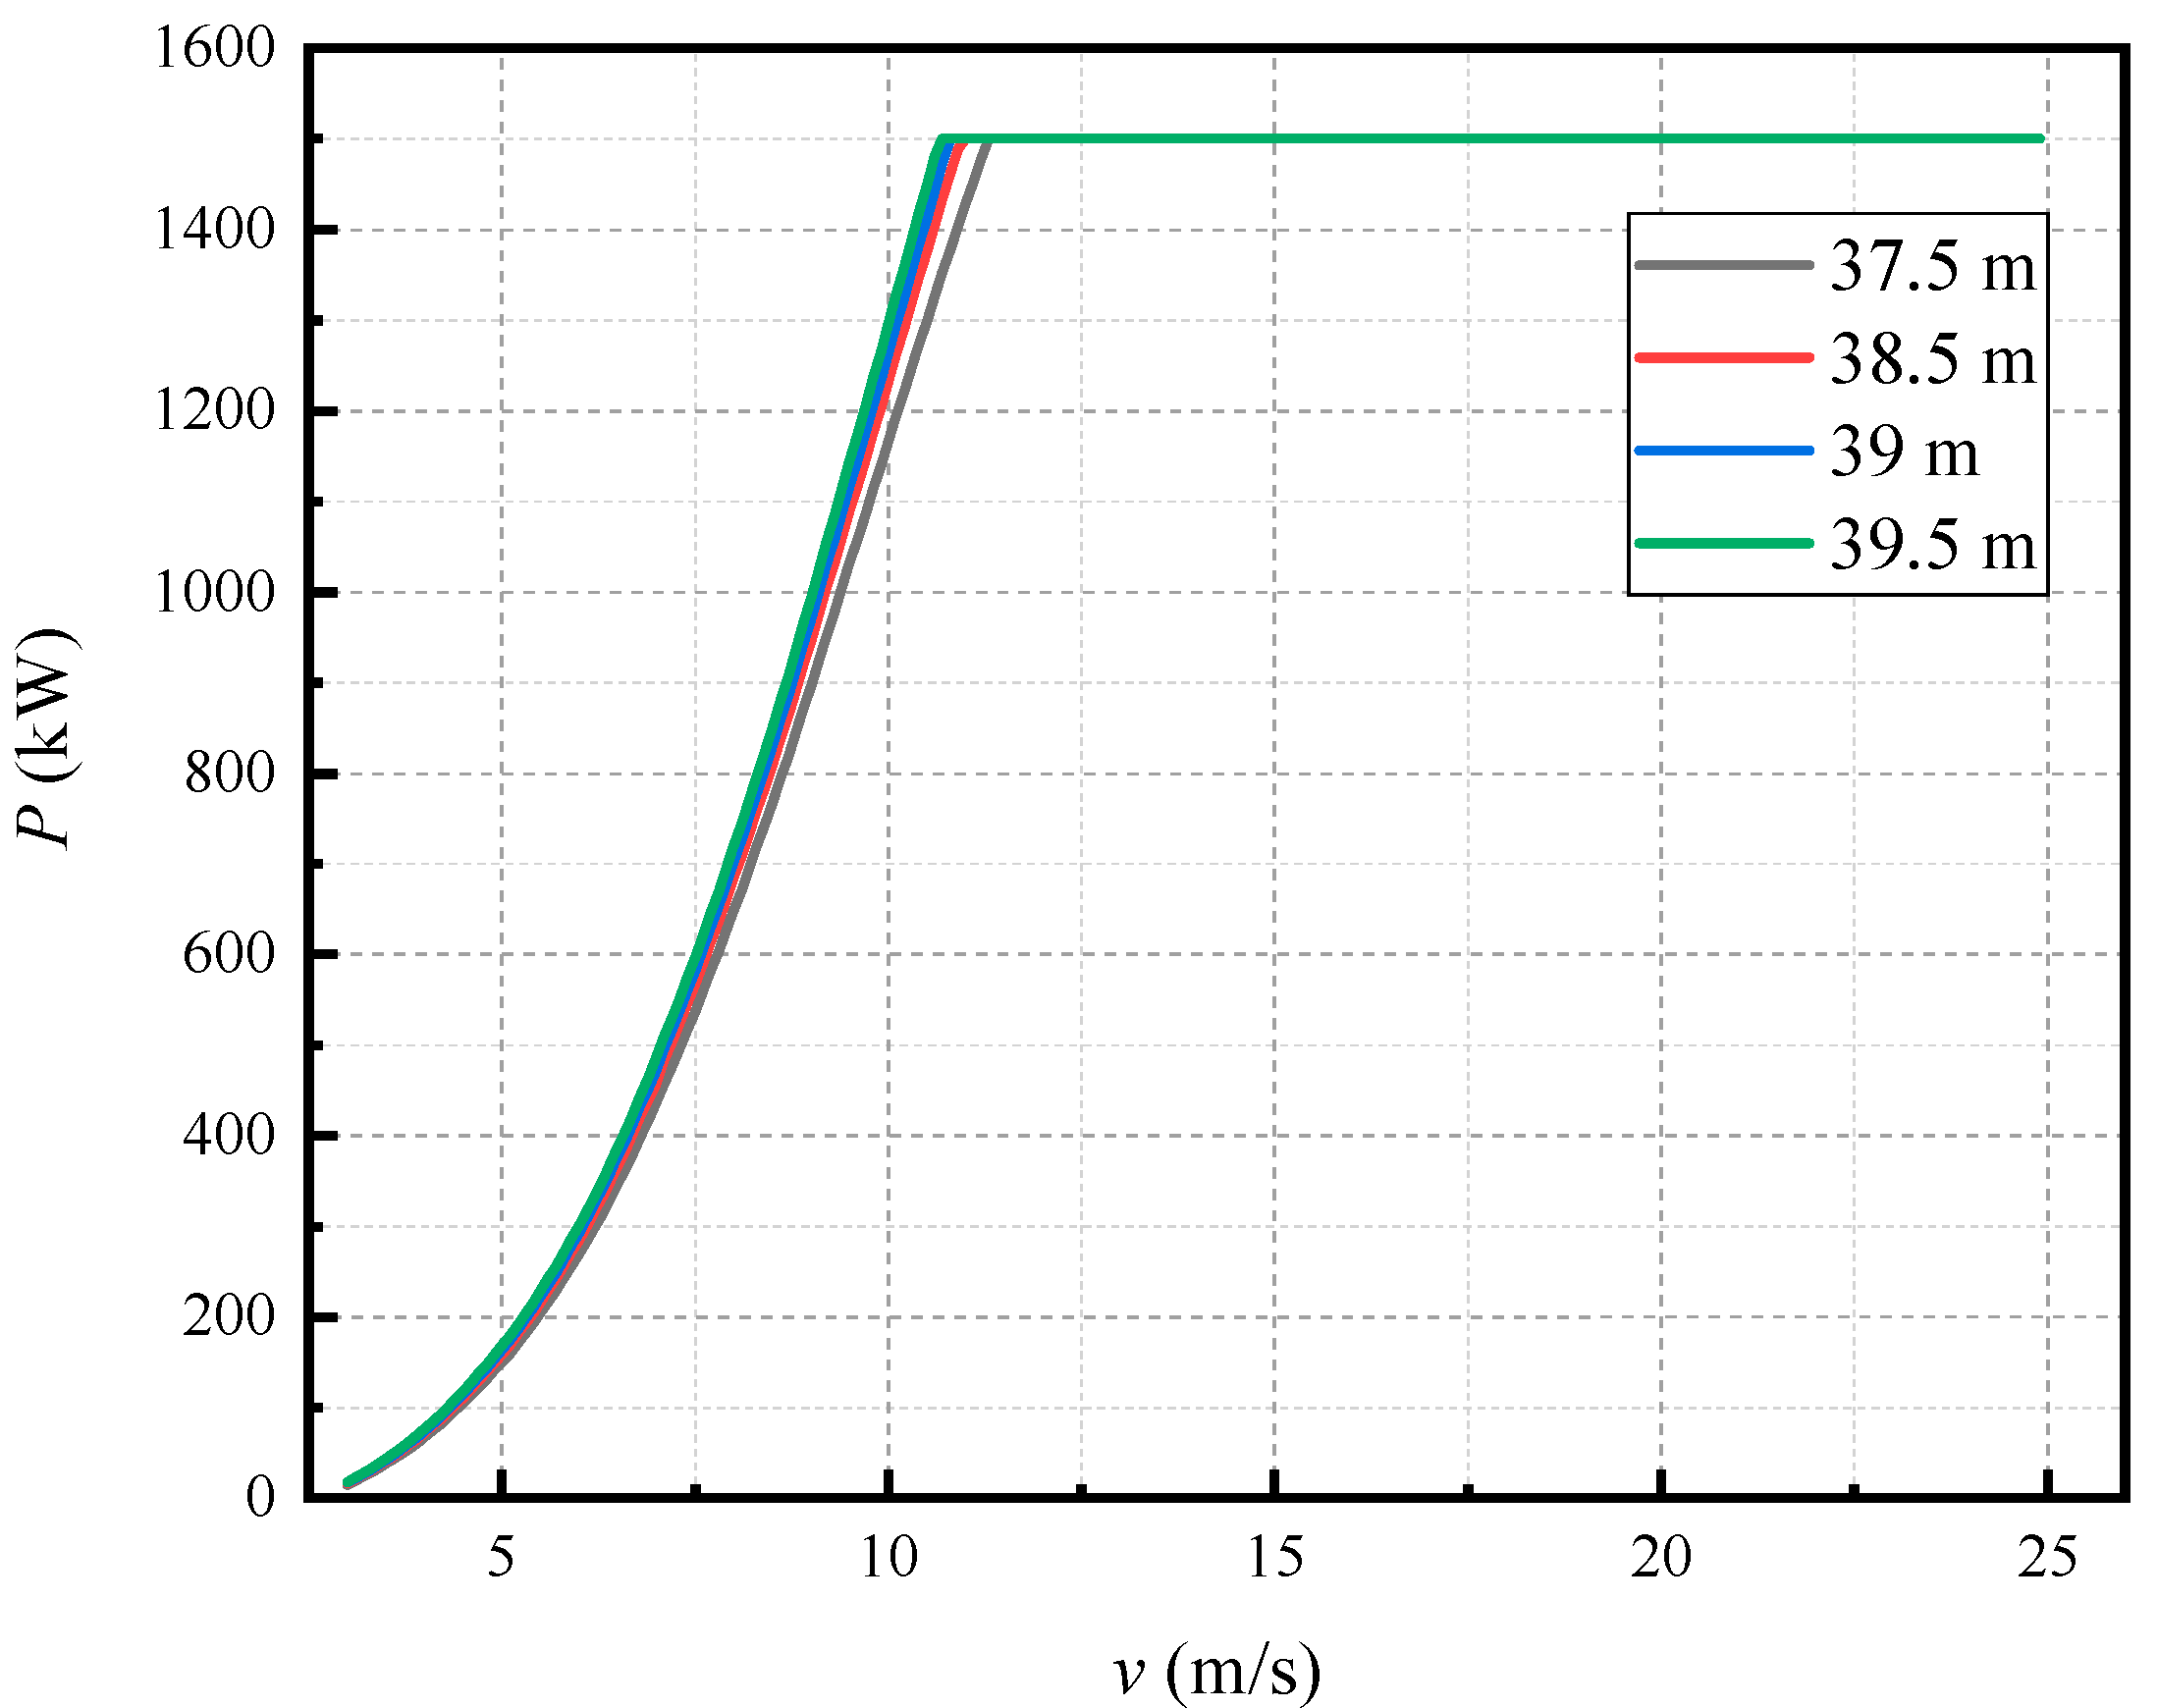
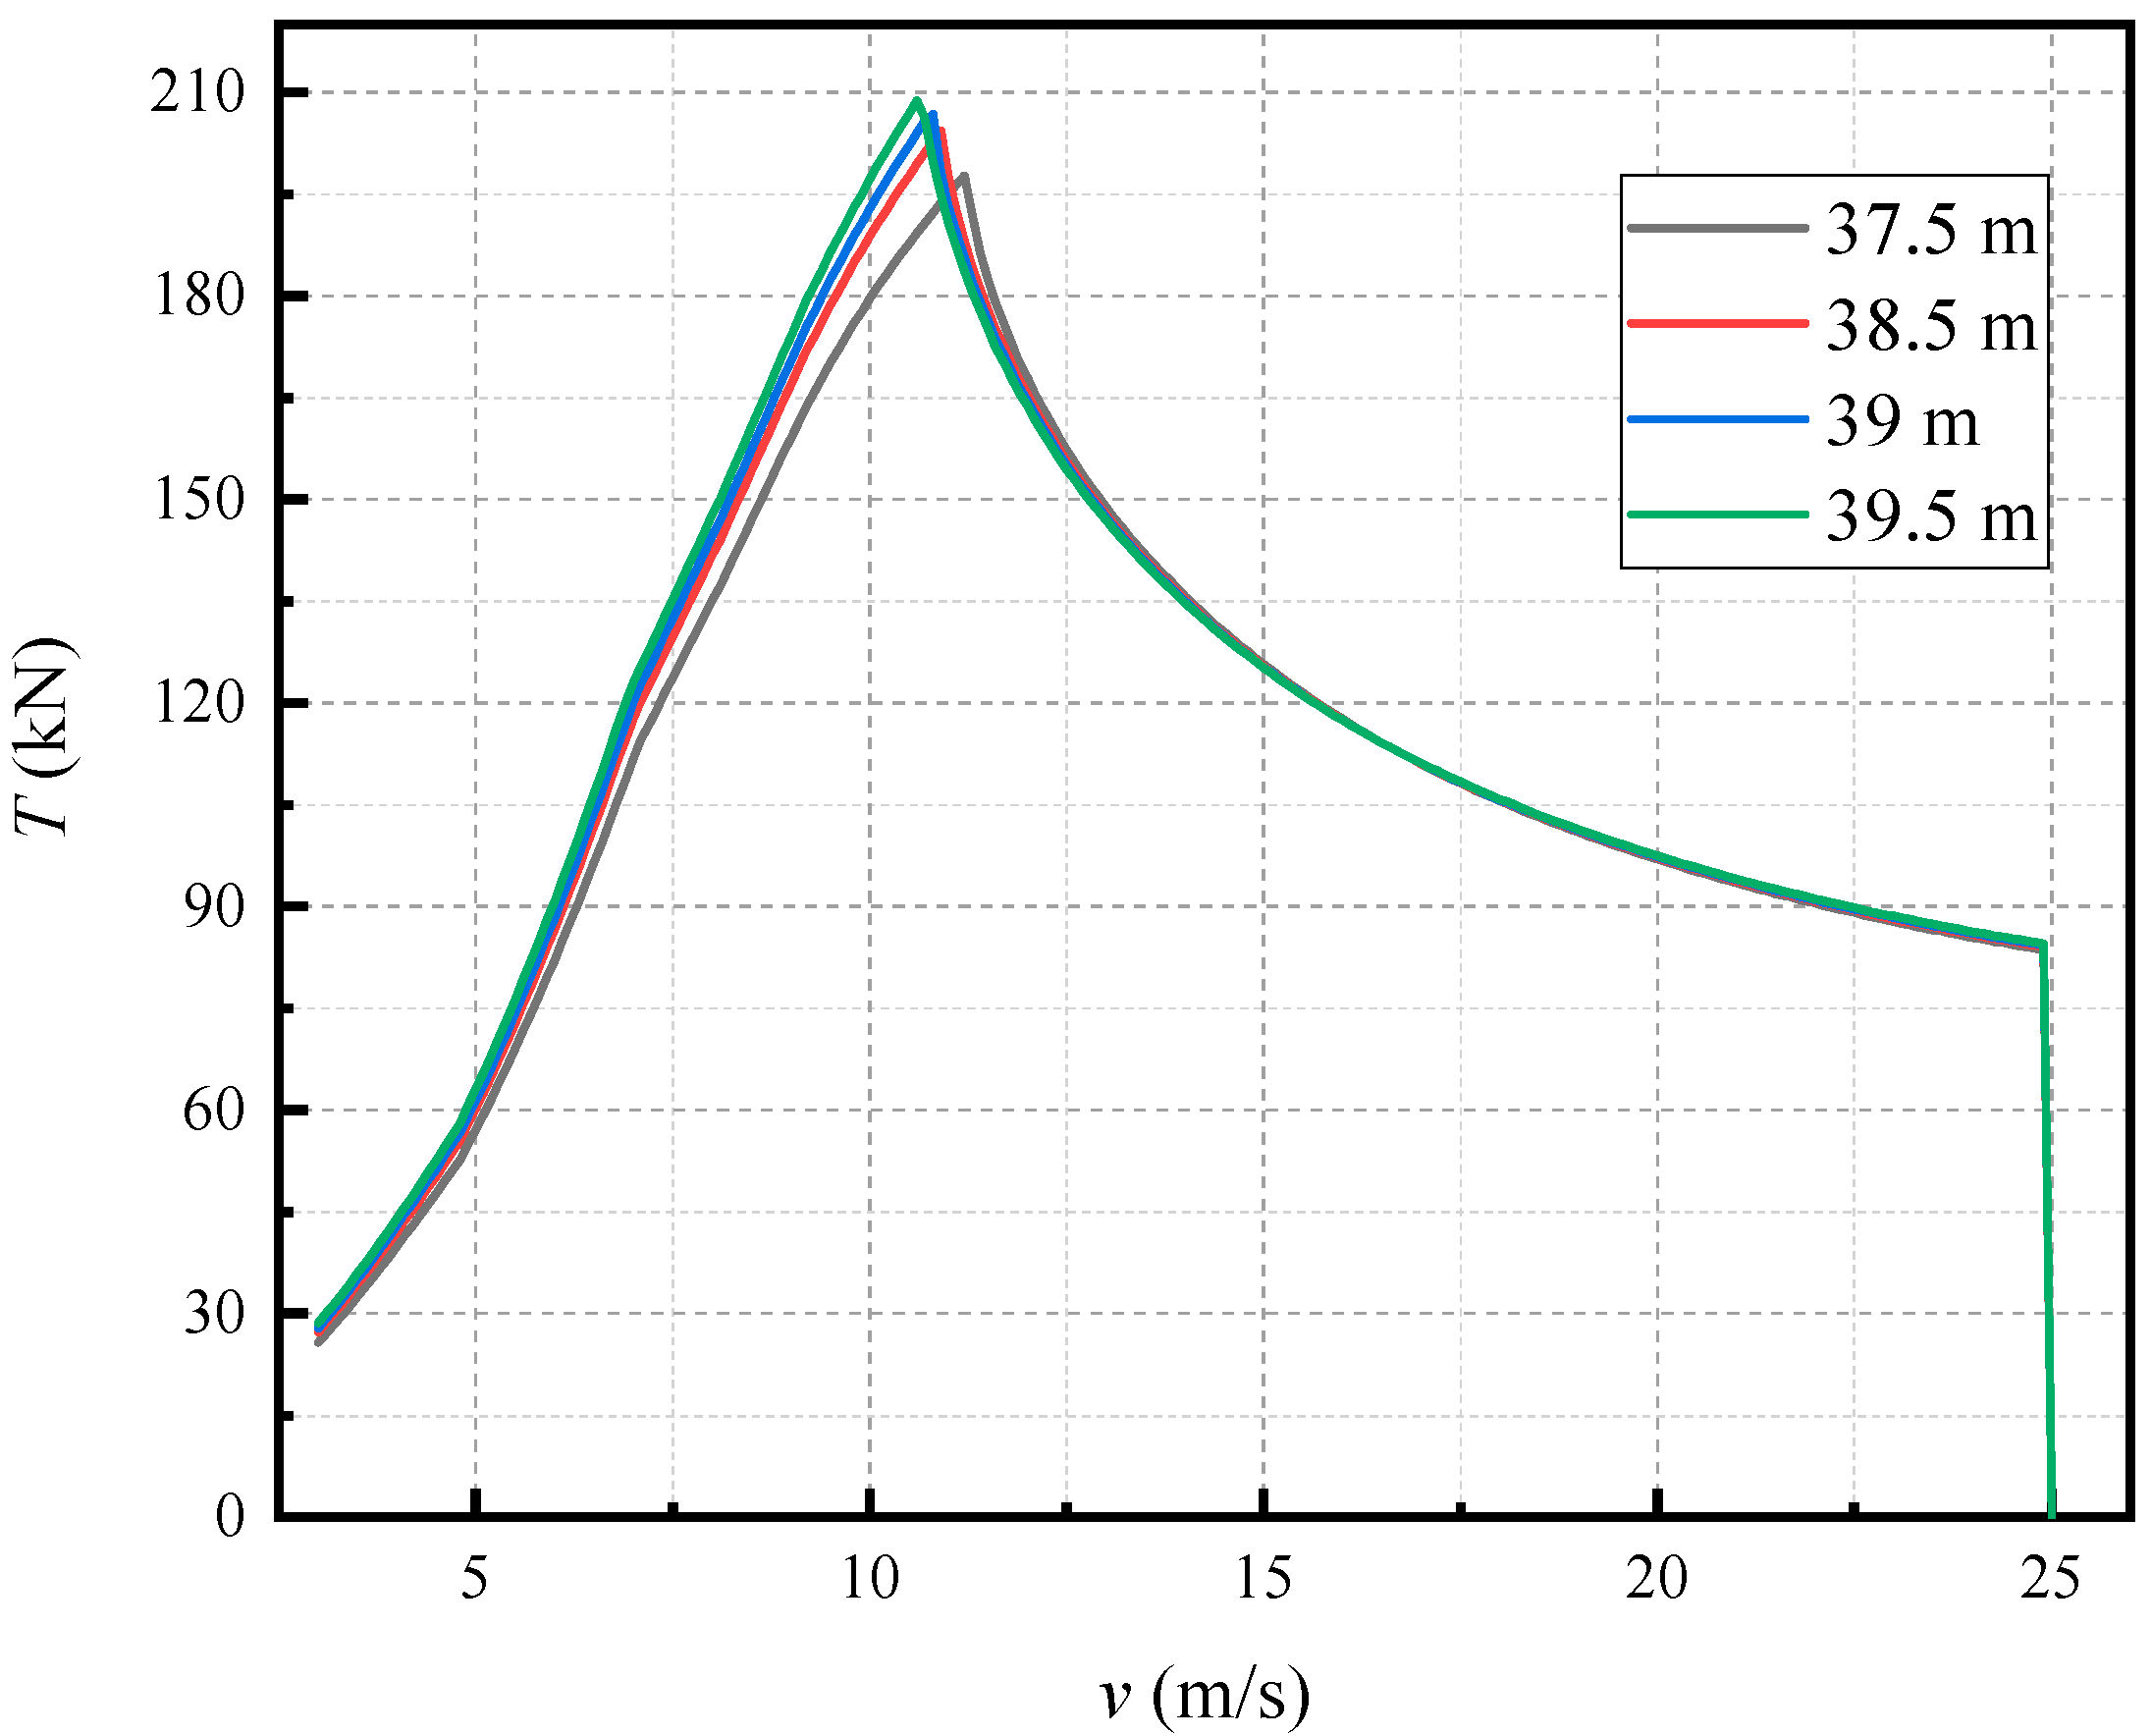
- Blade extension can significantly increase the power of wind turbines and decrease the rated wind speed to 11 m/s, 10.8 m/s and 10.7 m/s. With the increase in blade length, the optimum tip-speed ratio λopt and the corresponding power coefficient CPmax slightly increase, while the thrust coefficient CT decreases at the same λ. In addition, a significant increase in the steady loads of trust of wind rotor and bending moment at blade root can be observed.
- 2.
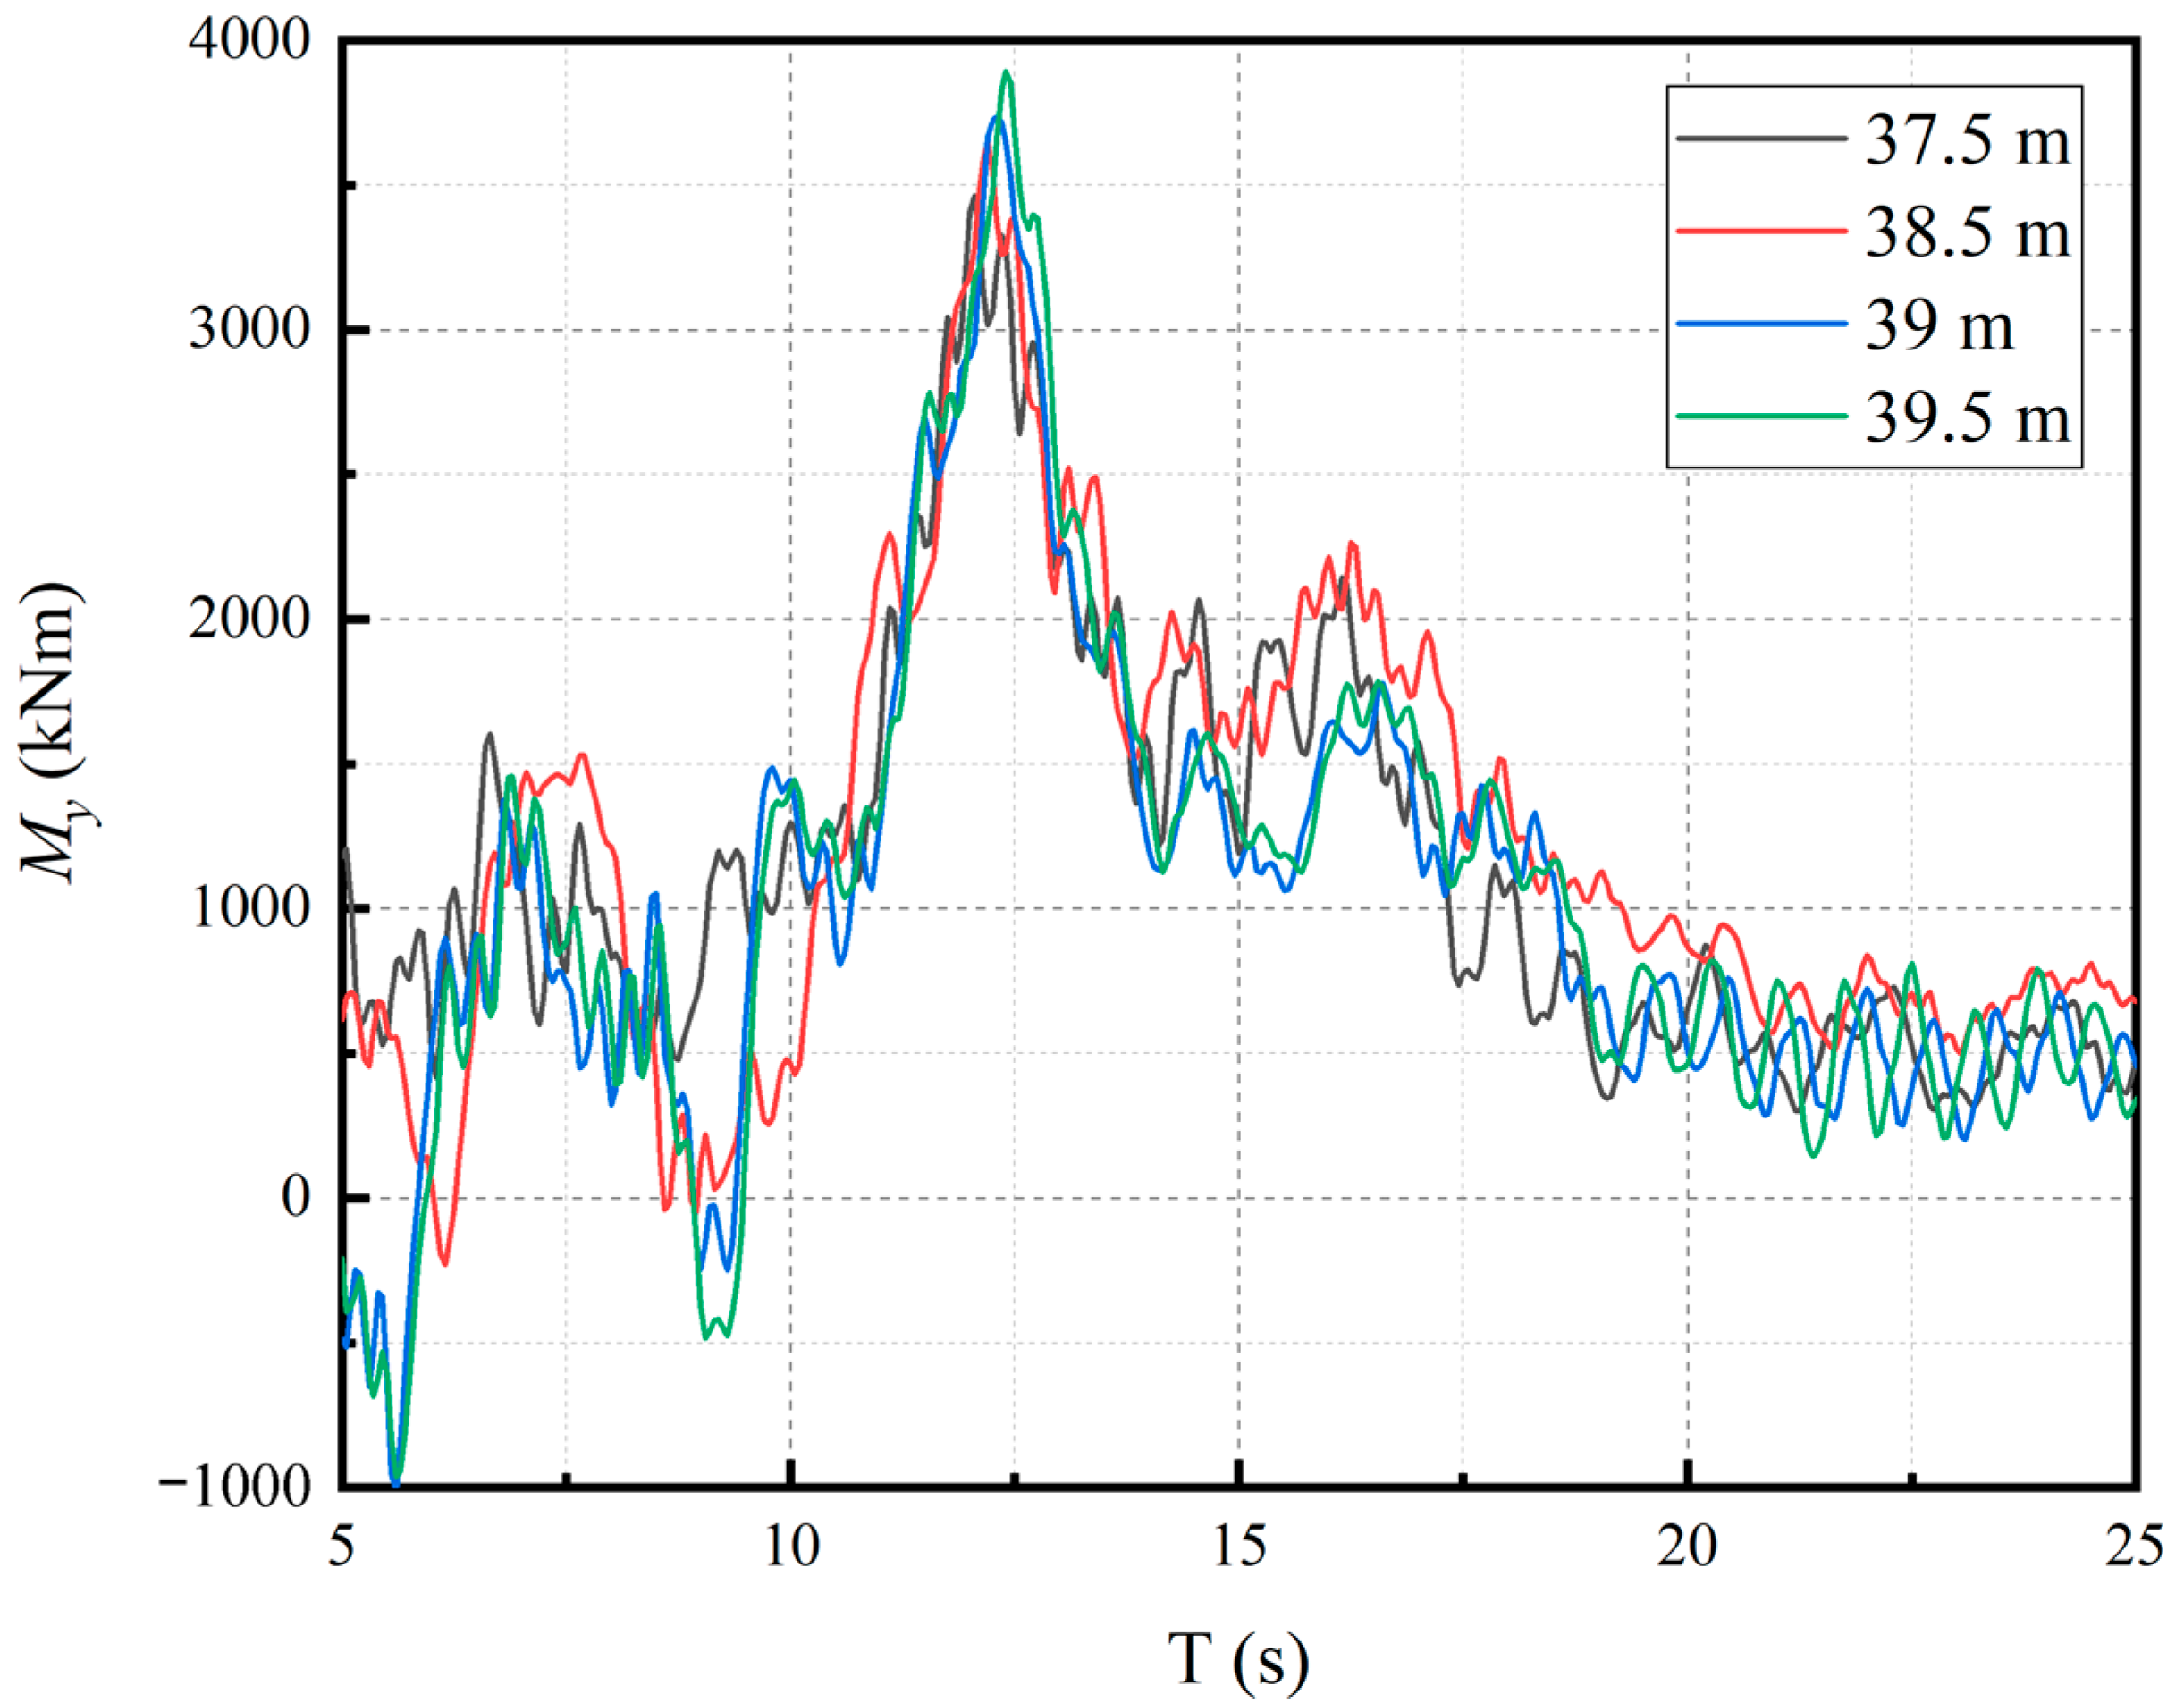
- By assessing the ultimate loads in different wind conditions, including NTM, ETM, EOG, ECD and EWS, and analyzing their load time series, we reveal that the load fluctuation trend is similar in the same wind condition. Wind turbine fault, shutdown and gust can lead to large load fluctuations and the amplitude of fluctuations shows a monotonic increase with the extension length of the blades. The trend of ultimate load variation with the blade extension is similar for different wind conditions.
- 3.
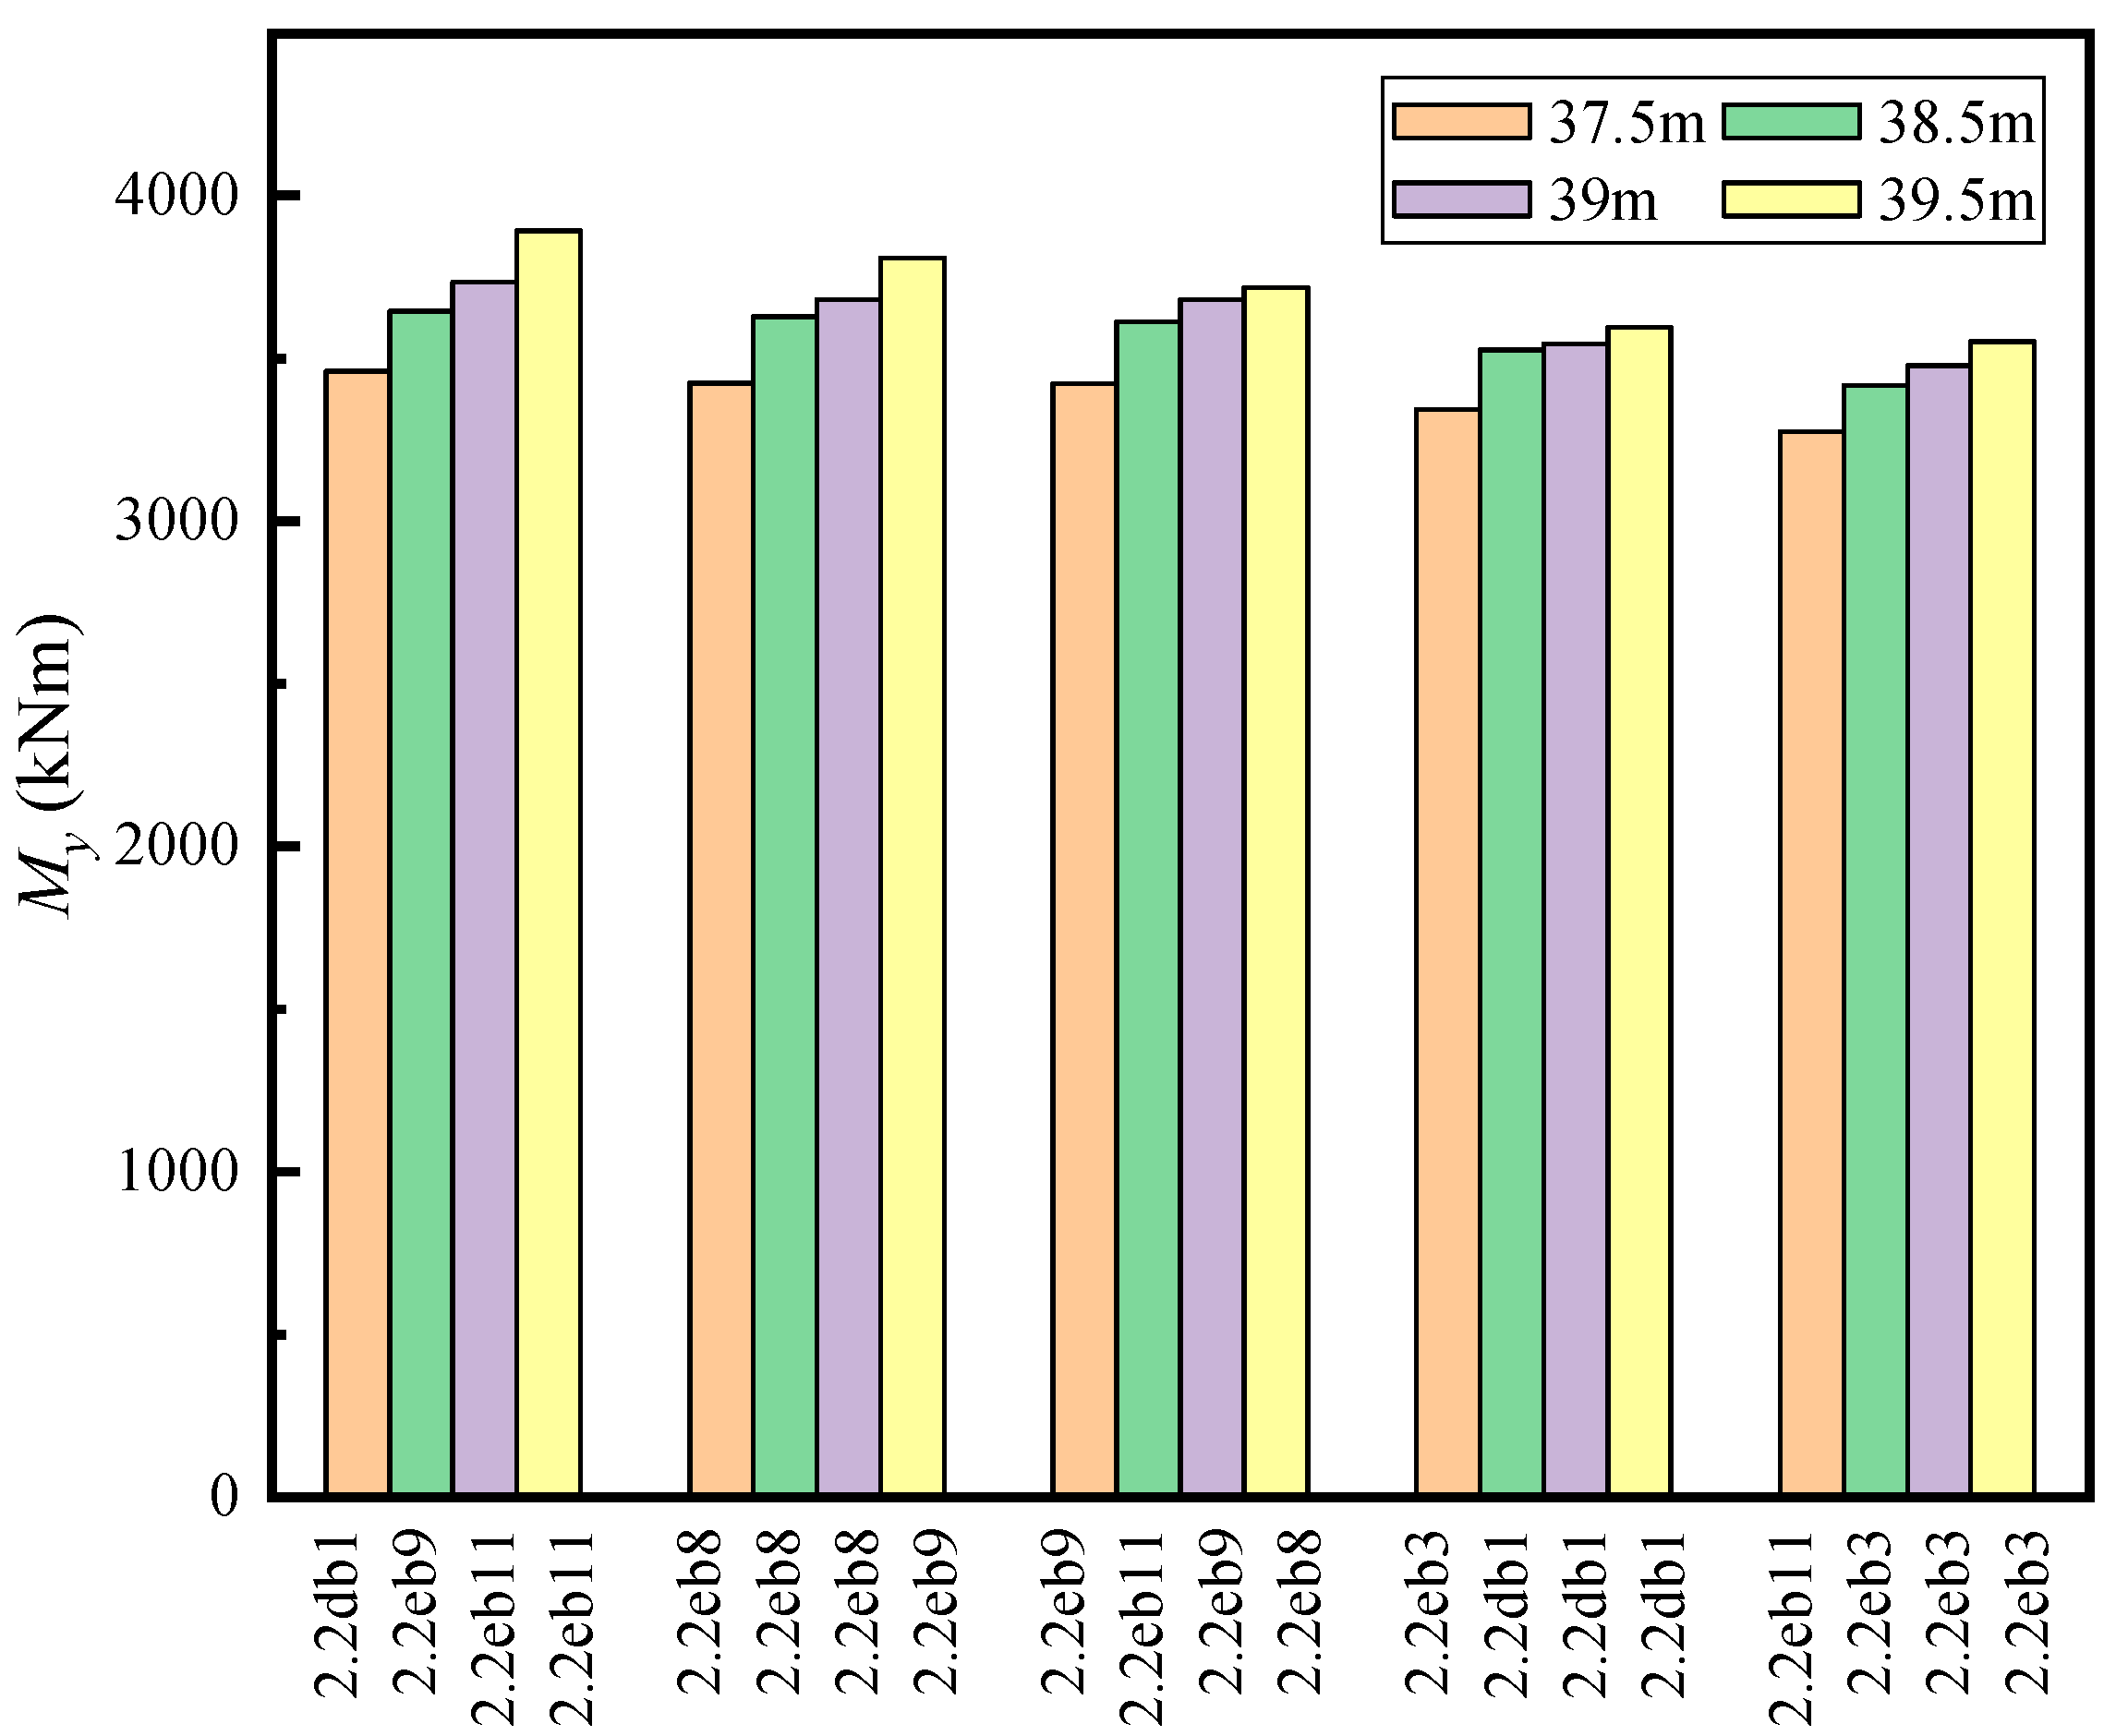
- By evaluating the ultimate loads for all design load cases, we find that the ultimate loads of My and Fx at blade root and tower bottom, and the Mx, My and Myz at the hub all increase significantly after the blade extension. In particular, the percentage increase of these quantities is over 10% when the blade extension achieves 2 m. Compared with the steady operational loads, the dynamic ultimate loads have the same growth trend, but often increase by a larger percentage.
- 4.
- Considering the cost and power generation revenue, the economy improves with the increase in blade length within the safety margin.
Author Contributions
Funding
Institutional Review Board Statement
Informed Consent Statement
Data Availability Statement
Conflicts of Interest
References
- Lee, J.; Zhao, F. Global Wind Report 2022; GWEC: Brussels, Belgium, 2022; p. 8. [Google Scholar]
- Zhang, H.; Ge, M.W.; Liu, Y.; Yang, X. A new coupled model for the equivalent roughness heights of wind farms. Renew. Energy 2021, 171, 34–46. [Google Scholar] [CrossRef]
- Wang, Q.; Luo, K.; Wu, C.; Zhu, Z.; Fan, J. Mesoscale simulations of a real onshore wind power base in complex terrain: Wind farm wake behavior and power production. Energy 2022, 241, 122873. [Google Scholar] [CrossRef]
- Huang, Y.H.; Yang, R.Z. Analysis and Research on Extended Wind Turbine Blades. Tianjin Sci. Technol. 2019, 46, 36–37+42. (In Chinese) [Google Scholar]
- Yang, J.; Xie, W.; Zhang, W.; Wang, S.F.; Yang, S.S. Evaluation of Blade Root Extension for Fixed Pitch Wind Turbine. Wind Energy 2019, 7, 78–82. (In Chinese) [Google Scholar]
- Jin, X.D.; Hu, G.S.; Zhang, P.; An, Y.; Ma, X.T.; Wang, G.H.; Jin, Y.F. Study on Improving Power Generation Capacity of Wind Turbine by Replacing extension blades. In Proceedings of the 7th China Wind Power Aftermarket Exchange and Cooperation Conference, Wuxi, China, 20 August 2020. (In Chinese). [Google Scholar]
- Wang, H.M.; Zeng, X.G. Analysis of the Feasibility and AEP Improvement of Blade Extension in an In-Service Wind Turbine. Wind. Energy 2021, 06, 72–75. (In Chinese) [Google Scholar]
- Wu, G.; Qin, Z.; Zhang, L.; Yang, K. Strain Response Analysis of Adhesively Bonded Extended Composite Wind Turbine Blade Suffering Unsteady Aerodynamic Loads. Eng. Fail. Anal. 2018, 85, 36–49. [Google Scholar] [CrossRef]
- Timmer, W.A.; Van Rooij, R.P.J.O.M. Summary of the Delft University Wind Turbine Dedicated Airfoils. J. Sol. Energy Eng. 2003, 125, 488–496. [Google Scholar] [CrossRef]
- Fernandez-Gamiz, U.; Zulueta, E.; Boyano, A.; Ansoategui, I.; Uriarte, I. Five MegawattWind Turbine Power Output Improvements by Passive Flow Control Devices. Energies 2017, 10, 742. [Google Scholar] [CrossRef] [Green Version]
- Skrzypiński, W.; Gaunaa, M.; Bak, C. The Effect of Mounting Vortex Generators on the DTU 10MW Reference Wind Turbine Blade. J. Phys. Conf. Ser. 2014, 524, 012034. [Google Scholar] [CrossRef]
- Hu, H.; Li, K.X.; Gu, B. Flow characteristics Study of Wind Turbine Blade with Vortex Generators. Int. J. Aerosp. Eng. 2016, 2016, 6531694. [Google Scholar] [CrossRef] [Green Version]
- Kai, C.H.E.N.; Zhenyu, Z.H.A.N.G.; Tongguang, W.A.N.G. CFD-Based Power Enhancement of Winglets for Horizontal-axis Wind Turbines. Acta Energ. Sol. Sin. 2021, 42, 272–278. (In Chinese) [Google Scholar]
- Nie, X.Q.; Ge, W.P.; Li, J.X.; Li, D. A Numerical Analysis of the Impact of Winglets on the Aerodynamic Performance of Wind Turbine. Electr. Power Sci. Eng. 2020, 36, 58–67. (In Chinese) [Google Scholar]
- Khalafallah, M.G.; Ahmed, A.M.; Emam, M.K. The Effect of Using Winglets to Enhance the Performance of Swept Blades of a Horizontal Axis Wind Turbine. Adv. Mech. Eng. 2019, 11, 1687814019878312. [Google Scholar] [CrossRef] [Green Version]
- Bossanyi, E.A. GH Bladed Theory Manual; Garrad Hassan and Partners Limited: London, UK, 2009; p. 4+13. [Google Scholar]
- Fu, D.Y.; Qin, S.Y. Wind Turbine Design Load Validation Based on Load Measurement. Renew. Energy Resour. 2013, 31, 38–40+44. (In Chinese) [Google Scholar]
- Guo, H.; Li, Z.; Jiang, J.; Guo, T.; Liang, G.; Xing, Z. Time Domain Characteristic Analysis of Wind Turbine Tower Load Based on Imbalanced Fault of Wind Wheel. In Proceedings of the 2020 International Conference on Optoelectronic Materials and Devices (ICOMD), Guangzhou, China, 18–20 December 2020. [Google Scholar]
- Li, J. Study on the Simulation and Optimization of the Large Wind Turbine and Its Key Components. Ph.D. Thesis, Chongqing University, Chongqing, China, 1 March 2011. (In Chinese). [Google Scholar]
- Kim, B.; Kim, W.; Lee, S.; Bae, S.; Lee, Y. Developement and Verification of a Performance Based Optimal Design Software for Wind Turbine Blades. Renew. Energy 2013, 54, 166–172. [Google Scholar] [CrossRef]
- Toft, H.S.; Sørensen, J.D.; Veldkamp, D. Assessment of Load Extrapolation Methods for Wind Turbines. J. Sol. Energy Eng. 2011, 133, 021001. [Google Scholar] [CrossRef]
- Yang, Q.; Li, Y.; Li, T.; Zhou, X.; Huang, G.; Lian, J. Statistical Extrapolation Methods and Empirical Formulae for Estimating Extreme Loads on Operating Wind Turbine Towers. Eng. Struct. 2022, 267, 114667. [Google Scholar] [CrossRef]
- IEC 61400-1, Wind turbines-Part 1: Design Requirements, 3rd ed.; IEC: London, UK, 2005.
- Bossanyi, E.A. GH Bladed User Manual; Garrad Hassan and Partners Limited: London, UK, 2009; p. 40. [Google Scholar]


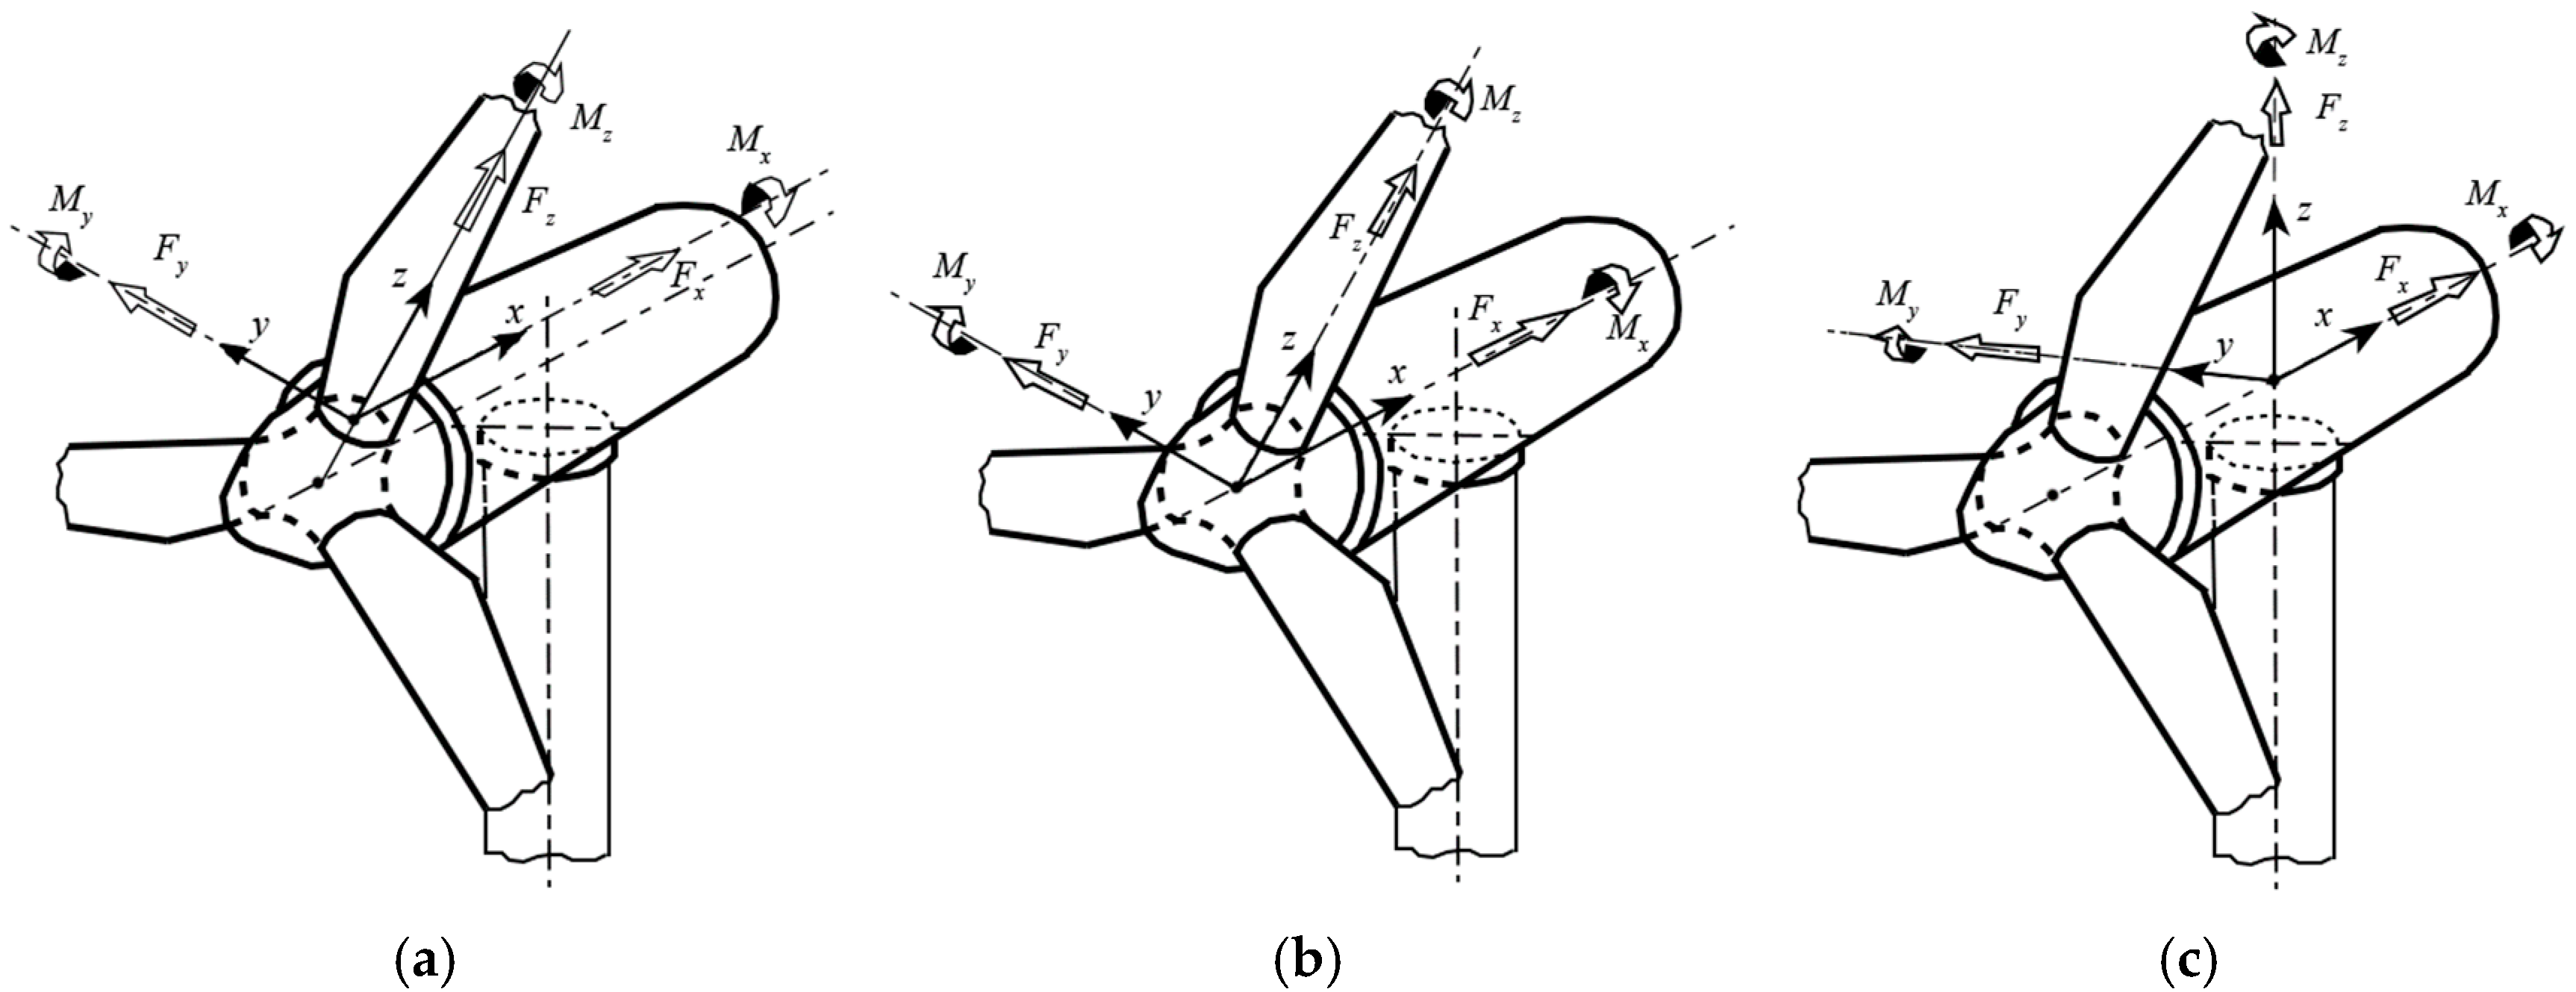
| Wind Conditions | Operating Conditions | Vhub (m/s) | Yaw Error (deg) | Starting Azimuth Angle (deg) | Design Load Case |
|---|---|---|---|---|---|
| NTM | Power production plus occurrence of fault, emergency shutdown | 3~25 | — | — | 2.1, 2.2, 5.1 |
| ETM | Power production | 3~25 | −8, 0, 8 | — | 1.3 |
| EOG | Power production plus loss of electrical grid connection, normal shutdown | 3~25 | −8, 0, 8 | 0–90 | 2.3, 4.2 |
| ECD | Power production | 3~25 | −8, 0, 8 | 0–90 | 1.4 |
| EWS | Power production | 3~25 | −8, 0, 8 | 0–90 | 1.5 |
| EWM | Idling | 42.5 | −8, 0, 8 | — | 6.1 |
| Idling with loss of electrical network connection | 42.5 | 0~330 | — | 6.2 | |
| Idling with extreme yaw misalignment | 34 | −20~20 | — | 6.3 | |
| Idling with pitch failure | 34 | −8, 0, 8 | — | 7.1 |
| Parameters | Value | |
|---|---|---|
| Cut-in wind speed, Vin | 3 m/s | |
| Rated wind speed, Vr | 11.3 m/s | |
| Cut-out wind speed, Vout | 25 m/s | |
| Annual average wind speed, Vave | 8.5 m/s | |
| Characteristic turbulence intensity at 15 m/s, Iref | 0.16 | |
| Hub-height 1-year extreme mean wind speed, V1 | 34 m/s | |
| Hub-height 50-year extreme mean wind speed, V50 | 42.5 m/s | |
| Flow inclination | 8° | |
| Wind speed distribution | Rayleigh distribution | |
| Wind shear exponent | α = 0.11 (EWM), α = 0.2 (otherwise) | |
| Turbine lifetime | 20 years | |
| Electrical losses | No load power loss, L0 | 15 kW |
| Efficiency, ε | 95.53% | |
| Blade Length (m) | λ | CP | Kopt |
|---|---|---|---|
| 37.5 | 8.8 | 0.480876 | 0.102538 |
| 38.5 | 9.1 | 0.482111 | 0.105666 |
| 39 | 9.2 | 0.482825 | 0.109048 |
| 39.5 | 9.4 | 0.482835 | 0.10878 |
| Vave (m/s) | 7.5 | 8 | 8.5 | |||
|---|---|---|---|---|---|---|
| Blade Length (m) | AEP (MWh) | ΔAEP (%) | AEP (MWh) | ΔAEP (%) | AEP (MWh) | ΔAEP (%) |
| 37.5 | 5391.84 | — | 5932.44 | — | 6430.44 | — |
| 38.5 | 5568.44 | 3.28 | 6109.63 | 2.99 | 6605.93 | 2.73 |
| 39 | 5648.53 | 4.76 | 6189.15 | 4.33 | 6683.97 | 3.94 |
| 39.5 | 5727.84 | 6.23 | 6267.92 | 5.66 | 6761.3 | 5.15 |
| 37.5 m | 38.5 m/ 37.5 m | 39 m/ 37.5 m | 39.5 m/ 37.5 m | 37.5 m | 38.5 m/ 37.5 m | 39 m/ 37.5 m | 39.5 m/ 37.5 m | ||||
|---|---|---|---|---|---|---|---|---|---|---|---|
| Wind rotor | T | 197.732 | 103.36% | 104.56% | 105.60% | Tower bottom | My | 12,249.6 | 102.43% | 103.88% | 104.42% |
| Blade root | My | 1793.12 | 103.89% | 105.92% | 107.13% | Fx | 209.888 | 102.18% | 103.55% | 103.99% | |
| Mz | 4.45414 | 126.66% | 141.67% | 153.75% | Yaw bearing | My | 322.444 | 102.64% | 104.17% | 104.79% | |
| Hub | Fx | 198.929 | 102.72% | 104.27% | 104.93% | Fx | 199.598 | 102.65% | 104.18% | 104.81% | |
| Blade Length | 37.5 m | 38.5 m | 39 m | 39.5 m |
|---|---|---|---|---|
| Vm (m/s) | 11.2 | 10.9 (97.32%) | 10.8 (96.43%) | 10.6 (94.64%) |
| CT | 0.551 | 0.572 (103.81%) | 0.574 (104.17%) | 0.587 (106.53%) |
| A (m2) | 4668.7 | 4914.1 (105.26%) | 5039.1 (107.93%) | 5165.7 (110.65%) |
| T (kN) | 197.6 | 204.5 (103.36%) | 206.6 (104.56%) | 208.7 (105.60%) |
| 37.5 m | 38.5 m/ 37.5 m | 39 m/ 37.5 m | 39.5 m/ 37.5 m | |
|---|---|---|---|---|
| Mx | 2251.6 | 104.26% | 105.11% | 103.58% |
| My | 3462 | 105.35% | 107.92% | 112.49% |
| Mxy | 4027.4 | 106.57% | 107.77% | 110.59% |
| Mz | 51.1 | 129.16% | 150.29% | 161.25% |
| Fx | 175.9 | 104.78% | 104.72% | 107.39% |
| Fy | 142 | 102.46% | 105.56% | 99.08% |
| Fxy | 222.2 | 104.55% | 103.60% | 105.54% |
| Fz | 326.4 | 101.84% | 101.90% | 102.14% |
| Blade Length (m) | Ultimate Load of My (kNm) | Load Case |
|---|---|---|
| 37.5 | 3462 | 2.2db1 |
| 38.5 | 3647.1 | 2.2eb9 |
| 39 | 3736.1 | 2.2eb11 |
| 39.5 | 3894.4 | 2.2eb11 |
| 37.5 m | 38.5 m/ 37.5 m | 39 m/ 37.5 m | 39.5 m/ 37.5 m | |
|---|---|---|---|---|
| Mx | 1371.8 | 101.10% | 107.29% | 111.66% |
| My | 3917 | 104.86% | 109.20% | 112.97% |
| Mz | 3595.8 | 97.86% | 94.03% | 91.48% |
| Myz | 4151 | 106.88% | 109.00% | 111.45% |
| Fx | 289.2 | 102.70% | 102.70% | 102.97% |
| Fy | 448.6 | 99.15% | 99.58% | 101.54% |
| Fz | 382.9 | 103.47% | 102.35% | 105.07% |
| Fyz | 450.1 | 101.84% | 103.00% | 102.47% |
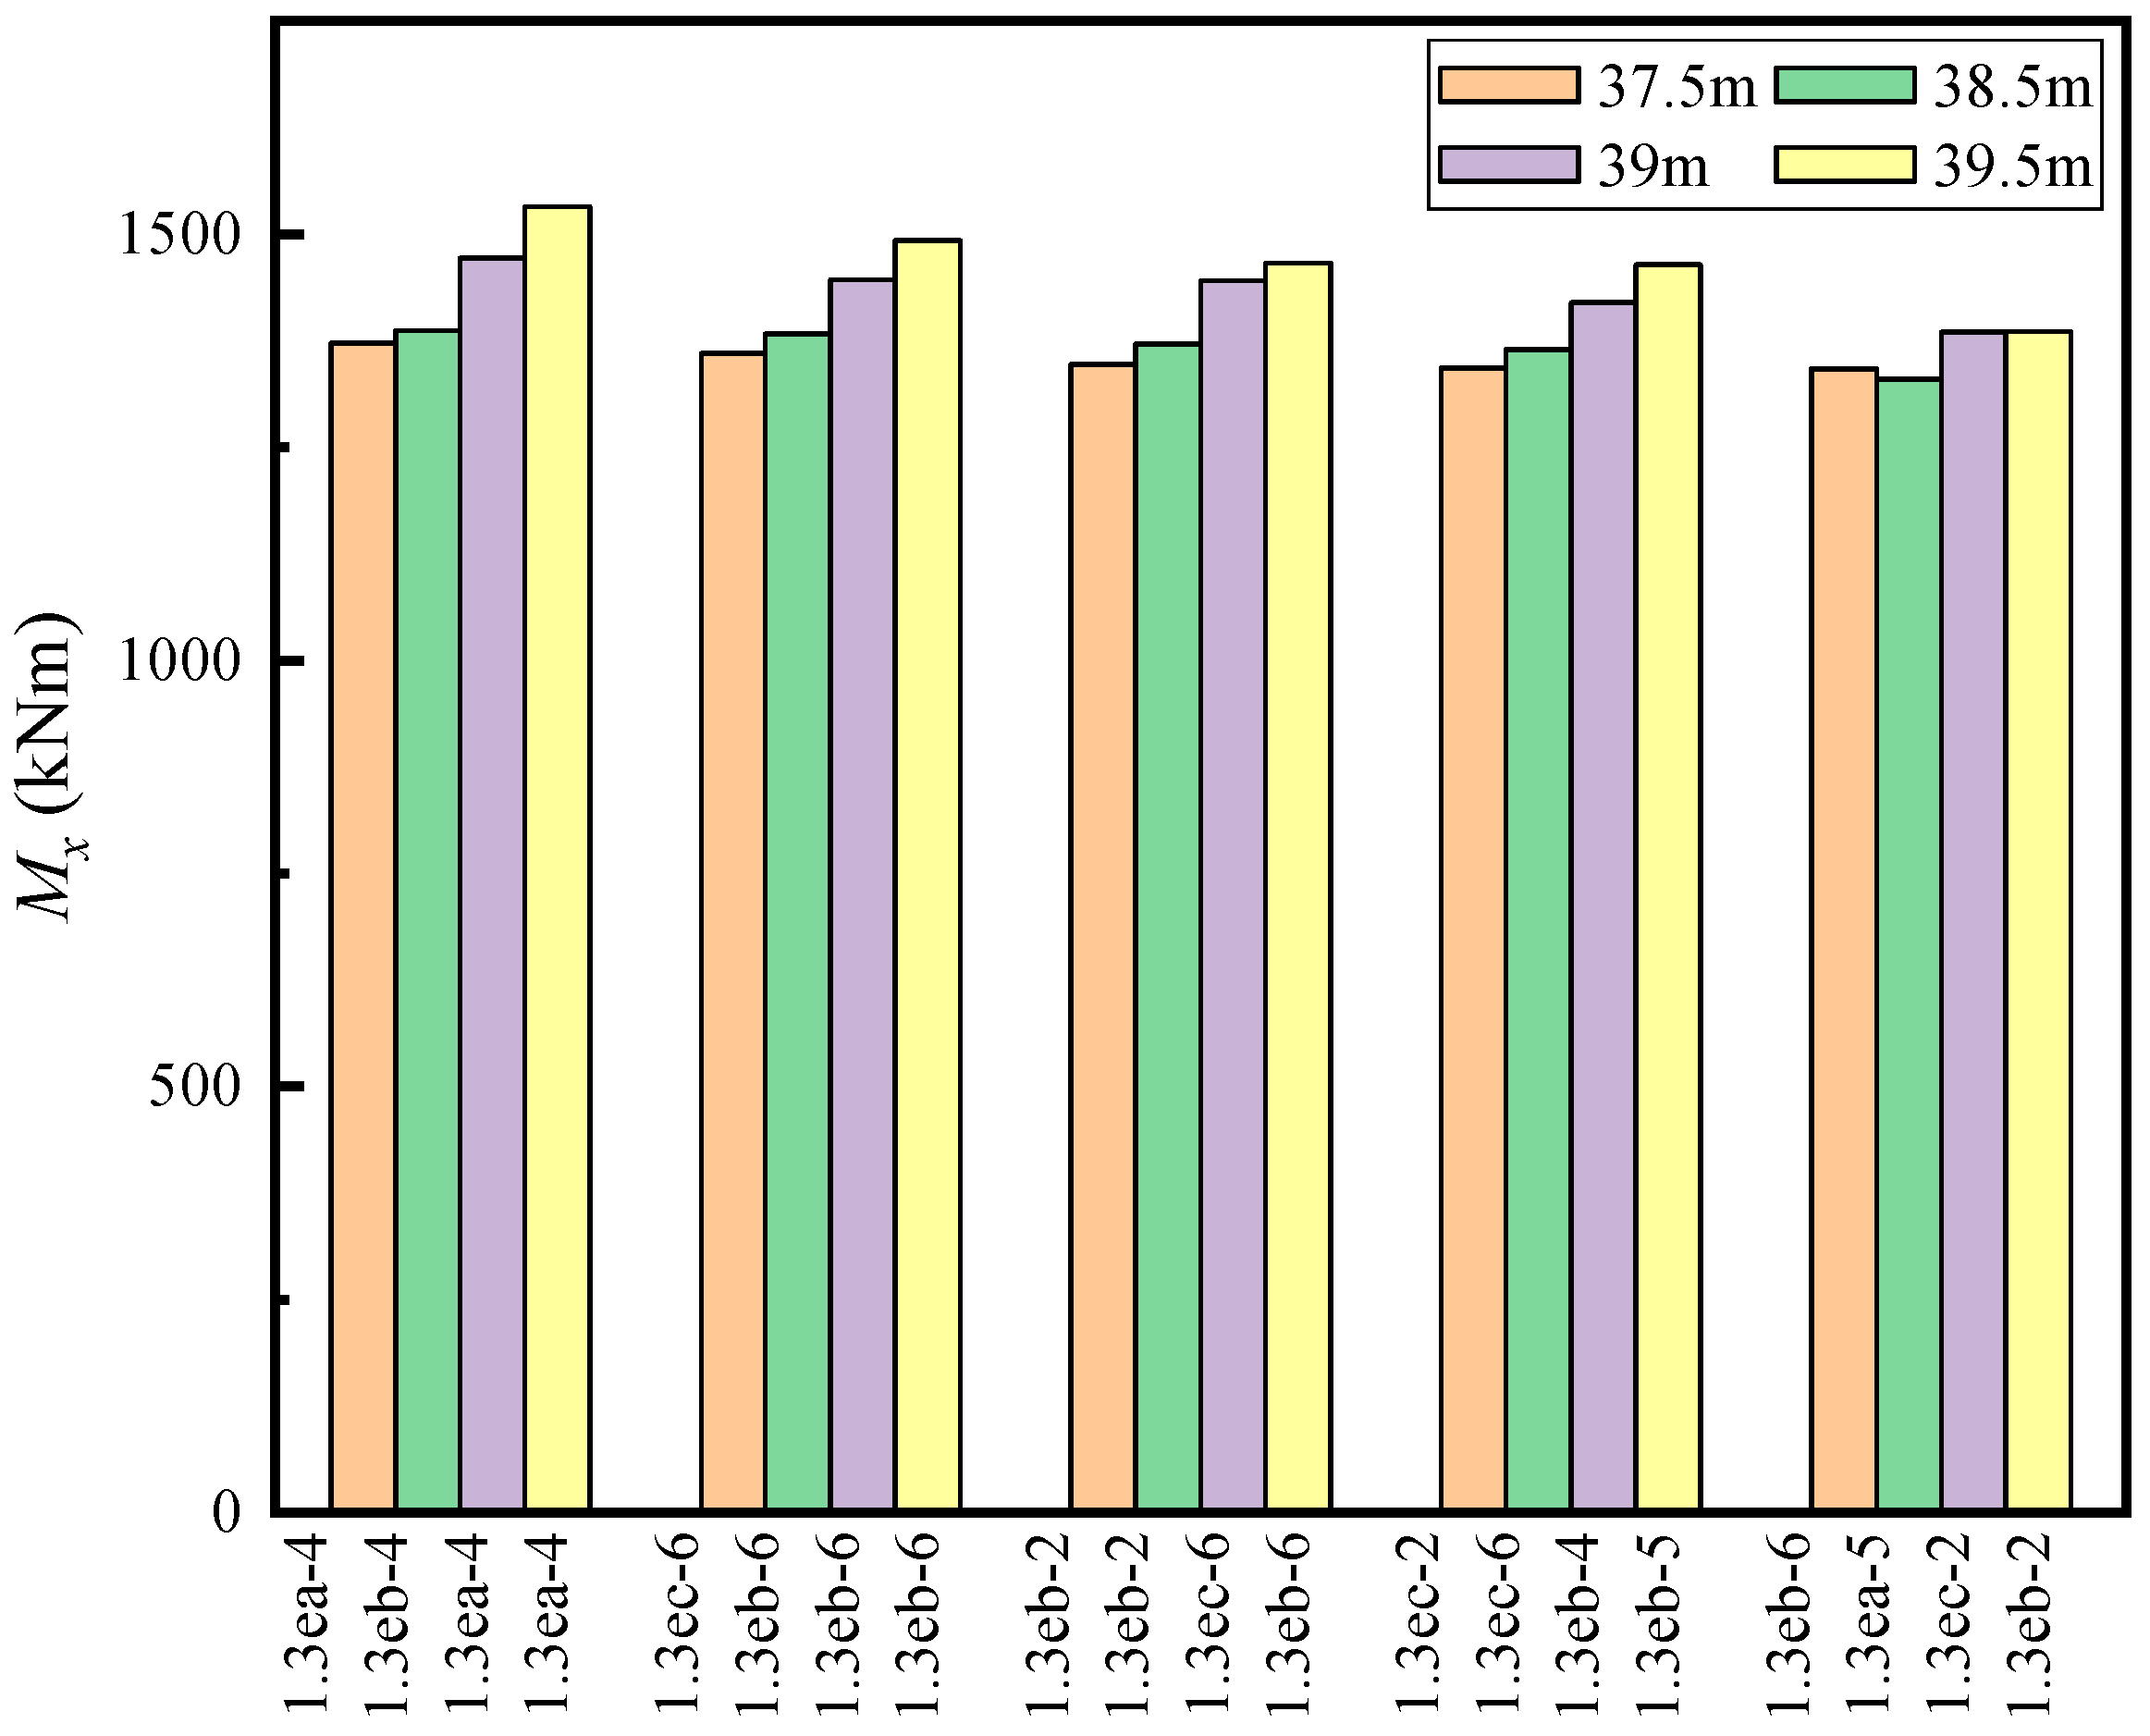
| Blade Length (m) | Ultimate Load of Mx (kNm) | Load Case |
|---|---|---|
| 37.5 | 1371.8 | 1.3ea-4 |
| 38.5 | 1386.9 | 1.3eb-4 |
| 39 | 1471.8 | 1.3ea-4 |
| 39.5 | 1531.8 | 1.3ea-4 |
| 37.5 m | 38.5 m/37.5 m | 39 m/37.5 m | 39.5 m/37.5 m | |||||
|---|---|---|---|---|---|---|---|---|
| Dynamic | Steady | Dynamic | Steady | Dynamic | Steady | Dynamic | Steady | |
| My | 3462 | 1793.12 | 105.35% | 103.89% | 107.92% | 105.92% | 112.49% | 107.13% |
| Mxy | 4027.4 | 1815.77 | 106.57% | 103.78% | 107.77% | 105.78% | 110.59% | 106.93% |
| Fx | 175.9 | 80.3127 | 104.78% | 102.50% | 104.72% | 103.96% | 107.39% | 104.59% |
| Fxy | 222.2 | 81.5425 | 104.55% | 102.37% | 103.65% | 103.78% | 105.54% | 104.35% |
| 37.5 m | 38.5 m/37.5 m | 39 m/37.5 m | 39.5 m/37.5 m | |||||
|---|---|---|---|---|---|---|---|---|
| Dynamic | Steady | Dynamic | Steady | Dynamic | Steady | Dynamic | Steady | |
| My | 24,004 | 12,249.6 | 105.49% | 102.43% | 111.84% | 103.88% | 115.43% | 104.42% |
| Fx | 415.5 | 209.888 | 98.53% | 102.18% | 104.02% | 103.55% | 107.20% | 103.99% |
| 37.5 m | 38.5 m/37.5 m | 39 m/37.5 m | 39.5 m/37.5 m | |||||
|---|---|---|---|---|---|---|---|---|
| Dynamic | Steady | Dynamic | Steady | Dynamic | Steady | Dynamic | Steady | |
| Fx | 331.4 | 198.929 | 103.77% | 102.72% | 105.34% | 104.27% | 106.28% | 104.93% |
| 37.5 m | 38.5 m/ 37.5 m | 39 m/ 37.5 m | 39.5 m/ 37.5 m | |
|---|---|---|---|---|
| Mx | 6807 | 101.93% | 102.77% | 102.71% |
| My | 24,004 | 105.49% | 111.84% | 115.43% |
| Mxy | 24,553 | 104.94% | 111.17% | 114.76% |
| Mz | 1882 | 103.16% | 104.46% | 105.50% |
| Fx | 396.1 | 103.36% | 109.11% | 112.47% |
| Fy | 121.8 | 100.00% | 100.66% | 100.82% |
| Fxy | 403.1 | 103.27% | 109.45% | 112.83% |
| Fz | 1797.9 | 100.13% | 100.19% | 100.27% |
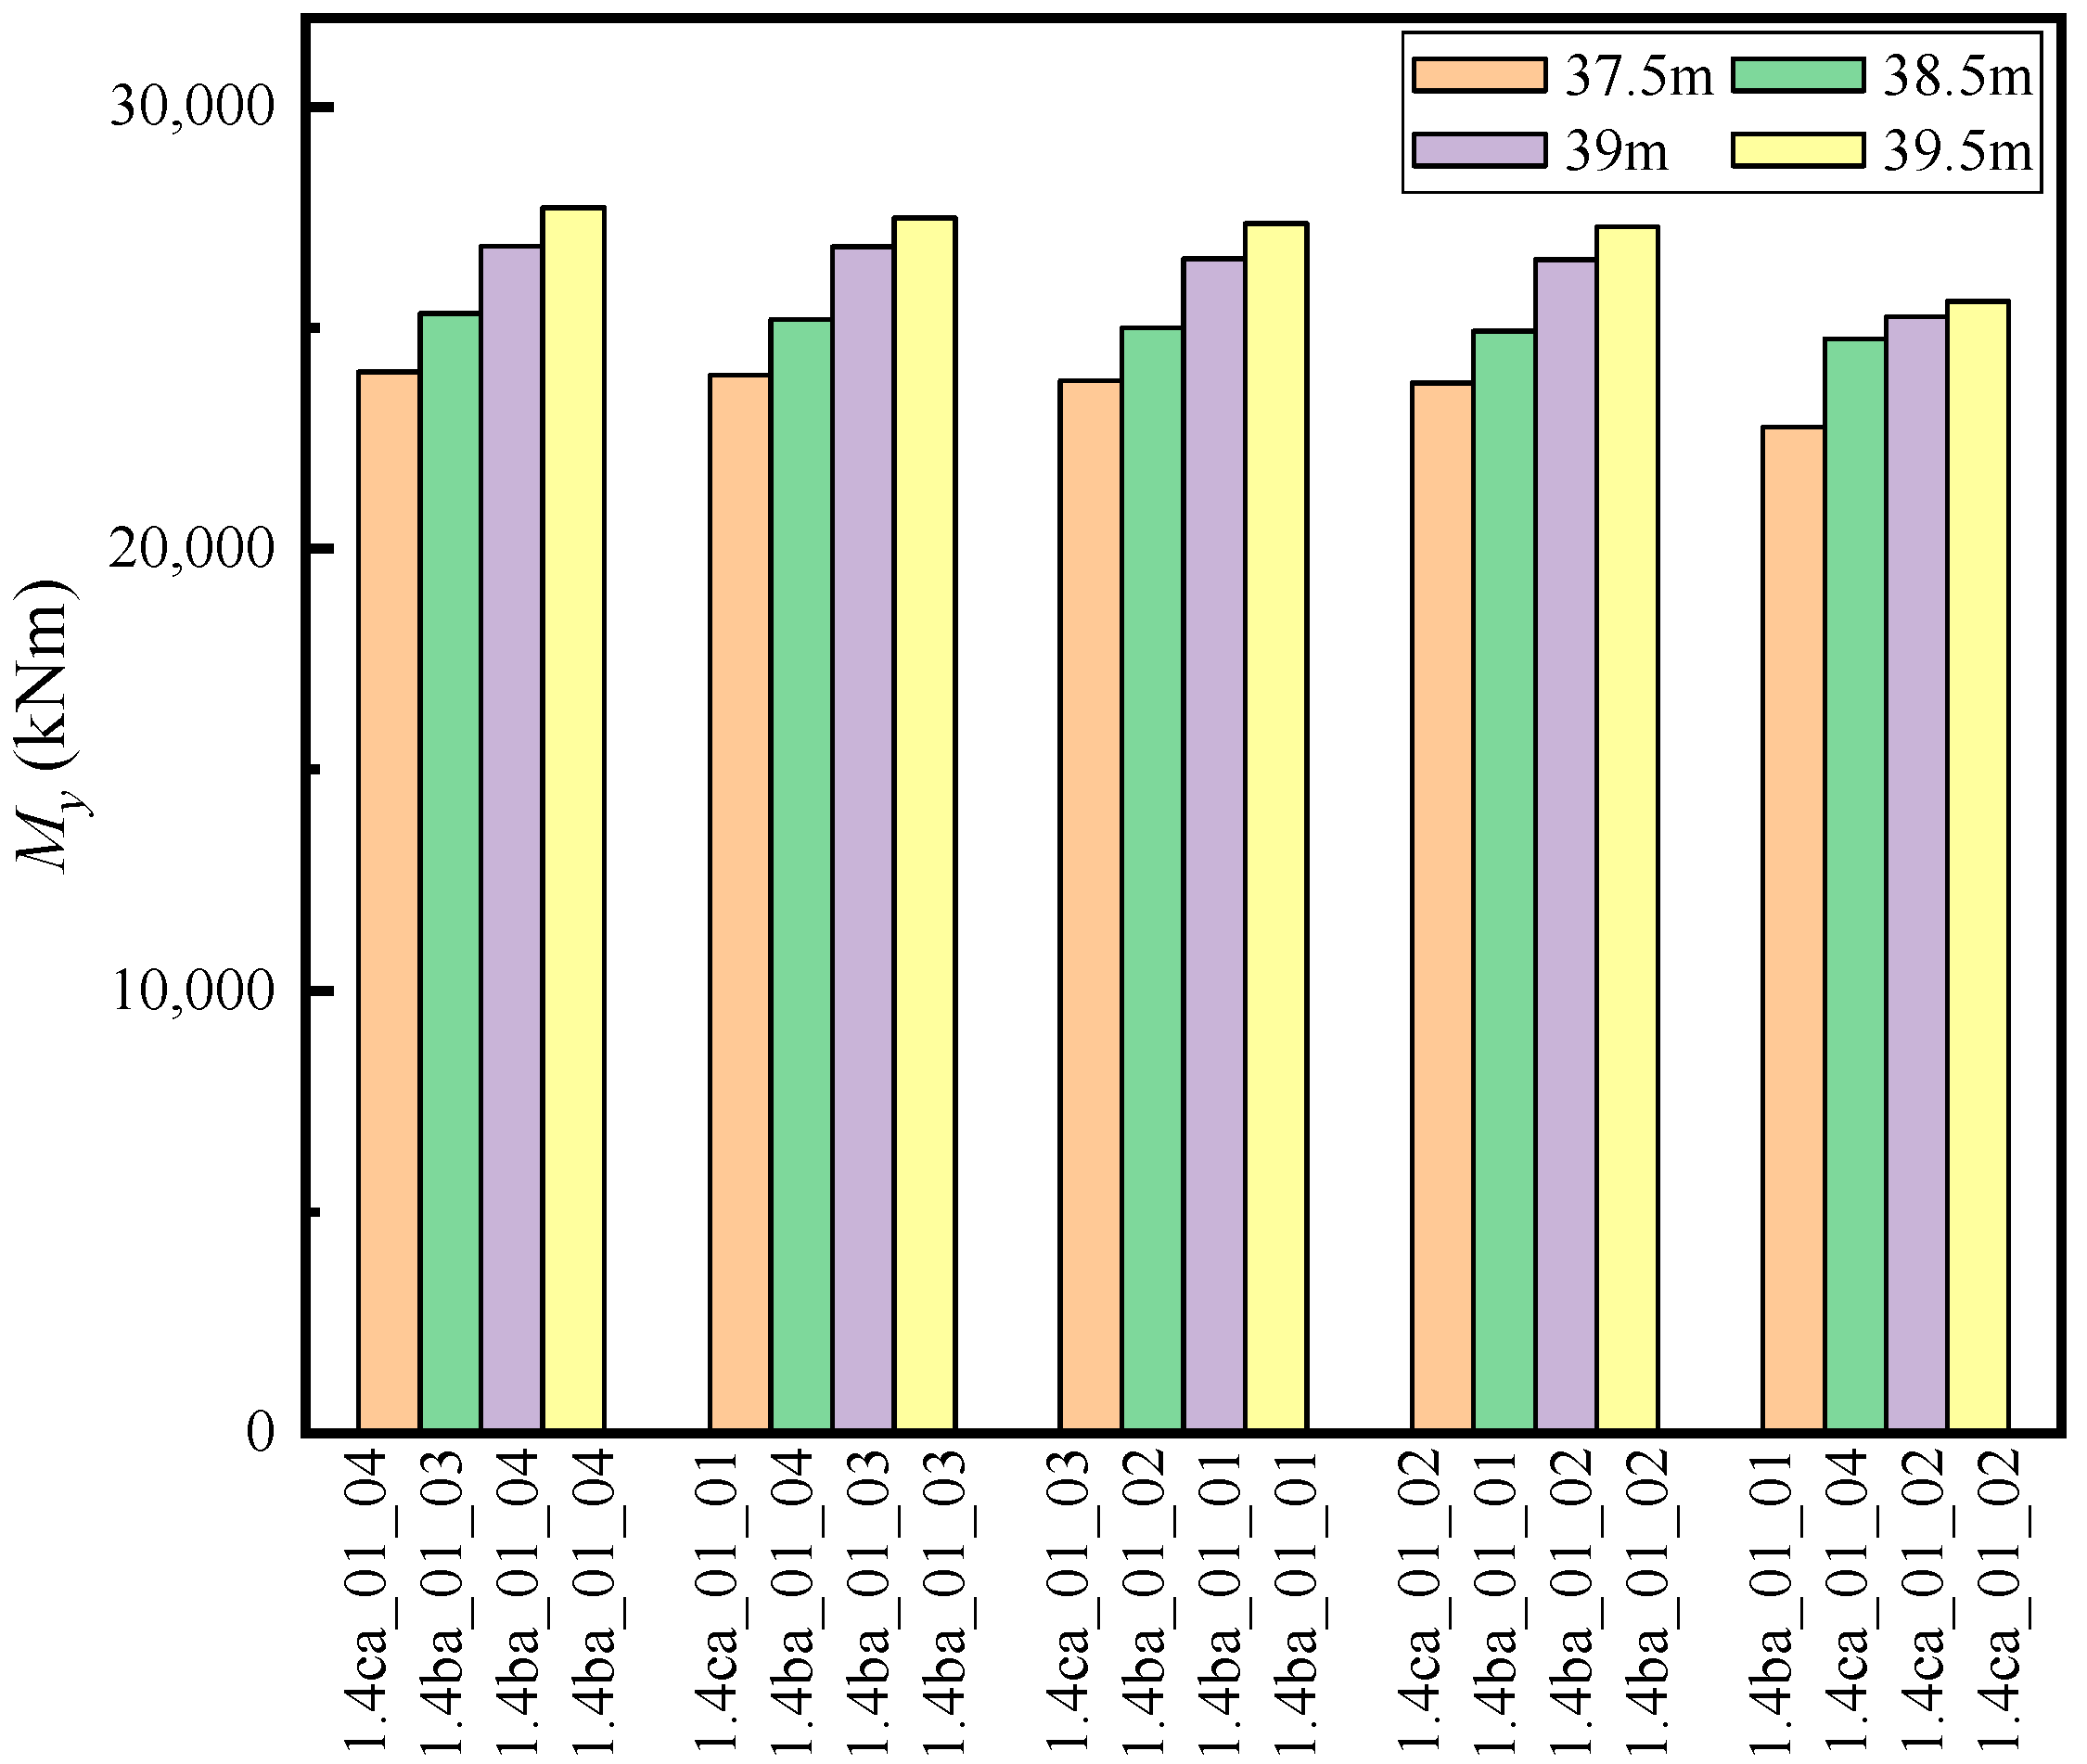
| Blade Length (m) | Ultimate Load of My (kNm) | Load Case |
|---|---|---|
| 37.5 | 24,004 | 1.4ca_01_04 |
| 38.5 | 25,322 | 1.4ba_01_03 |
| 39 | 26,846 | 1.4ba_01_04 |
| 39.5 | 27,707 | 1.4ba_01_04 |
| 37.5 m | 38.5 m/ 37.5 m | 39 m/ 37.5 m | 39.5 m/ 37.5 m | |
|---|---|---|---|---|
| Mx | 1160.9 | 101.58% | 102.05% | 103.02% |
| My | 3190.3 | 102.25% | 103.26% | 104.48% |
| Mxy | 3273 | 102.18% | 103.45% | 104.94% |
| Mz | 29.3 | 131.74% | 149.83% | 170.65% |
| Fx | 148.9 | 101.54% | 102.15% | 103.16% |
| Fy | 88.2 | 100.91% | 101.25% | 102.04% |
| Fxy | 158.4 | 101.83% | 102.40% | 103.35% |
| Fz | 406.8 | 101.35% | 101.92% | 102.26% |
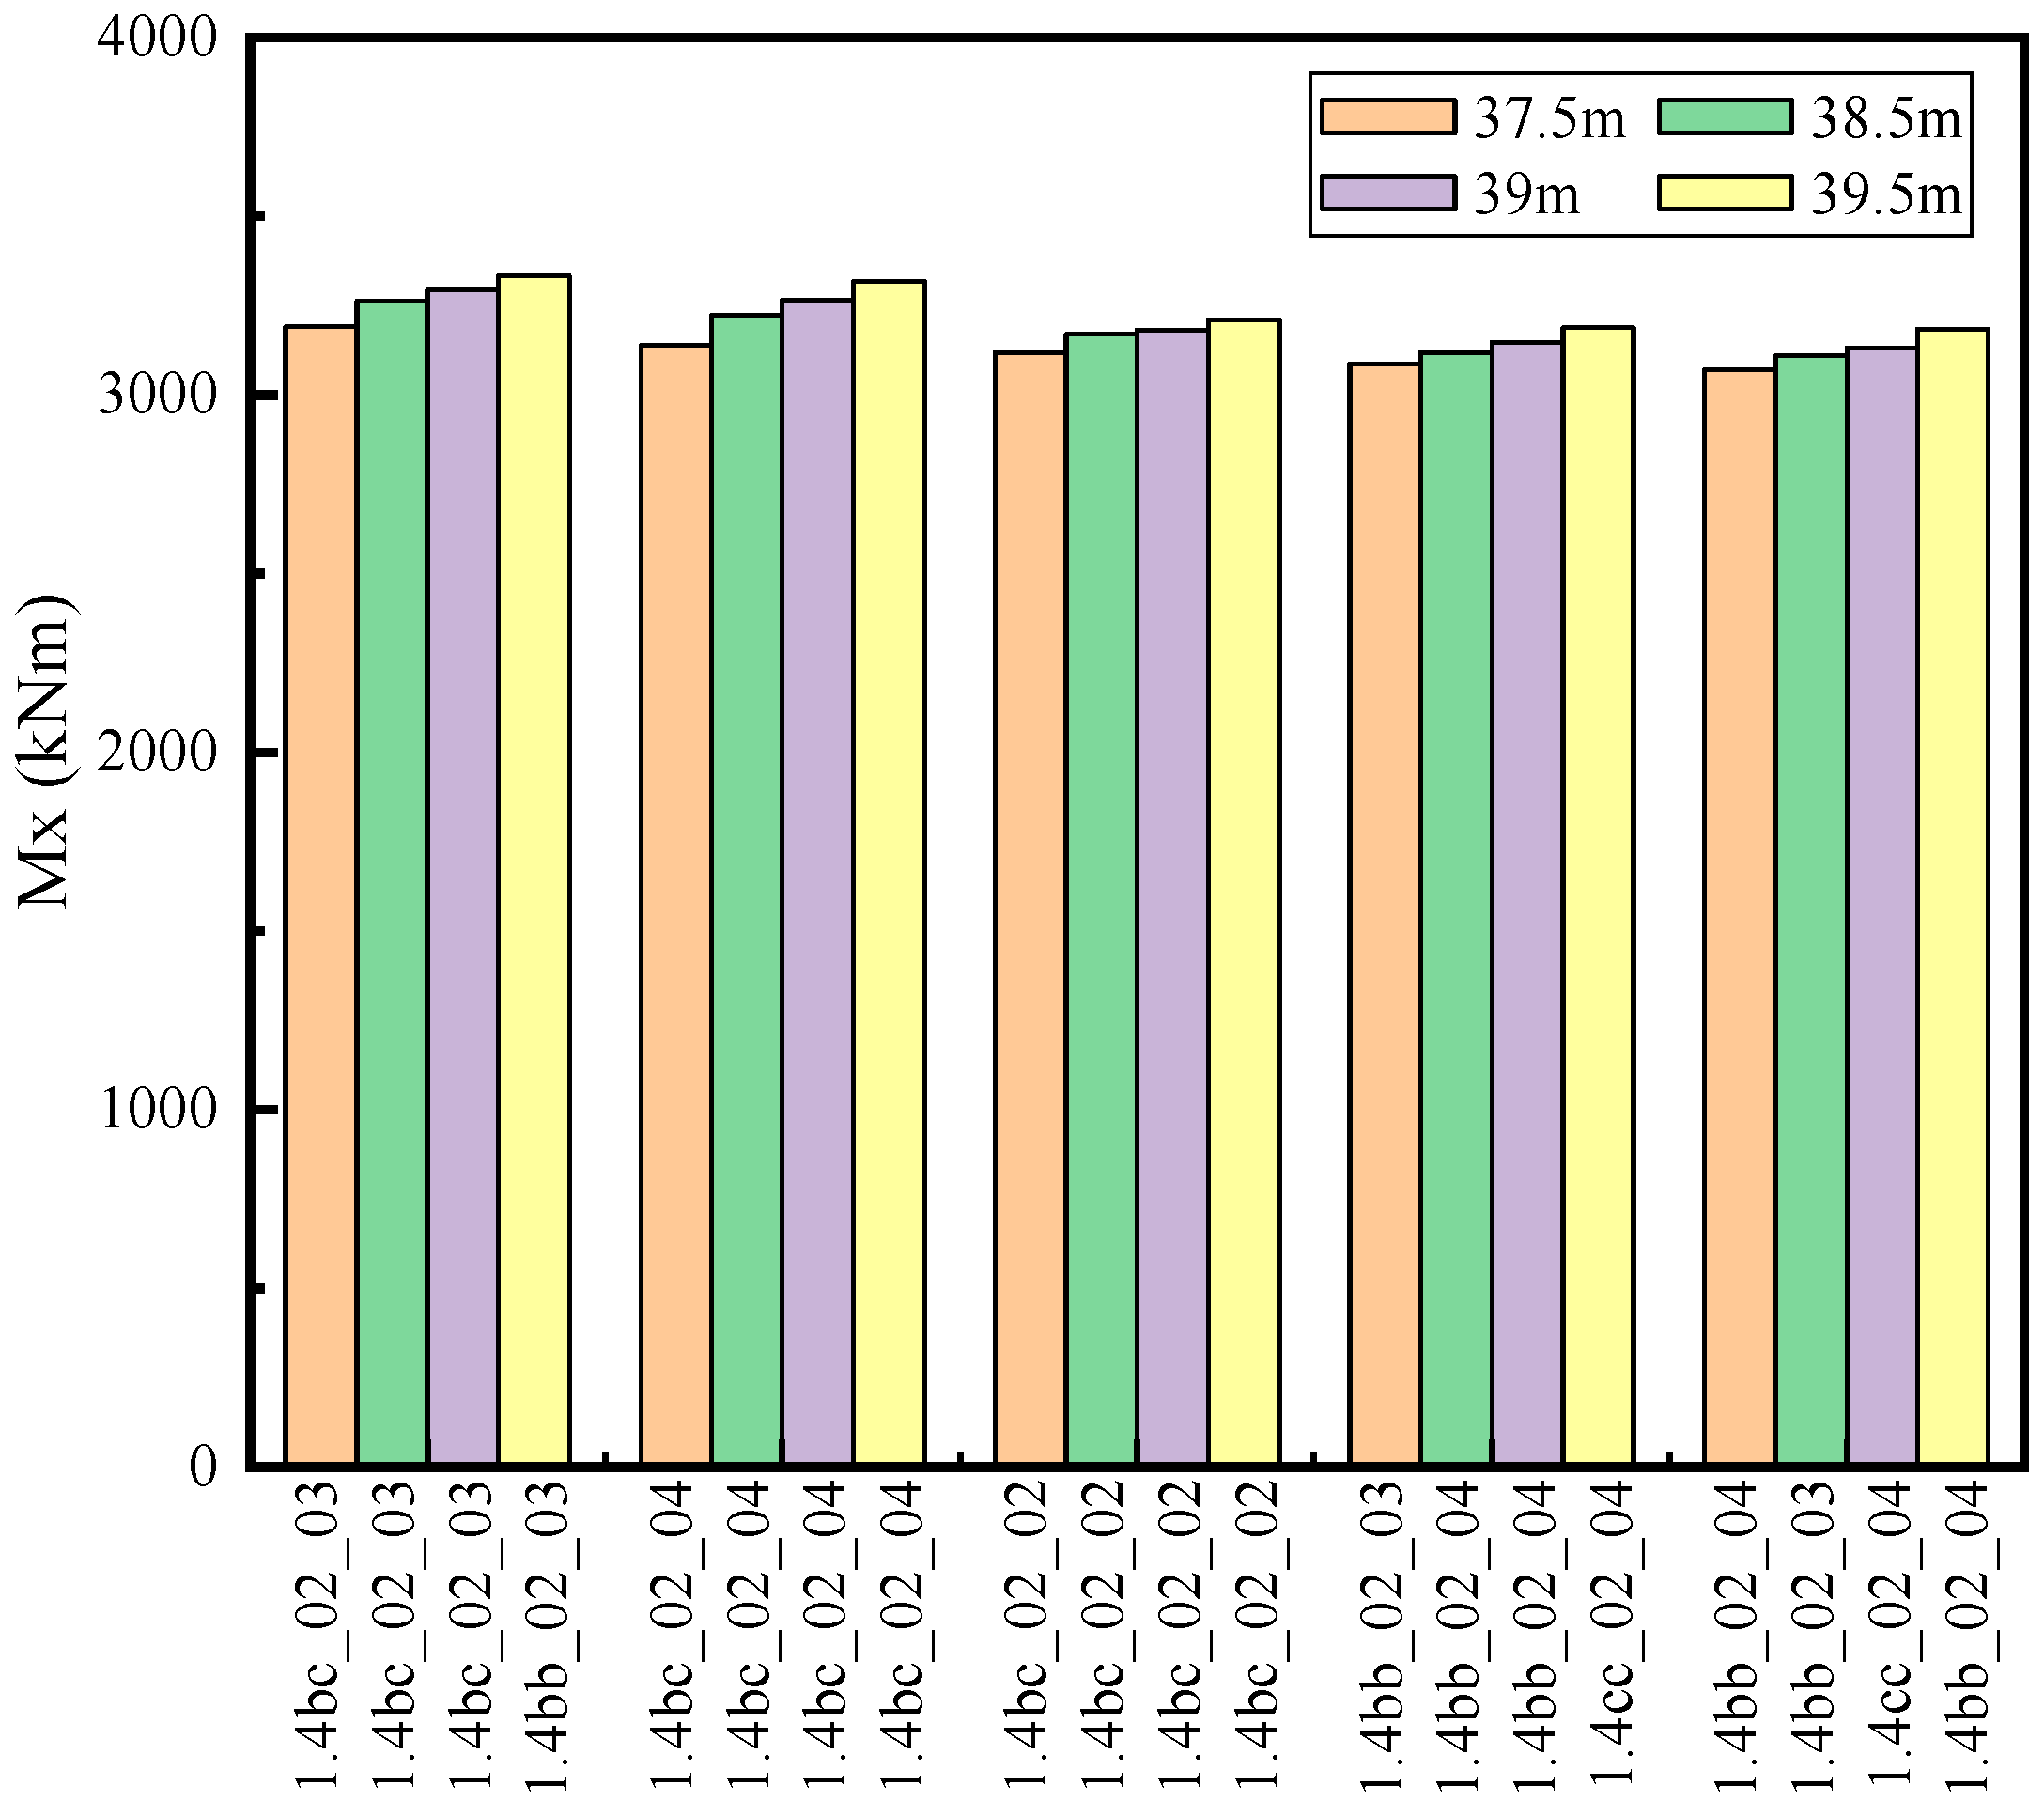
| Blade Length (m) | Ultimate Load of My (kNm) | Load Case |
|---|---|---|
| 37.5 | 3190.3 | 1.4bc_02_03 |
| 38.5 | 3262 | 1.4bc_02_03 |
| 39 | 3294.4 | 1.4bc_02_03 |
| 39.5 | 3333.2 | 1.4bc_02_03 |
| Blade Extension Length | 1 m | 1.5 m | 2 m |
|---|---|---|---|
| Cost of material (¥, thousand yuan) | 15.30 | 22.95 | 30.60 |
| Cost of mold (¥, thousand yuan) | 130 | 140 | 150 |
| Cost of tip manufacture (¥, thousand yuan) | 40 | 50 | 60 |
| Cost of transport and erection (¥, thousand yuan) | 150 | 165 | 180 |
| Revenue increase of power generation(¥, thousand yuan) | 78.97 | 114.09 | 148.89 |
| Payback period (year) | 4.25 | 3.32 | 2.83 |
Disclaimer/Publisher’s Note: The statements, opinions and data contained in all publications are solely those of the individual author(s) and contributor(s) and not of MDPI and/or the editor(s). MDPI and/or the editor(s) disclaim responsibility for any injury to people or property resulting from any ideas, methods, instructions or products referred to in the content. |
© 2023 by the authors. Licensee MDPI, Basel, Switzerland. This article is an open access article distributed under the terms and conditions of the Creative Commons Attribution (CC BY) license (https://creativecommons.org/licenses/by/4.0/).
Share and Cite
Li, Y.; Liang, X.; Cai, A.; Zhang, L.; Lin, W.; Ge, M. Effects of Blade Extension on Power Production and Ultimate Loads of Wind Turbines. Appl. Sci. 2023, 13, 3538. https://doi.org/10.3390/app13063538
Li Y, Liang X, Cai A, Zhang L, Lin W, Ge M. Effects of Blade Extension on Power Production and Ultimate Loads of Wind Turbines. Applied Sciences. 2023; 13(6):3538. https://doi.org/10.3390/app13063538
Chicago/Turabian StyleLi, Yuan, Xiao Liang, Anmin Cai, Linwei Zhang, Weirong Lin, and Mingwei Ge. 2023. "Effects of Blade Extension on Power Production and Ultimate Loads of Wind Turbines" Applied Sciences 13, no. 6: 3538. https://doi.org/10.3390/app13063538