Article

Structural and Vibro-Acoustics Optimization of a Car Body Rear Part

1
Department of Industrial Engineering, University of Salerno, Via Giovanni Paolo II 132, 84084 Fisciano, Italy
2
Stellantis S.p.a., Via ex Aeroporto, 80038 Pomigliano D’Arco, Italy
3
Department of Mechanical Engineering, University of Napoli, Via Claudio 21, 80125 Napoli, Italy
4
Department of Chemical, Materials and Production Engineering University of Napoli, Via Claudio 21, 80125 Napoli, Italy
*
Author to whom correspondence should be addressed.
Appl. Sci. 2023, 13(6), 3552; https://doi.org/10.3390/app13063552
Submission received: 4 February 2023 / Revised: 6 March 2023 / Accepted: 7 March 2023 / Published: 10 March 2023

Abstract

:
The perceived vibro-acoustic comfort, inside the passenger compartment, under driving conditions, is strictly related to the car body torsional behavior. The aim of this work was to identify which parts of a car body most influence the first torsional mode, in order to modify them and acquire an increase in such car body natural frequency. It was also intended to exploit the great potential of 3D printing that allows an increase in the complexity of component shapes, with an acceptable compromise with respect to production costs. A design and material (from steel to aluminum) change of a car body rear part, which was identified as the structural part of the car body with the most relevant impact on the frequency of the first torsional mode, was assessed in terms of structural and vibro-acoustic performances. In particular, with the constraint of increasing the structural and vibro-acoustic performances and, at the same time, minimize the weight of the structure itself, geometric, structural (e.g., type of connections), and material changes of the car body rear part were assessed. Working on a car model dating back to 2008, which was already compliant with structural and vibro-acoustic regulatory norms, an increase of 2 Hz on the first torsional mode frequency of the Trimmed Body model was obtained. In parallel, a weight reduction in the optimized components was also gained. It was also requested to lower the cabin sound pressure levels, optimizing the vibro-acoustic transfer functions from the accelerations at engine mounts and suspension attachment points to the cabin inside. It was shown how the combined use of advanced topological and structural optimization tools, with the capabilities of an unconventional manufacturing technology, such as 3D printing in aluminum, could guarantee an increase in the vibro-acoustics and structural car performances, also gaining a weight reduction.

1. Introduction

The development of additive technology is attracting more and more interest from companies considering the wide variety of materials that can be used. The rising cost of steel is leading companies to turn to different materials, processed by technologies, such as 3D printing, far removed from traditional ones. These technologies offer the possibility of cost-efficient production of artefacts with complex geometries and are, nowadays, widely spread in the automotive sector [1].
The automotive industry faces new challenges every day, new design trends and technological deployments from research push companies to develop new models in the short term, requiring new tools or tool reshaping. The automotive industry is one of the most competitive business areas where time-to-market decrease plays an important role. Additive manufacturing is the solution that enables the flexible production of customized products without significant impact on costs and lead time. Automotive companies develop new models, pushed by new design trends and technological evolution, where aesthetics, aerodynamics, safety, and weight reduction in the vehicle are key issues [2].
The vibro-acoustic analysis of structural components, used in aircraft, spacecraft, and land vehicles, plays a vital role in the design of these systems with regard to human health and living comfort.
The perceived vibro-acoustic comfort inside the passenger compartment under driving conditions is strictly related to the car body torsional behavior. In this work, the focus of the implemented optimization was on the first torsional mode frequency because the first modes, torsional and flexural, can be considered the most important in relation to comfort. As a matter of fact, a similar target was pursued in [3], where the first flexural frequency of a train chassis was increased to achieve vibro-acoustic benefits.
In [4], vibro-acoustic improvements were obtained for a car roof, made with an innovative composite material: a structural optimization allowed to recover for the new configuration the original static and dynamic stiffness properties, decreasing the weight and the noise inside the cabin.
The same approach adopted for this work was implemented in [5], but with reference to crashworthiness rather than vibro-acoustics; in particular, the objective was to apply additive manufacturing to obtain a plastic automotive component with reduced weight and costs, preserving, at the same time, its crash performance.
Deterministic methods, e.g., based on multibody simulation [6], combined FEM (Finite Element Method)-BEM (Boundary Element Method) [7], hybrid BEM/empirical approaches [8], and fast multipole method (FMM) [9], are widely adopted to tackle vibration and acoustic assessments of complex structures.
For this work, FEM was adopted for solving both the vibrational and acoustic problems. A multi-objective optimization was proposed to improve the vibro-acoustic performance of the considered car model. The related constraints came from the need to reduce the weight, by focusing on the car rear part, without compromising its crash performance. In order to reduce the crash and durability testing times, a possible choice might be to perform the topology optimization (aimed at car weight reduction) just on those parts that do not affect the impact resistance [10]. On the contrary, in this work, the optimization was carried out considering some components that can heavily affect the impact performance. Therefore, a countercheck of the new design against crash performance was necessary, but this part was not implemented in this work.
For the acoustic modeling, it was important to identify the entry points of the vibrational forces (suspension attachment points and engine mounts) responsible for generating structural noise inside the passenger compartment. There are several works in the literature aiming at car body lightening, under the constraint of preserving original structural or acoustic performance. In [11], the car body was optimized considering NVH (Noise Vibration Harshness) and crash performances. In [12], an acoustic analysis of lightweight auto-body, based on FEM and BEM, was performed, similarly to what is performed in this work. In particular, the whole car body was analyzed, highlighting the critical contributing parts to the noise emission by a panel sensitivity analysis, whereas, in this work, the focus was on a single panel/component (rear part), with a change of base material, from steel to aluminum, and with related topological optimization.
Structural optimization was also carried out in [13]; the objective function of the problem consisted of maximizing the torsion stiffness of the car to increase its speed performance.
Previous work, such as from Wang et al. [14] and Jang et al. [15], involved optimization of the dynamic characteristics of an automobile body by maximizing the frequency of the first torsion and/or bending mode separately (the optimizer routine worked first on the torsion mode and after on the bending mode). The improvement in the natural frequency for torsion mode in [15] was obtained at the expense of an increased weight, where it required an additional 10% of the original mass to increase the frequency by 2 Hz. To overcome this drawback, the method proposed in this work employs structural topology optimization, changing, in parallel, the component material.
In [16], the design objectives attempted to improve the existing torsion and bending modes by using structural optimization, without compromising other factors such as mass and stiffness of the structure. The natural frequency of the design was modified by reinforcing the structure at the critical locations previously identified.
There are a number of cases where optimization was used to modify smaller parts of the vehicle such as rocker panels, mounting brackets, pillars, seat frames, suspension rings, and steering knuckles. Large parts such as engine blocks, chassis, and whole car bodies have also been used as the basis for optimization. In [17], the effectiveness of car body optimization was shown, considering a replacement of the baseline material and improvement of structure design.
In this work, we show how a combined use of advanced topological and structural optimization tools, together with the capabilities of an unconventional manufacturing technology, such as 3D printing in aluminum, can guarantee an increase in the vibro-acoustics and structural car performances, together with a weight decrease.
The method proposed is of general validity, thus it can be applied to any car (especially for sport and premium cars) and to any component/subassembly of complex geometry, to be added in critical areas for stiffening purposes.
For the first time, such a kind of optimization was applied to such a large component of a car (rear part), coupling the synergetic possibilities offered by the 3D printing with the outcomes of an optimization software.

2. Numerical Modal Analysis

The car model was analyzed considering a static and a dynamic analysis of the body-in-white (BIW) and of the trimmed body (TB) configurations. This step was fundamental, since the aim of the work was to raise the static and dynamic performance of the car, in parallel with a change of adopted materials (from steel to aluminum) and related manufacturing process (from sheet metal stamping to 3D printing).

2.1. FEM Model

The model was the latest restyling of a segment B car and comes in two different configurations: BIW (Figure 1) and TB (Figure 2).
The software used for modeling was Hypermesh [18].
Figure 1. Body in white configuration.
Applsci 13 03552 g001
Figure 2. Trimmed Body configuration.
Applsci 13 03552 g002
The BIW configuration consists of the paved body, the fixed parts (including the riveted and welded parts), and the rigidly connected parts (by structural glue). The TB model instead simulates the body with all the trims under running condition.
The mesh for the FEM model is quite complex.
In the following a description of the most used elements is reported [18]:
  • CTRIA3—defines a triangular plate element of the structural model. This element uses a 6 dofs (degree-of-freedoms) per node formulation;
  • CQUAD4—defines a quadrilateral plate element of the structural model. This element uses a 6 dofs per node formulation;
  • RIGID—defines 1D elements with 2 nodes used to model rigid connections;
  • WELD—defines elements with 2 nodes used to model welded connections;
  • CONCENTRATED MASS—defines 0D elements with a single node that allows the assignment of concentrated mass to the model in order to represent a physical part that may not be modeled with another FE idealization.
The used global model is an old one so with a rough FEM mesh, but the mesh in the areas of interest will be refined during the optimization phase as dictated by a convergence analysis.

2.1.1. Body in White Model

Since the objective was to increase the frequency of the first torsional mode, it was necessary to start identifying the corresponding value on the original BIW model. For this reason, a modal analysis, in a free–free condition in the range [0–60] Hz (sufficient to catch the first torsional mode), was simulated (Figure 3), using Hypermesh [18] software for the car modeling and Nastran [19] for the solution phase. The modal analysis was carried out with SOL 103 routine, whose detailed description is available in [19].

2.1.2. Trimmed Body

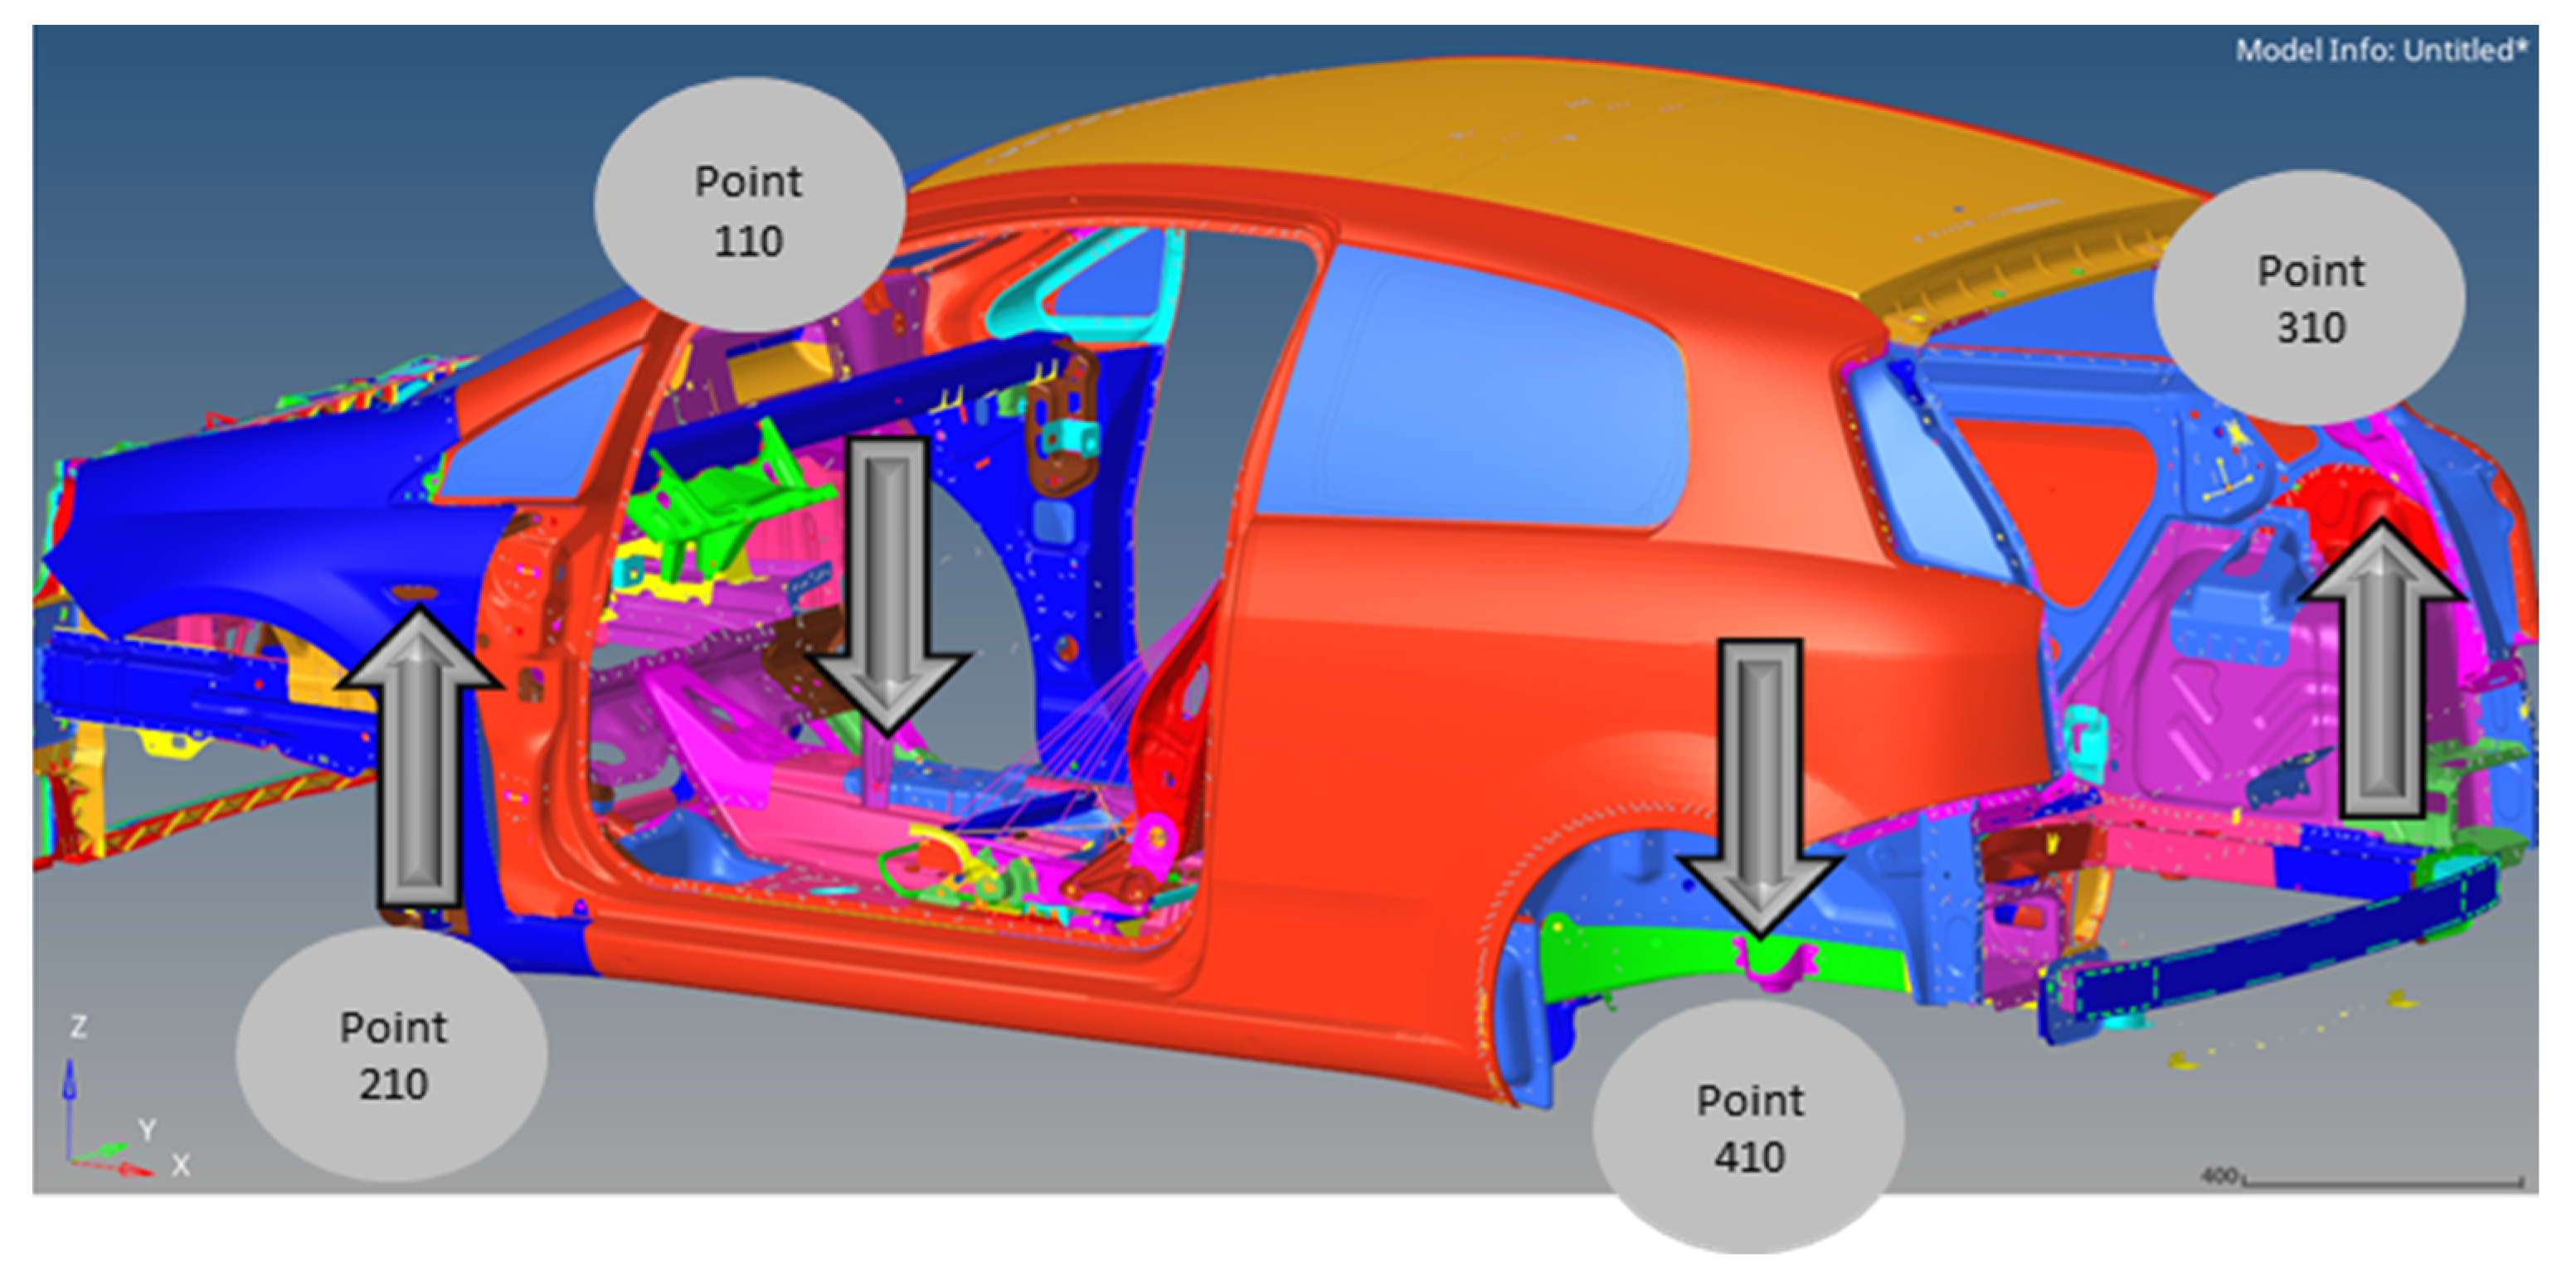
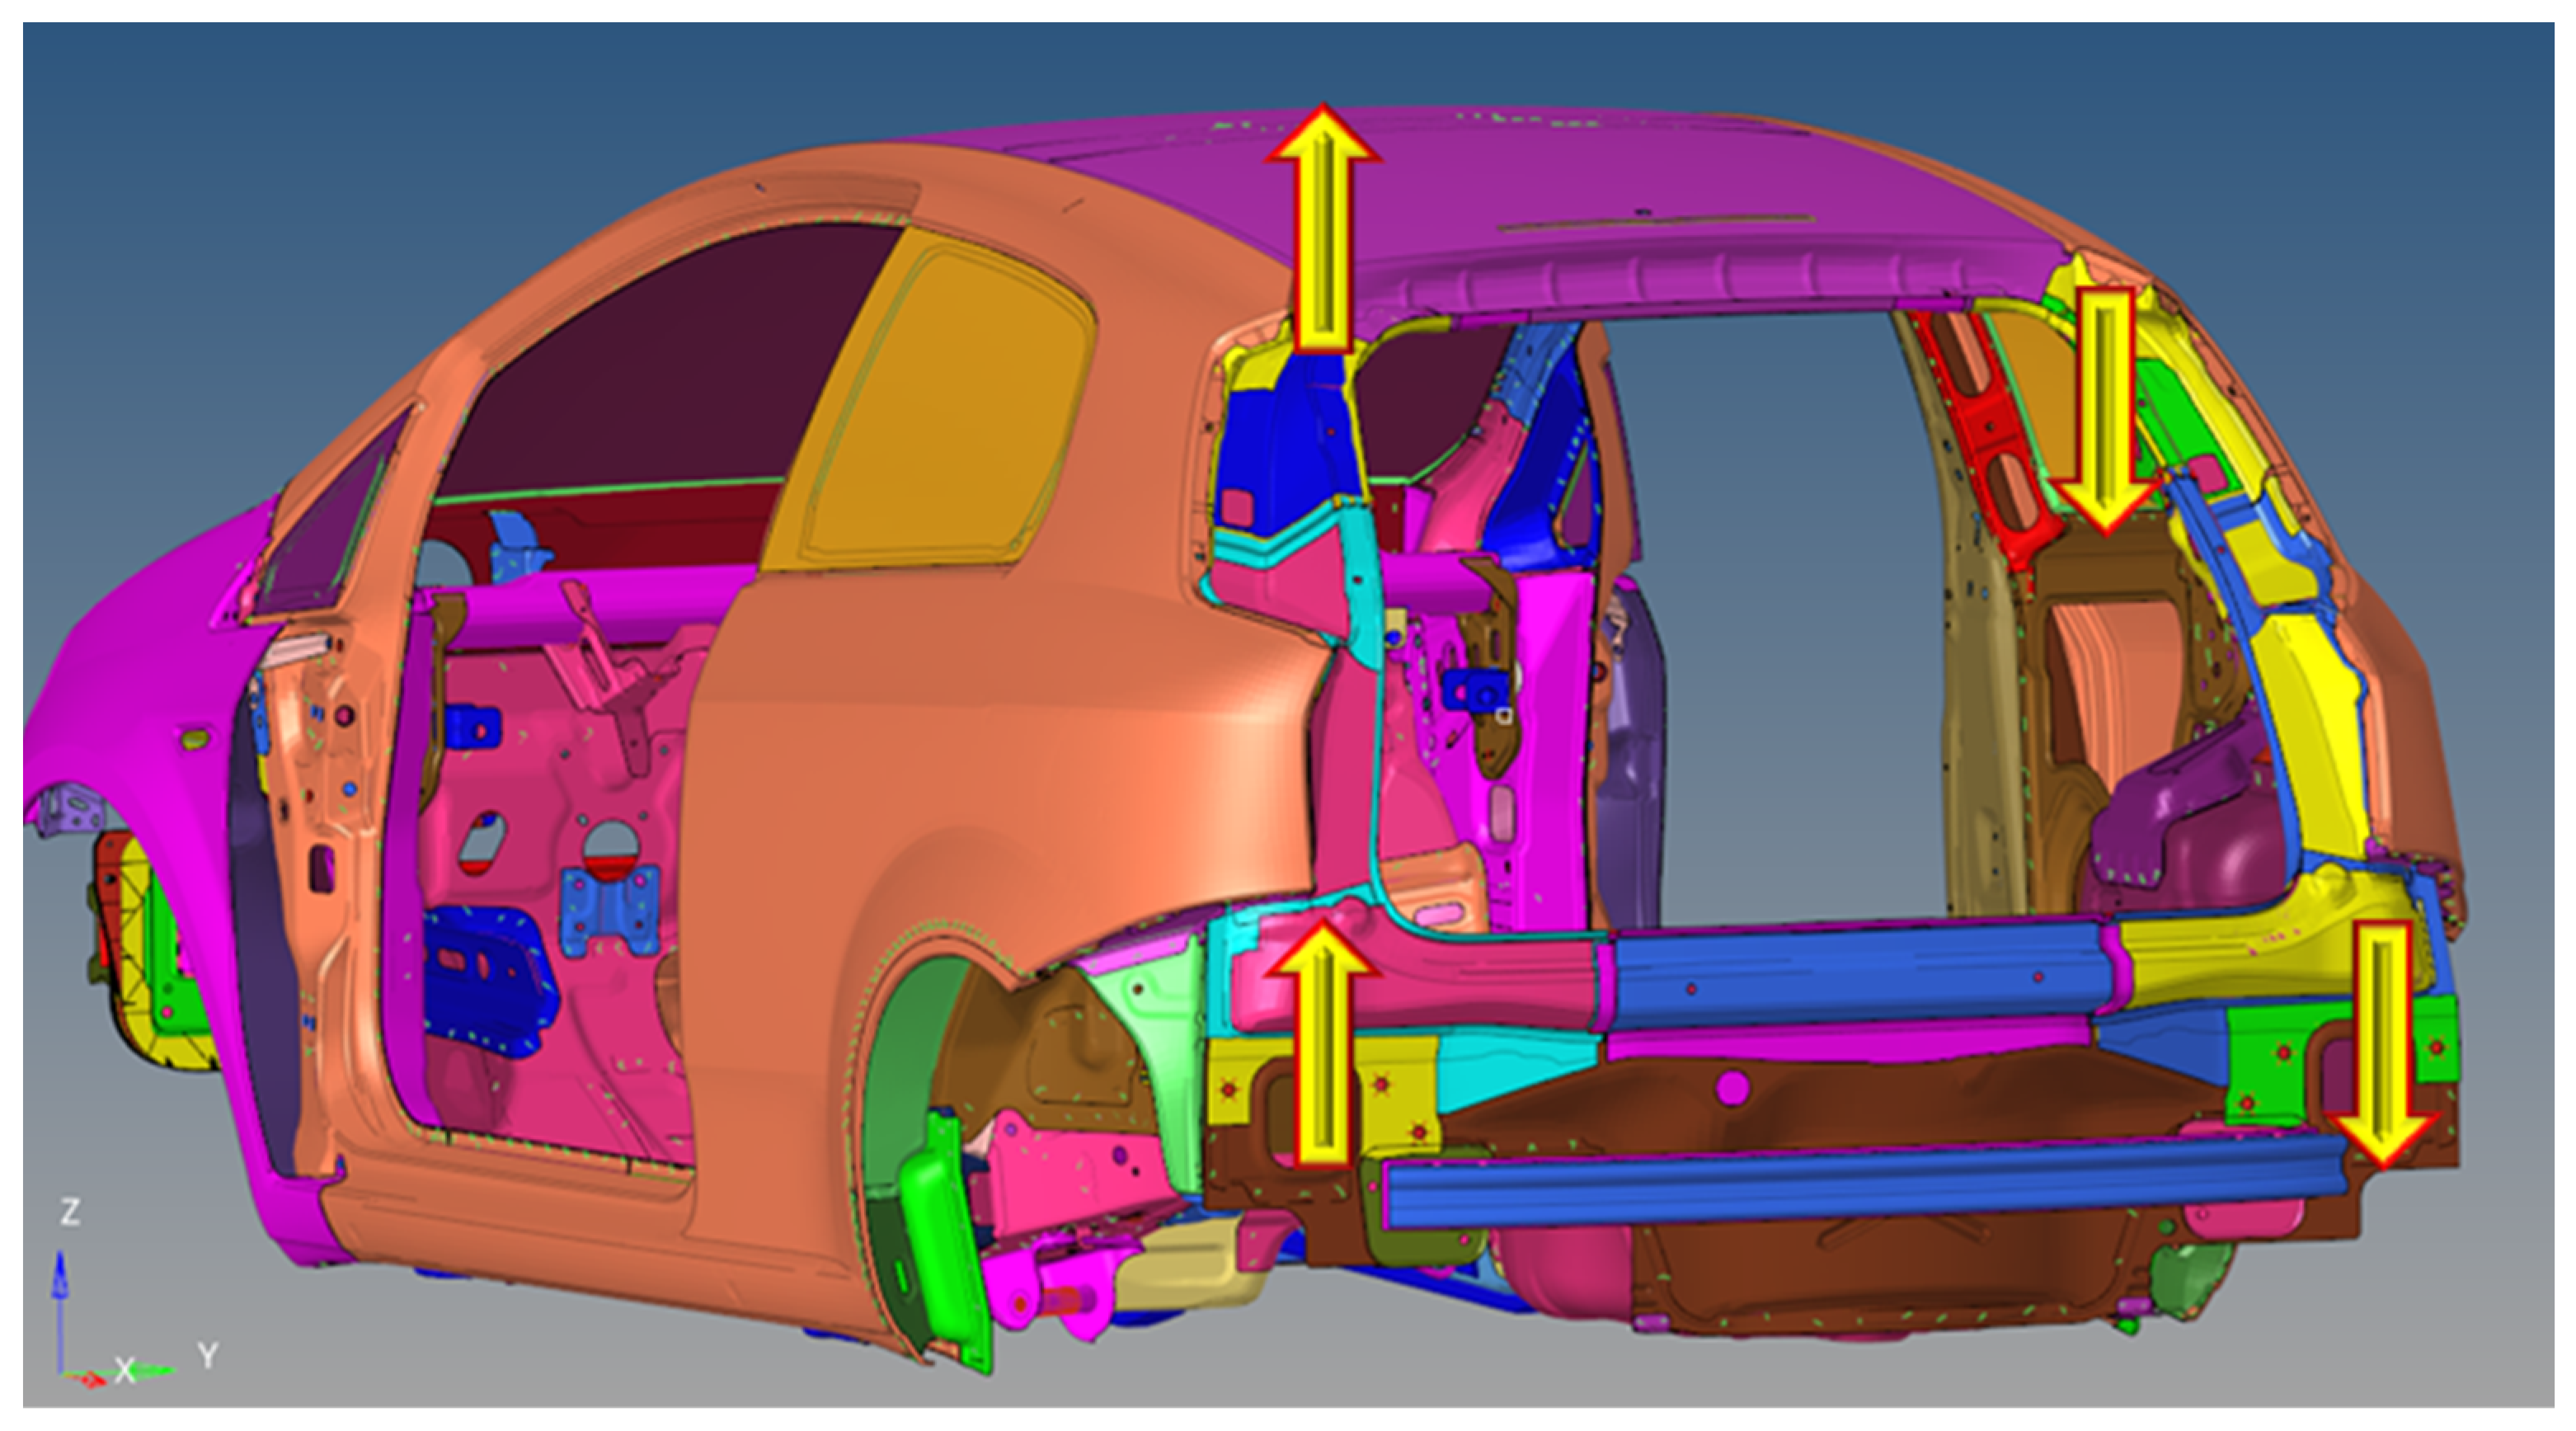
For the trimmed body model, the presence of the fittings makes more complicate the identification of the first torsional mode (the presence of local modes at close frequencies, e.g., involving the seats, may hide the global torsional one). For this reason, a forced frequency response analysis was performed in parallel with the modal analysis. This forced analysis was aimed at evaluating the accelerations on the suspension attachments corresponding to the application of a cyclic torsional moment. The latter was simulated by applying a configuration of forces on the four suspensions, as shown in Figure 4.
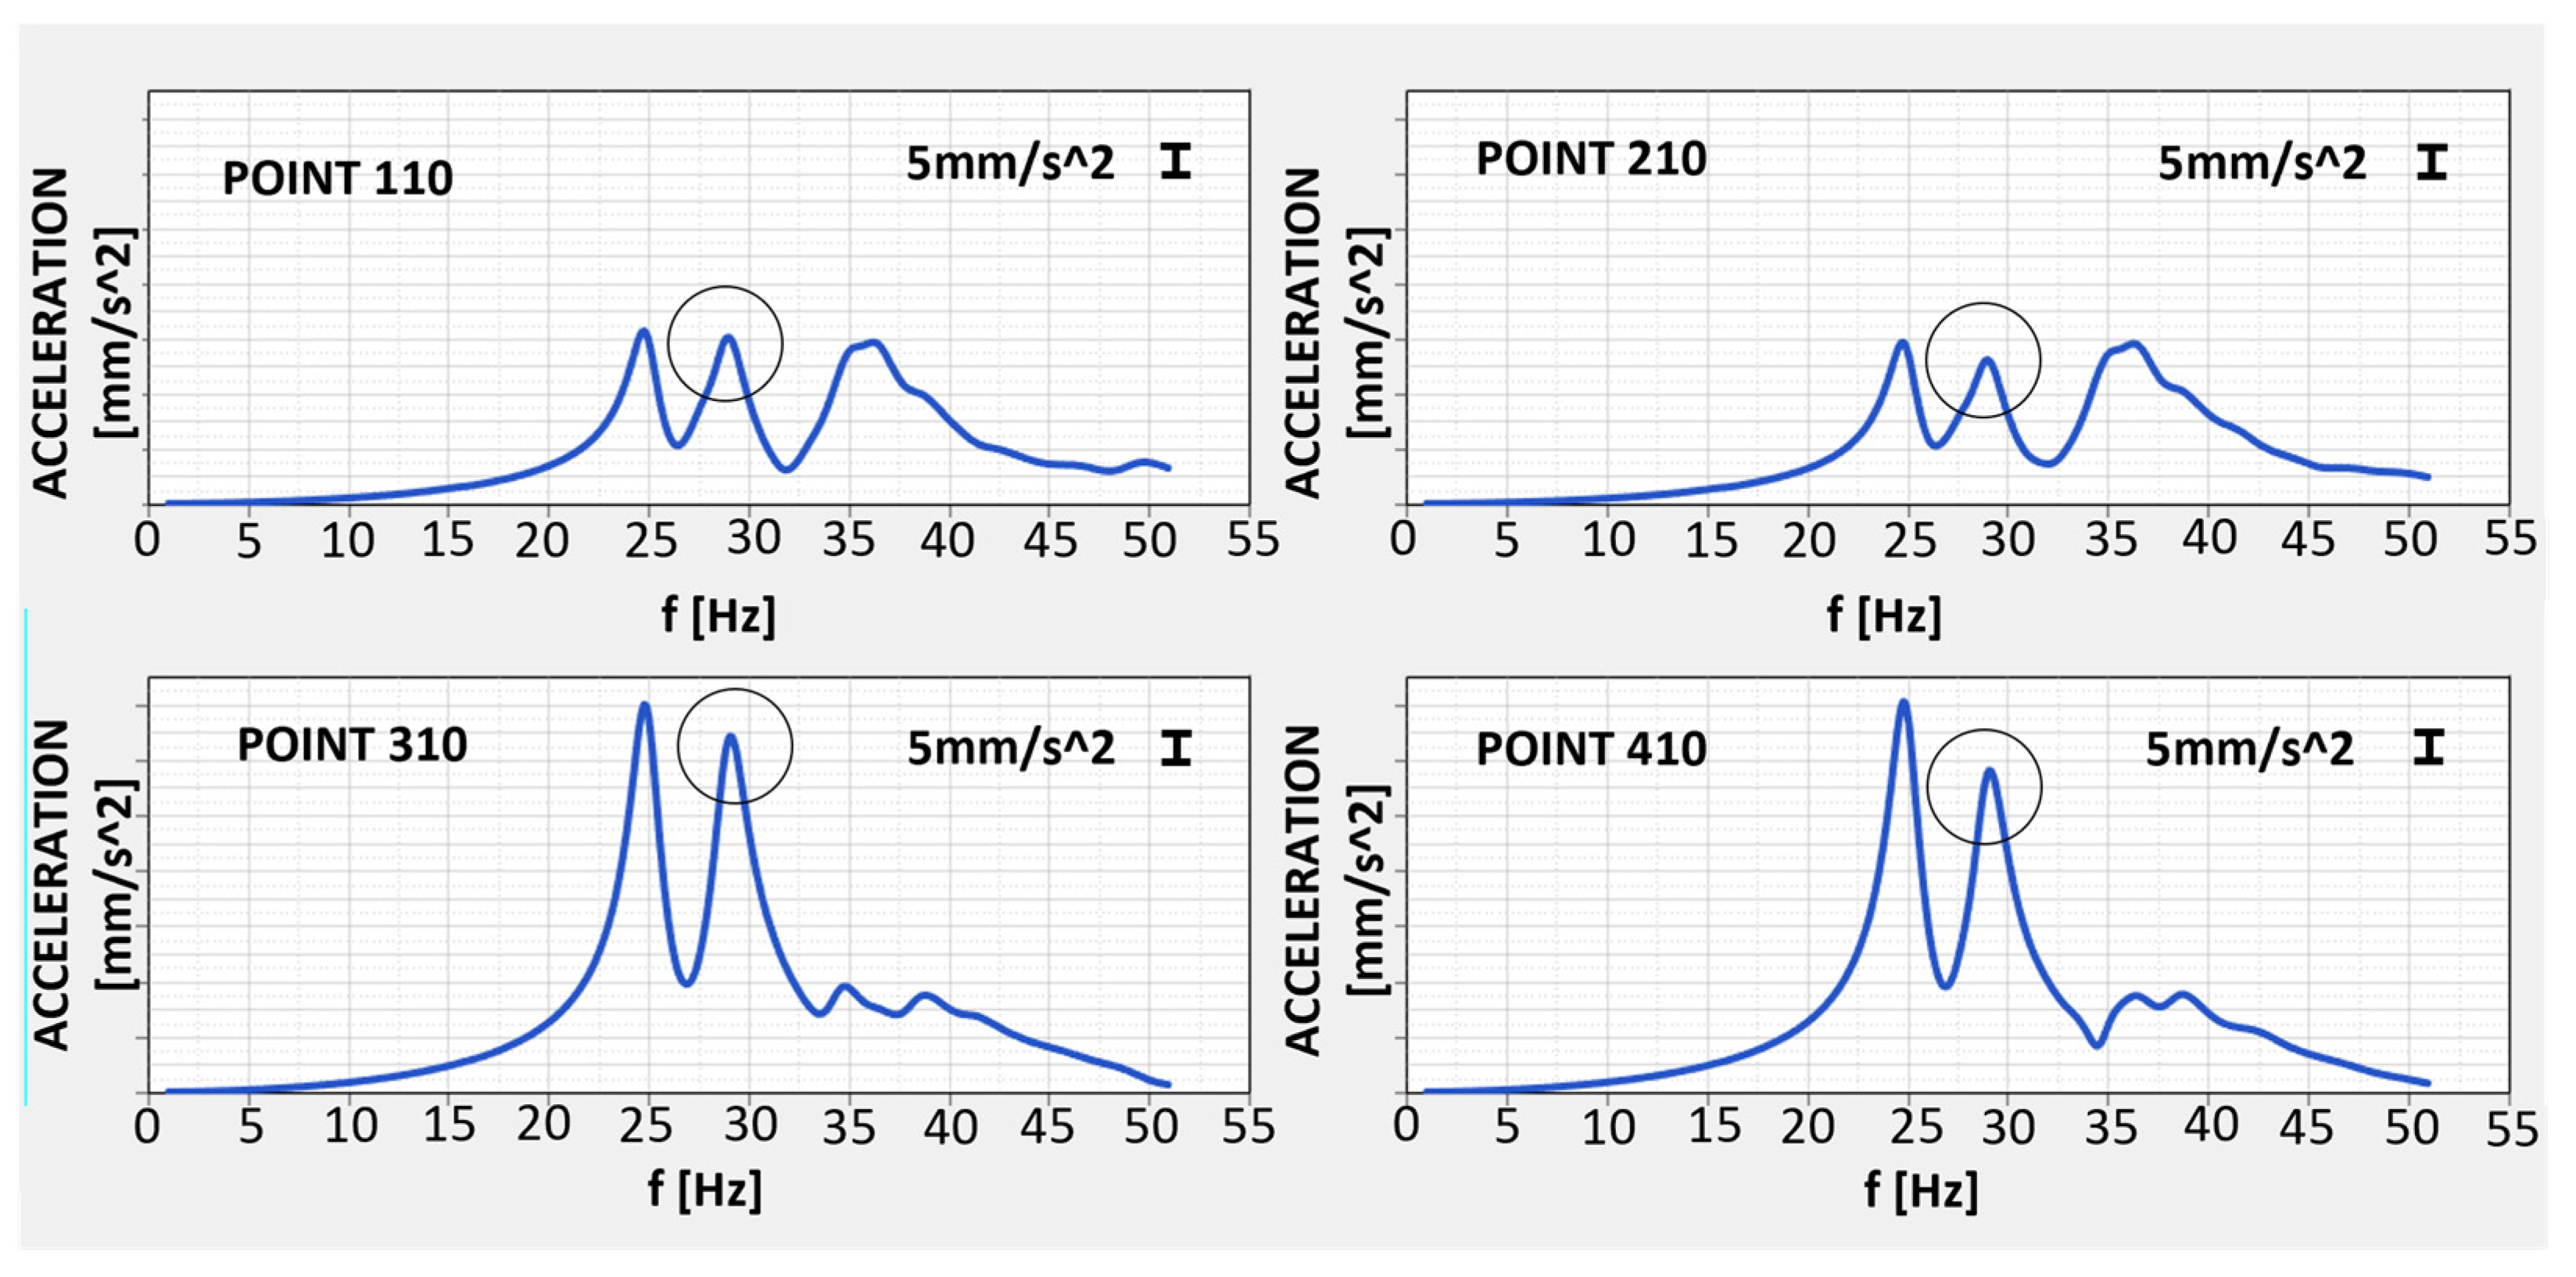
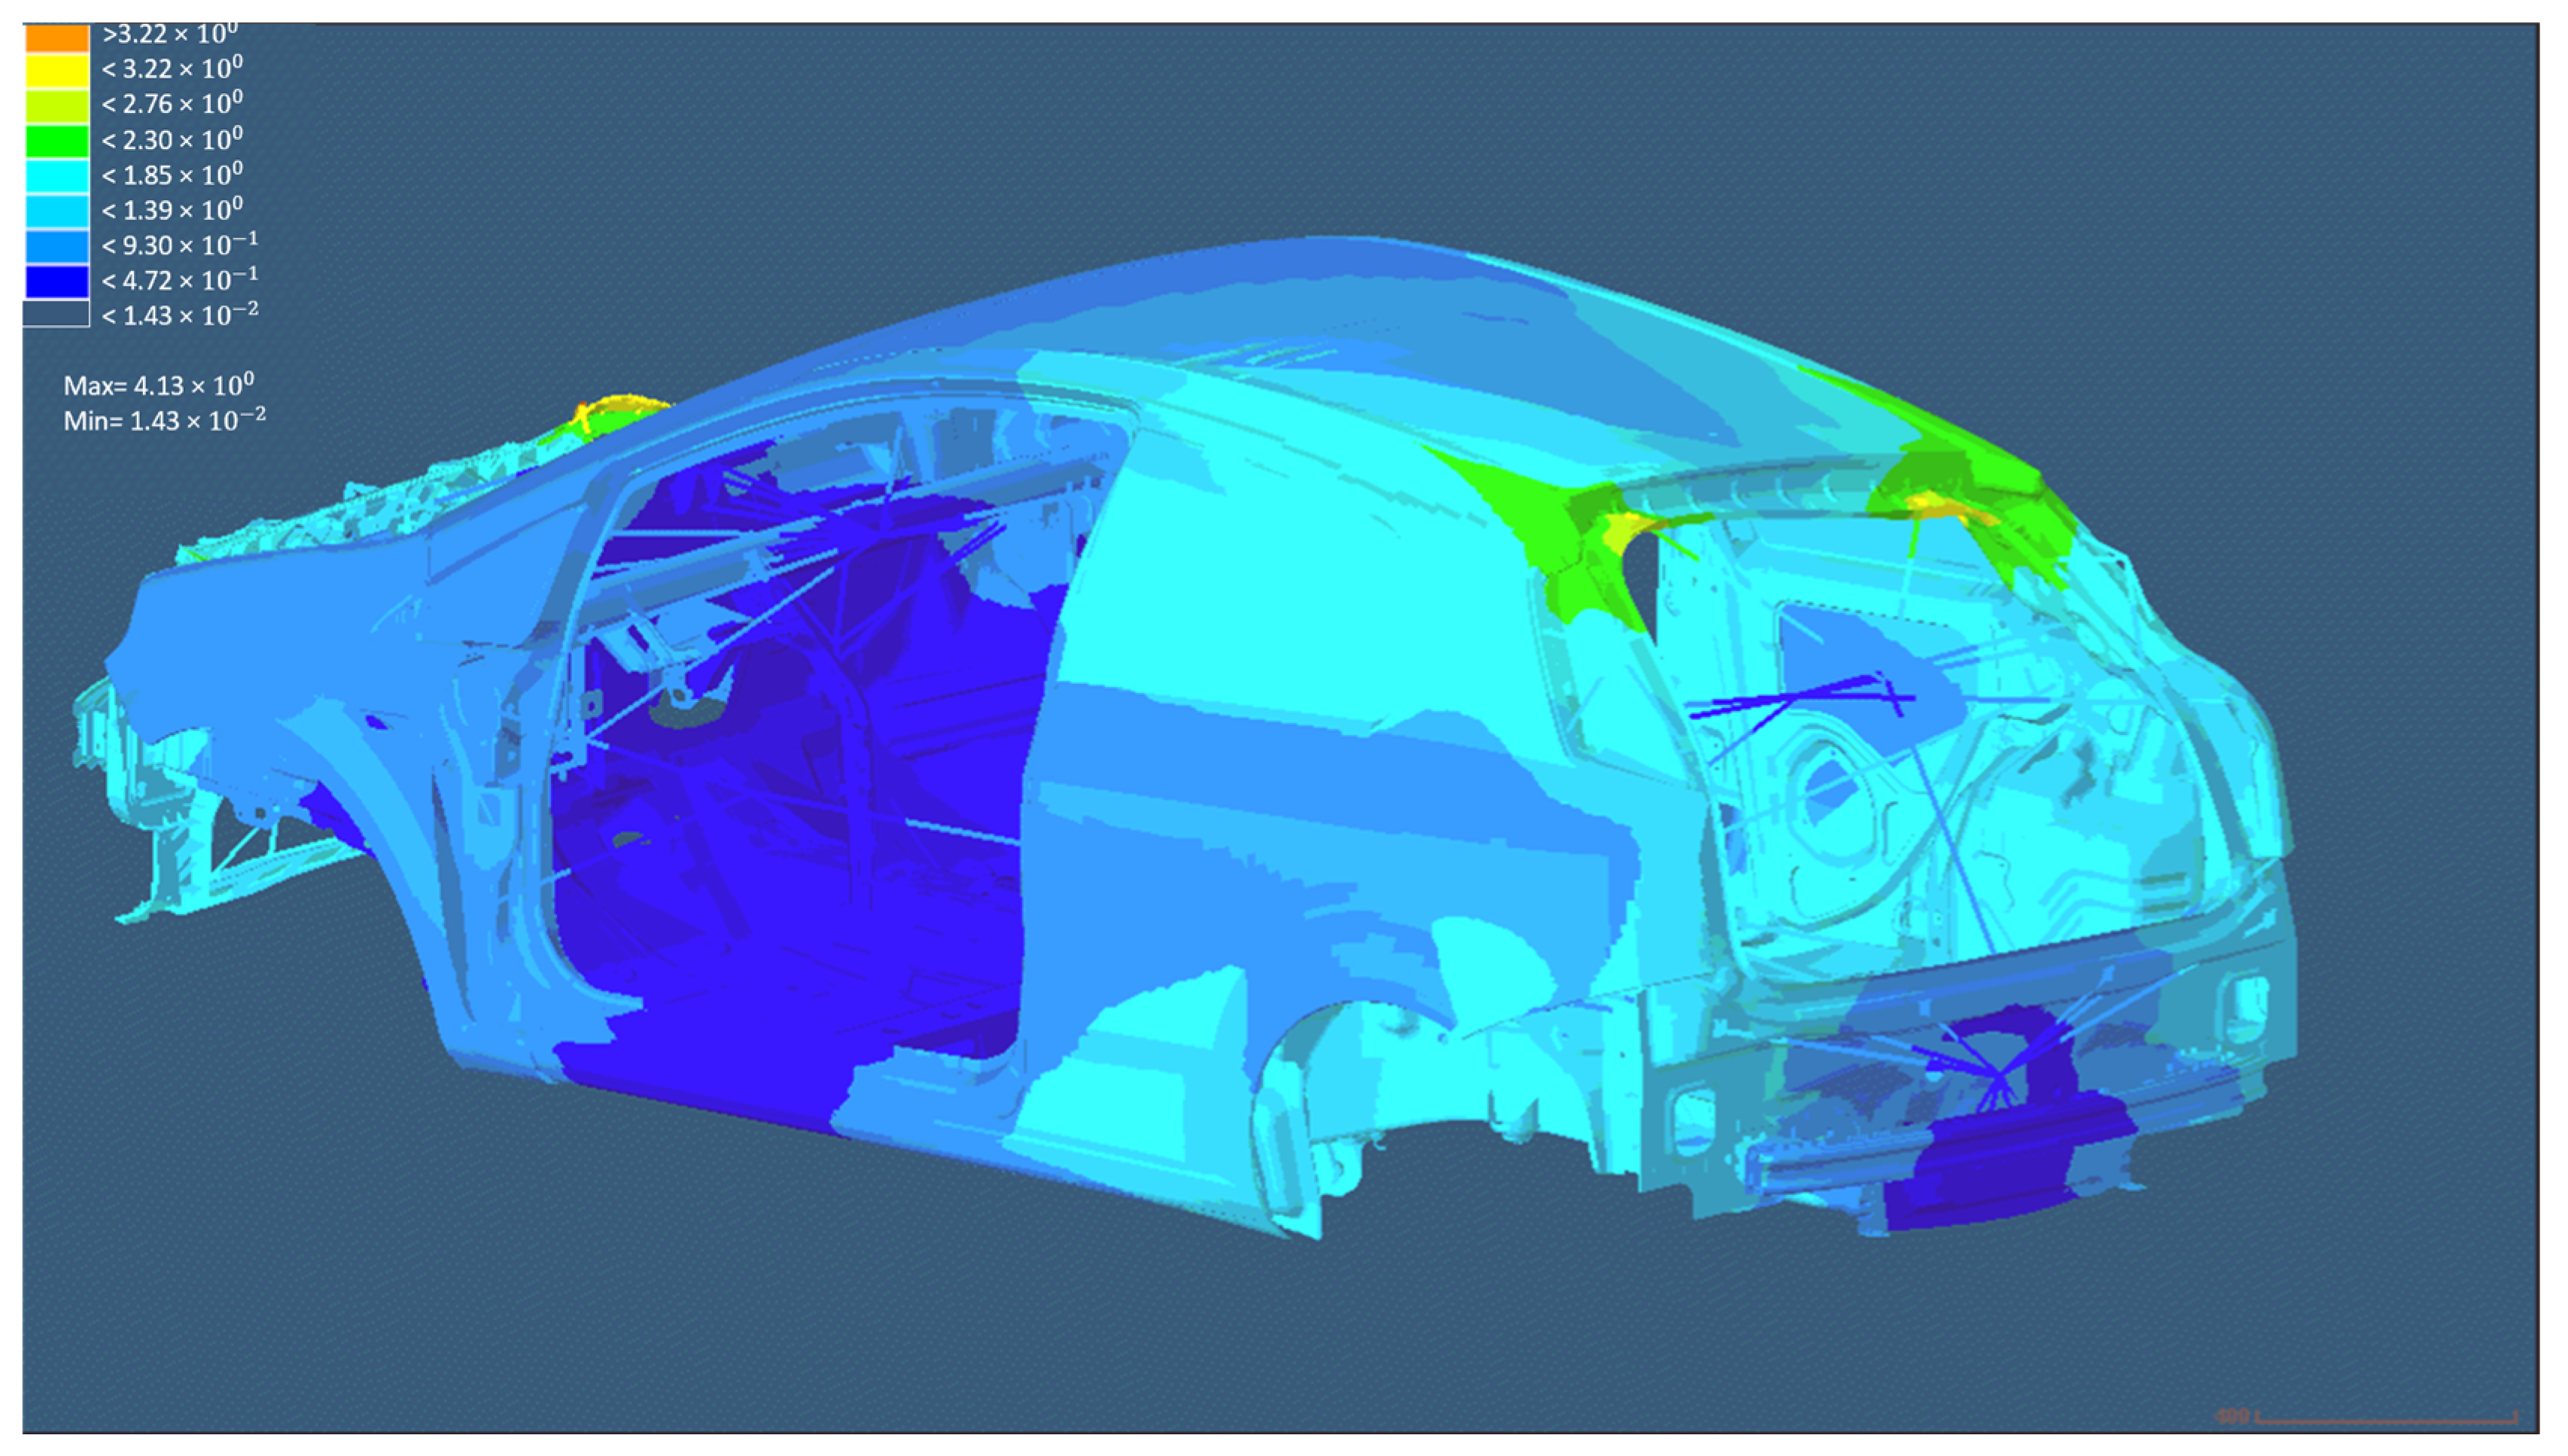
Analyzing the accelerations at the loaded points (Figure 5), and the modal shapes (Figure 6), the peak corresponding to the first global torsional mode became evident: the choice was on the second peak because the first one was related to a spurious torsional mode (by checking the animation of the modal shape, it is possible to point out that the maximum rotations at the posterior and at the anterior were not synchronized).
In conclusion, the modal analysis was used in conjunction with the forced response analysis in order to identify the frequency of the first torsional mode for the BIW and TB model.

3. Sensitivity Analysis

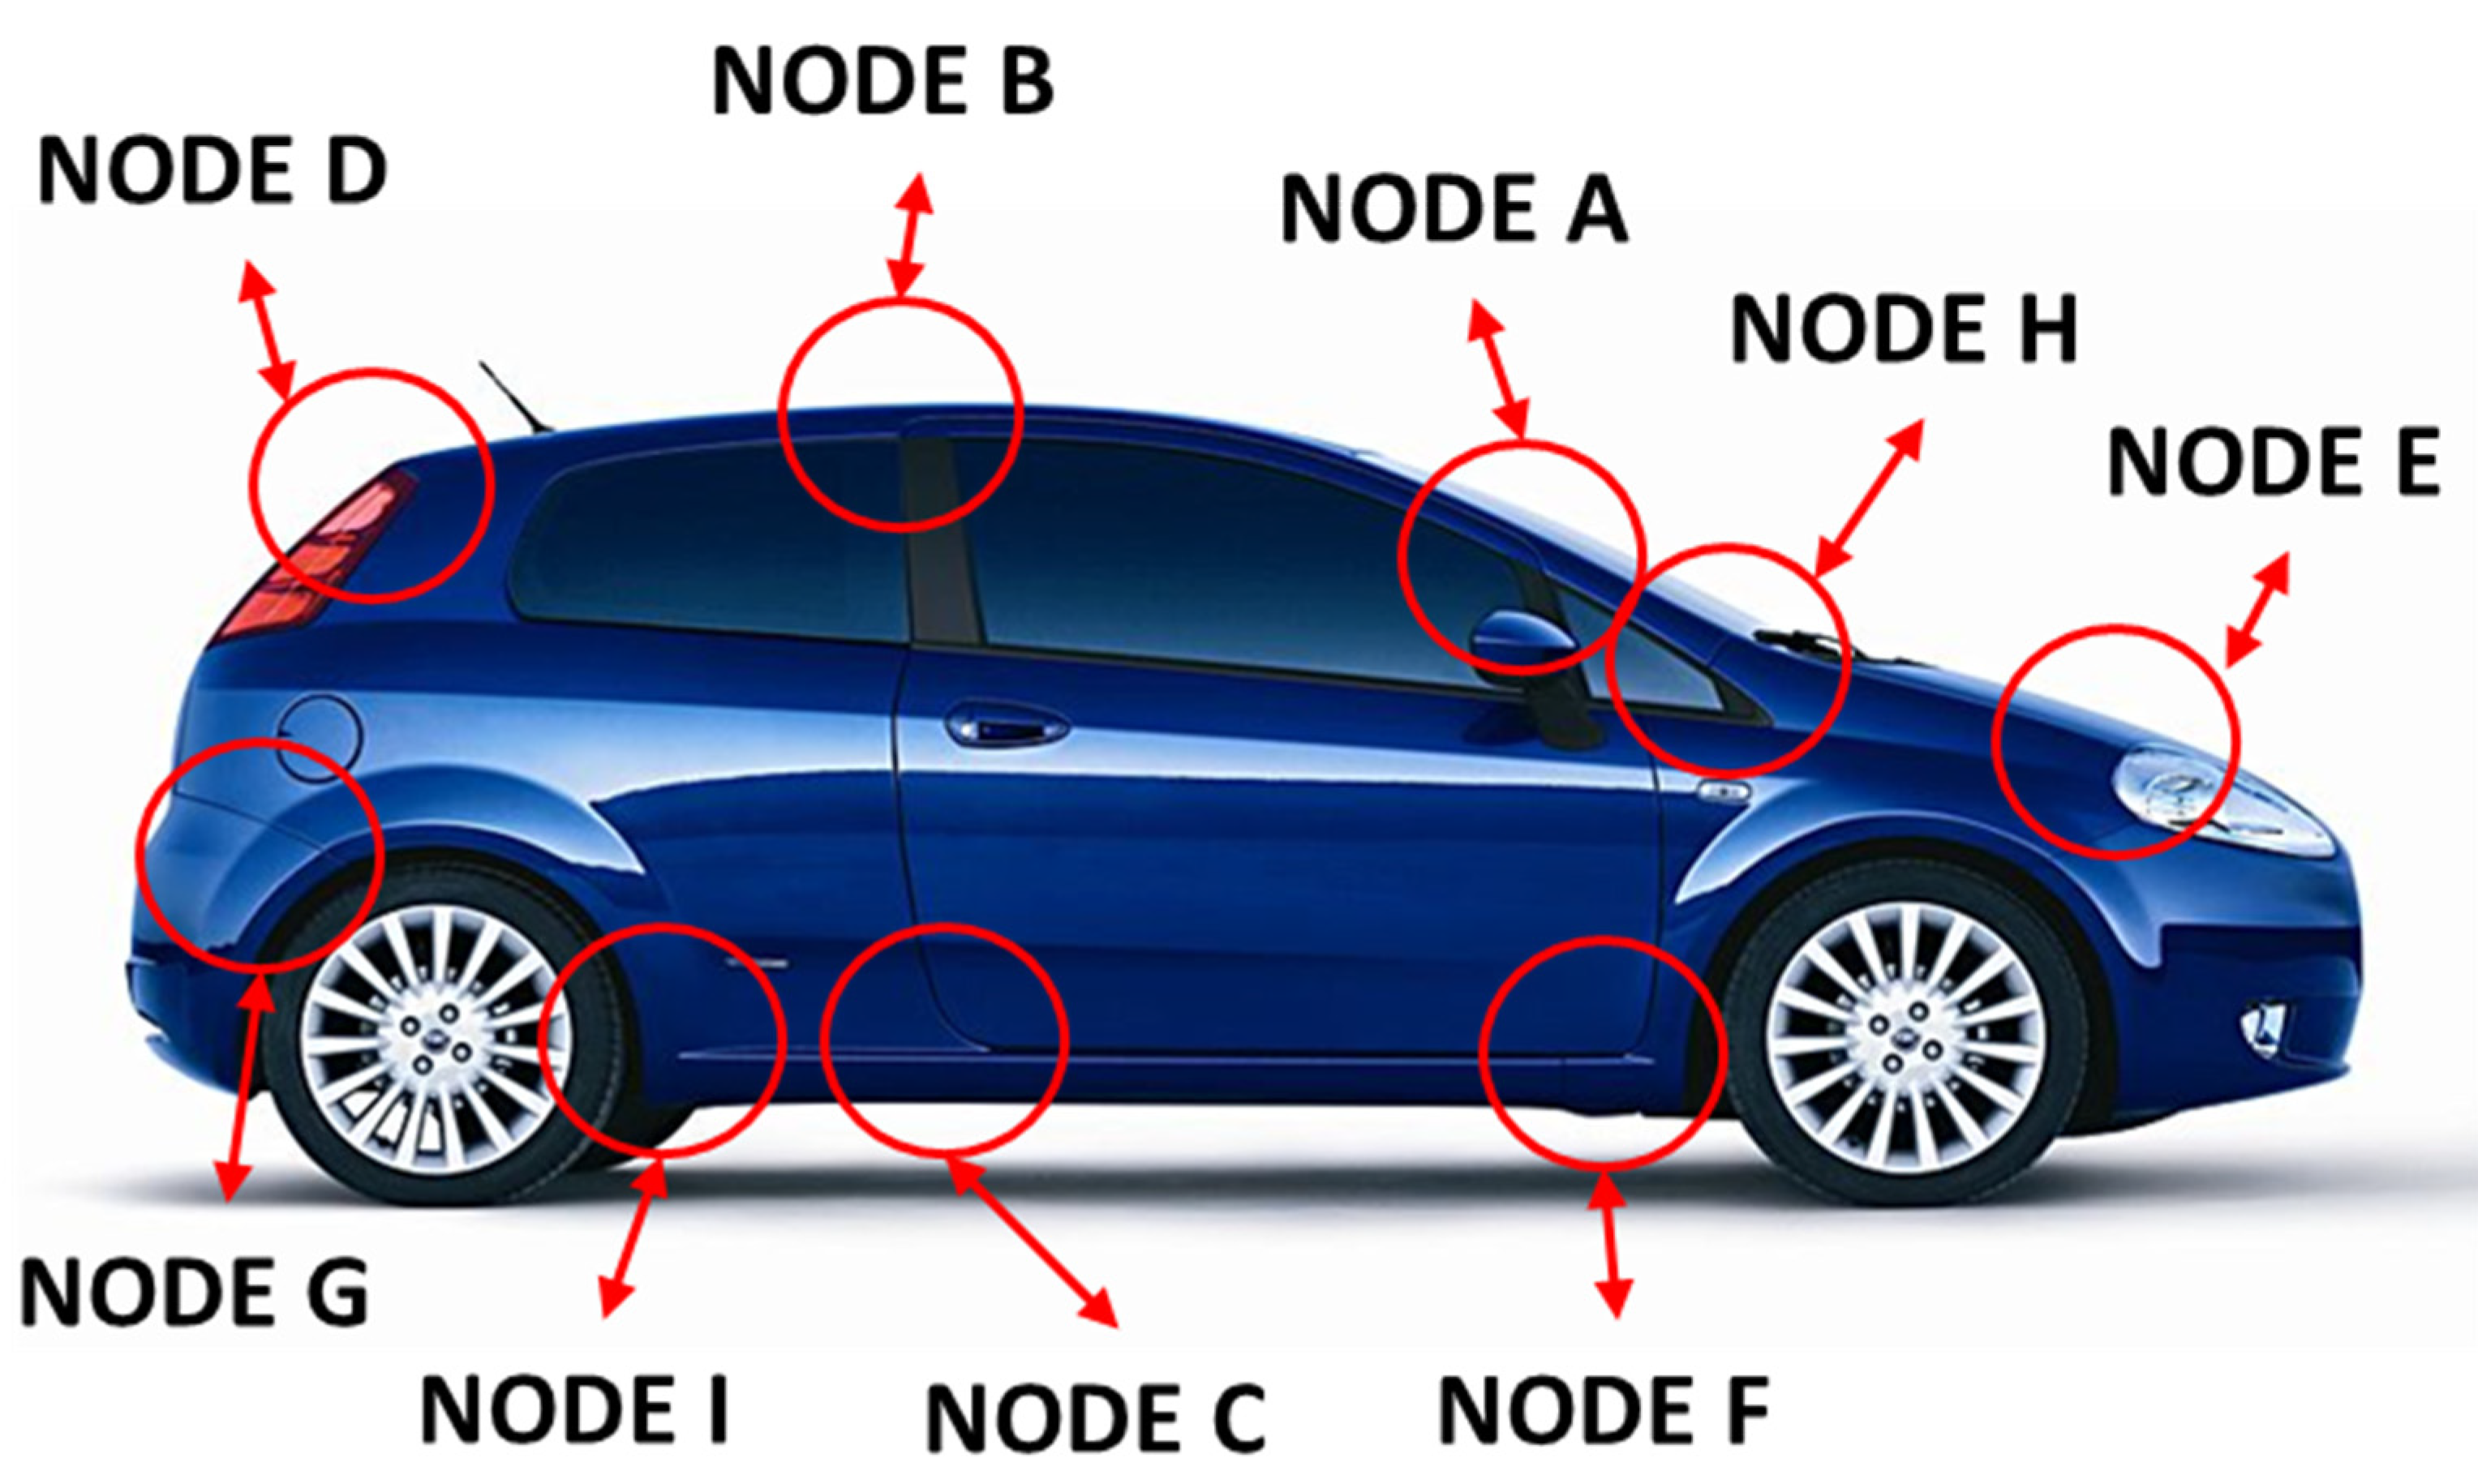
As previously said, the aim of the work was to increase the frequency of the first torsional mode, leveraging on the degrees of freedom offered by 3D printing during the topological optimization phase. To start, it was necessary to identify which parts of the car body most influence this mode, considering some particular areas of the car body that produce a relevant contribution to the car stiffness, called nodes (where several structural beams join each other) (Figure 7).
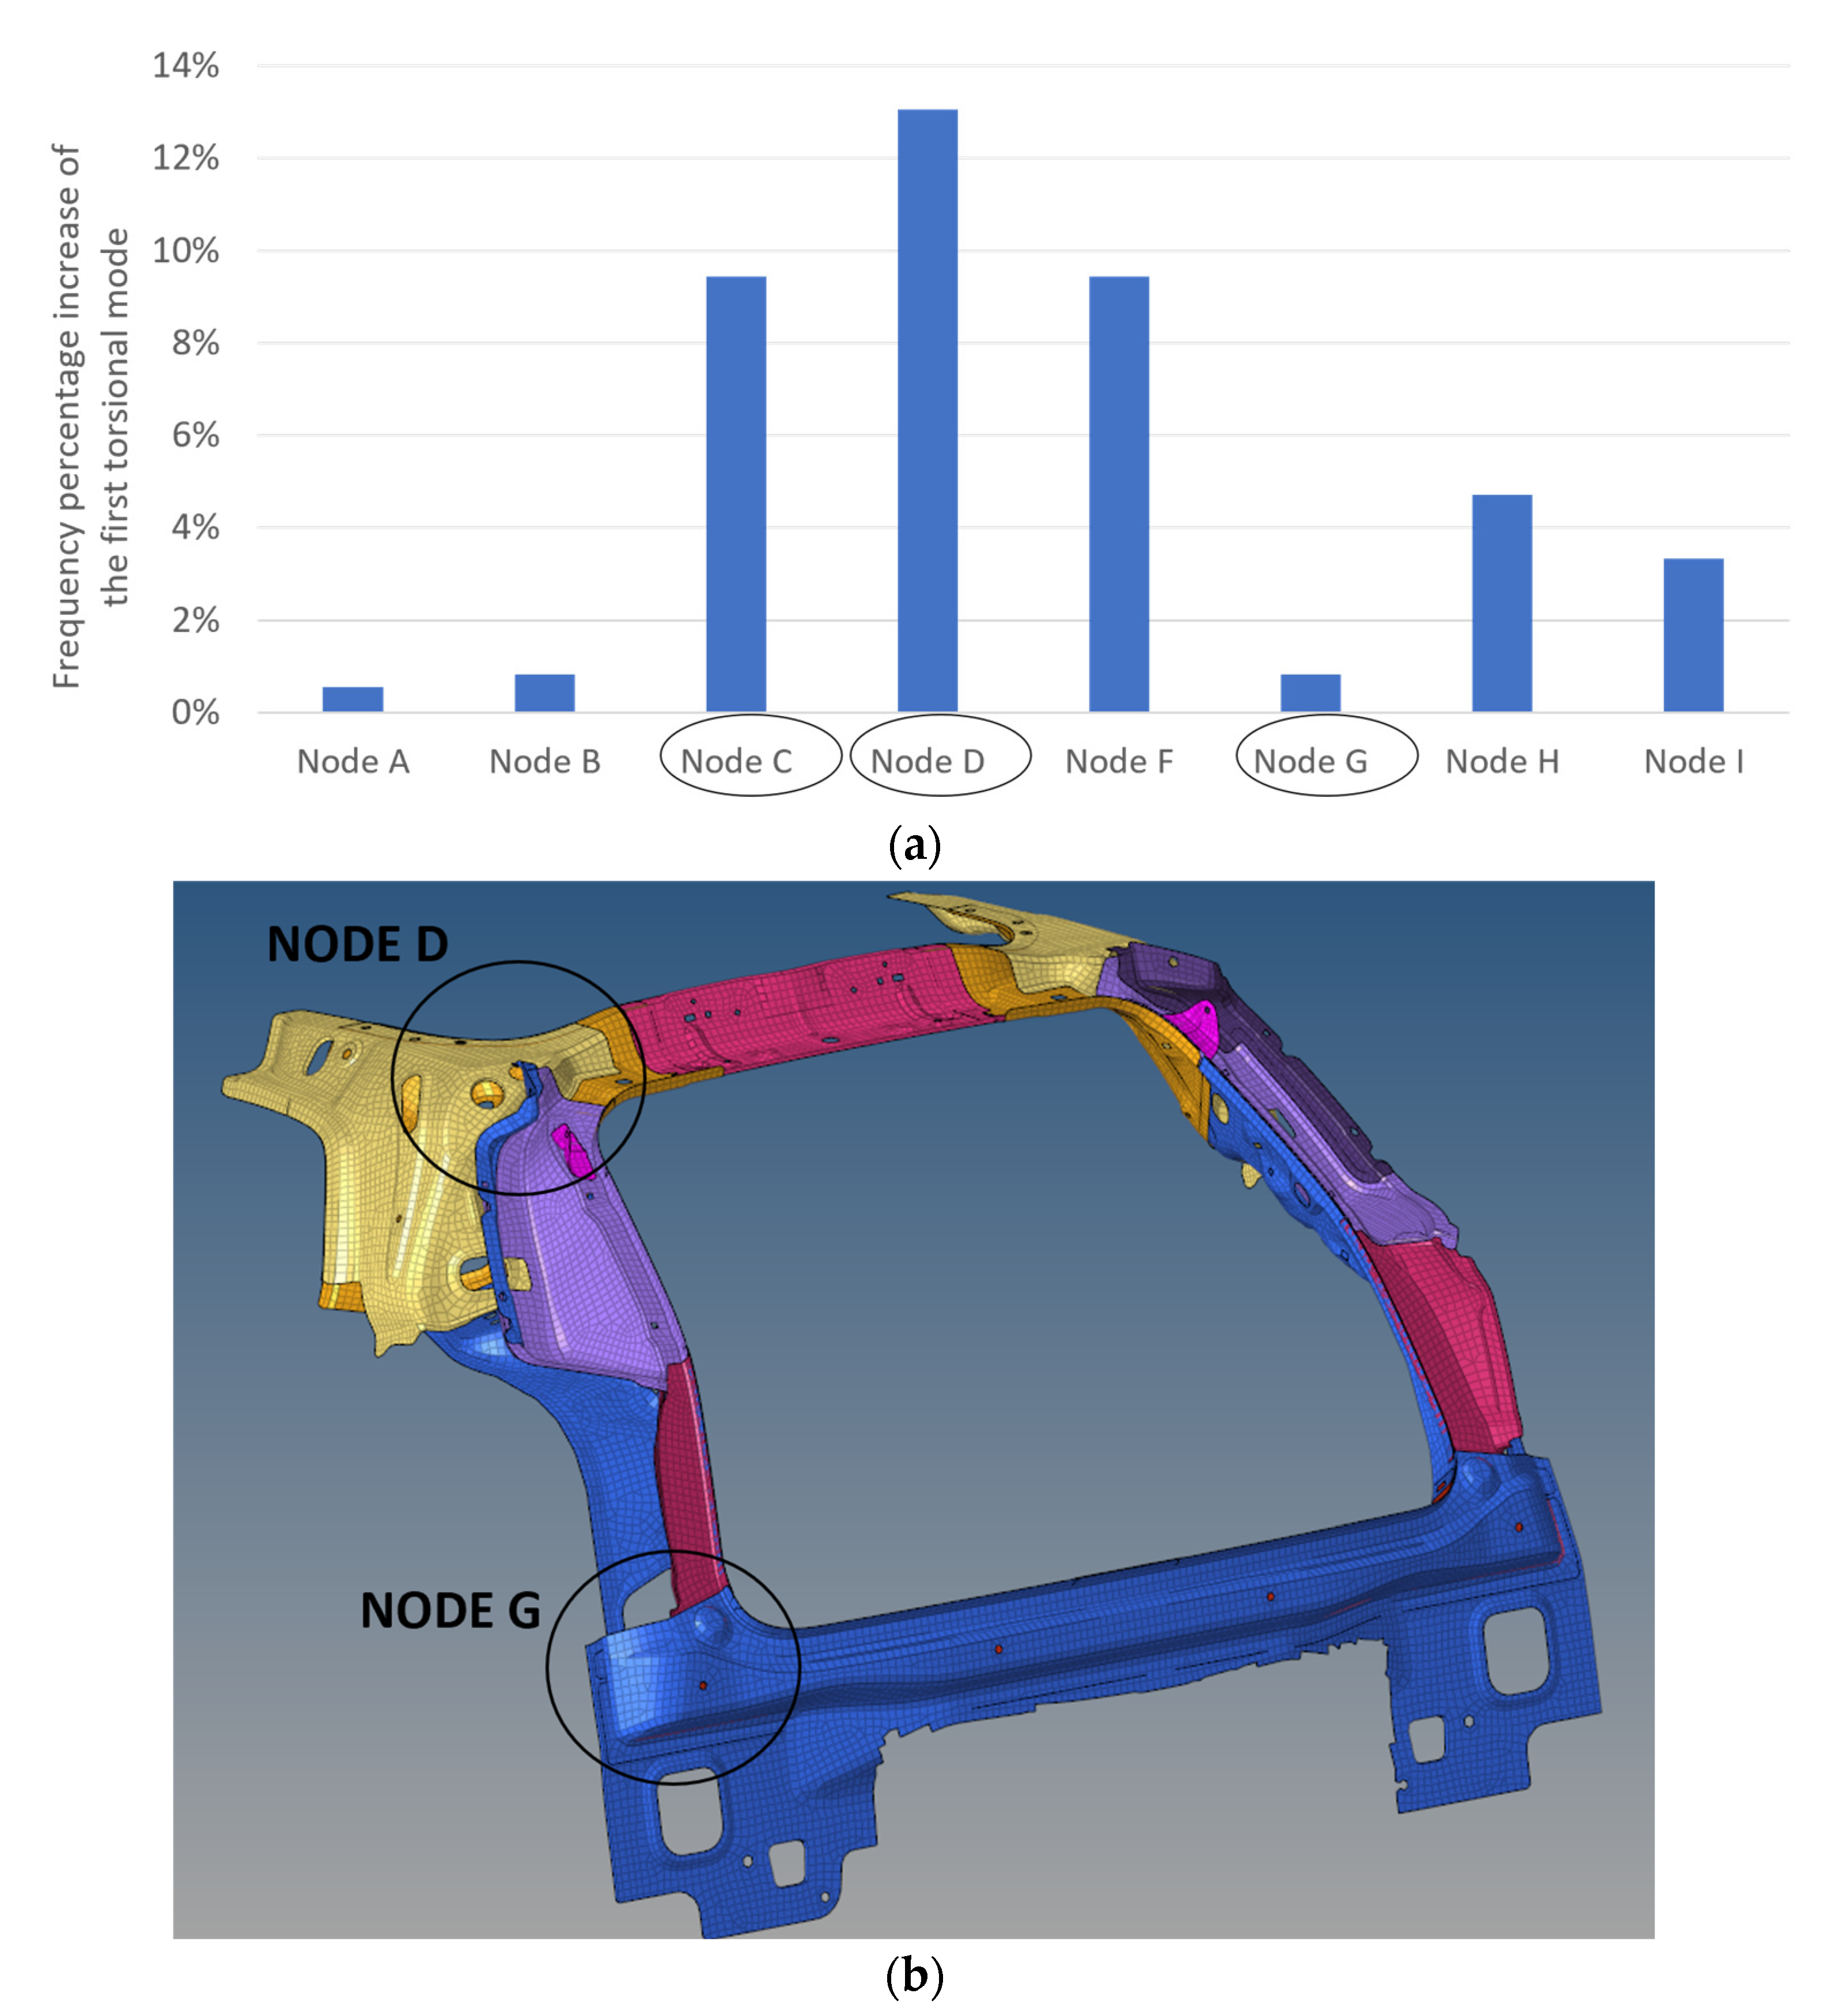
A sensitivity analysis can be performed to identify which nodes are more critical for the torsional response, in order to focus the design modification activity on those areas. The sensitivity analysis was implemented by selecting, one at a time, each node zone on the FE model and increasing for it the Young’s modulus by two orders of magnitude. By reiterating the procedure for each node and running each time a corresponding modal analysis, a ranking of the impact of the stiffness modified node on the considered response (first torsional frequency) was established. In Figure 8a, the percentage increment on the first torsional frequency of the modified model was shown, comparing the original FE model and the new models, obtained by increasing in turns the stiffness of indicated nodes. In this way it was possible to point out the car nodes whose stiffness have the highest impact on the first torsional mode.
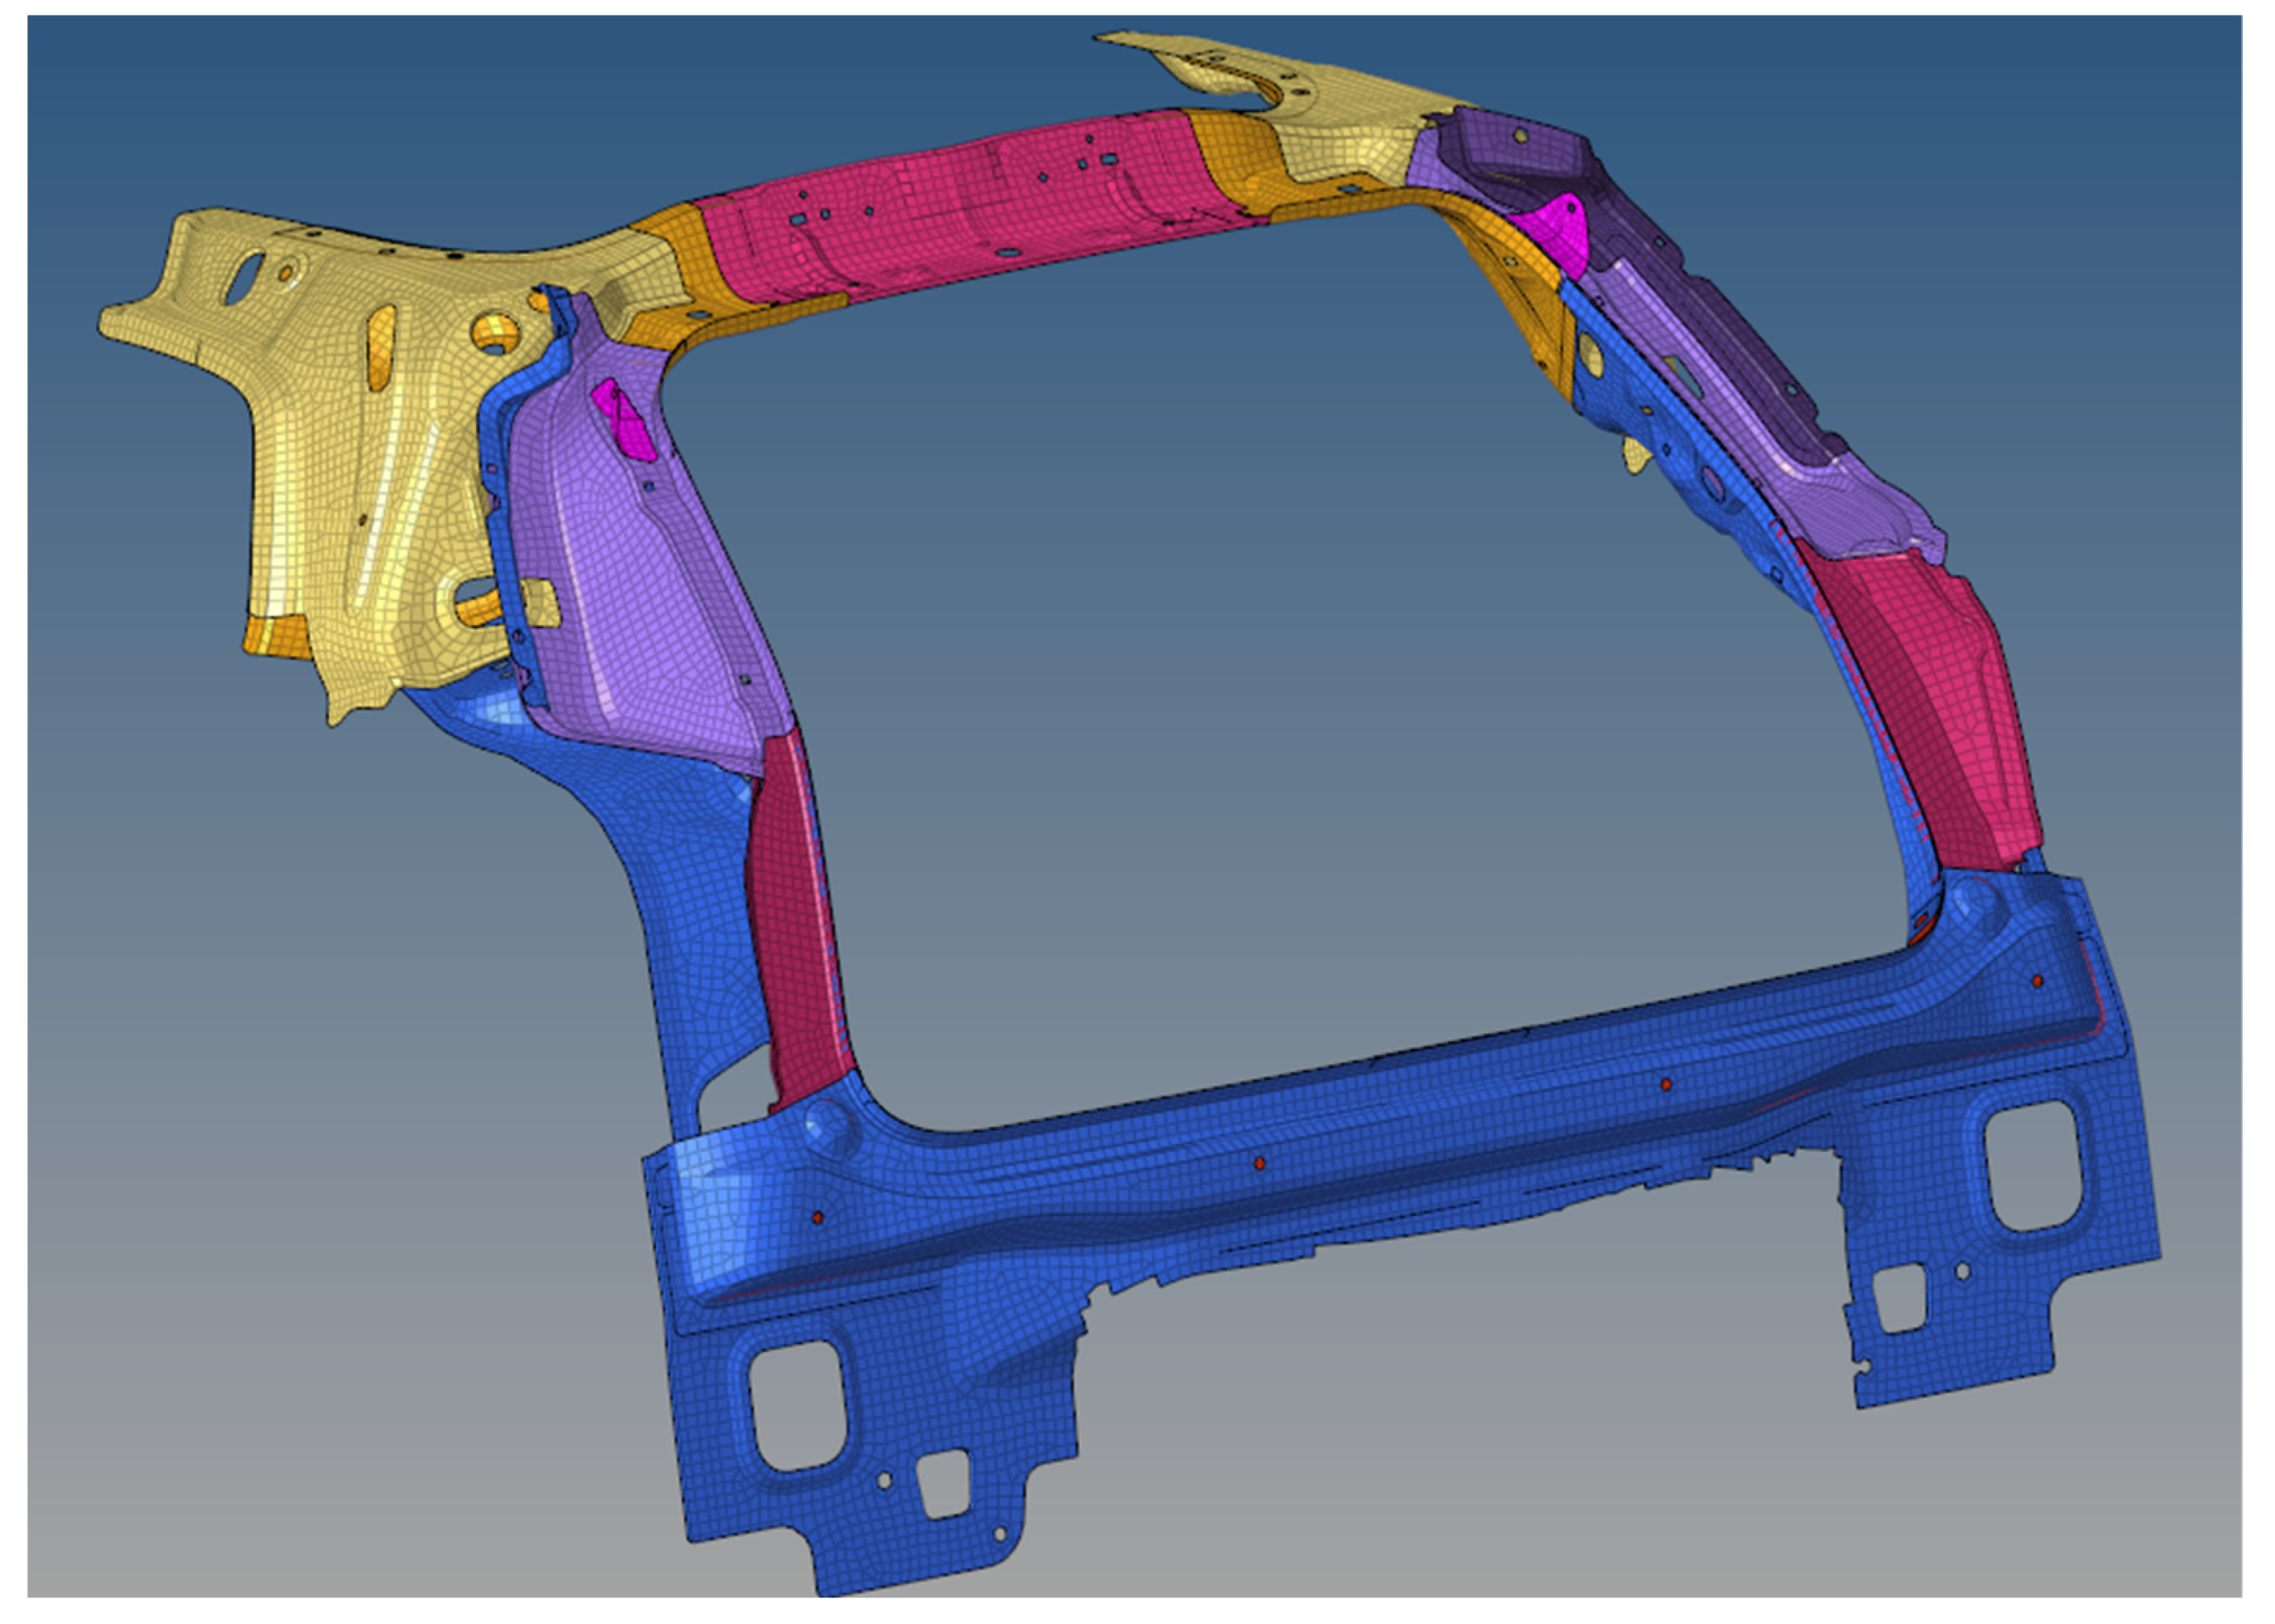
From Figure 8a, it was clear that the nodes C, D, and G determines the highest impact on the frequency of the first torsional mode so that the optimization had to involve the rear part of the car in order to increase such frequency (Figure 8b), where node D and G are present. Therefore, it was decided to optimize the entire original rear part (Figure 9), changing the material and its structure topology.
The same choice was adopted in [13], where, in order to maximize the torsional behavior of the car, the rear part was optimized (in this case there was no exploitation of additive manufacturing capabilities and material change).

4. Topological Optimization of the Rear Part of the Car Body

4.1. Preliminary Modeling of the Rear Part before Optimization Start

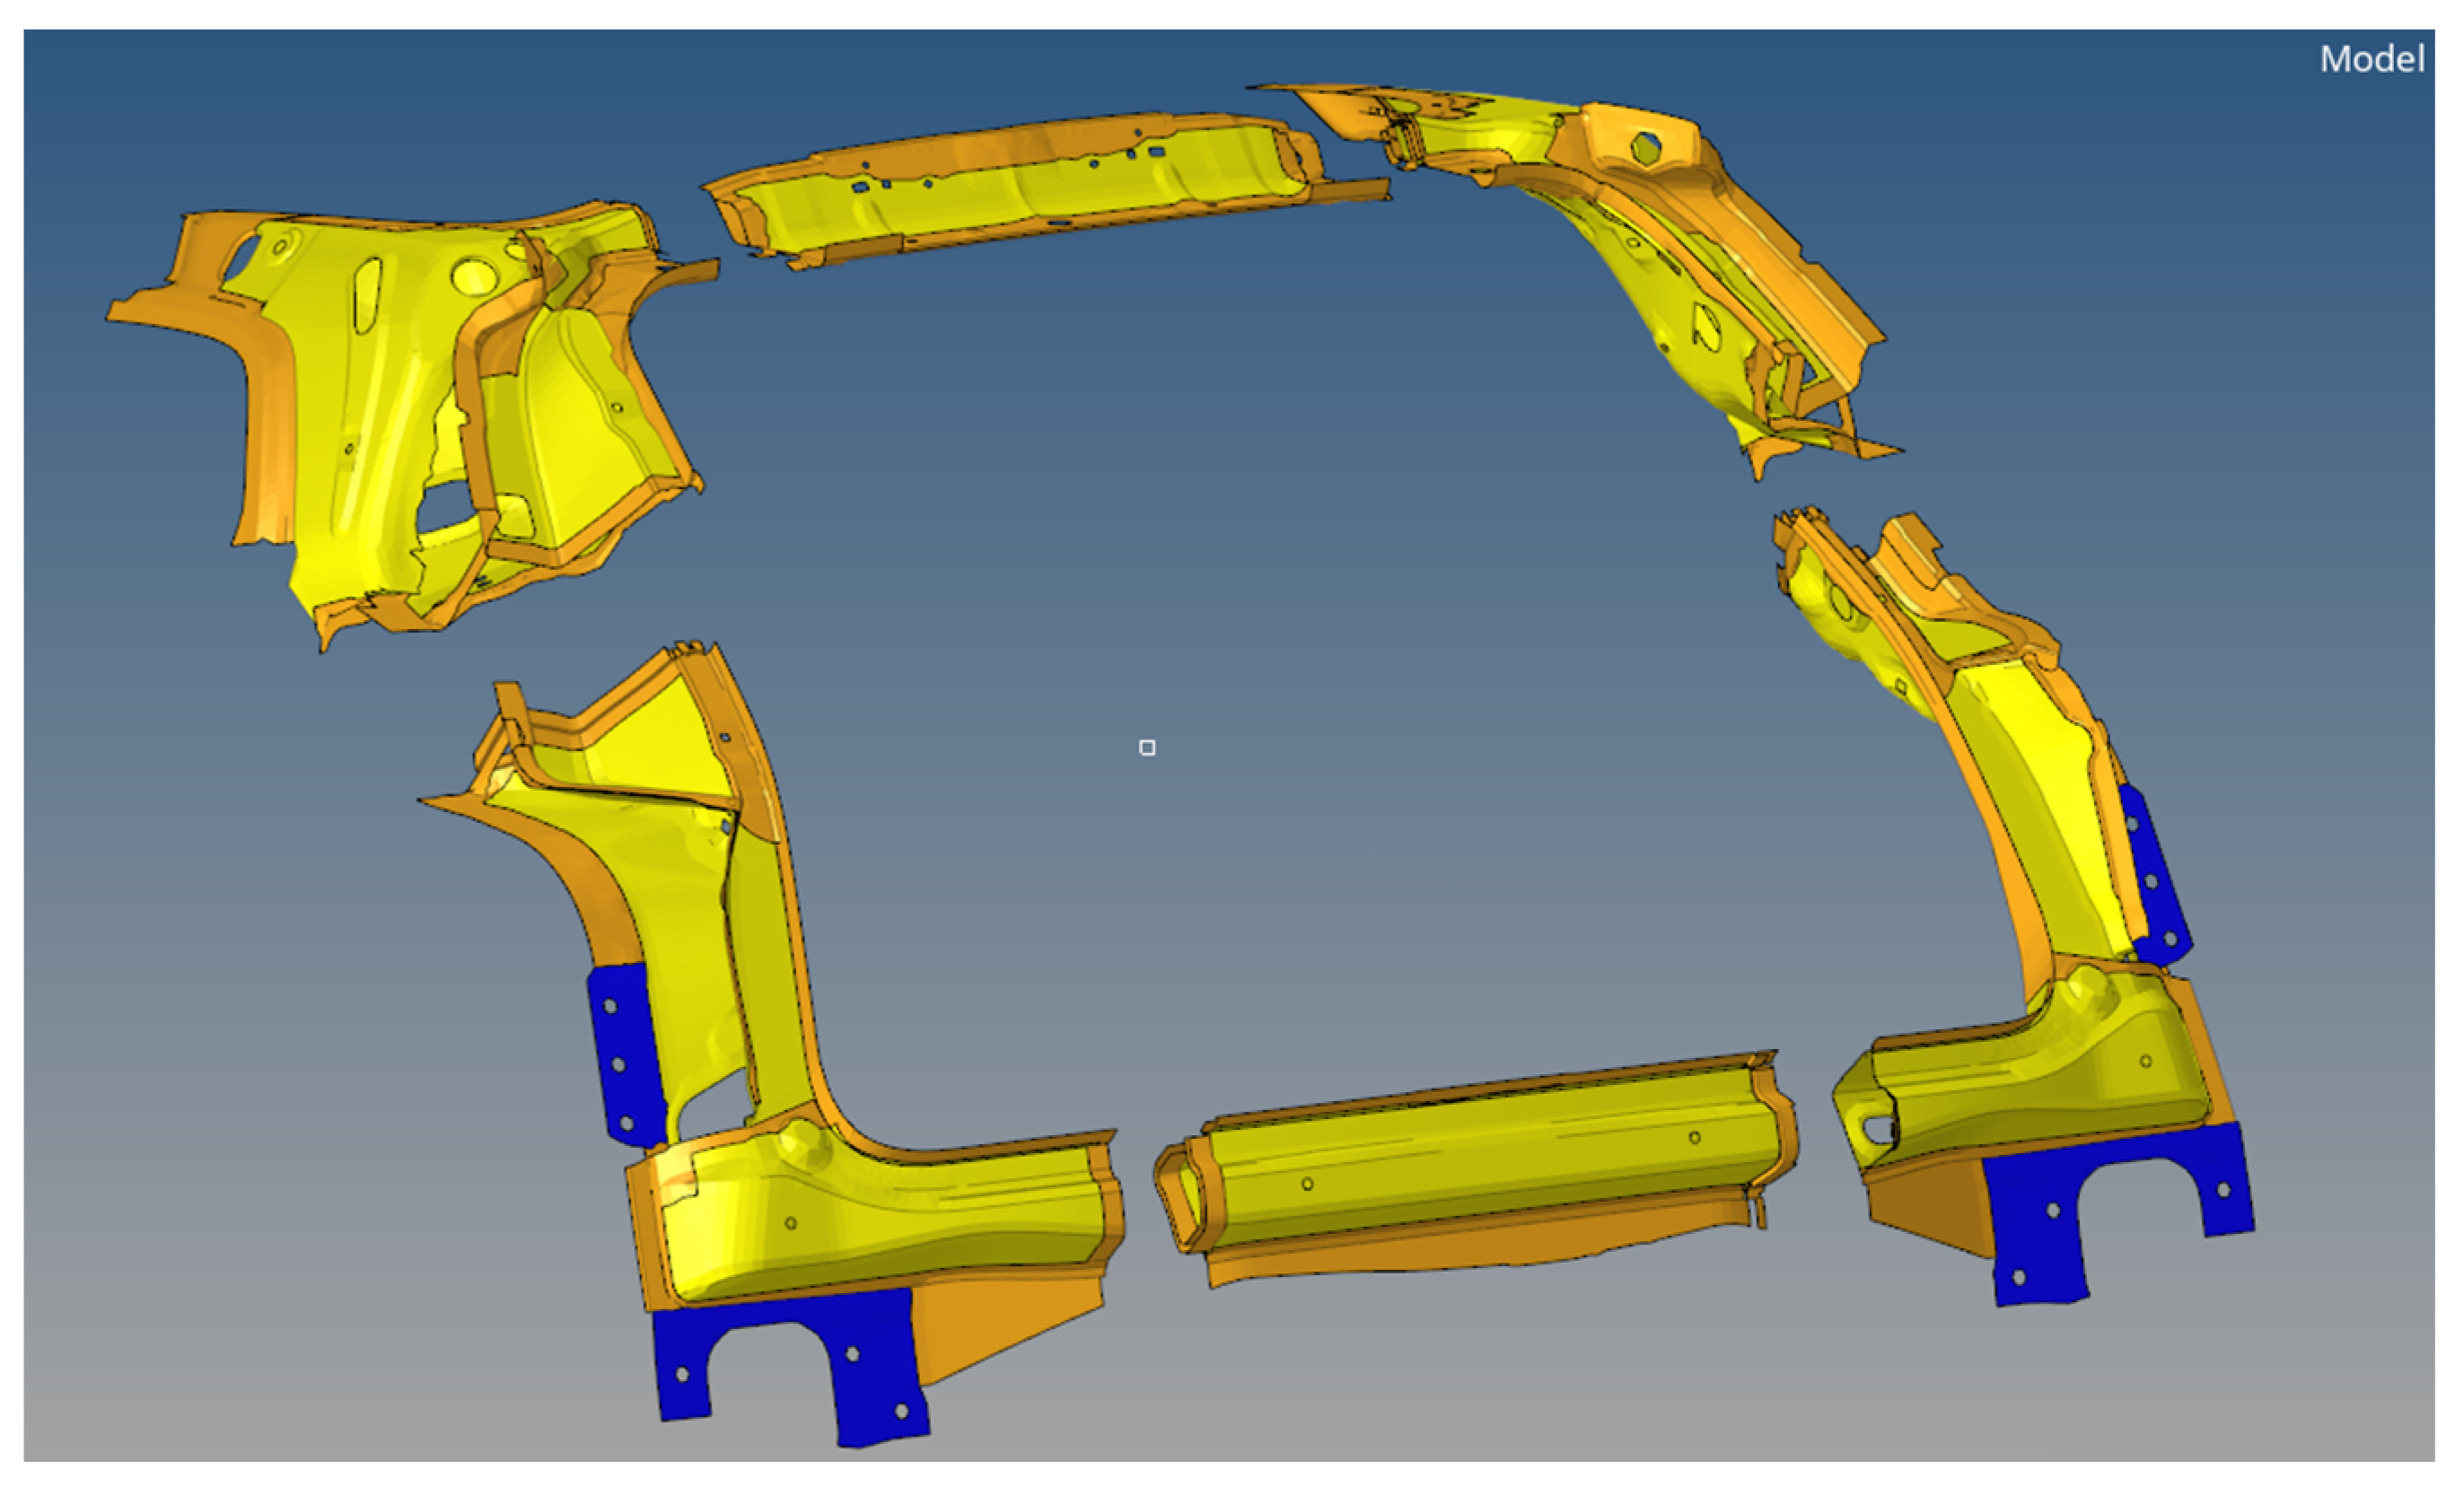
Before starting the rear part optimization process, some changes were imposed with reference to model mesh refinement, material replacement, and a preliminary (arbitrary) varied thicknesses of rear part components. In particular, the mesh in the areas of interest have been refined reaching an average element size of 2 mm; then, the material was changed from steel to aluminum, and, as shown in Figure 10, the thickness of several parts of the new ring were changed to 1 mm (yellow parts), 2 mm in the areas where there were fins (orange parts), and 3 mm where the connection with the remaining part of the steel structure was implemented (blue parts).
Then, the optimization starts, providing a new rear part, divided into six parts (Figure 10), which will be assembled at the end of the optimization process, in order to cope with the size limitations imposed by the commercially available 3D printers.

4.2. Connections of Rear Part with the Steel Structure

The connections between the new rear part of the vehicle and the remaining part of the structure were made as in the following:
-
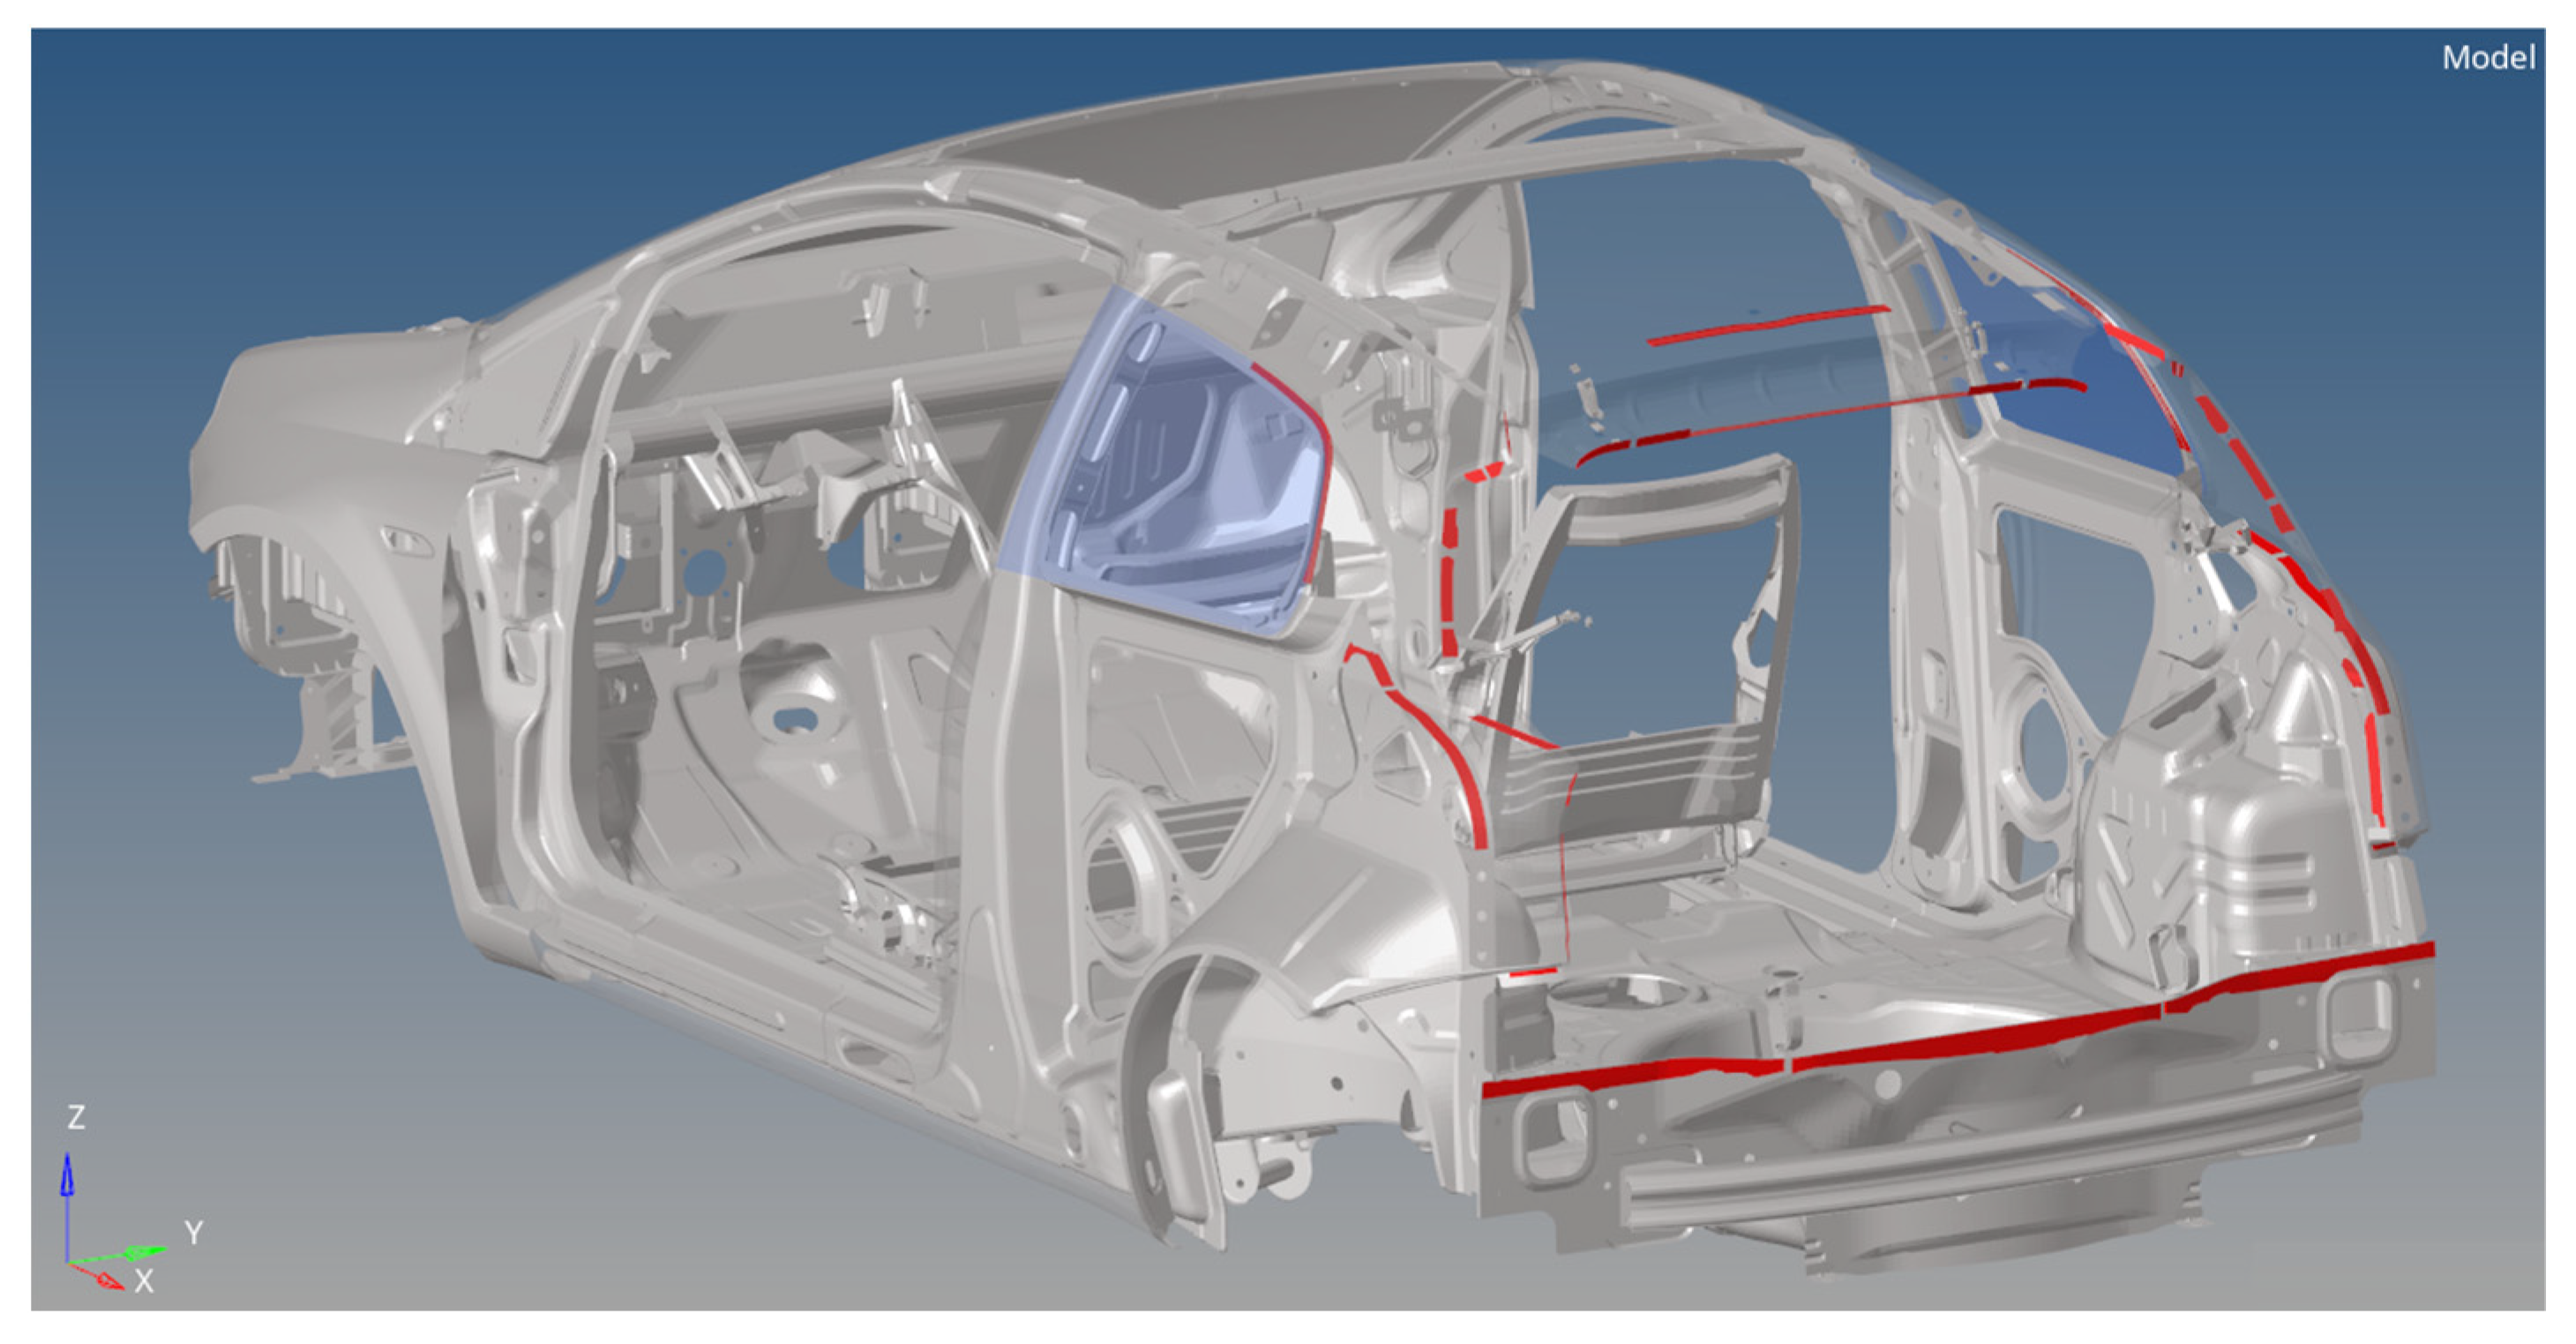
Using glue (Figure 11) to connect the upper part of the new rear ring with the roof, the side wings with the chassis, and, finally, the lower part of the rear car body with the rear crash bar.
-
Using screws (Figure 12) all arranged in the same direction of travel and connecting the upper, lower, and side parts. Screws were added to glue in those areas with a need for a stiffer connection.

4.3. Topological Optimization

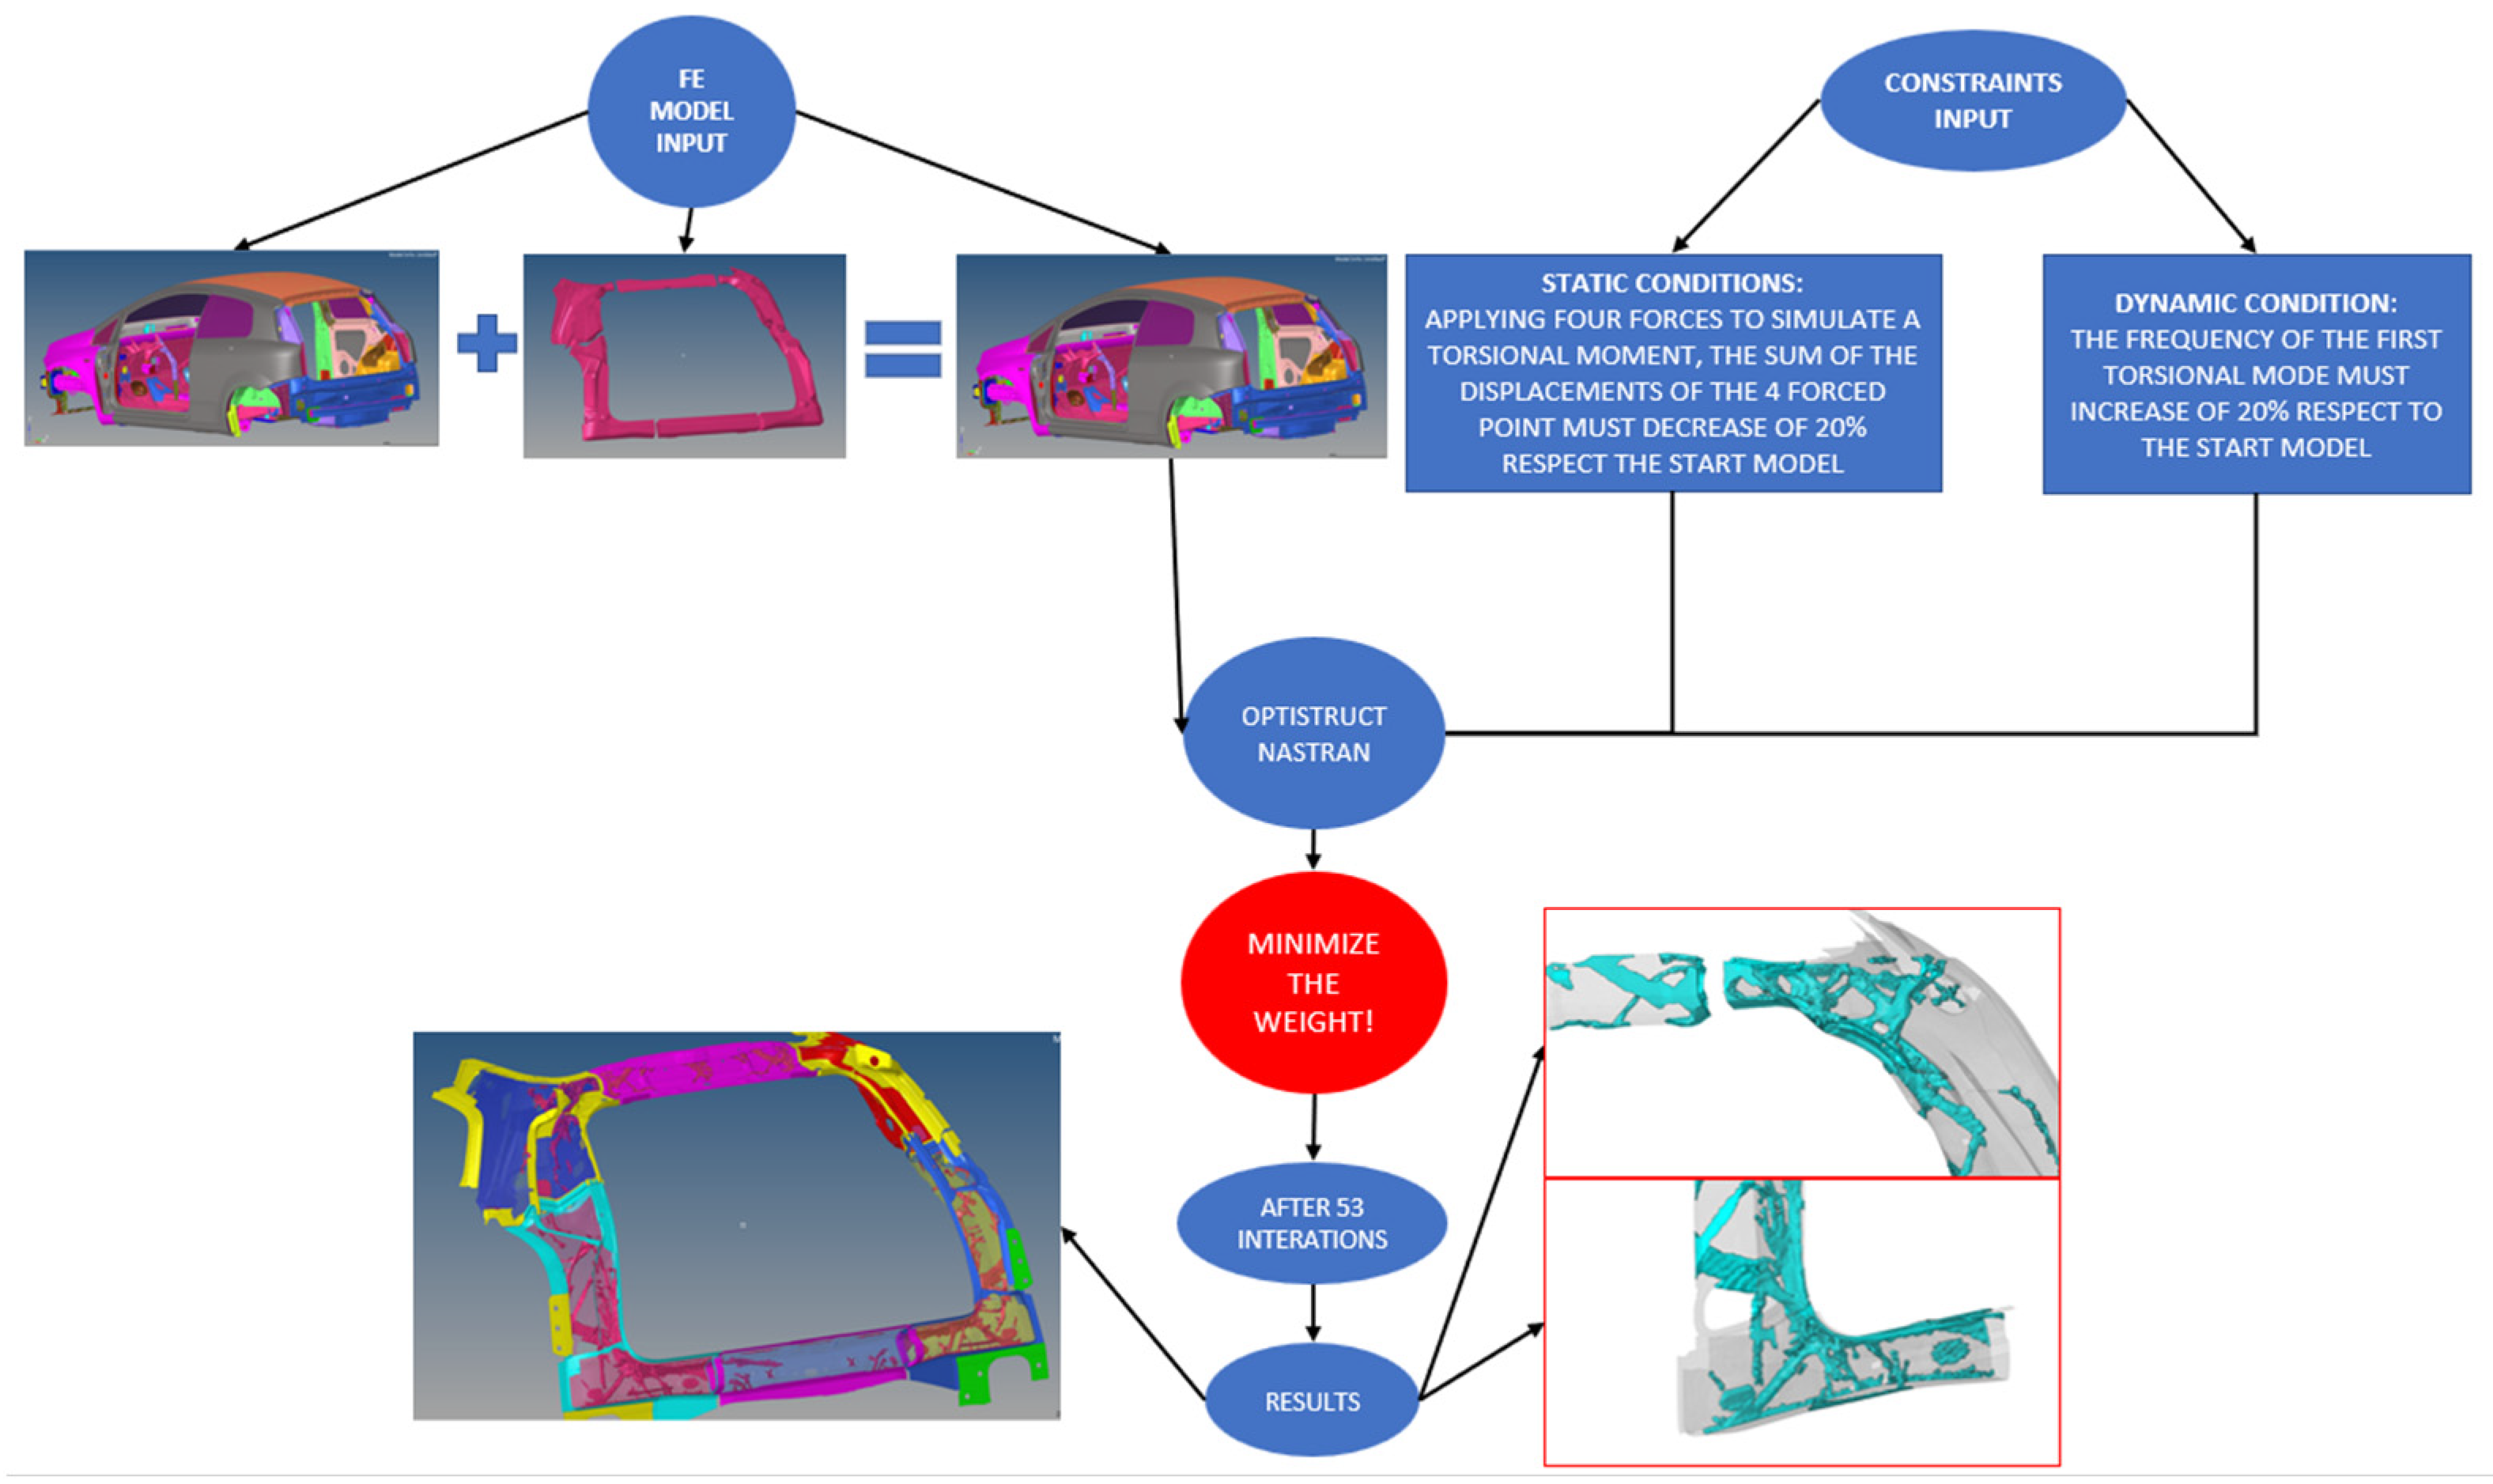
The objective of topological optimization was to acquire an increase of 20% in static and dynamic performances (as specified in the following) of the new rear part, while minimizing weight. A combined static/dynamic topological optimization was, therefore, performed using Optistruct [19]. The first step was to define a design space (Figure 13), which was the optimizer’s working area, where material can be removed to achieve the target set. In the creation of the design space, the overall dimensions of the steel original model were kept for the new aluminum model, working only on the internal empty spaces, in such a way to avoid that the design changes affected also the surrounding part in which the considered component is assembled.
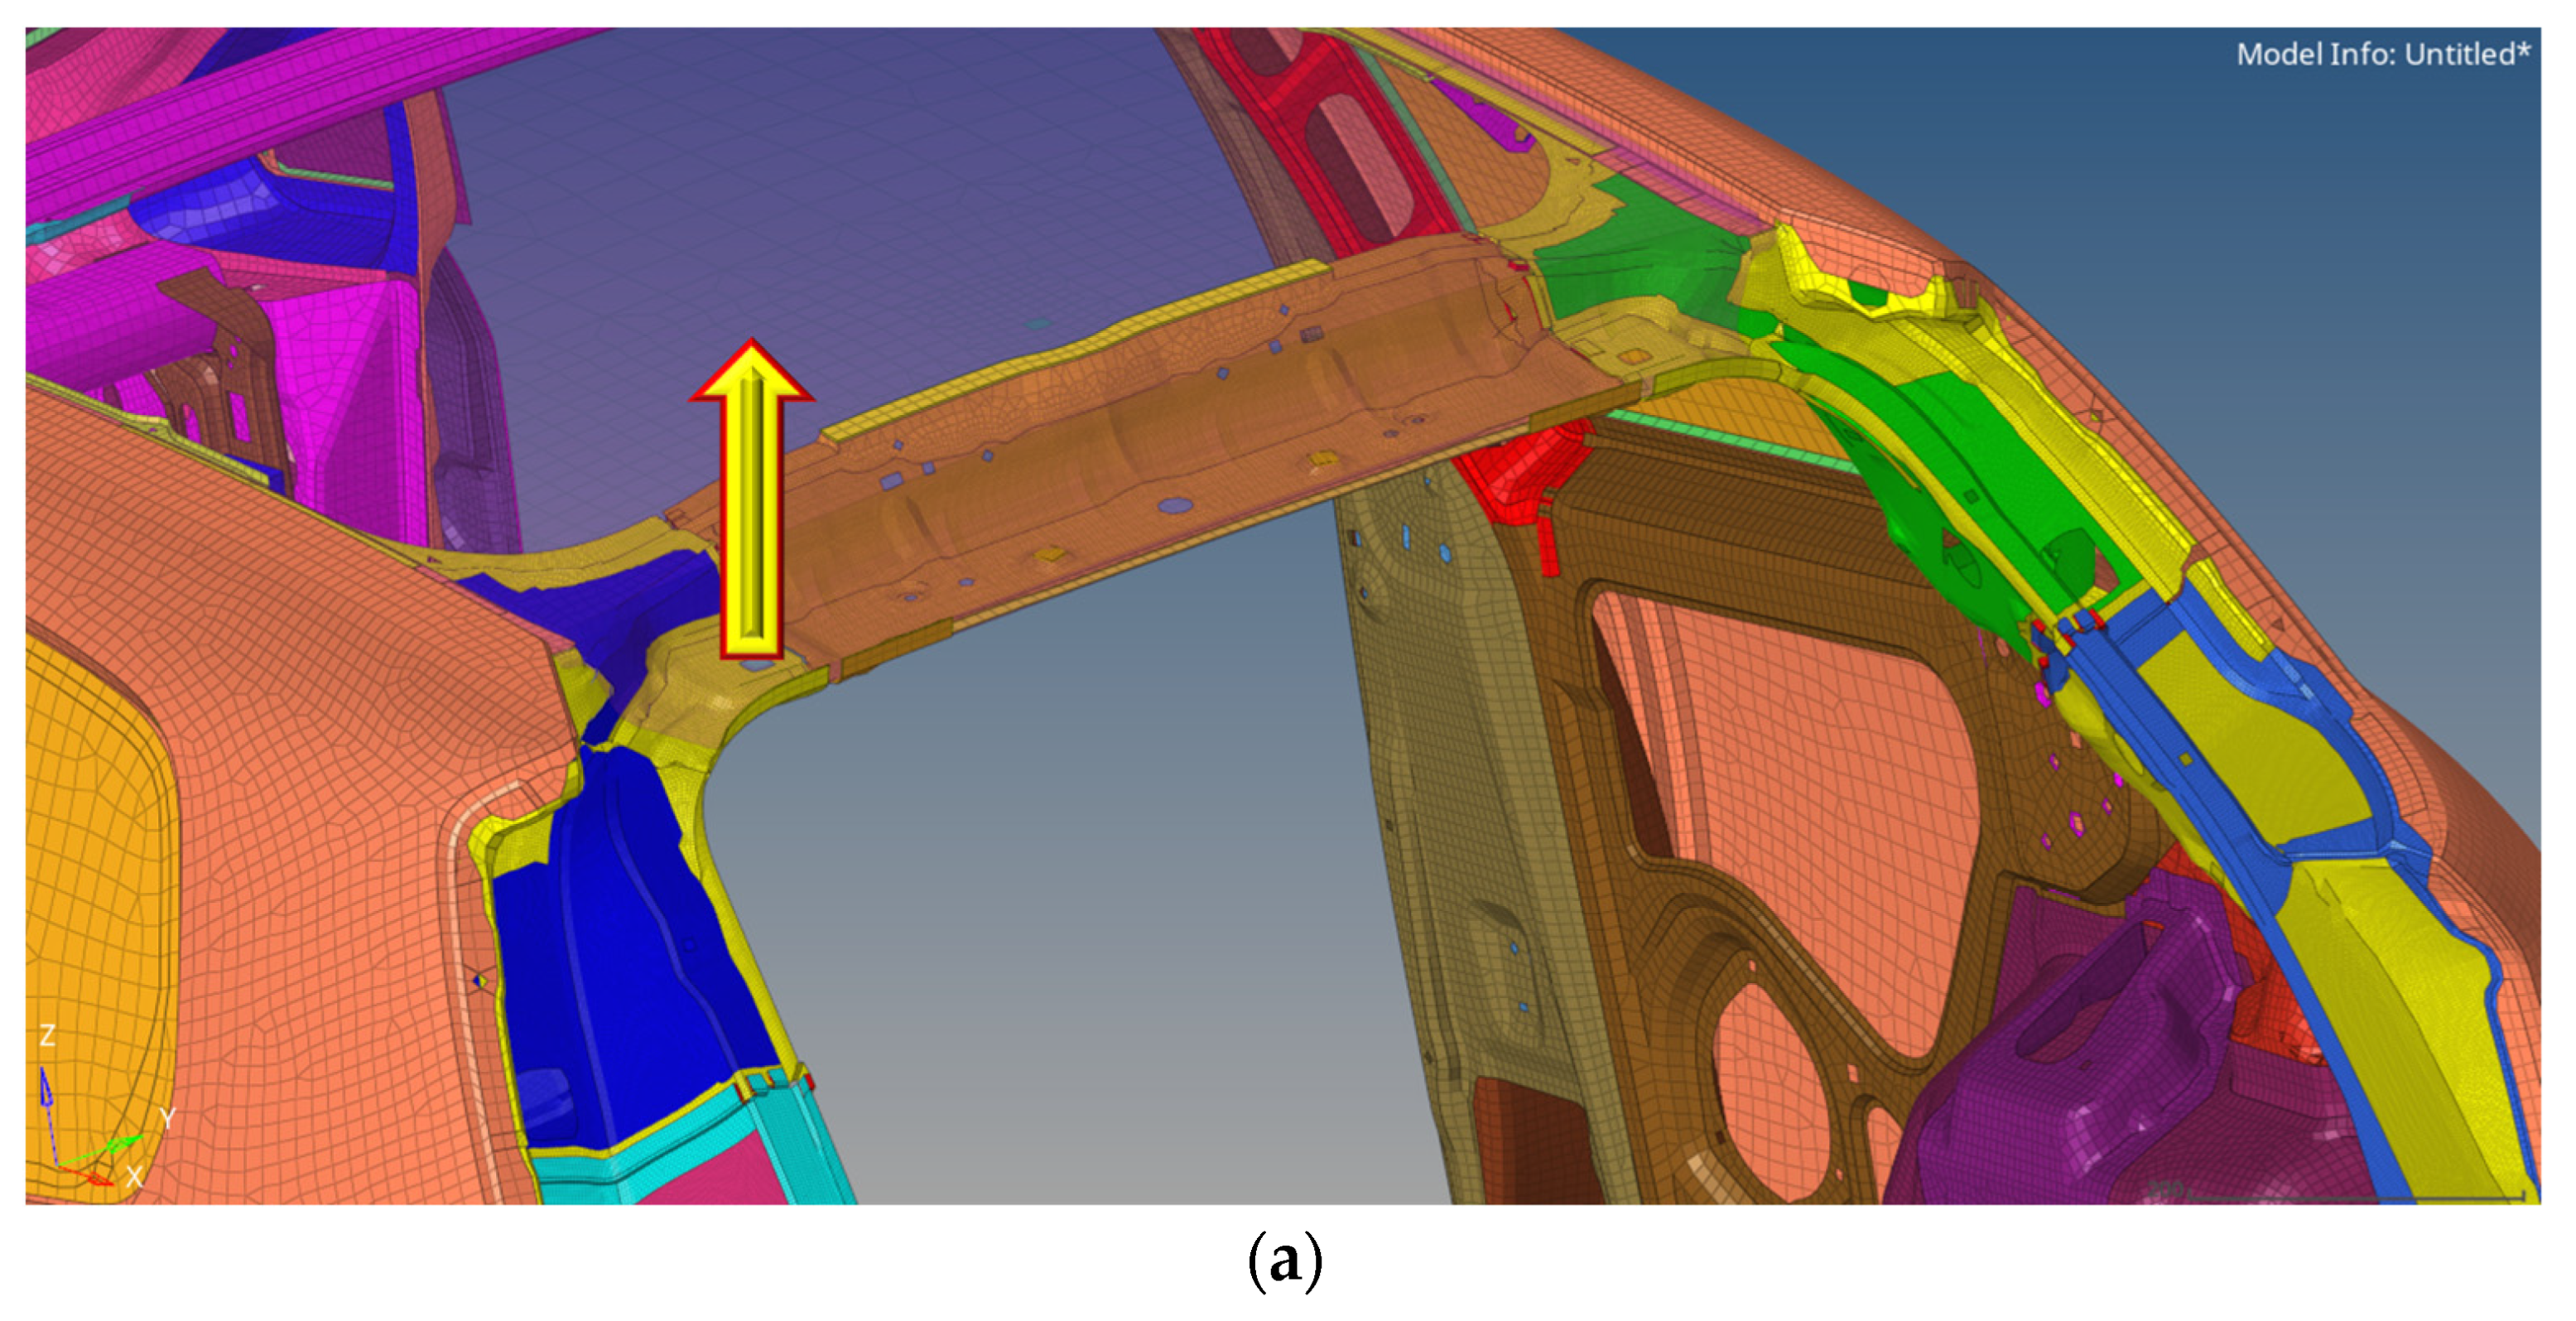
From a static point of view, one imposed constraint was that the sum of the displacements of the four loaded points (used to simulate a torque loading condition on the back part) (Figure 14) had to be 20% lower than that corresponding to the BIW starting model. For this analysis, the car body is clamped in correspondence of the four domes (where the suspension system is connected to the car body).
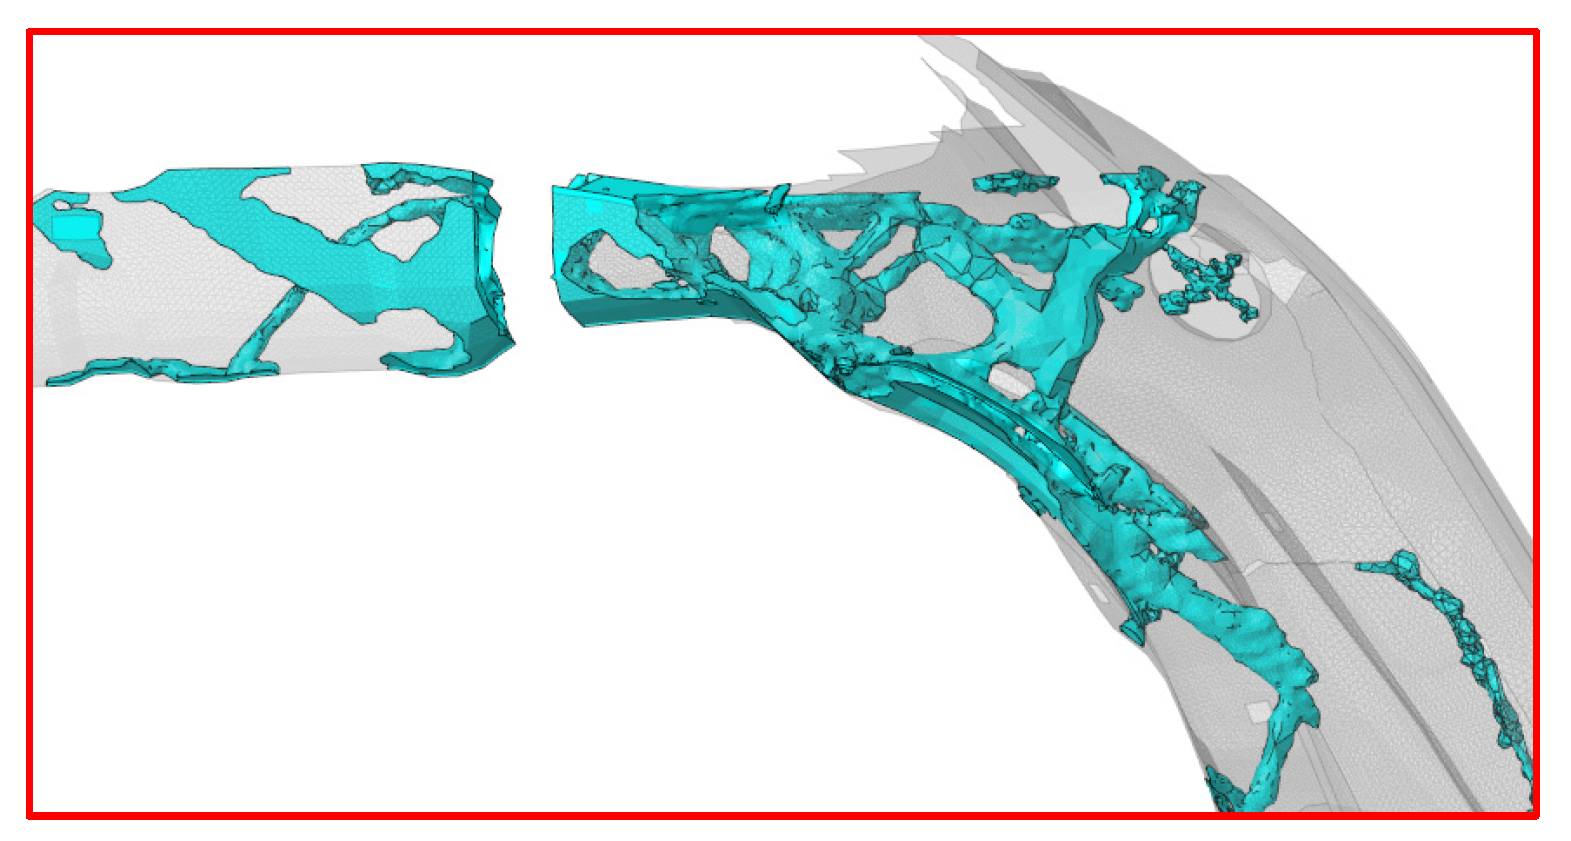
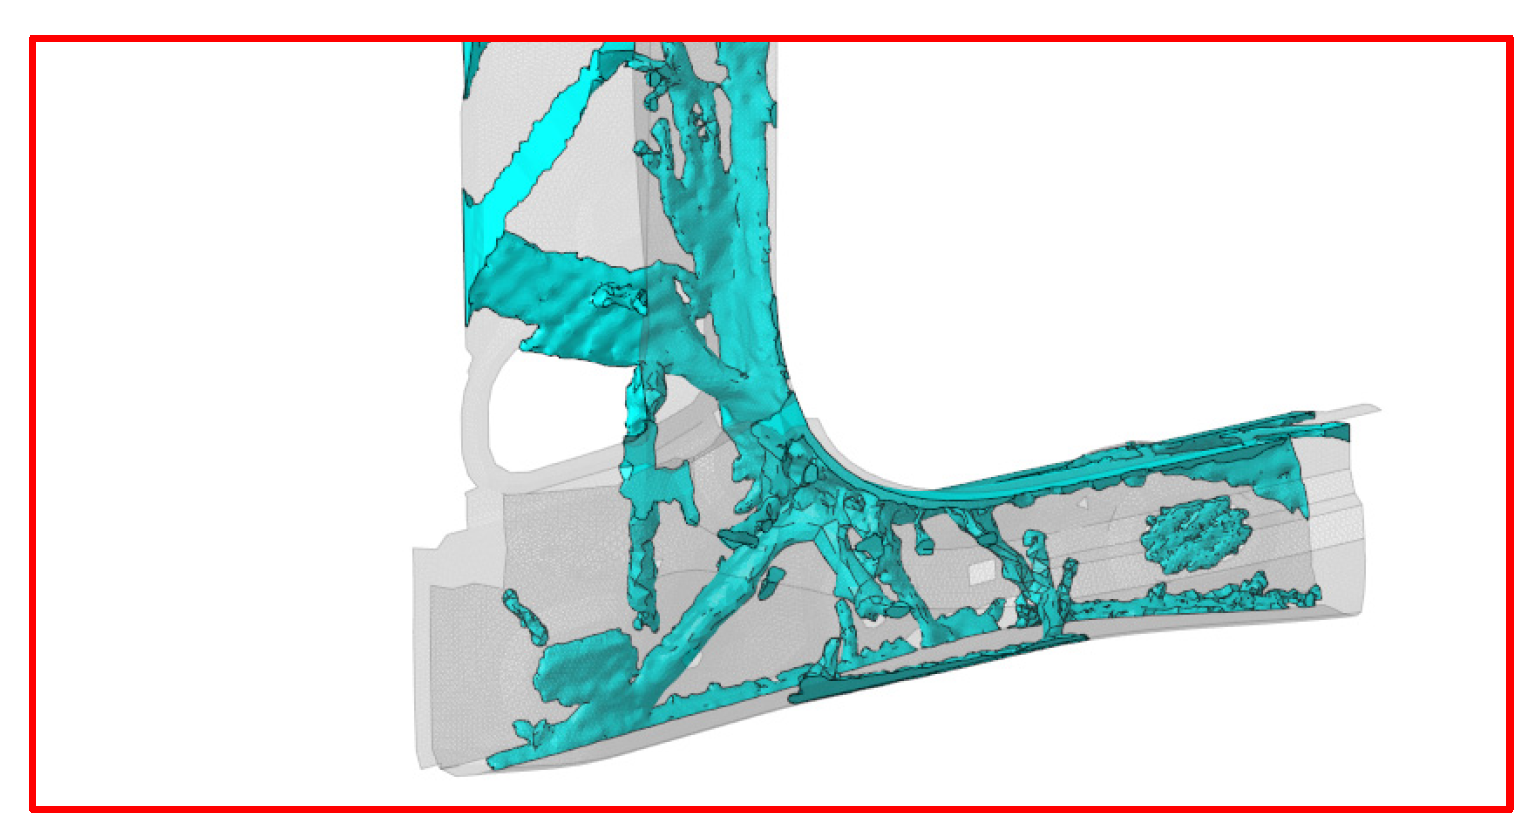
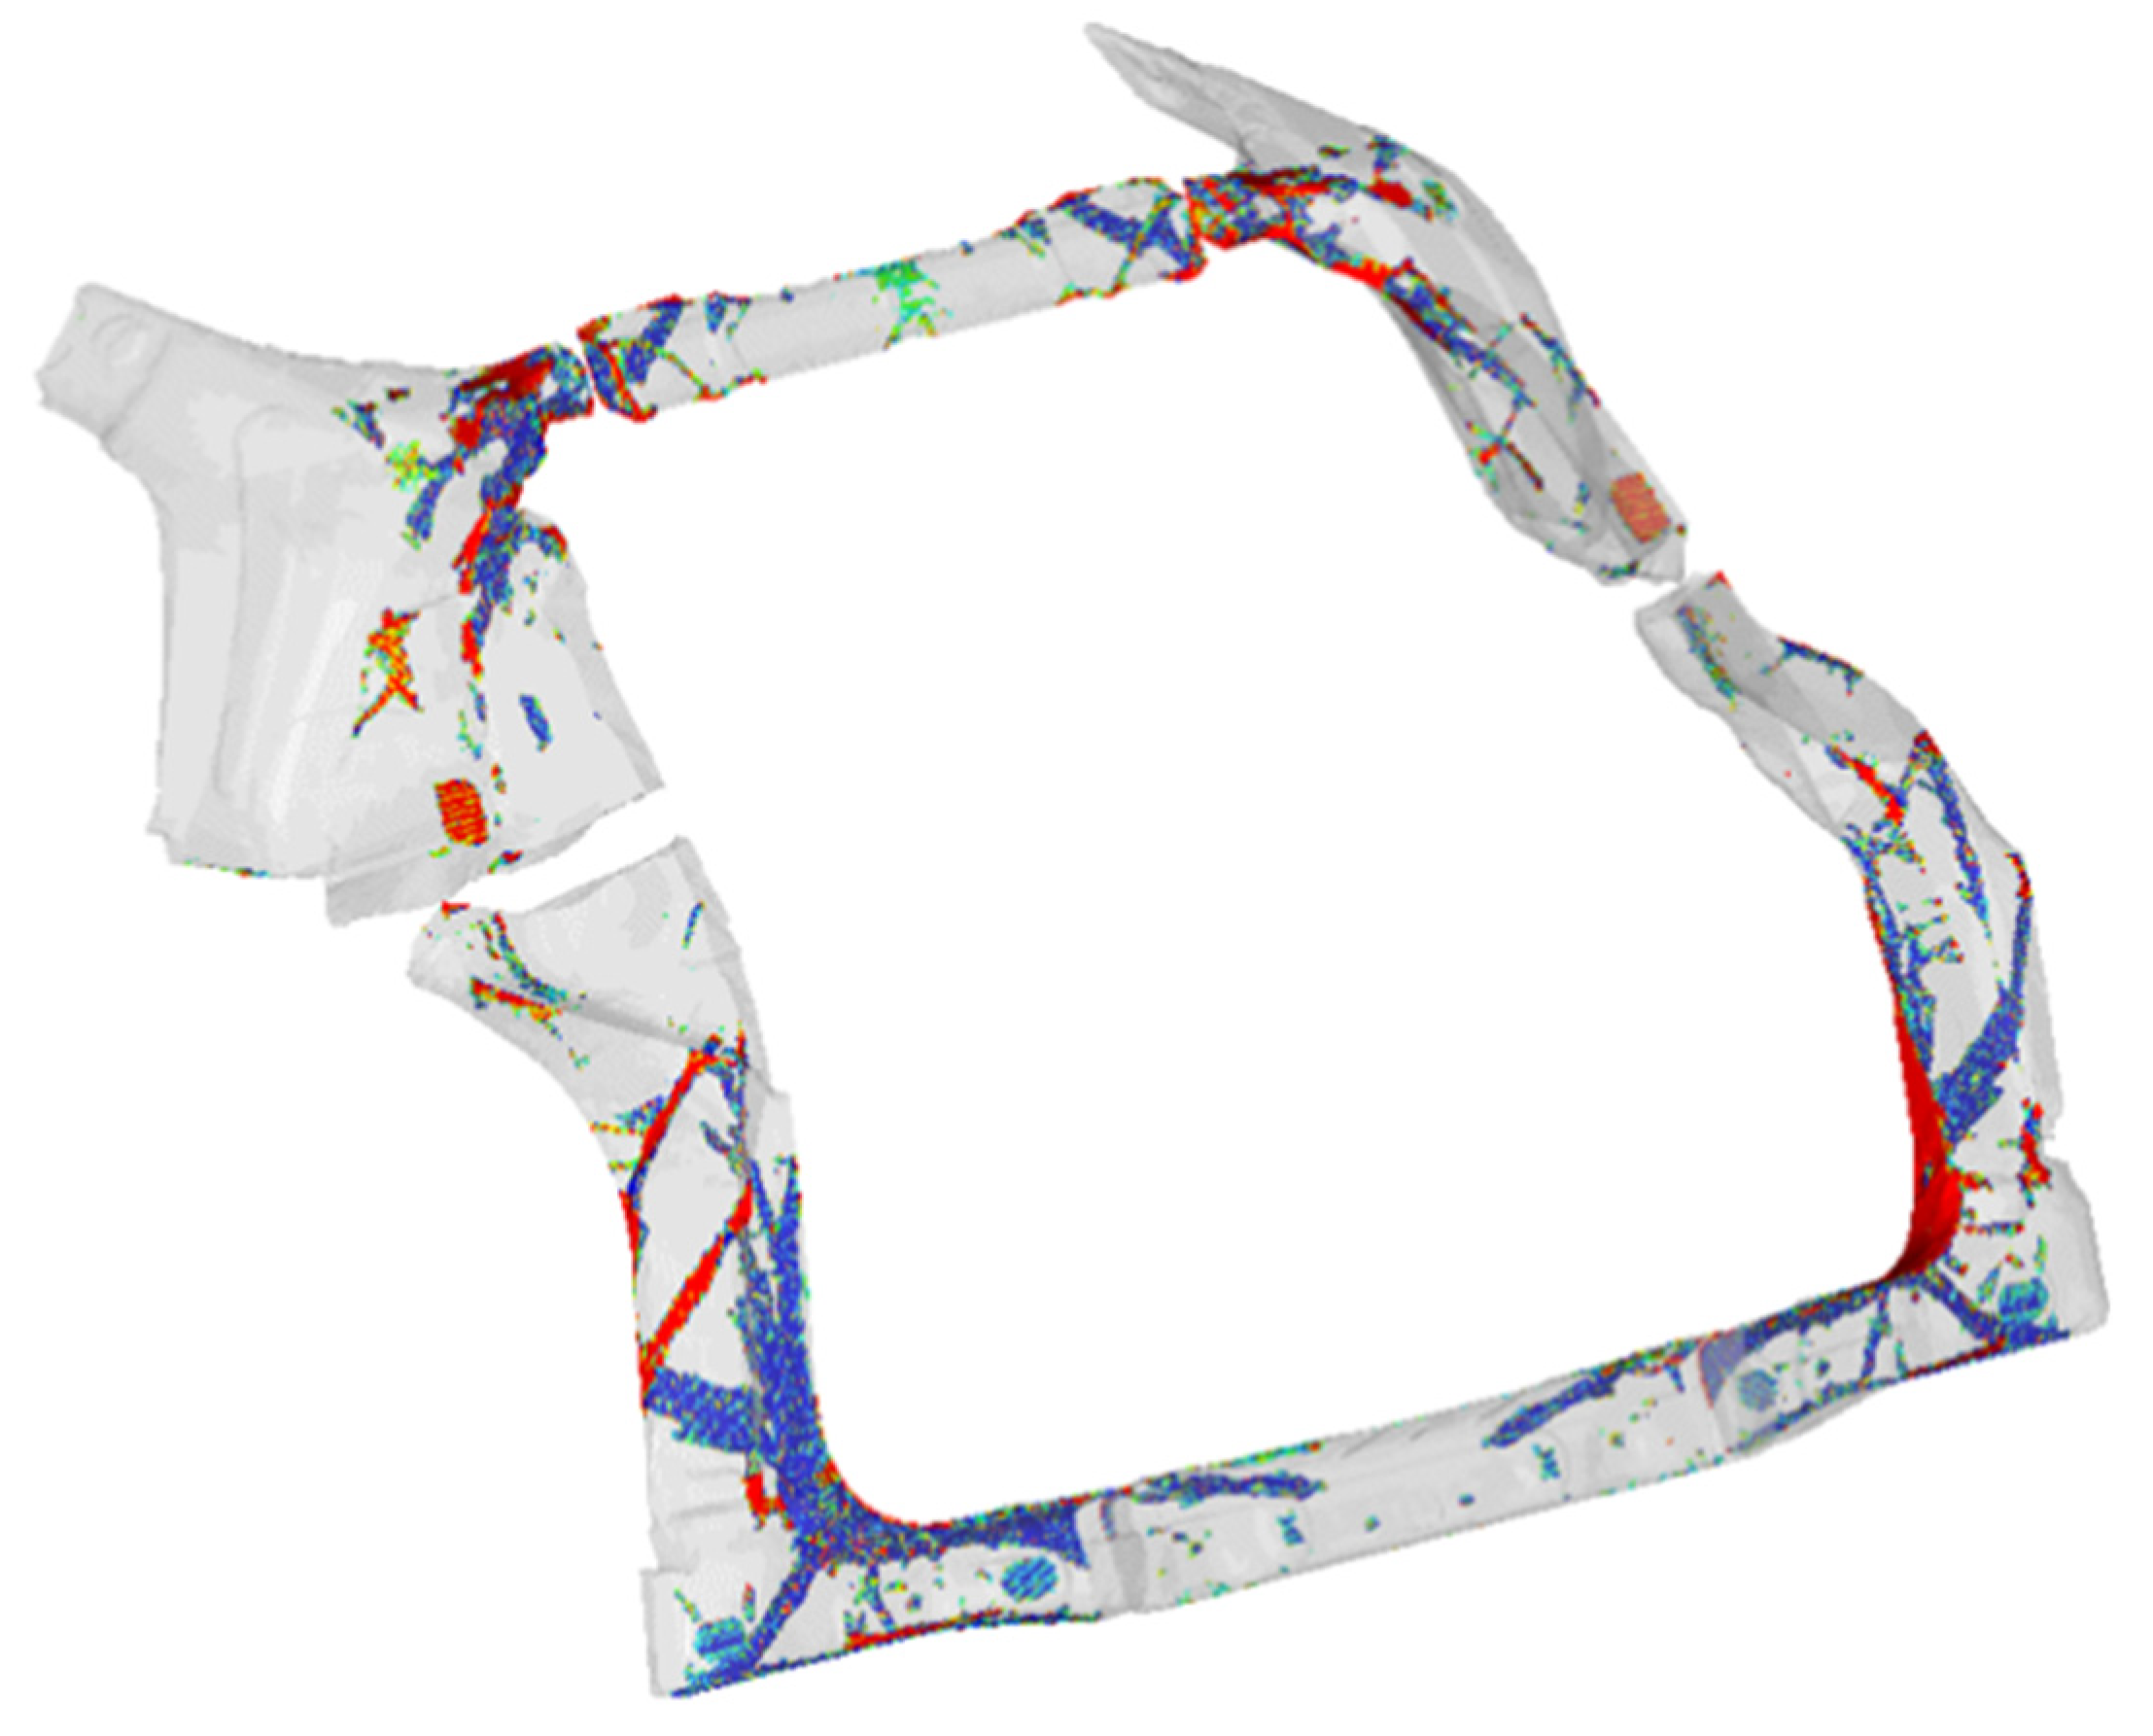
Moreover, another constraint, from a dynamic point of view, requires that the frequency of the first torsional mode must increase by the same percentage (20%) in comparison to the reference BIW model. Static and dynamic constraints have the goal of minimizing weight in common. Starting from the model with the complete design space available, running the combined static/dynamic optimization with weight minimization, an optimized reticular structure was obtained for the rear part after fifty-three iterations, and, in particular, for the nodes D (Figure 15) and G (Figure 16), where the modifications turned out to be more effective. The post-optimization model still needs further improvements in order to cope with 3D printing constraints; consequently, it was cleaned up of those elements that cannot be manufactured because of the lack of structural continuity in the overall frame. As a consequence of the latter modification, the performance of the final configuration (Figure 17) was expected to increase by less than 20%.
In Figure 18, a flow chart is provided to summarize the optimization process: starting from the FE model input (the original model with the replaced rear part and the full design space available), objective function (weight minimization), and the constraints input (static and dynamic conditions), the optimization analysis was carried out to obtain the final topological structure.

5. Static and Dynamic Results of the Optimized Model

5.1. BIW Model

For the BIW model, after the topological optimization process, the final outcomes (Table 1) were evaluated from the static and dynamic point of view. A displacement decrease of nearly 36.8% (considering the sum of displacements on the four loaded point) was obtained with respect to the original model, with an increase in the frequency of the first torsional mode of nearly 14%; at the same time, a 19% weight reduction in the rear part was obtained.

5.2. TB Model

In order to identify the frequency of the first torsional mode of the optimized TB model, a forced analysis was performed in parallel to the modal one. The results, in terms of accelerations (Figure 19), clearly highlighted the first torsional frequency: the point circled in black corresponds to the frequency of the first torsional mode, showing an increase of 2 Hz compared to the original TB model.

Areas of Particular Interest on TB Model

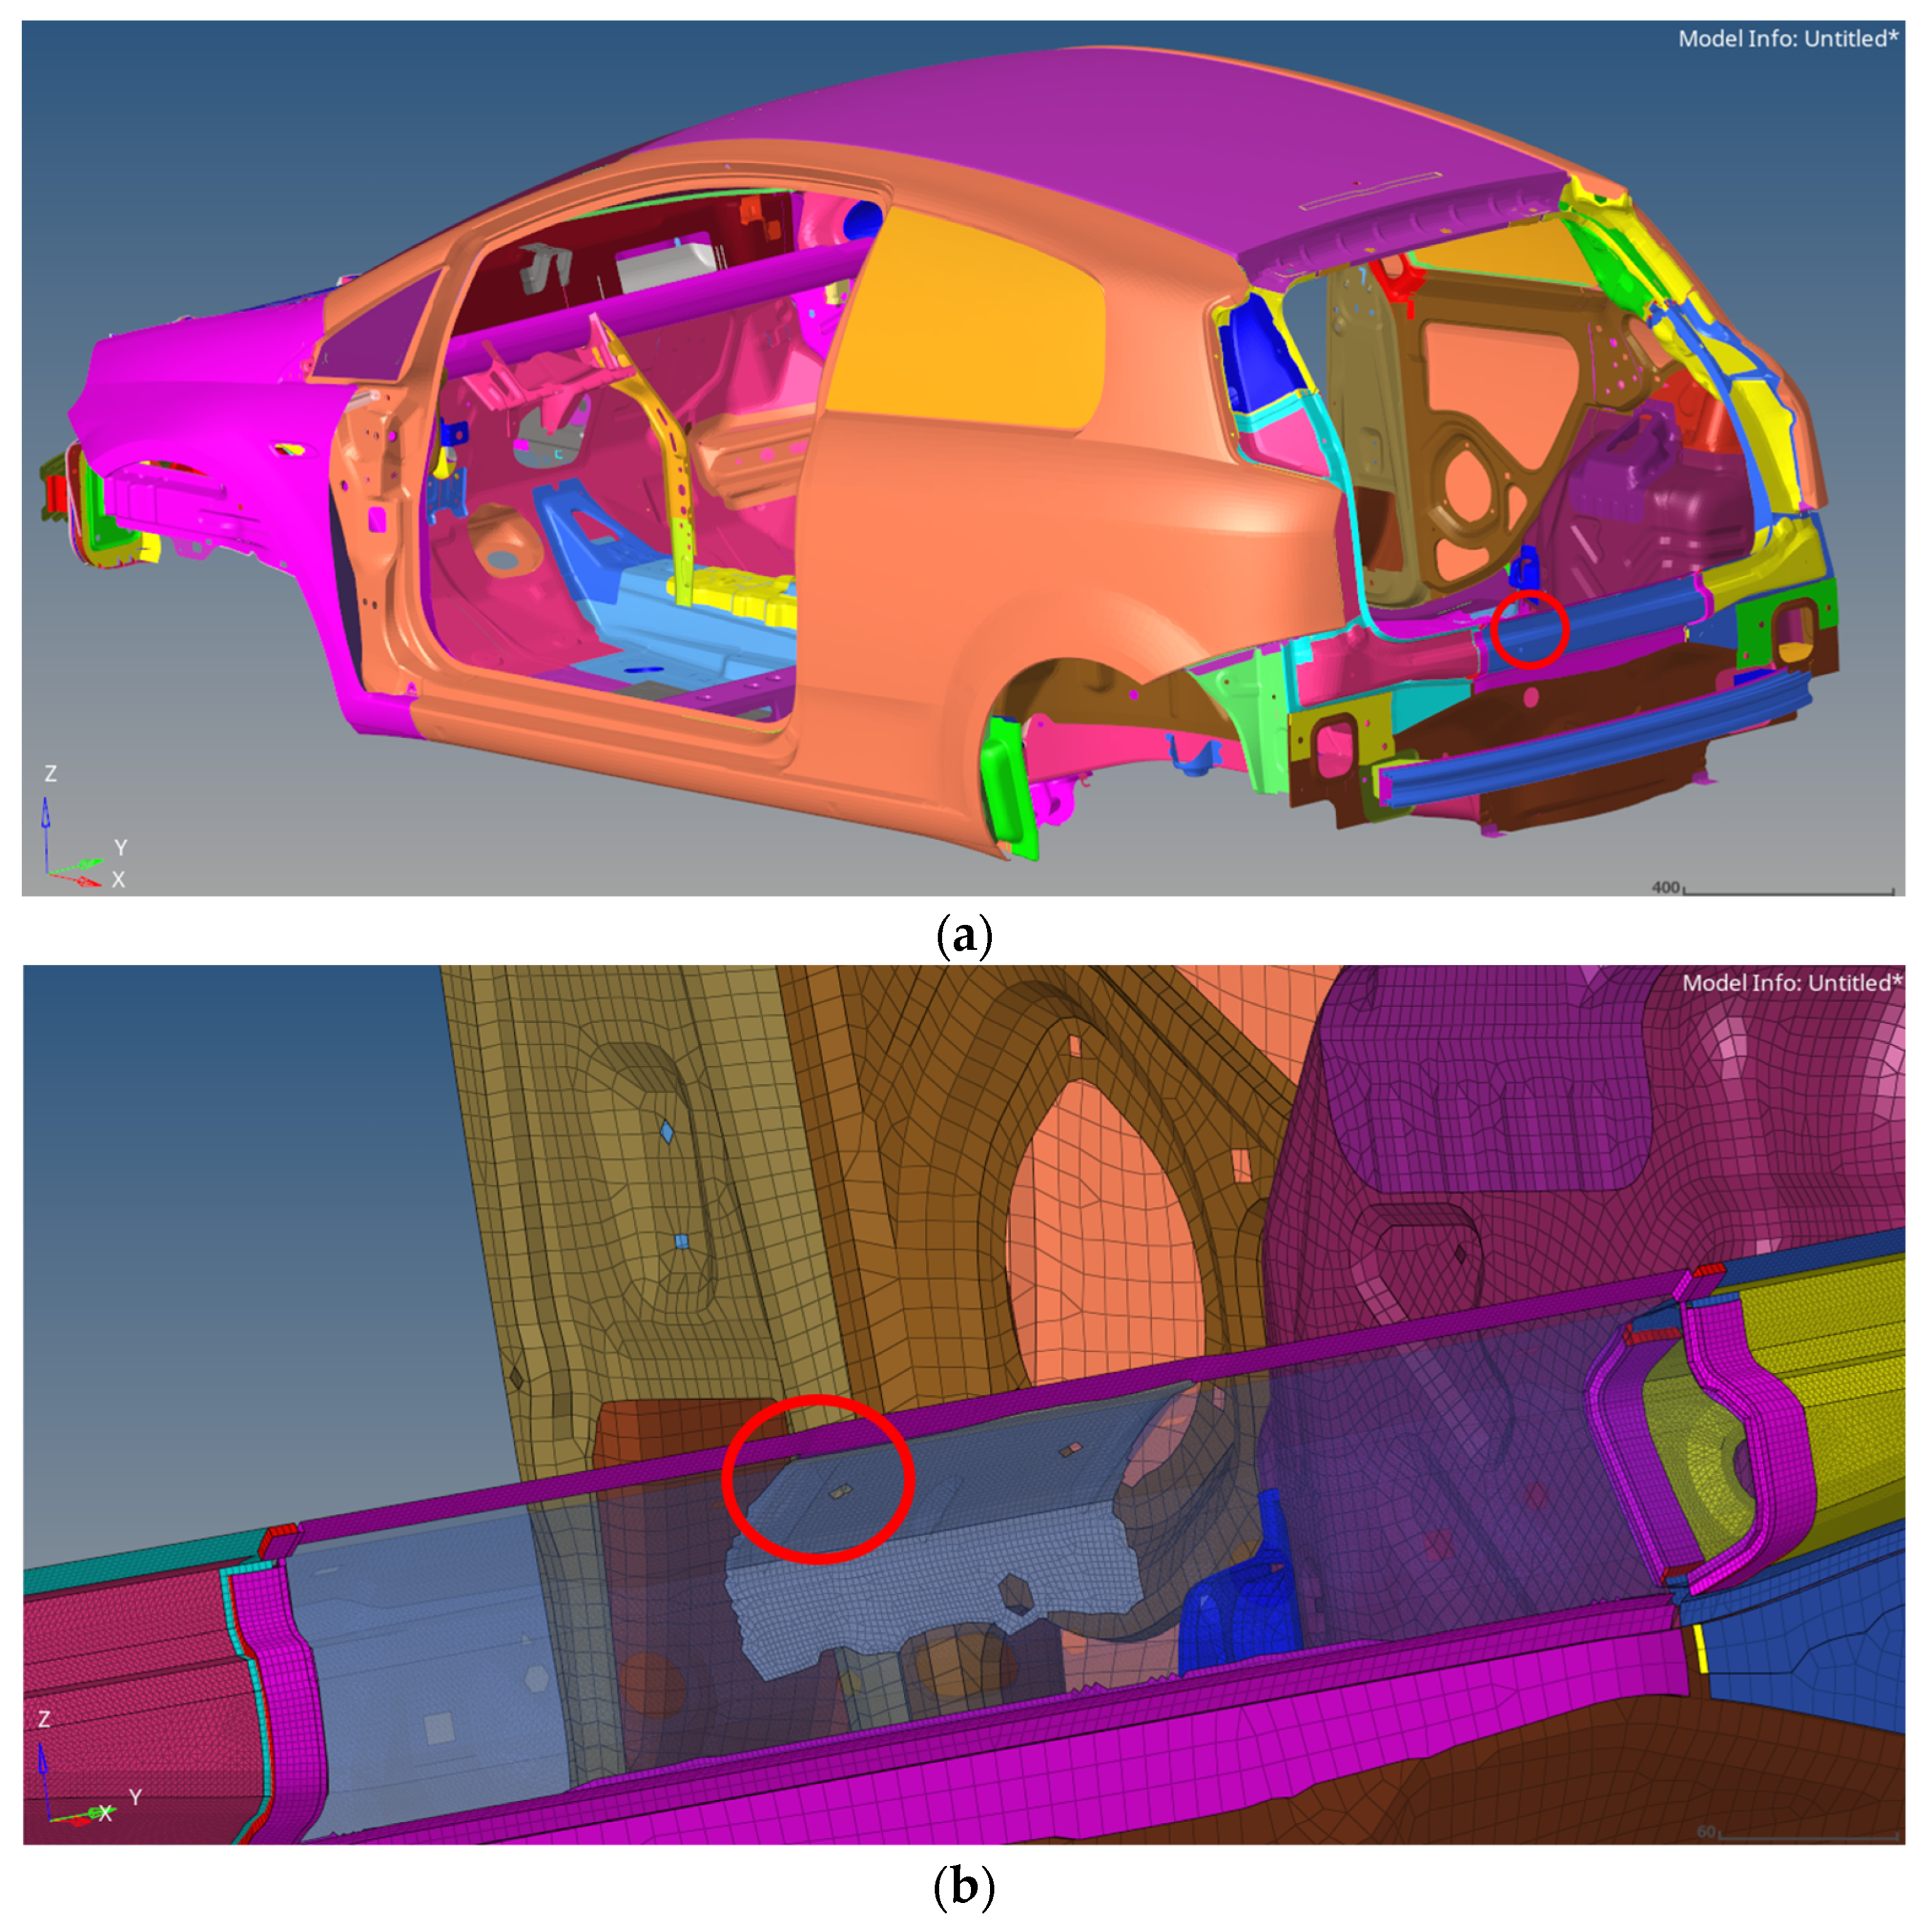
Considering the TB model, there are critical areas at the rear part of the car body where the static and dynamic stiffness must be at least as high as that of the original model. These areas can be identified as those parts that undergo concentrated loads: the hinge connections (Figure 20a,b) and the lock connections (Figure 21a,b), where the weight of the tailgate was sustained (these areas are highlighted in red).
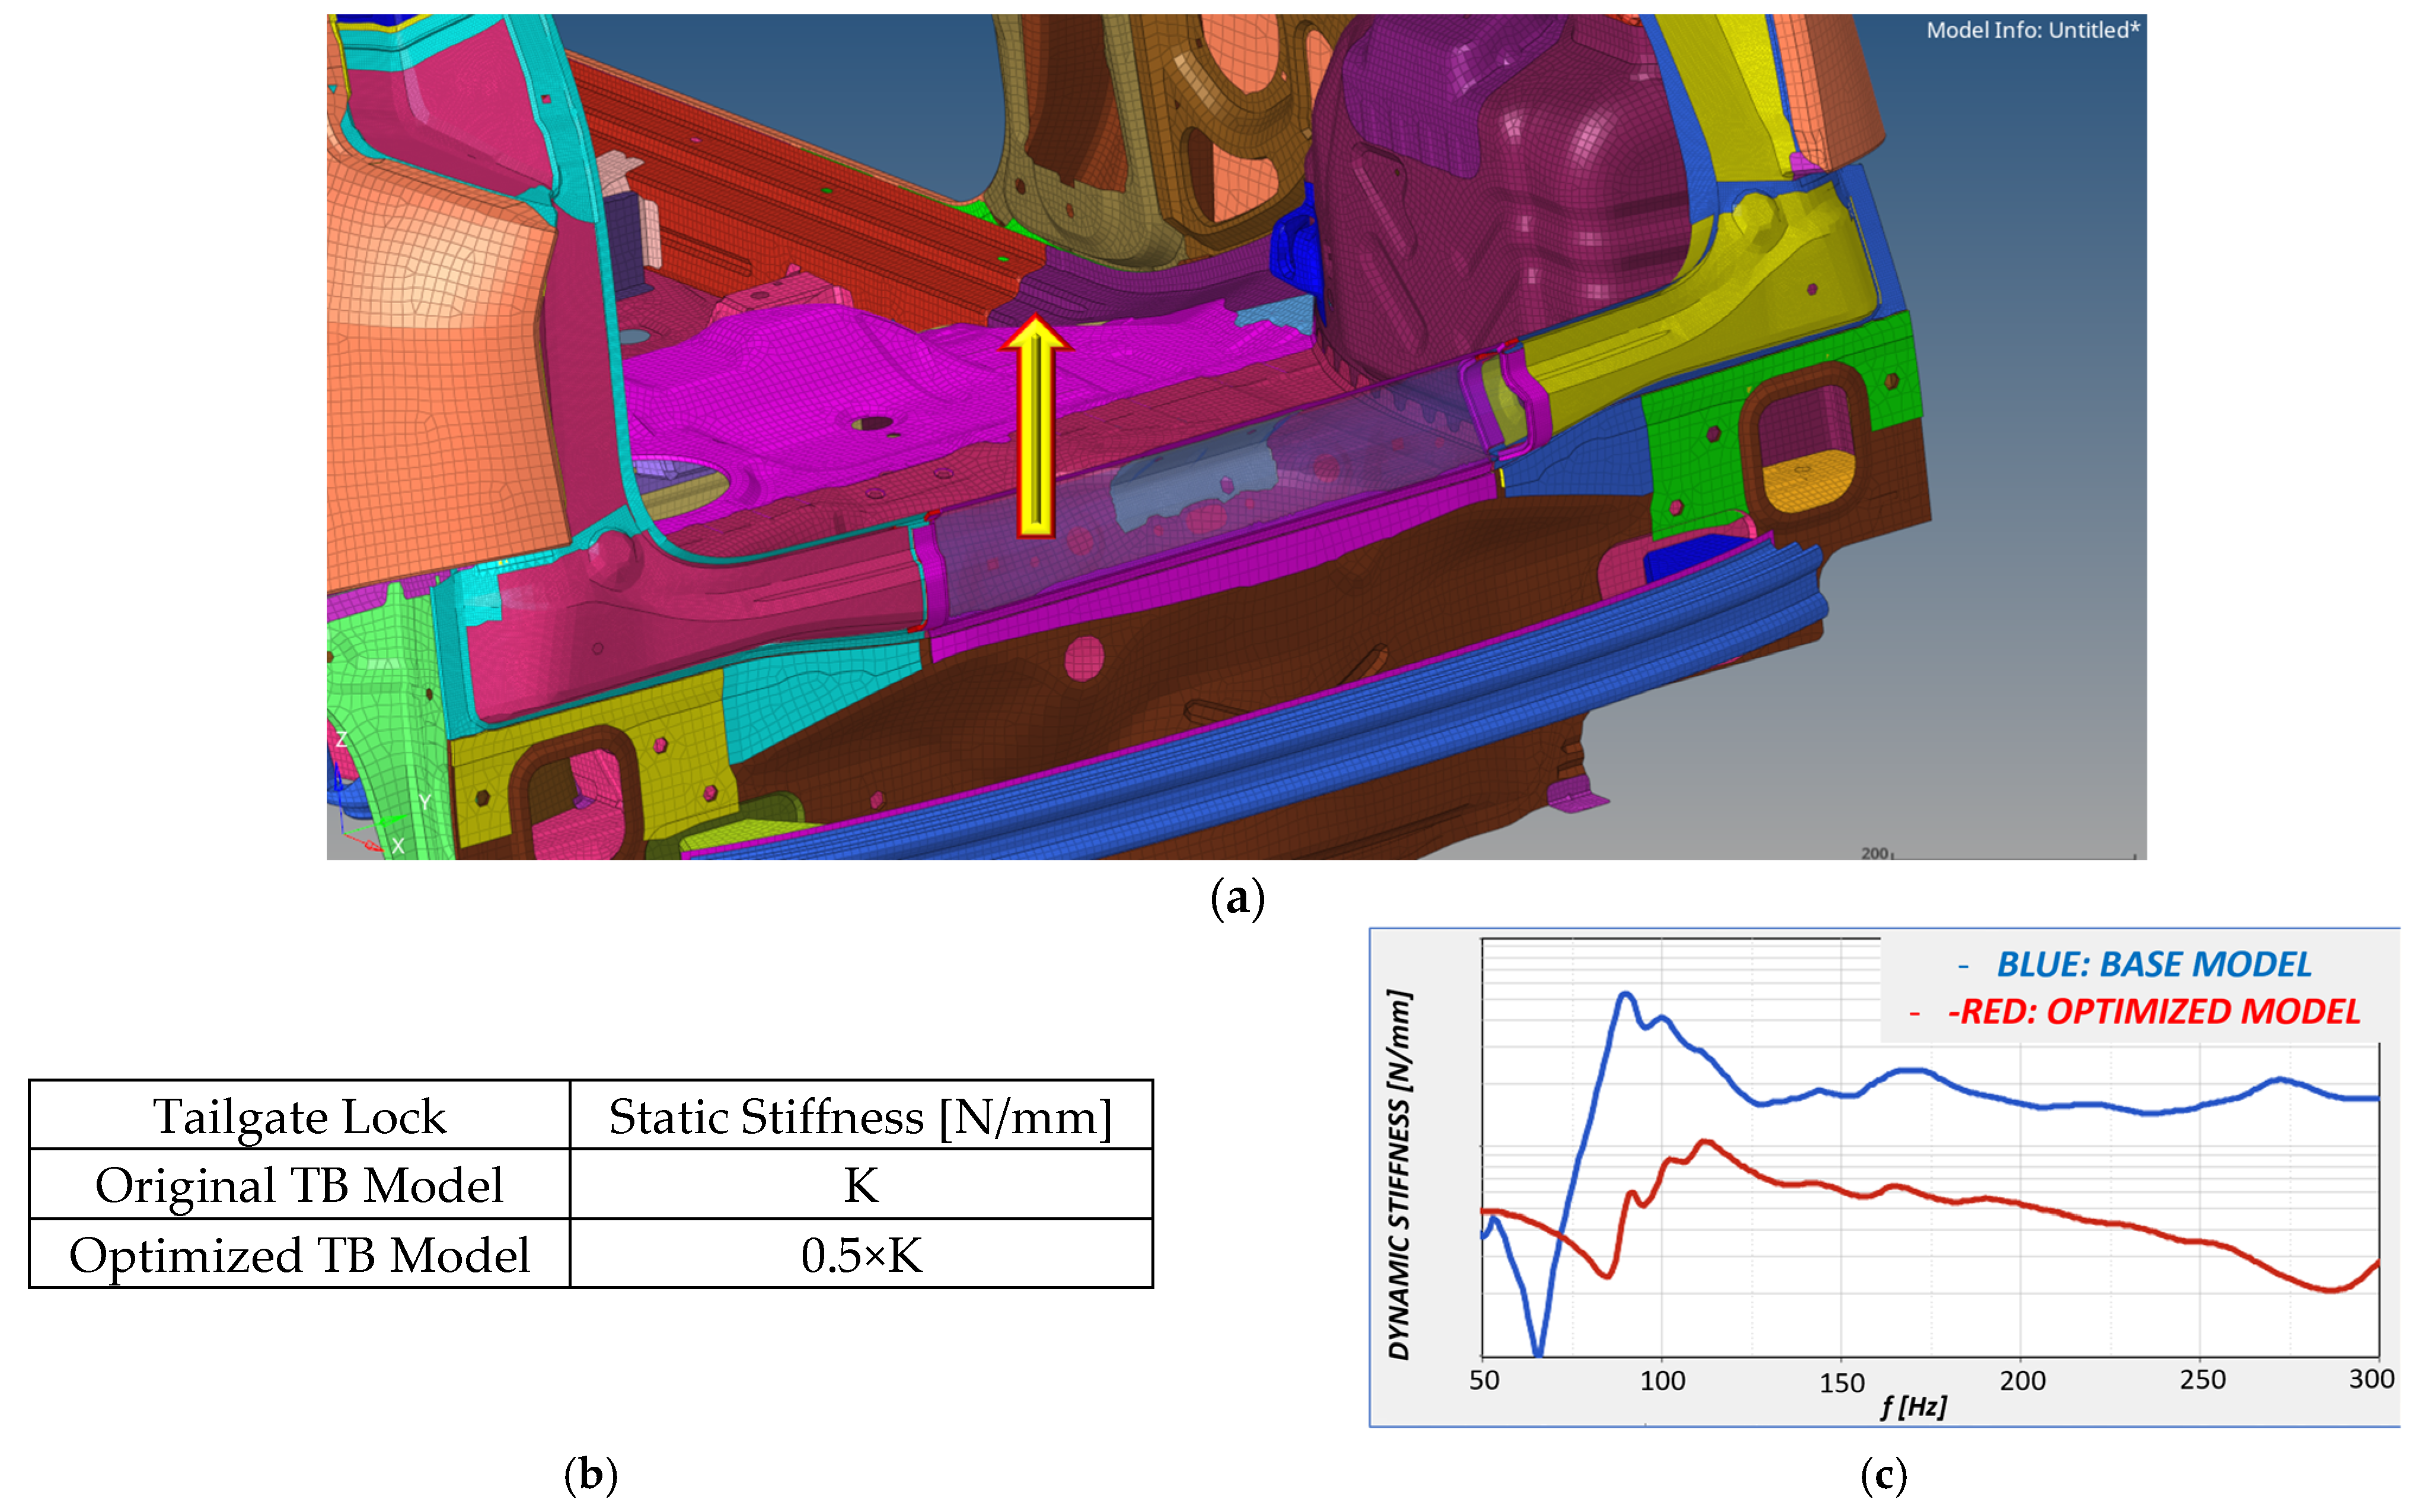
Running a static and a dynamic stiffness analysis, namely, applying a force along z direction (yellow arrows in Figure 22a and Figure 23a) at the two aforementioned points (Figure 22a and Figure 23a), first statically and then dynamically, the corresponding static (Figure 22b and Figure 23b) and dynamic (Figure 22c and Figure 23c) stiffnesses were recorded.
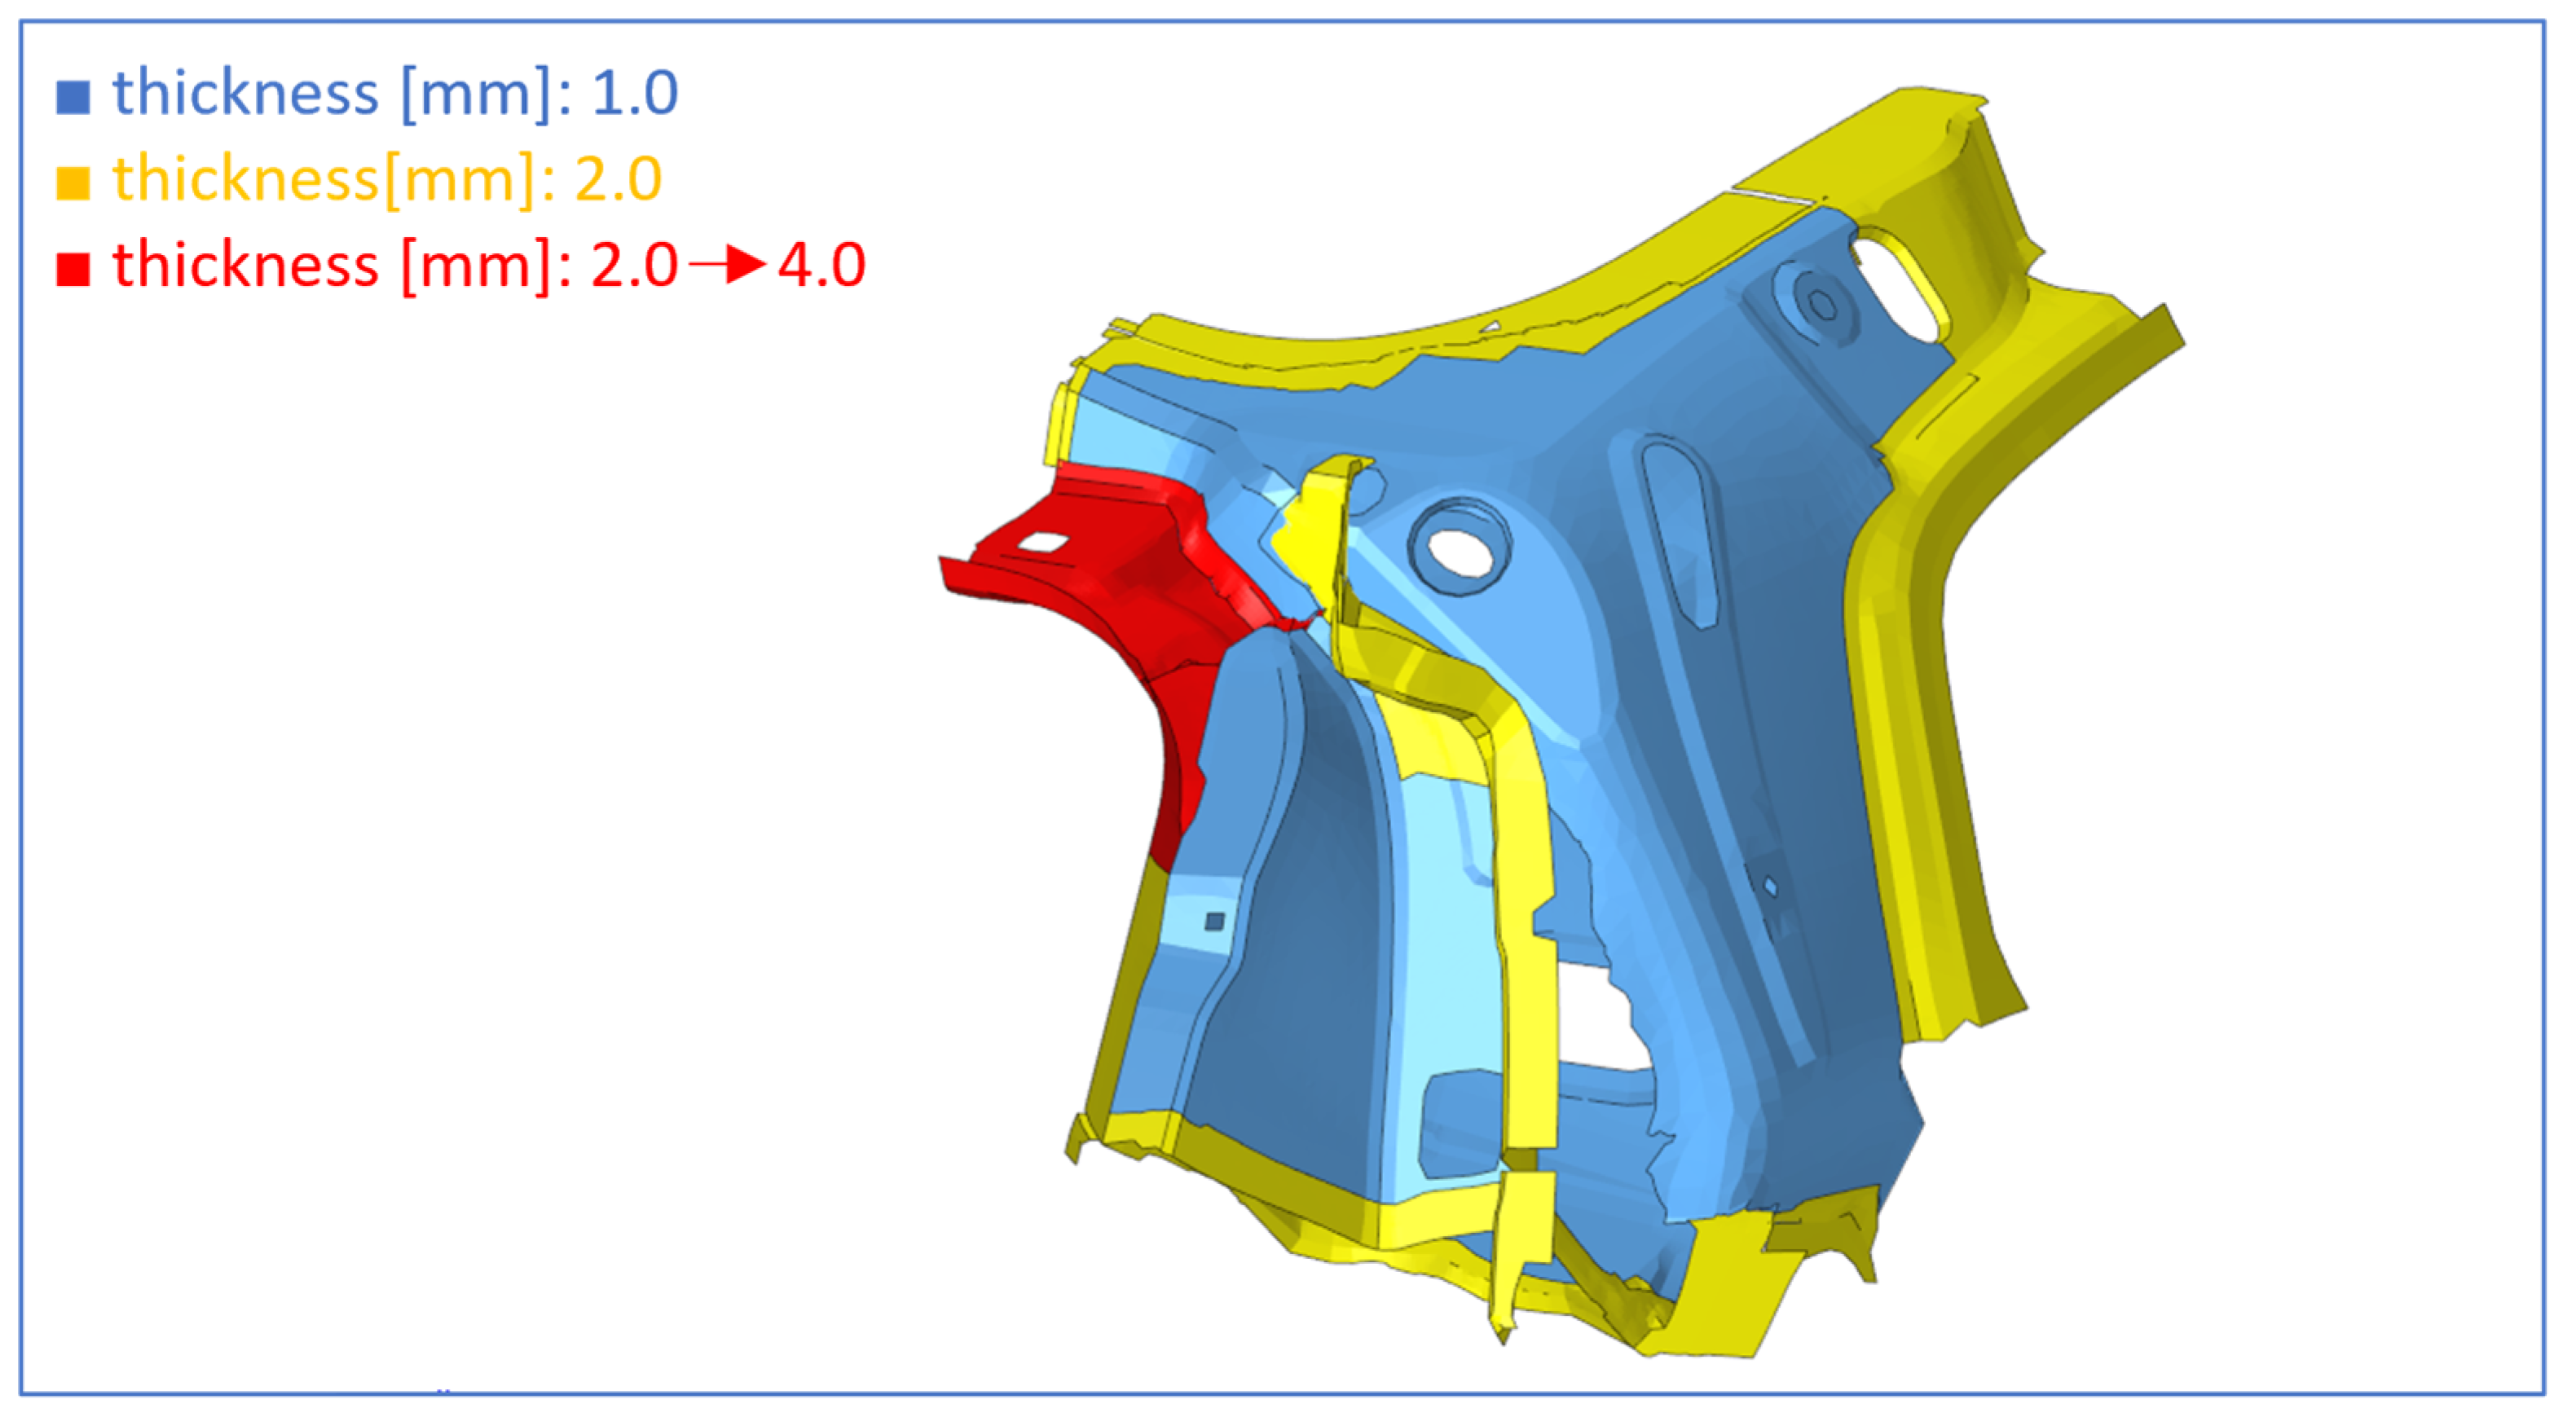
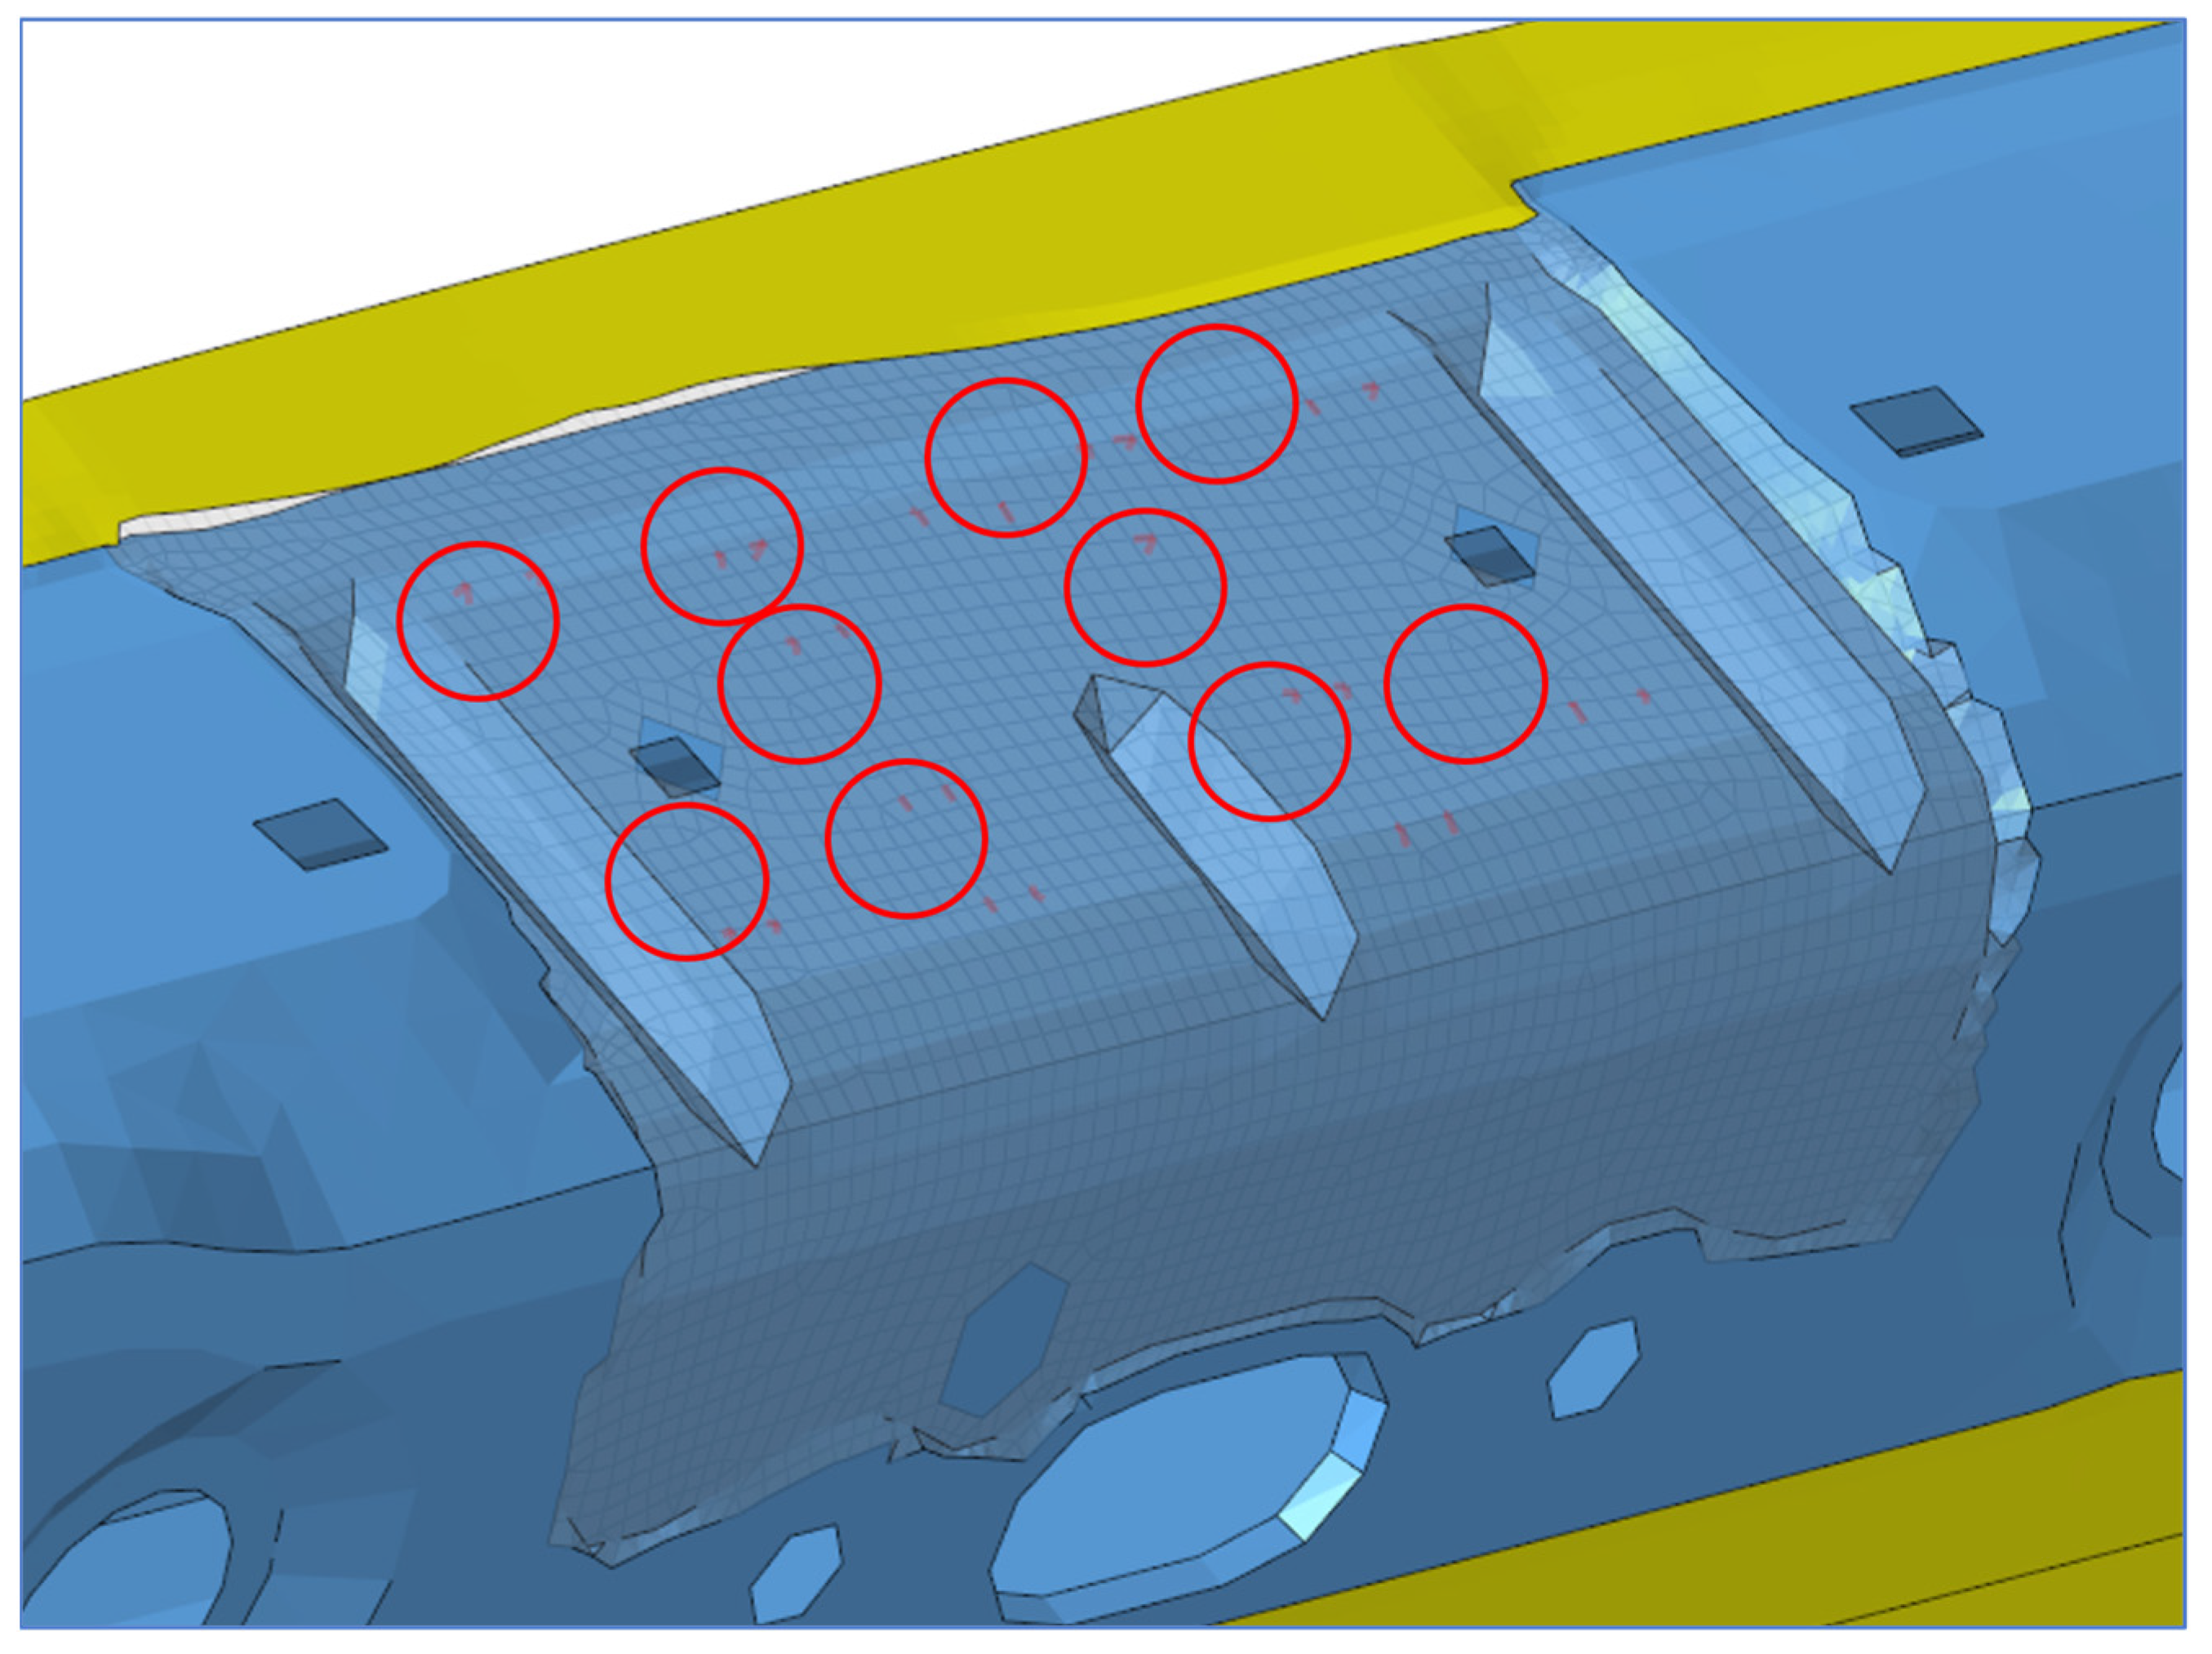
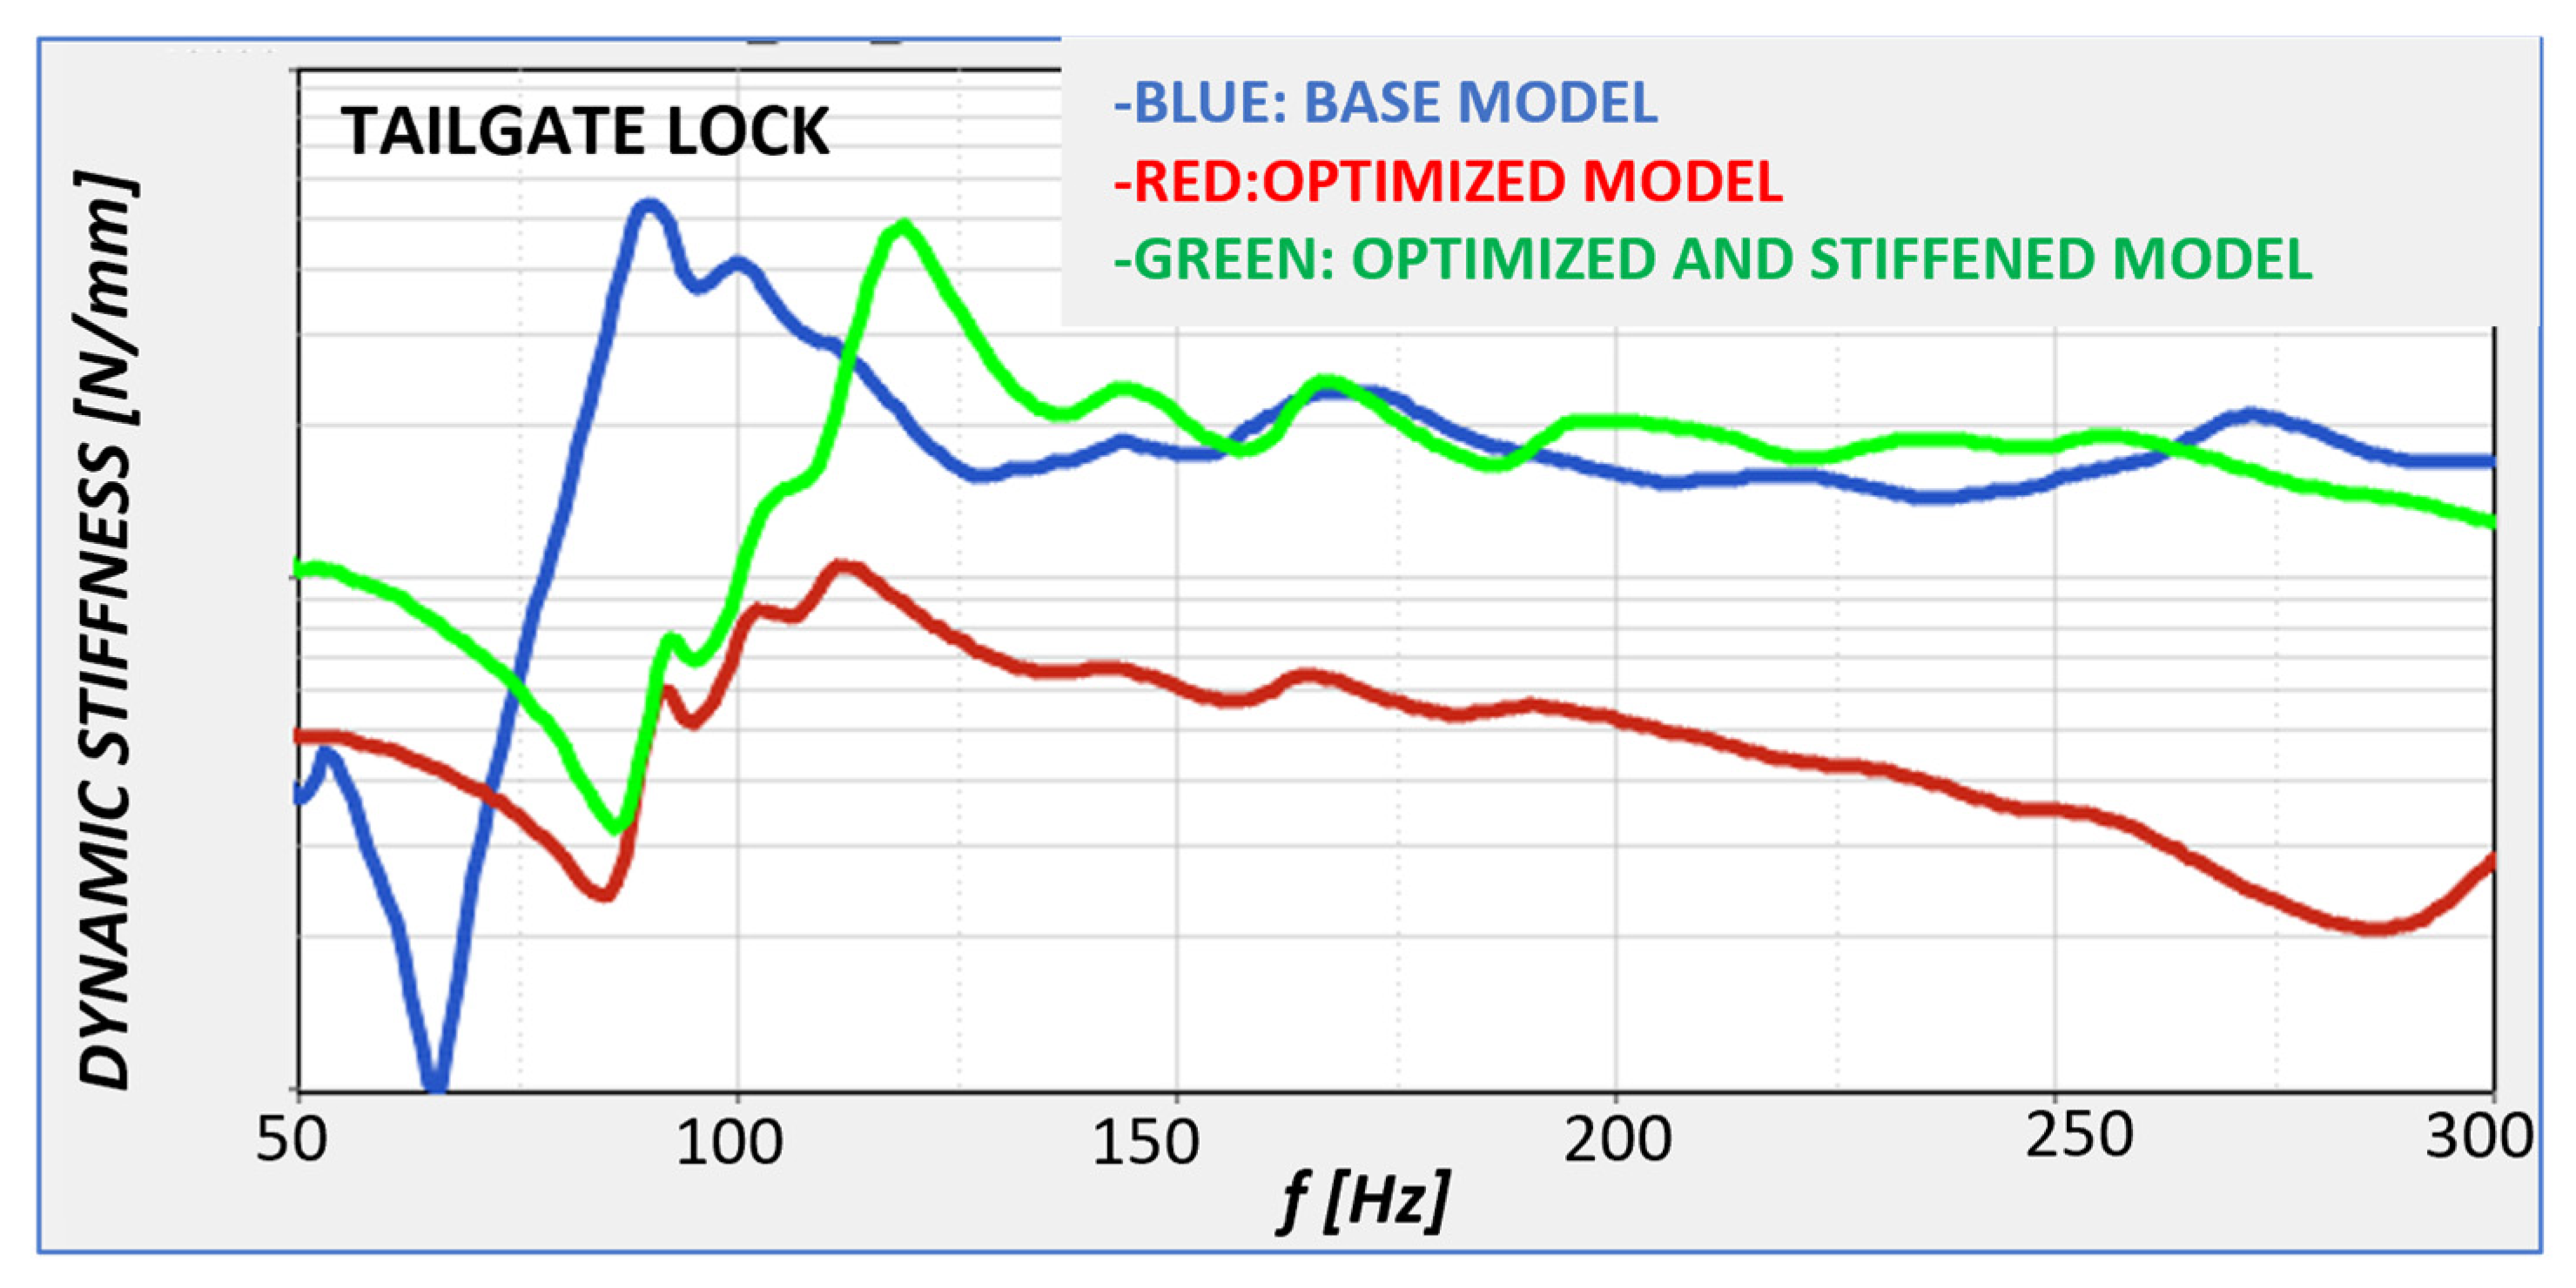
As can be seen from the values obtained, with the exception of the static stiffness of the hinge attachment, there was a general decrease in both static and dynamic stiffness. A 50% decrease in the static stiffness was recorded for the tailgate lock with respect to the original model (Figure 23b). The dynamic stiffness of the tailgate lock for the optimized model was, at all frequencies, lower than the dynamic stiffness of the original model (Figure 23c). In order to recover the original stiffness, some modifications were made to the model: the thickness in the critical areas was increased from 2 mm to 4 mm, as shown in Figure 24 and Figure 25 (highlighted in red, the areas undergoing such modifications). Moreover, some modifications were made to reinforce the lock attachment, which was even more critical than the hinge attachment area: further connections, highlighted by red circles (Figure 26), were added between the internal and external parts.
With such aforementioned modifications, after re-running the analysis, new values of static and dynamic stiffness were obtained as shown in Table 2 and Table 3, and Figure 27 and Figure 28.
These last modifications allow us to cope with the imposed constraints, in terms of static and dynamic stiffnesses. From Table 2 and Table 3, it was possible to understand that the new static stiffness for tailgate hinge and tailgate lock increased by nearly 46% and 25%, respectively. From a dynamic point of view, the stiffness of tailgate lock and hinge can be considered fully recovered (Figure 27 and Figure 28). Moreover, the changes introduced do not alter the frequency of the global torsional mode with a weight saving equal to 17% (slightly lower than the 19% reduction found in the previous optimized version).

6. Acoustic Analysis: Modeling and Results

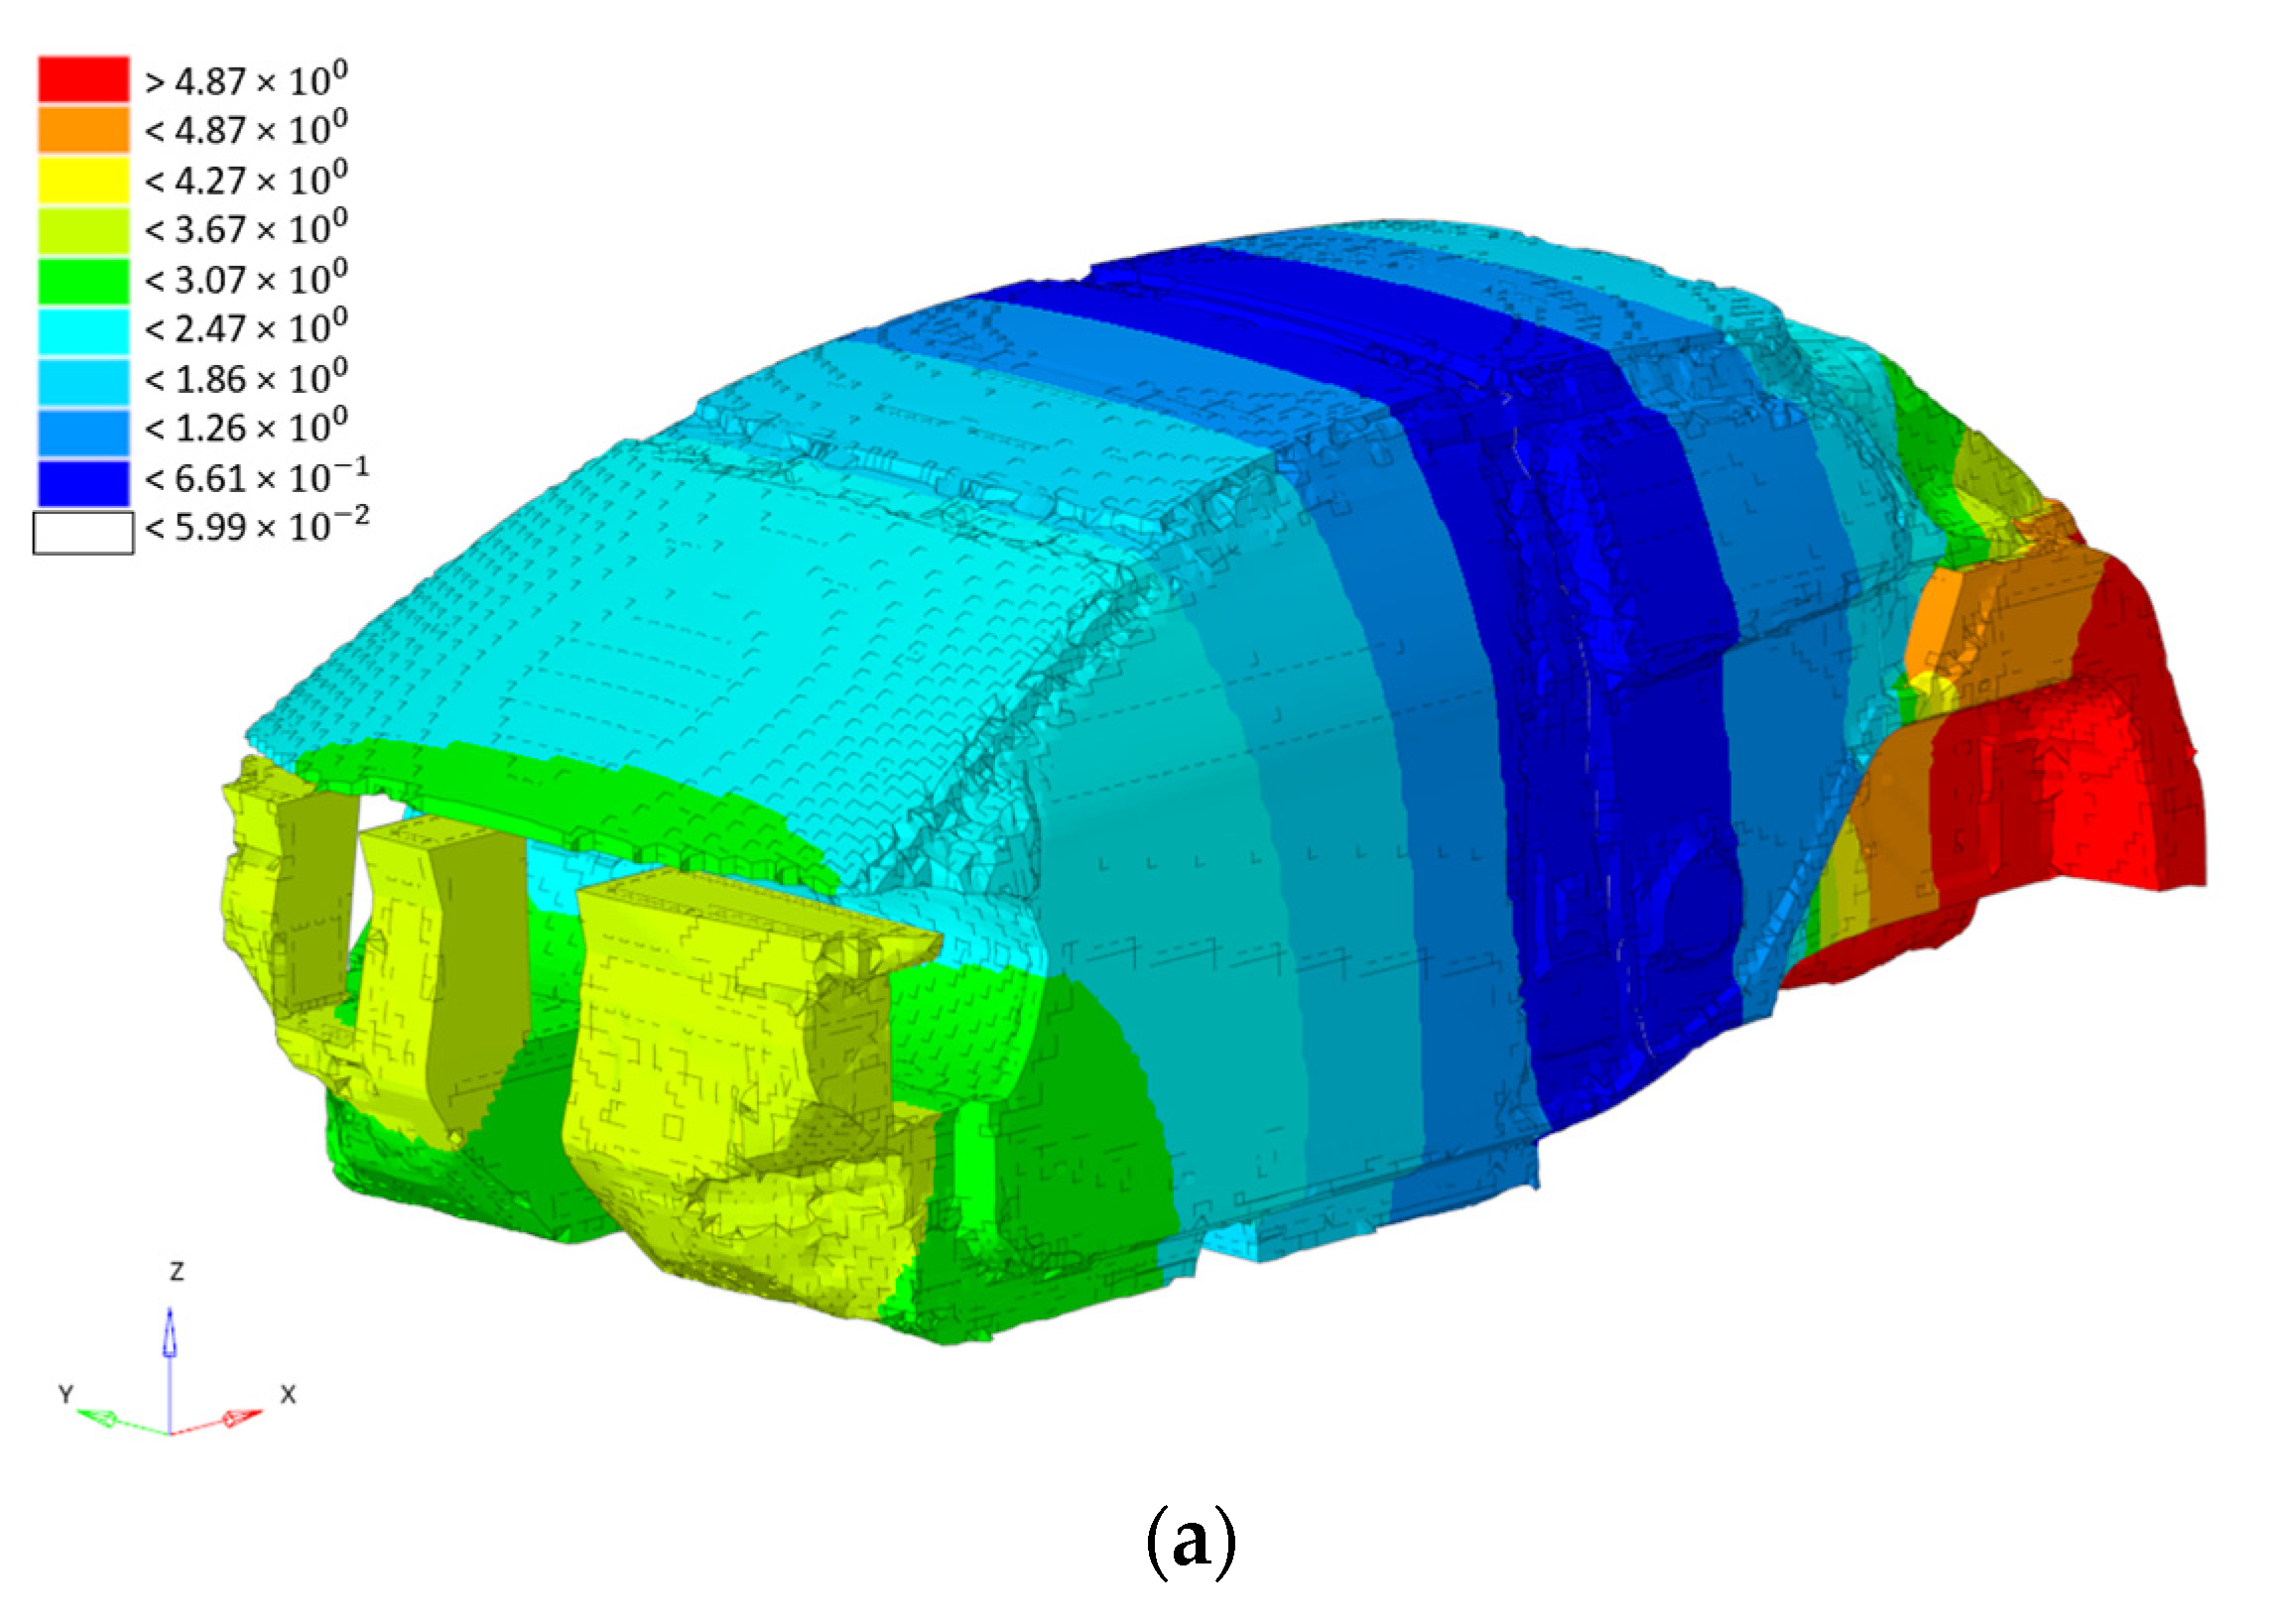
To assess the effectiveness of the proposed design changes, it was also necessary to perform an acoustic analysis on the optimized TB model. The analysis was only carried out on the TB model since it better reproduces the real driving conditions. The acoustic cavity (Figure 29) was modeled with 3D FEM elements (of linear interpolation order).
Three sub-cavities were modeled: cockpit, seats, and boot, connected to each other to generate the overall acoustic cavity. The seat cavity was modeled as a “heavy fluid” to allow for the seat absorbing properties.
The fluid mesh was defined following the rule of using eight linear elements per wavelength.

6.1. Acoustic Modal Analysis

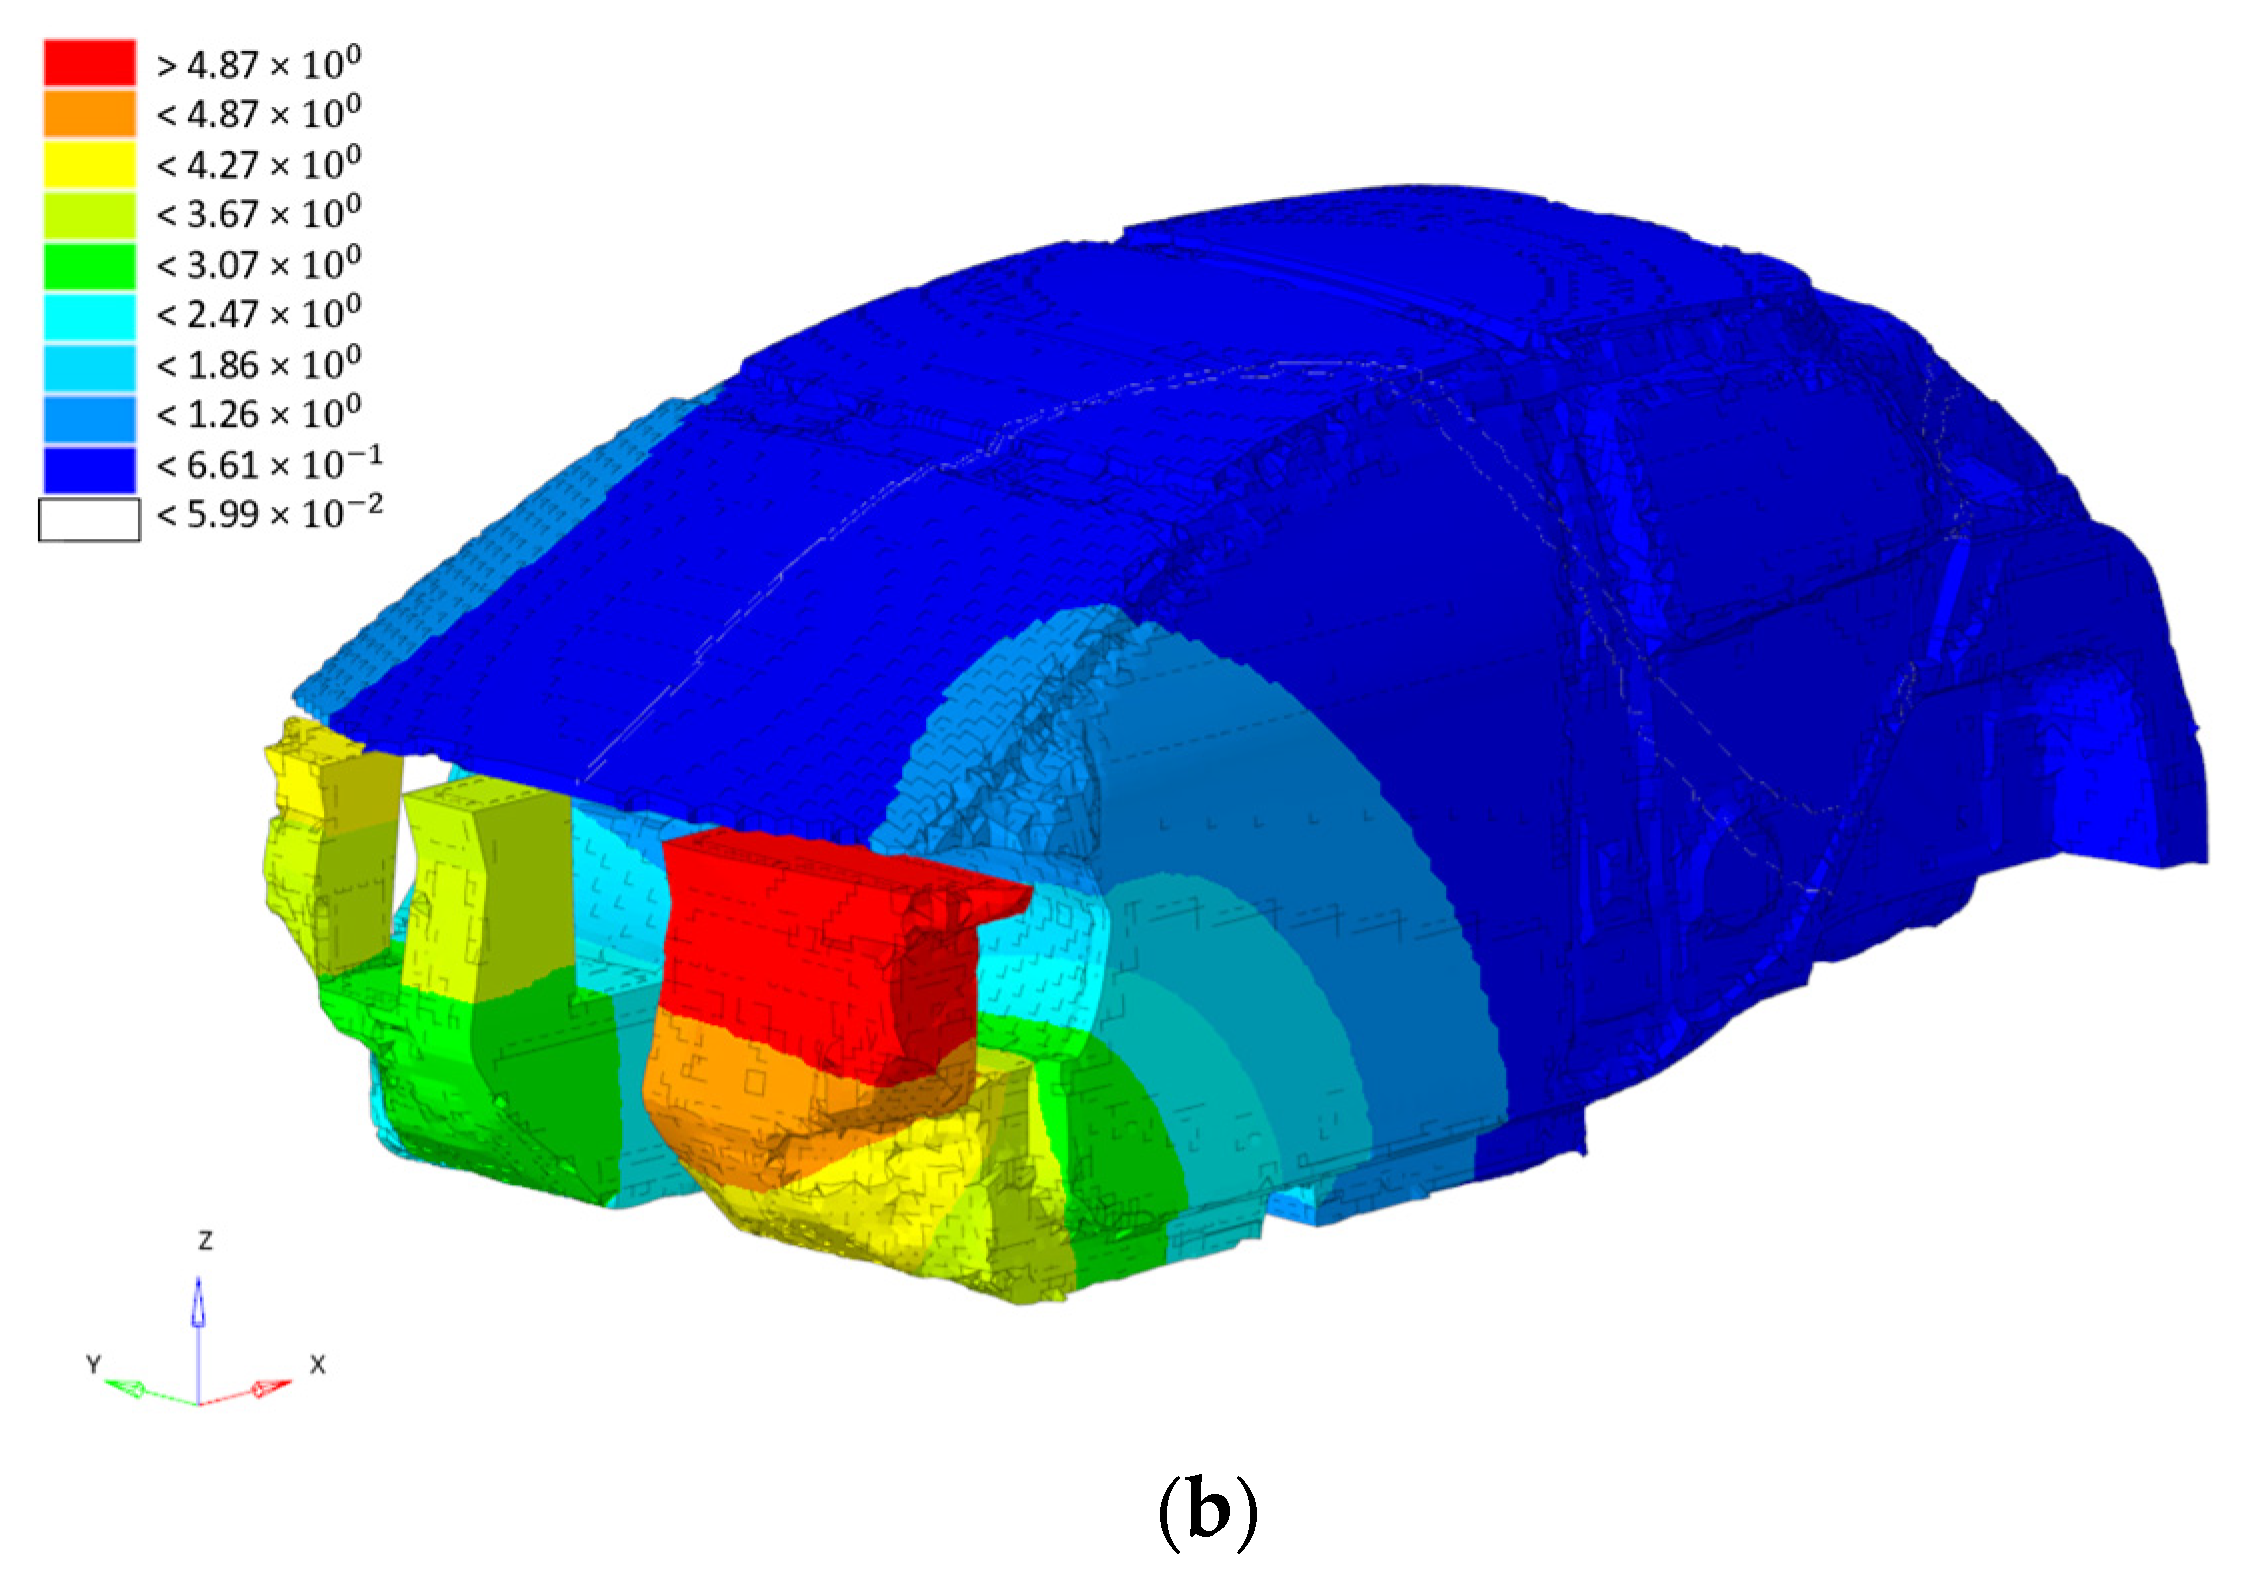
As a first step, a cavity modal analysis, in the range [0–800 Hz], was performed in a free–free condition: the first two modes are shown in Figure 30.

6.2. Vibro-Acoustic Transfer Functions

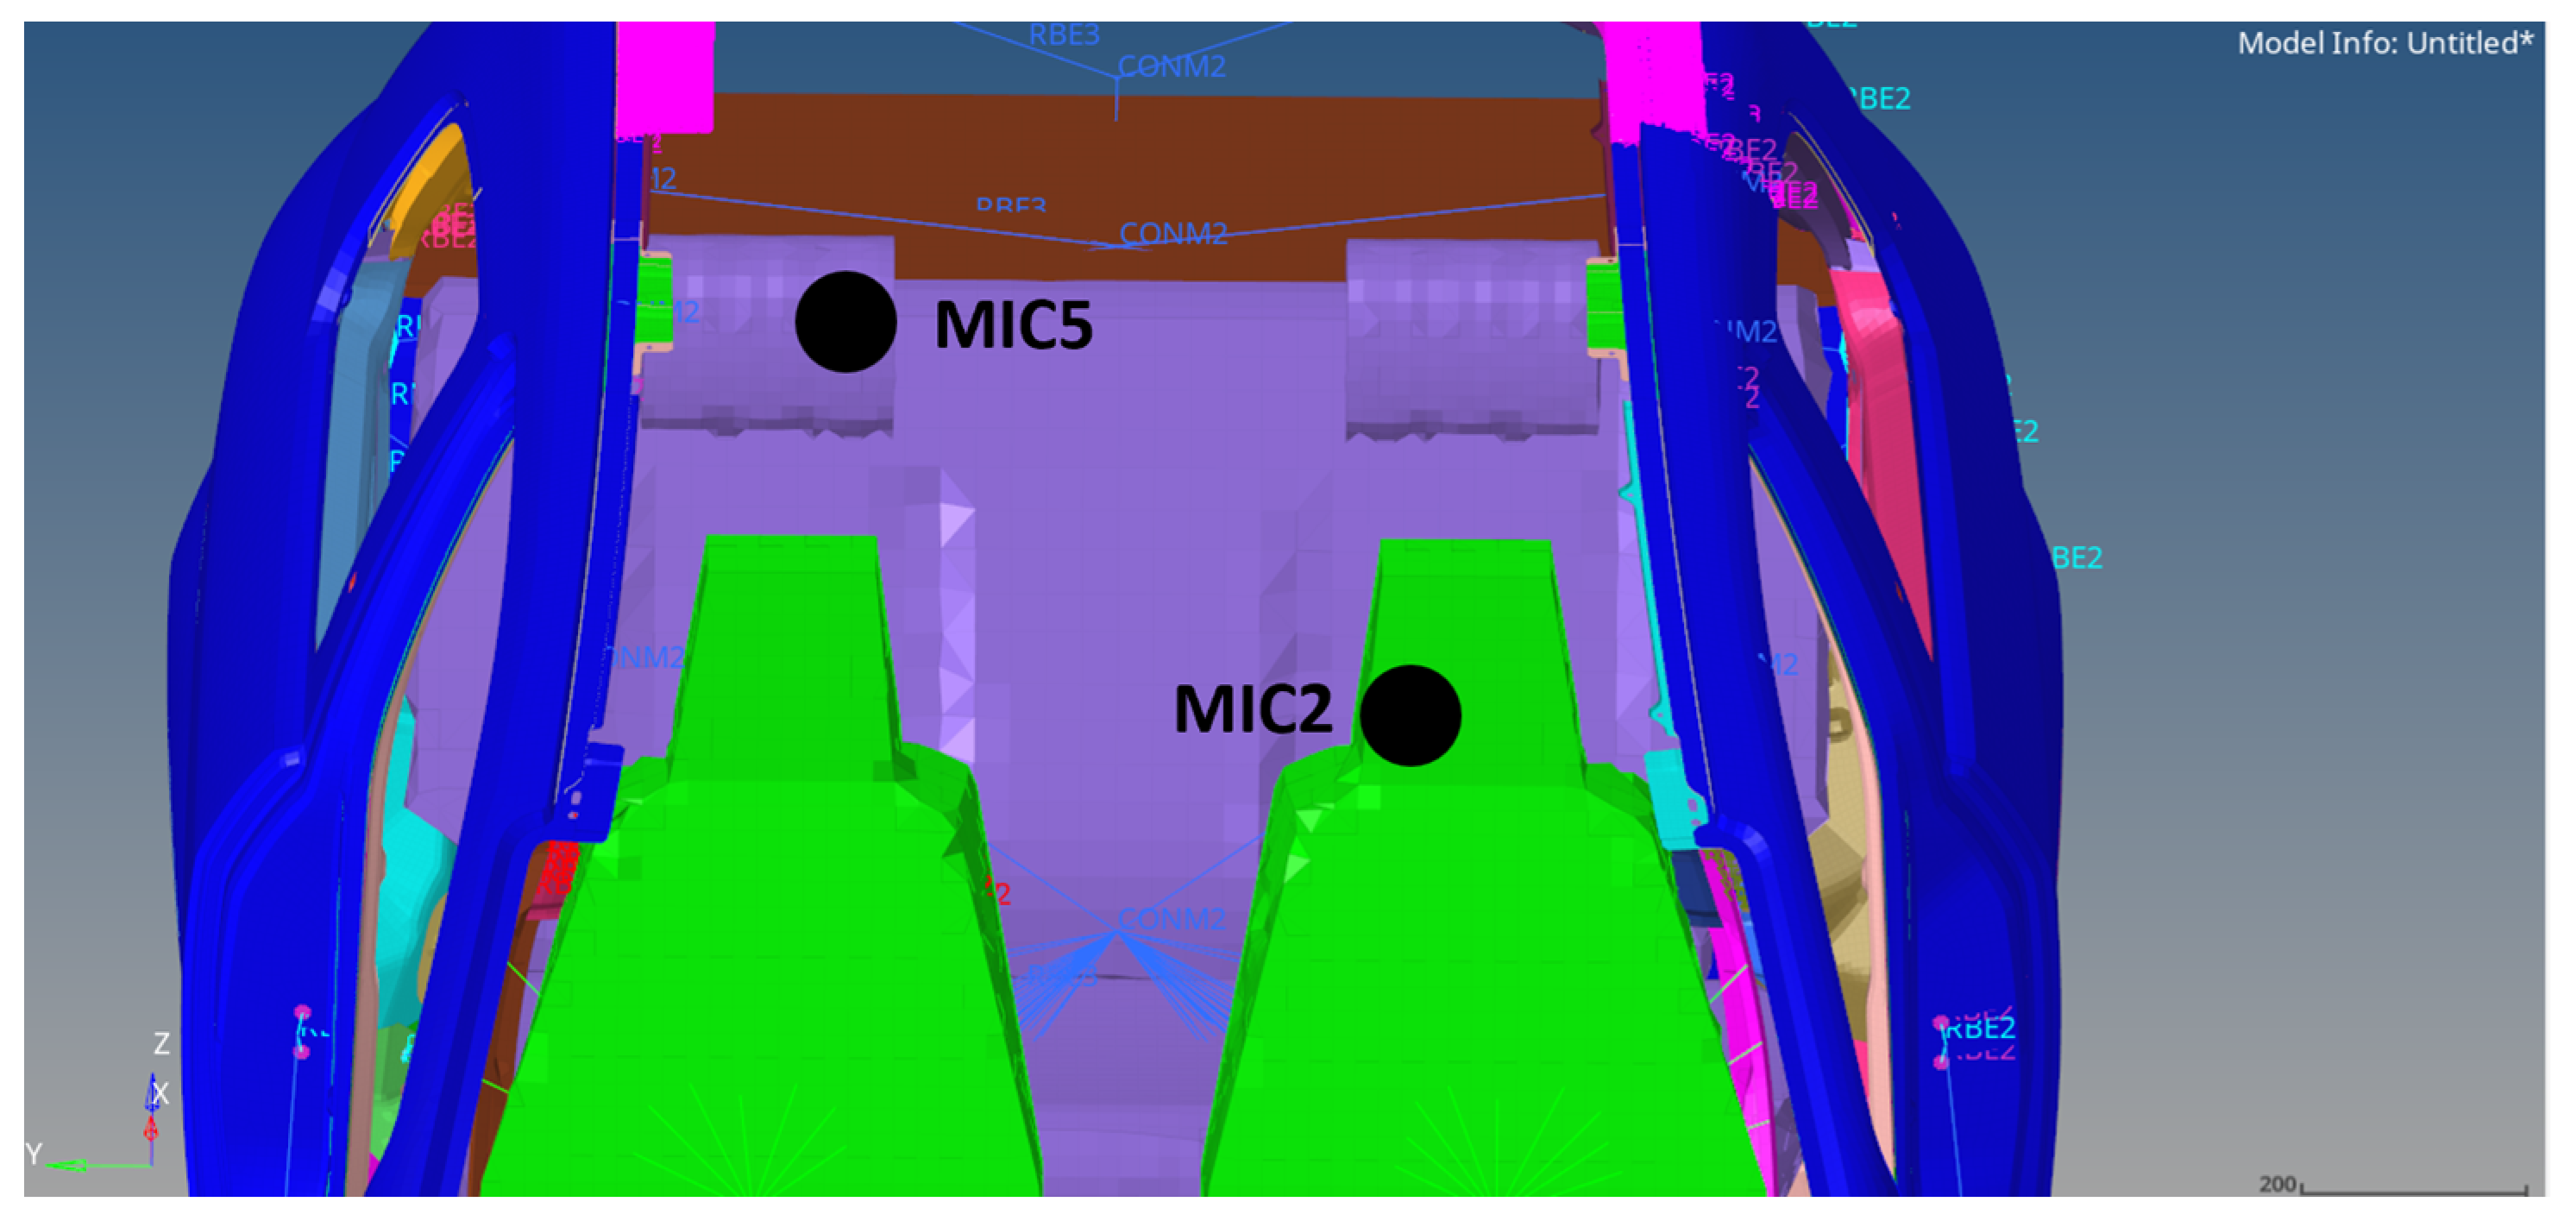
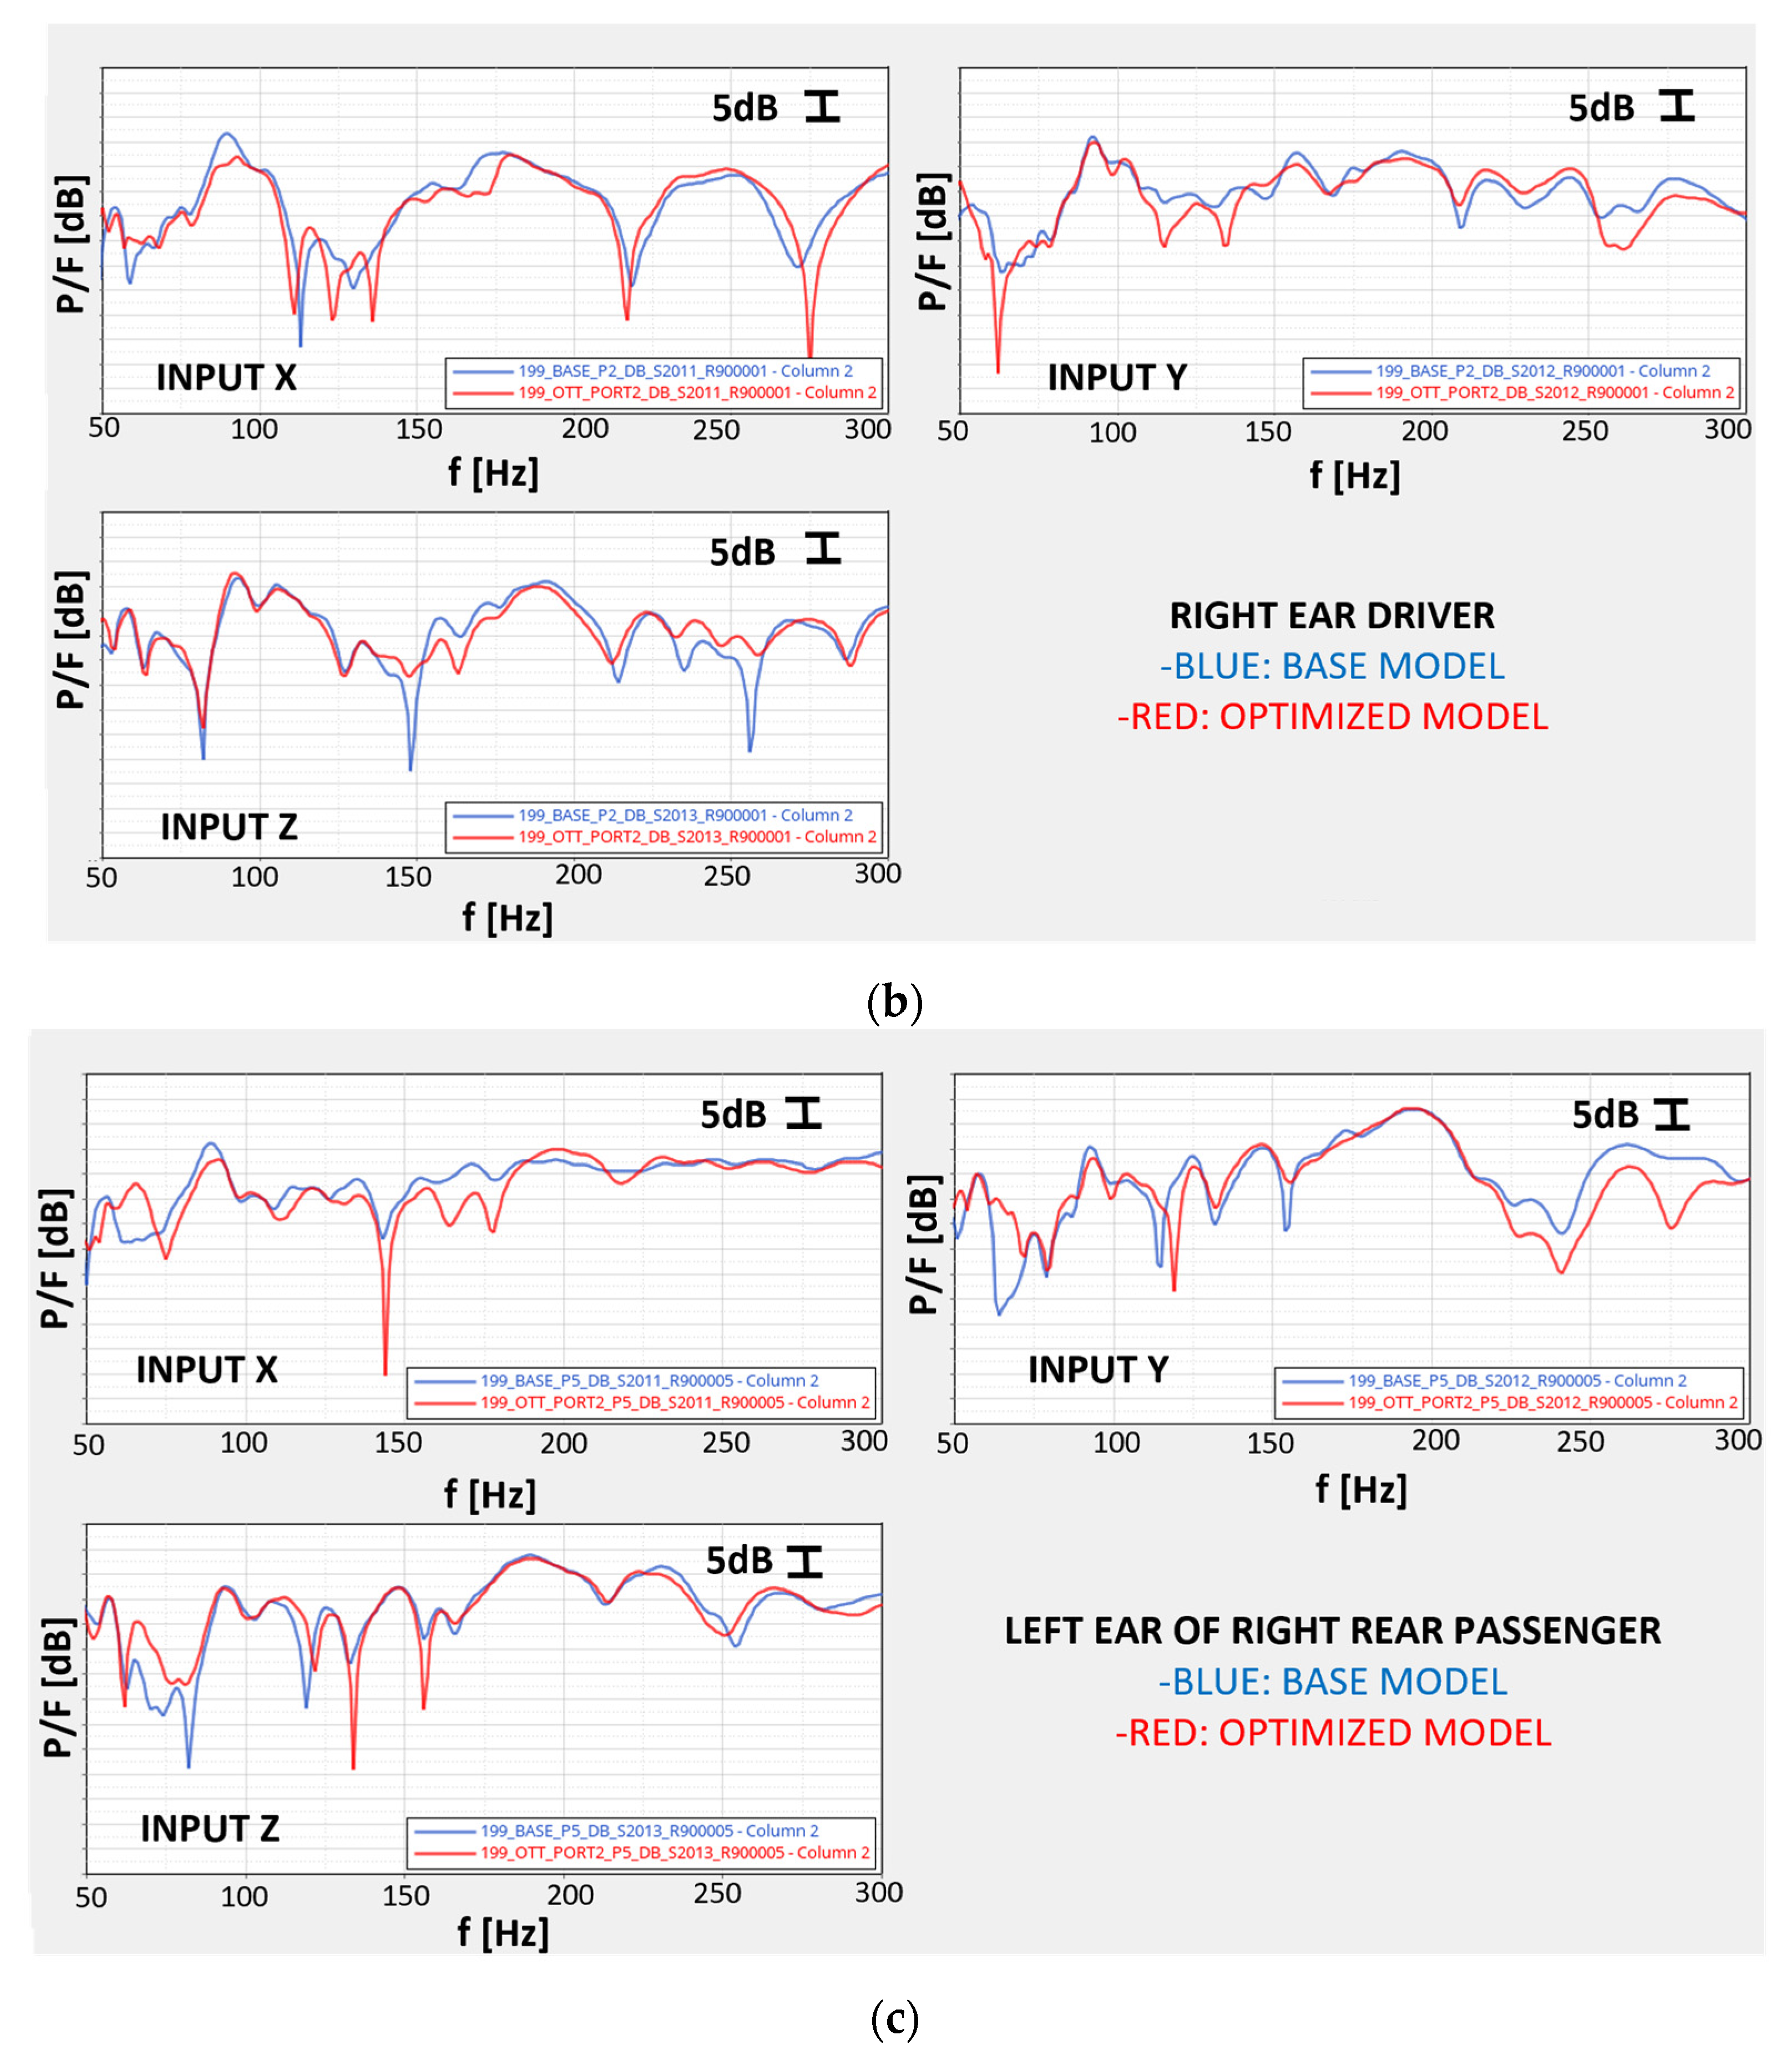
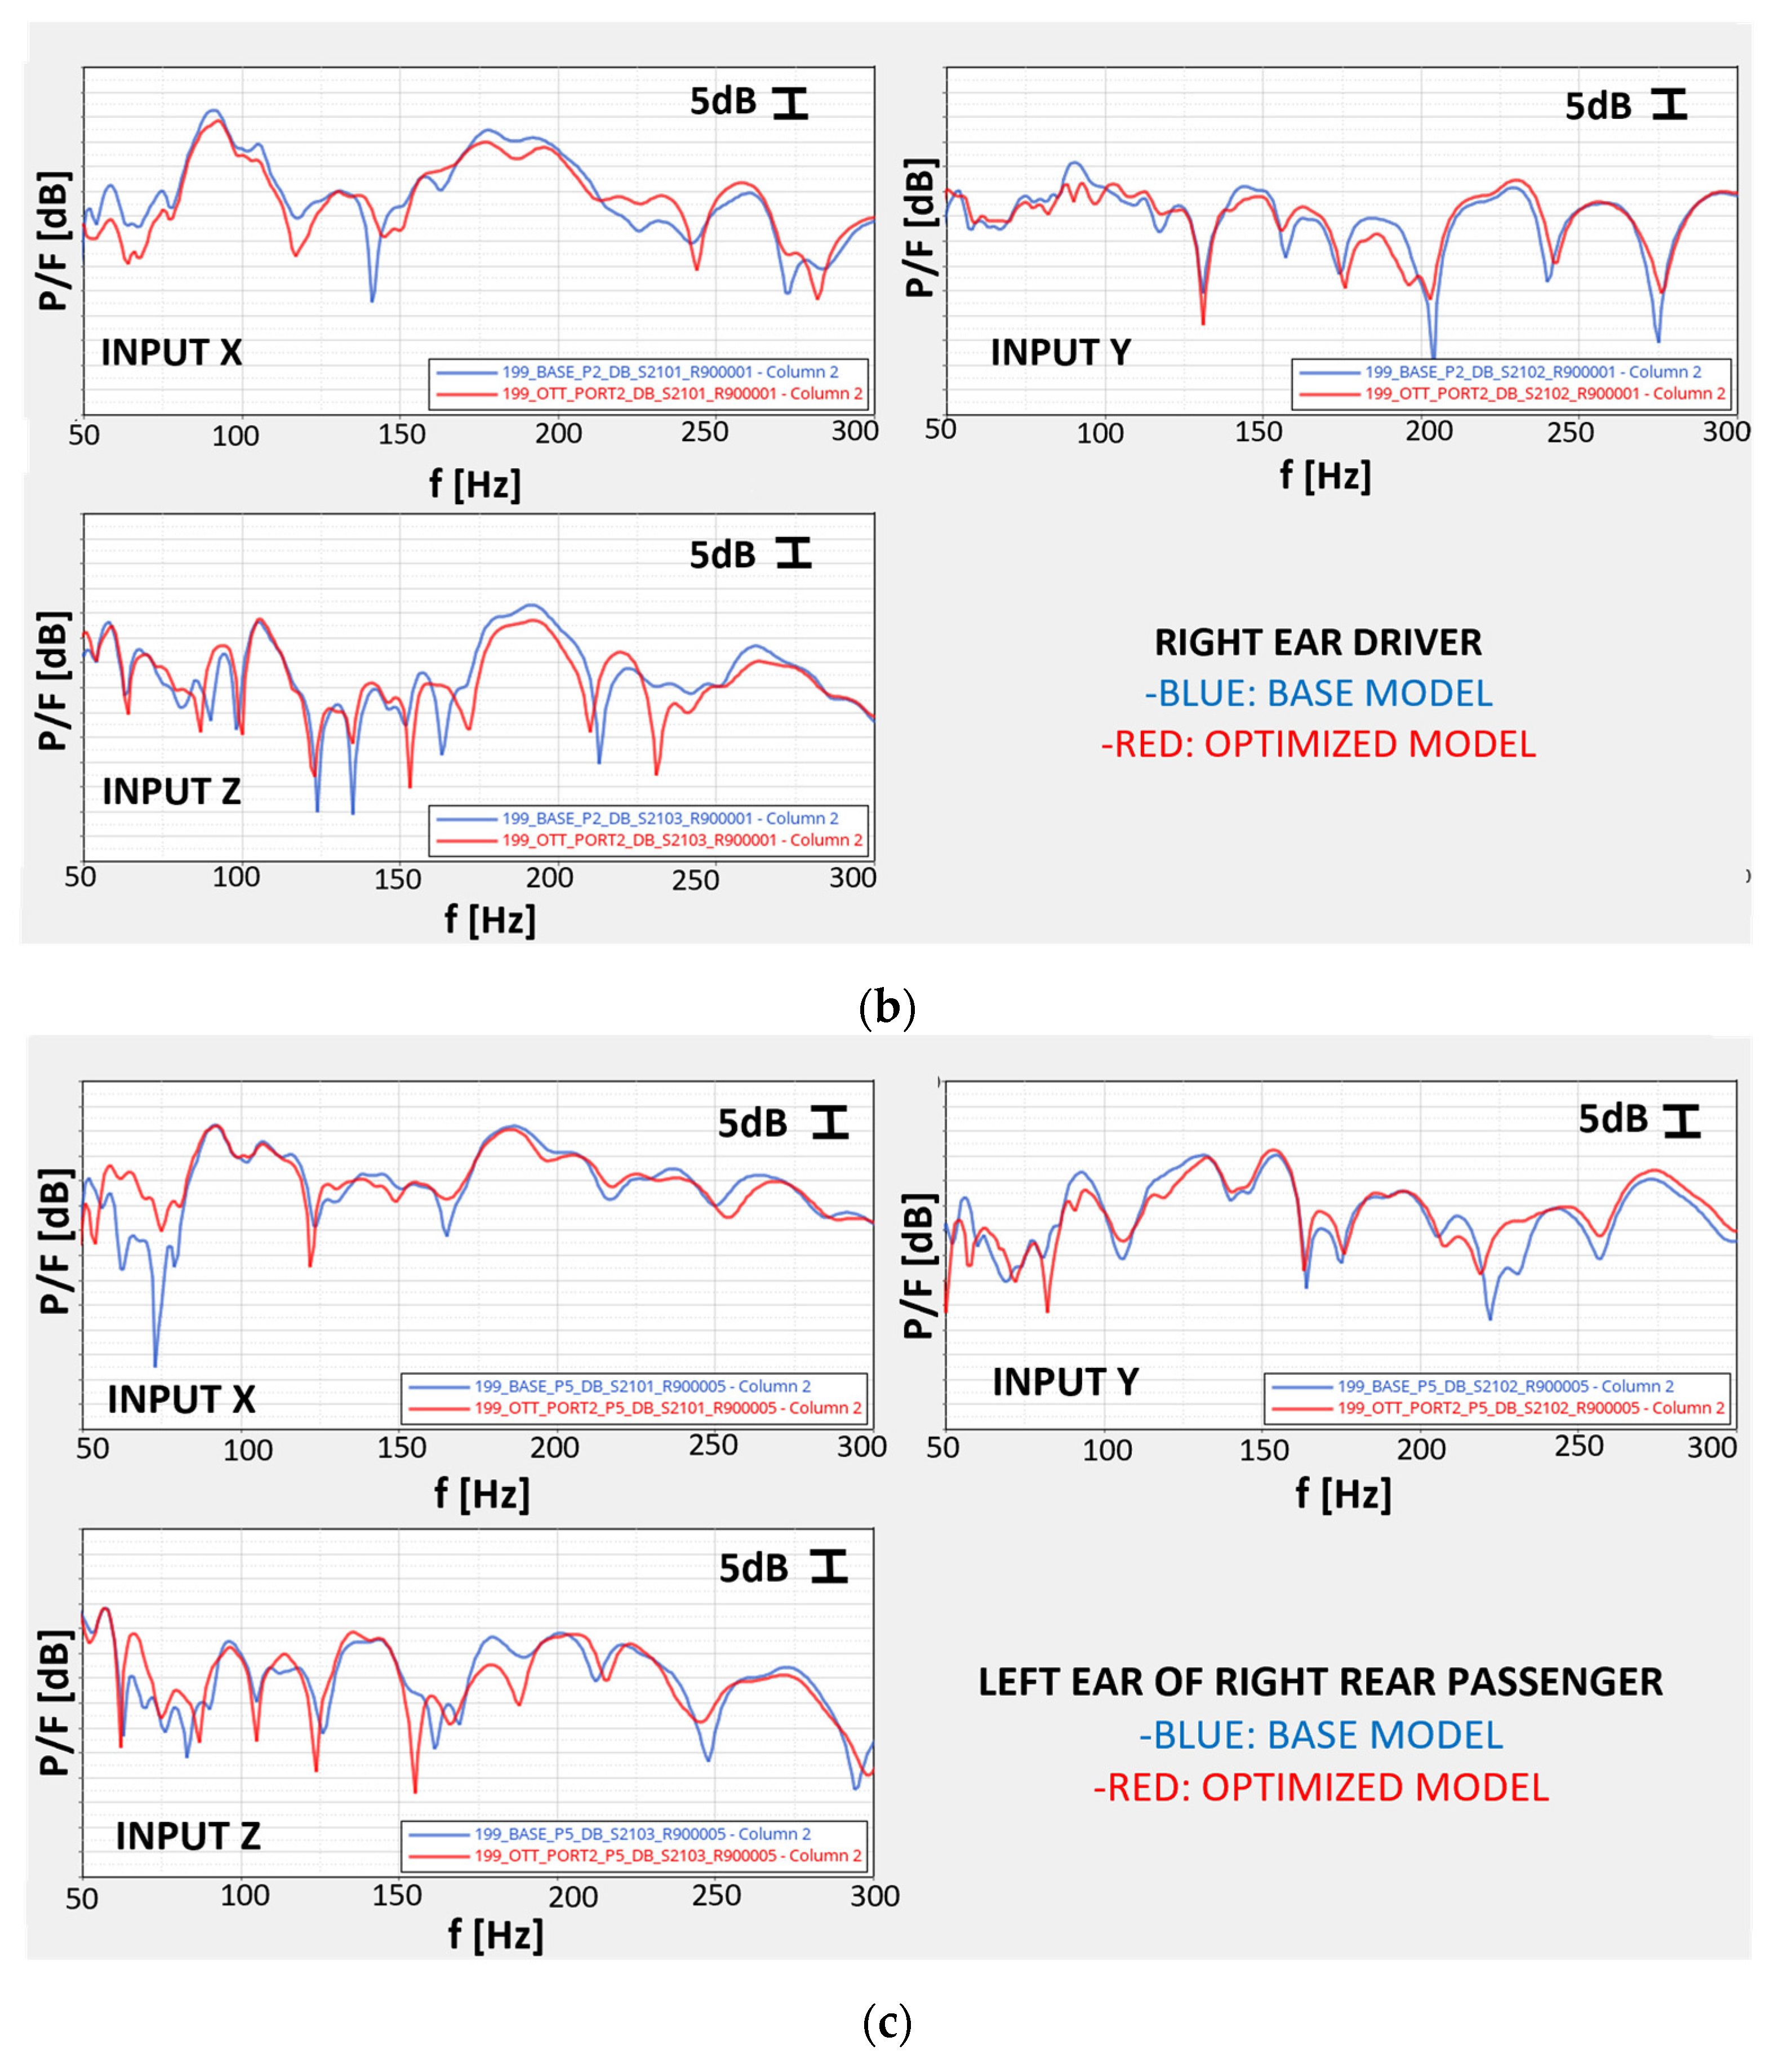
The vibro-acoustic transfer functions were defined as the ratio of acoustic pressure level (at hearing point) to imposed force (at excitation point). The vibrational input was introduced at the engine suspension points and suspension attachment points, whereas the sound pressure level was calculated at the driver’s and passenger’s ears (Figure 31). The excitation force was unitary at all frequencies and applied in all x, y, z directions. As an example, the transfer functions for two excitations points are shown in Figure 32 and Figure 33.
The new optimized rear part configuration allows to obtain improved vibro-acoustic transfer functions, in correspondence of all excitations and of all virtual microphones, with respect to the original model (steel rear ring).

6.3. Road Noise

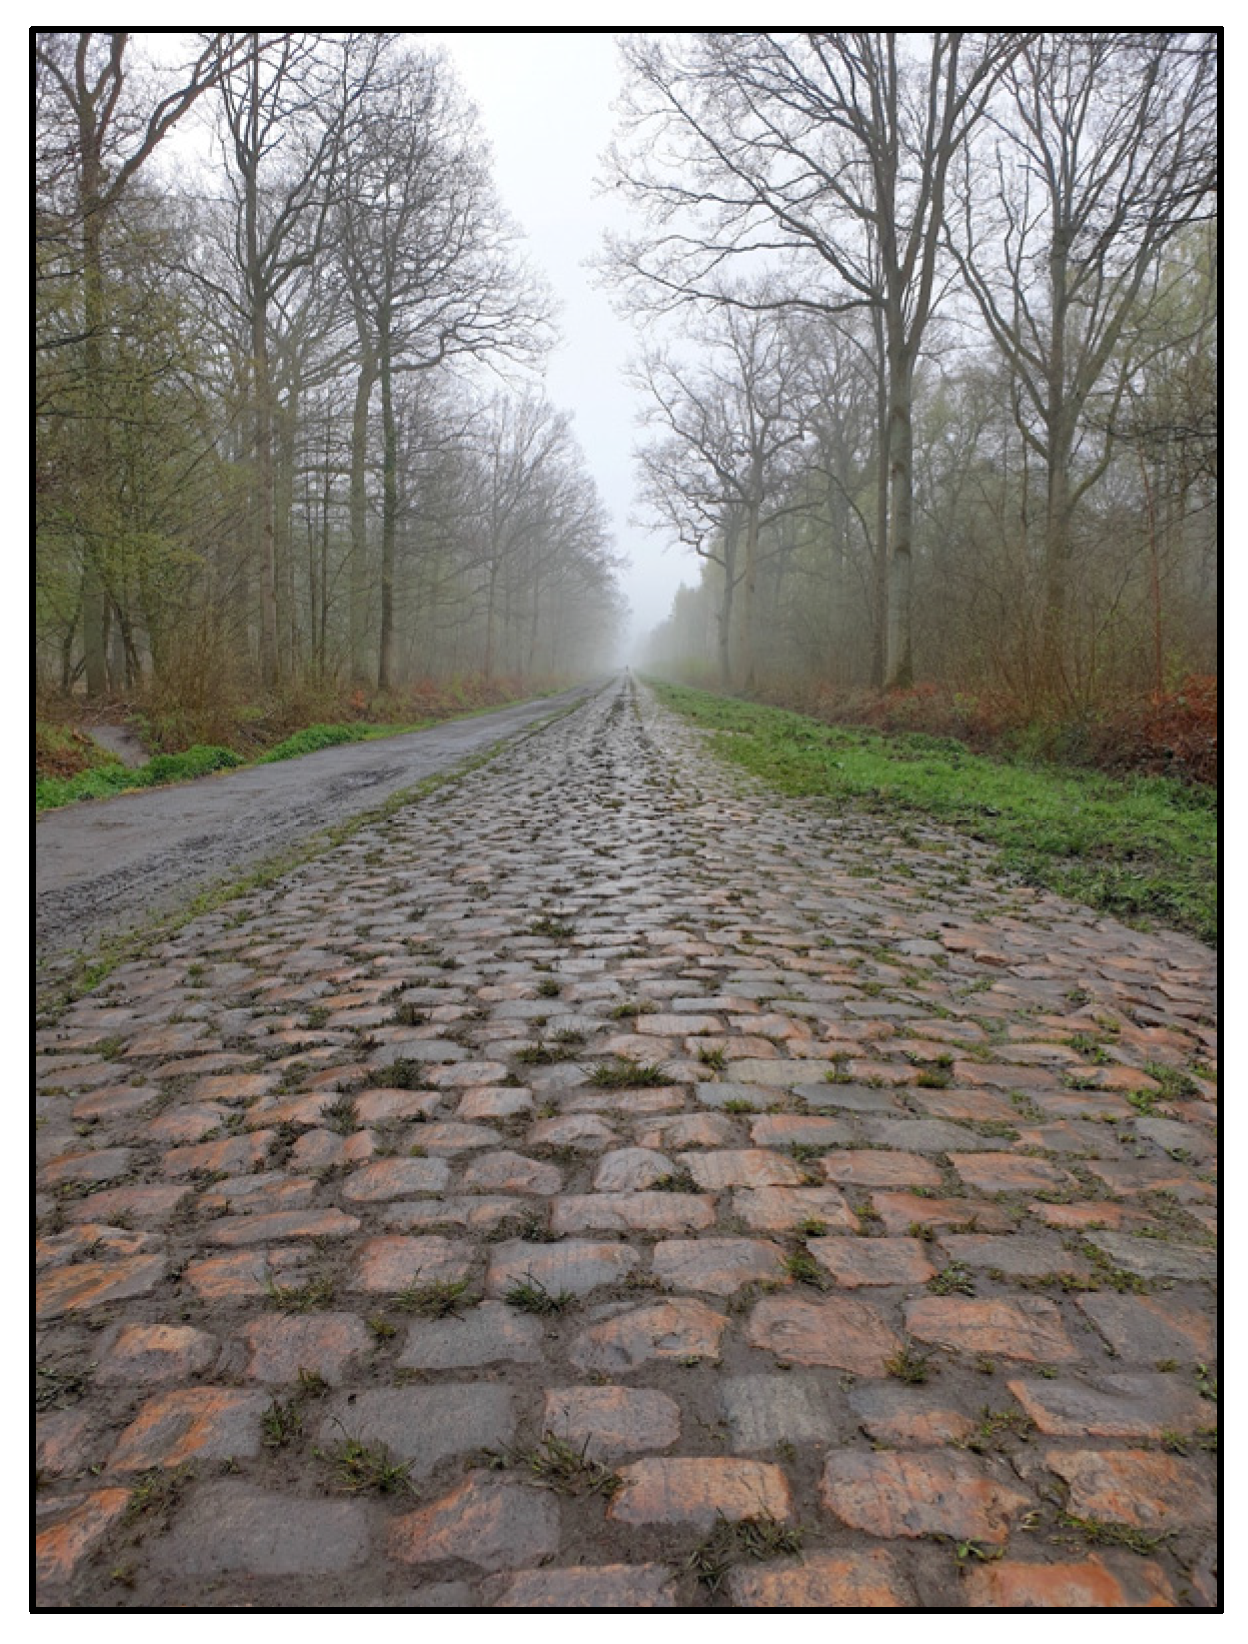
The last step, in order to validate the acoustic analysis and assess the real road noise, was to apply at the suspension points a realistic force spectrum, as provided by experimental measurements on a track mission (Pavè at 50 km/h, Figure 34):
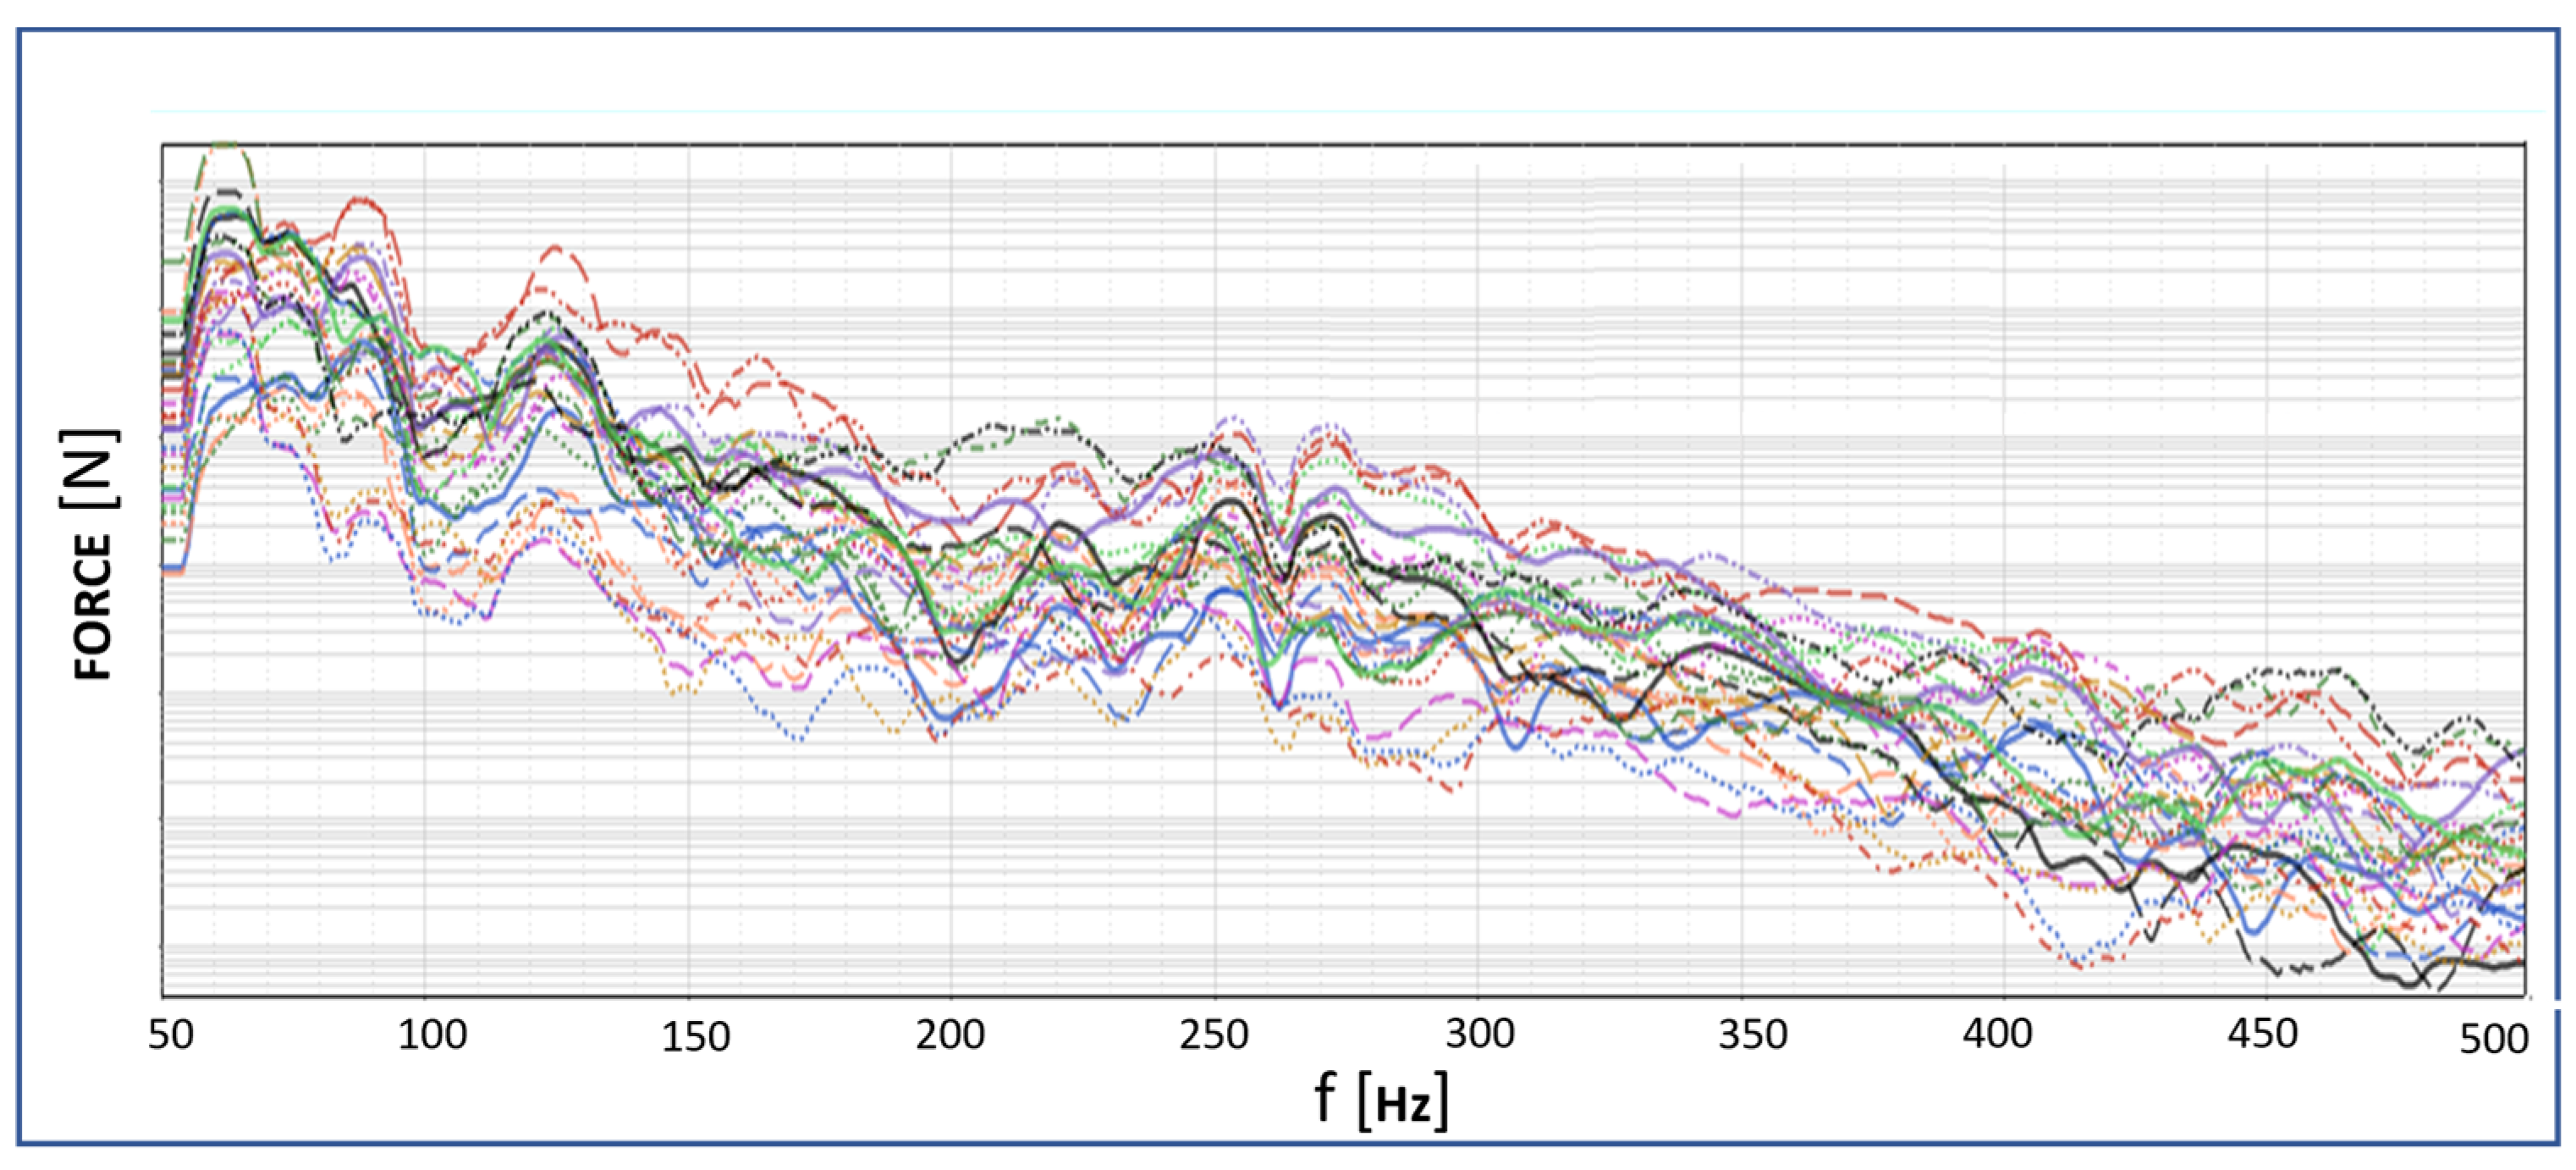
The recorded accelerations at the wheels can be used as an input a multibody suspension system analysis (Figure 35) to calculate the corresponding forces at the suspension points (Figure 36).
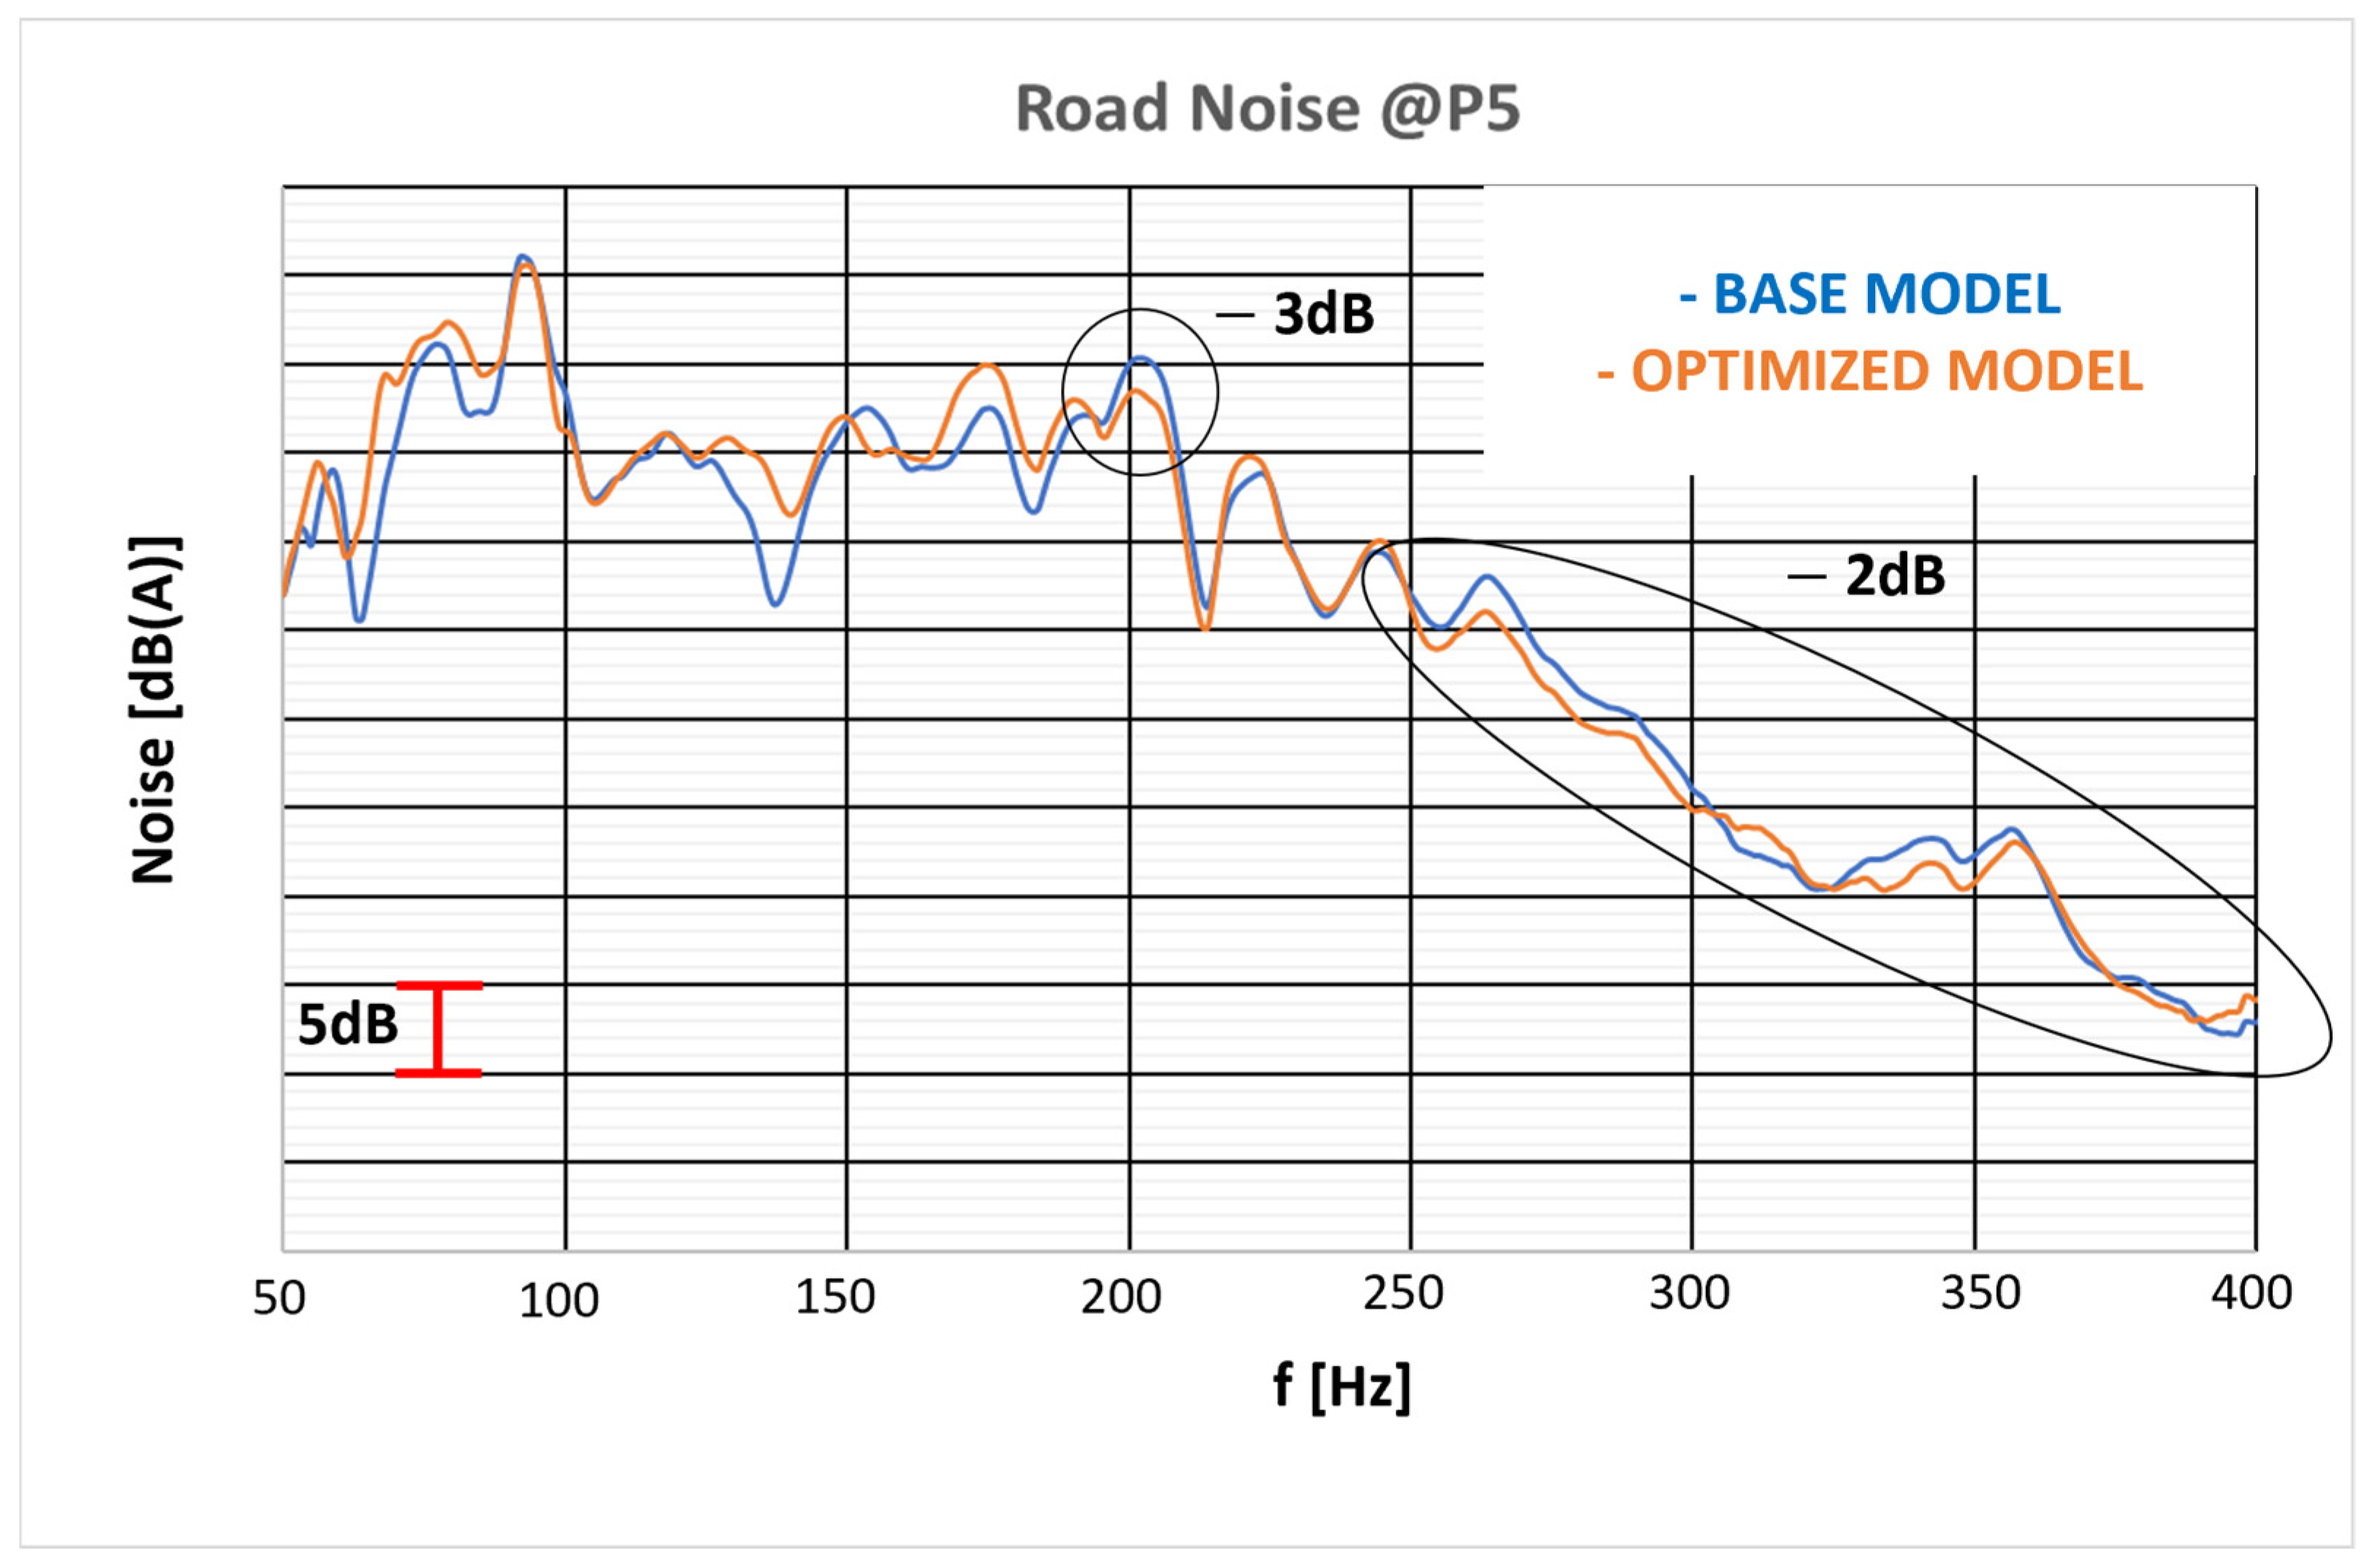
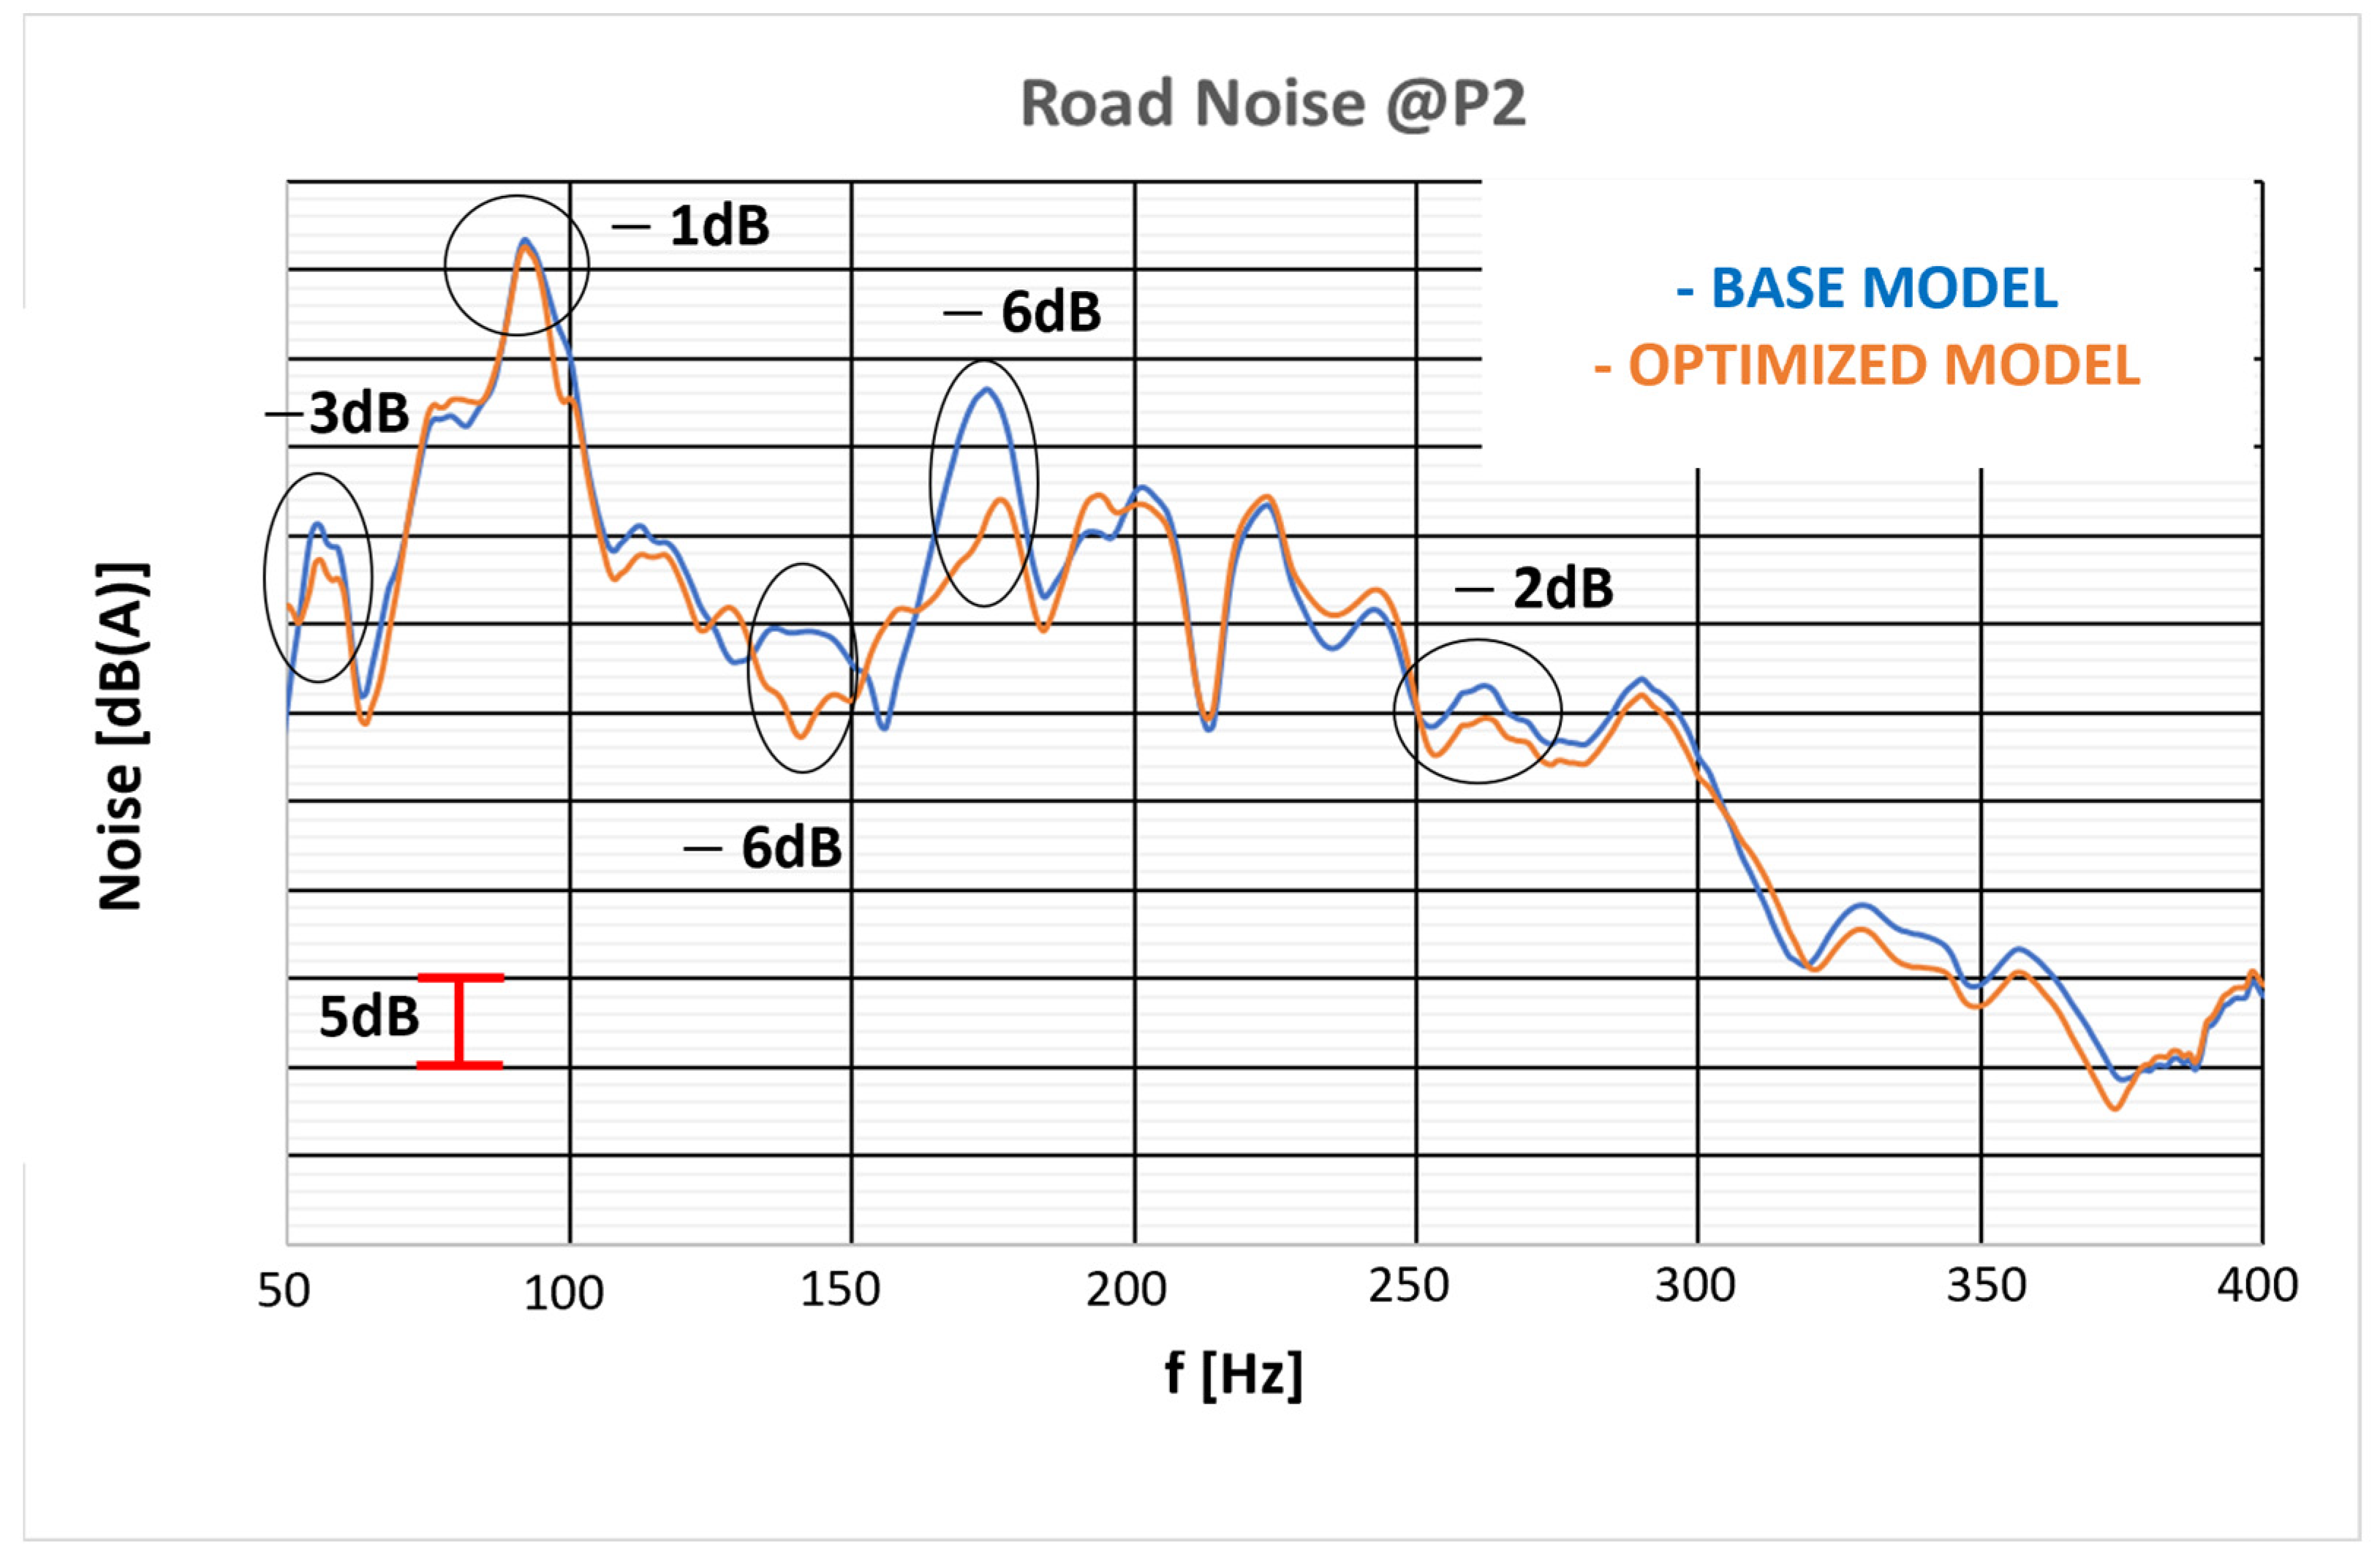
The previously obtained vibro-acoustic transfer functions, in combination with the actual force spectrum at the suspension attachment points, allow us to calculate the effective Road Noise. Road Noise was also weighted with an A-weighting scale, which considered the varying sensitivity of the human ear to certain frequency ranges. The A-weighting scale refers to the 40phon isophonic curve. The noise perceived inside the passenger compartment turned out to be lower for the optimized model than base (original) model (Figure 37 and Figure 38).
Both virtual microphones MIC2 (Figure 37) and MIC5 (Figure 38) recorded a general decrease in the sound pressure level, with respect to the original configuration, up to 6dB for some frequency ranges. This was considered an optimum result.

7. Conclusions

The goal of improved perceived comfort inside the passenger compartment by a topological optimization of the rear ring was fulfilled with the presented procedure. In particular, with reference to the BIW model, an increase in the first torsional mode frequency of nearly 14% was obtained. Such a kind of improvement when referred to the TB model was reported with absolute values, resulting in a 2 Hz increase in comparison to the original TB configuration. At the same time, a 17% reduction in rear part weight was achieved. Improvements in the cabin noise perceived, particularly in the driver’s right ear, were also obtained.
The original rear part consisted of several components that had to be welded together by sheet metal molding, whereas the new one, being completely 3D printed, requires no welding, and the connections with the rest of the structure can be made by gluing and bolting. The reduction in welding points brings a benefit not only in terms of manufacturing time, but also in terms of reduced CO2 emissions. The construction of the new rear ring would not encounter obstacles since the dimensions of the individual components are compatible with the capabilities of existing printers, and the final geometry was the result of a careful refinement of the optimizer output (cleaning up all those elements that cannot be manufactured because of the lack of structural continuity in the overall frame).
The optimization method proposed was of general validity, thus it can be applied to any car (with special focus on sport and premium cars) and to any component/subassembly of complex geometry to be added in critical areas for stiffening purposes.
The industrialization process, to produce the new optimized car, changes completely thanks to an easier assembly phase (less additional septa needed to stiffen the sections of car parts, with no need for complex bonding and welding processes).
Future developments could point towards an optimization of a complete car body in order to achieve even greater benefits, both in terms of weight and in terms of vibro-acoustic comfort.

Author Contributions

Conceptualization, R.C., L.C., G.D. and E.A.; Methodology, R.C., L.C. and F.R.; Software, T.L., M.R. and F.R.; Validation, T.L. and F.R.; Formal analysis, T.L., L.C. and F.R.; Investigation, T.L., L.C., M.R. and F.R.; Resources, E.A.; Data curation, L.C. and F.R.; Writing—original draft, R.C. and T.L.; Writing—review & editing, R.C. and L.C.; Visualization, E.A.; Supervision, R.C., L.C., G.D. and E.A.; Project administration, G.D. All authors have read and agreed to the published version of the manuscript.

Funding

This research received no external funding.

Institutional Review Board Statement

Not applicable.

Informed Consent Statement

Not applicable.

Data Availability Statement

Further data is unavailable due to non-disclosure agreement restrictions.

Conflicts of Interest

The authors declared no potential conflict of interest with respect to the research, authorship, and/or publication of this article.

References

  1. Shahrubudin, N.; Lee, T.; Ramlan, R. An Overview in 3D Printing Technology: Technological, Materials and Applications. Procedia Manuf. 2019, 35, 1286–1296. [Google Scholar] [CrossRef]
  2. Sarvankar, S.G.; Yewale, S.N. Additive Manufacturing in Automobile Industry. Int. J. Res. Aeronaut. Mech. 2019, 7, 1–10. [Google Scholar]
  3. Sun, W.; Zhou, J.; Gong, D.; You, T. Analysis of modal frequency optimization of railway vehicle car body. Adv. Mech. Eng. 2016, 8, 1687814016643640. [Google Scholar] [CrossRef] [Green Version]
  4. Cascone, N.; Caivano, L.; D’Errico, G.; Citarella, R. Vibroacoustic Assessment of an Innovative Composite Material for the Roof of a Coupe Car. Appl. Sci. 2021, 11, 1128. [Google Scholar] [CrossRef]
  5. Borrelli, A.; D’Errico, G.; Borrelli, C.; Citarella, R. Assessment of Crash Performance of an Automotive Component Made through Additive Manufacturing. Appl. Sci. 2020, 10, 9106. [Google Scholar] [CrossRef]
  6. Armentani, E.; Caputo, F.; Esposito, L.; Giannella, V.; Citarella, R. Multibody Simulation for the Vibration Analysis of a Turbocharged Diesel Engine. Appl. Sci. 2018, 8, 1192. [Google Scholar] [CrossRef] [Green Version]
  7. Armentani, E.; Trapani, R.; Citarella, R.; Parente, A.; Pirelli, M. FEM-BEM Numerical Procedure for Insertion Loss Assessment of Engine Beauty Cover. Open Mech. Eng. J. 2013, 7, 27–34. [Google Scholar] [CrossRef]
  8. Barbarino, M.; Adamo, F.; Bianco, D.; Bartoccini, D. Hybrid BEM/empirical approach for scattering of correlated sources in rocket noise prediction. J. Sound Vib. 2013, 403, 90–103. [Google Scholar] [CrossRef]
  9. Barbarino, M.; Bianco, D. A BEM-FMM approach applied to the combined convected Helmholtz integral formulation for the solution of aeroacoustic problems. Comput. Methods Appl. Mech. Eng. 2018, 342, 585–603. [Google Scholar] [CrossRef]
  10. Xiong, F.; Zou, X.; Zhang, Z.; Shi, X. A systematic approach for multi-objective lightweight and stiffness optimization of a car body. Struct. Multidiscip. Optim. 2020, 62, 3229–3248. [Google Scholar] [CrossRef]
  11. Sobieszczanski-Sobieski, J.; Kodiyalam, S.; Yang, R.Y. Optimization of car body under constraints of noise, vibration and harshness (NVH), and crash. Ind. Appl. Des. Case Stud. 2001, 22, 295–306. [Google Scholar] [CrossRef]
  12. Liang, X.; Zhu, P.; Lin, Z.; Zhang, Y. Acoustic analysis of lightweight auto-body based on finite element method and boundary element method. Front. Mech. Eng. China 2007, 2, 99–103. [Google Scholar] [CrossRef]
  13. Leiva, J.P. Structural Optimization Methods and Techniques to Design Efficient Car Bodies, Vanderplaats Research and Development, Inc. 2011. Available online: http://www.peraglobal.com/upload/contents/2016/05/20160518095243_69263.pdf (accessed on 26 February 2023).
  14. Wang, L.; Basu, P.K.; Leiva, J.P. Automobile body reinforcement by finite element optimization. Finite Elem. Anal. Des. 2004, 40, 879–893. [Google Scholar] [CrossRef]
  15. Jang, G.; Choi, Y.; Choi, G. Discrete thickness optimization of an automobile body by using the continuous-variable-based method. J. Mech. Sci. Technol. 2008, 22, 41–49. [Google Scholar]
  16. Yahaya Rashid, A.S.; Ramli, R.; Mohamed Haris, S.; Alias, A. Improving the Dynamic Characteristics of Body-in-White Structure Using Structural Optimization. Sci. World J. 2014, 2014, 190214. [Google Scholar] [CrossRef] [PubMed] [Green Version]
  17. Parrish, A.; Rais-Rohani, M.; Najafi, A. Crashworthiness optimisation of vehicle structures with magnesium alloy parts. Int. J. Crashworthiness 2012, 17, 259–281. [Google Scholar] [CrossRef]
  18. Altair Hypermesh Version 13.0 User’s Guide. Available online: https://2019.help.altair.com/2019/hyperworks/pdfs/hm/HyperMesh_2019_UserGuide.pdf (accessed on 10 July 2022).
  19. MSC Nastran 2012 Getting Started User’s Guide. Available online: https://simcompanion.hexagon.com/customers/s/article/getting-started-with-msc-nastran-user-s-guide-doc9176 (accessed on 10 July 2022).
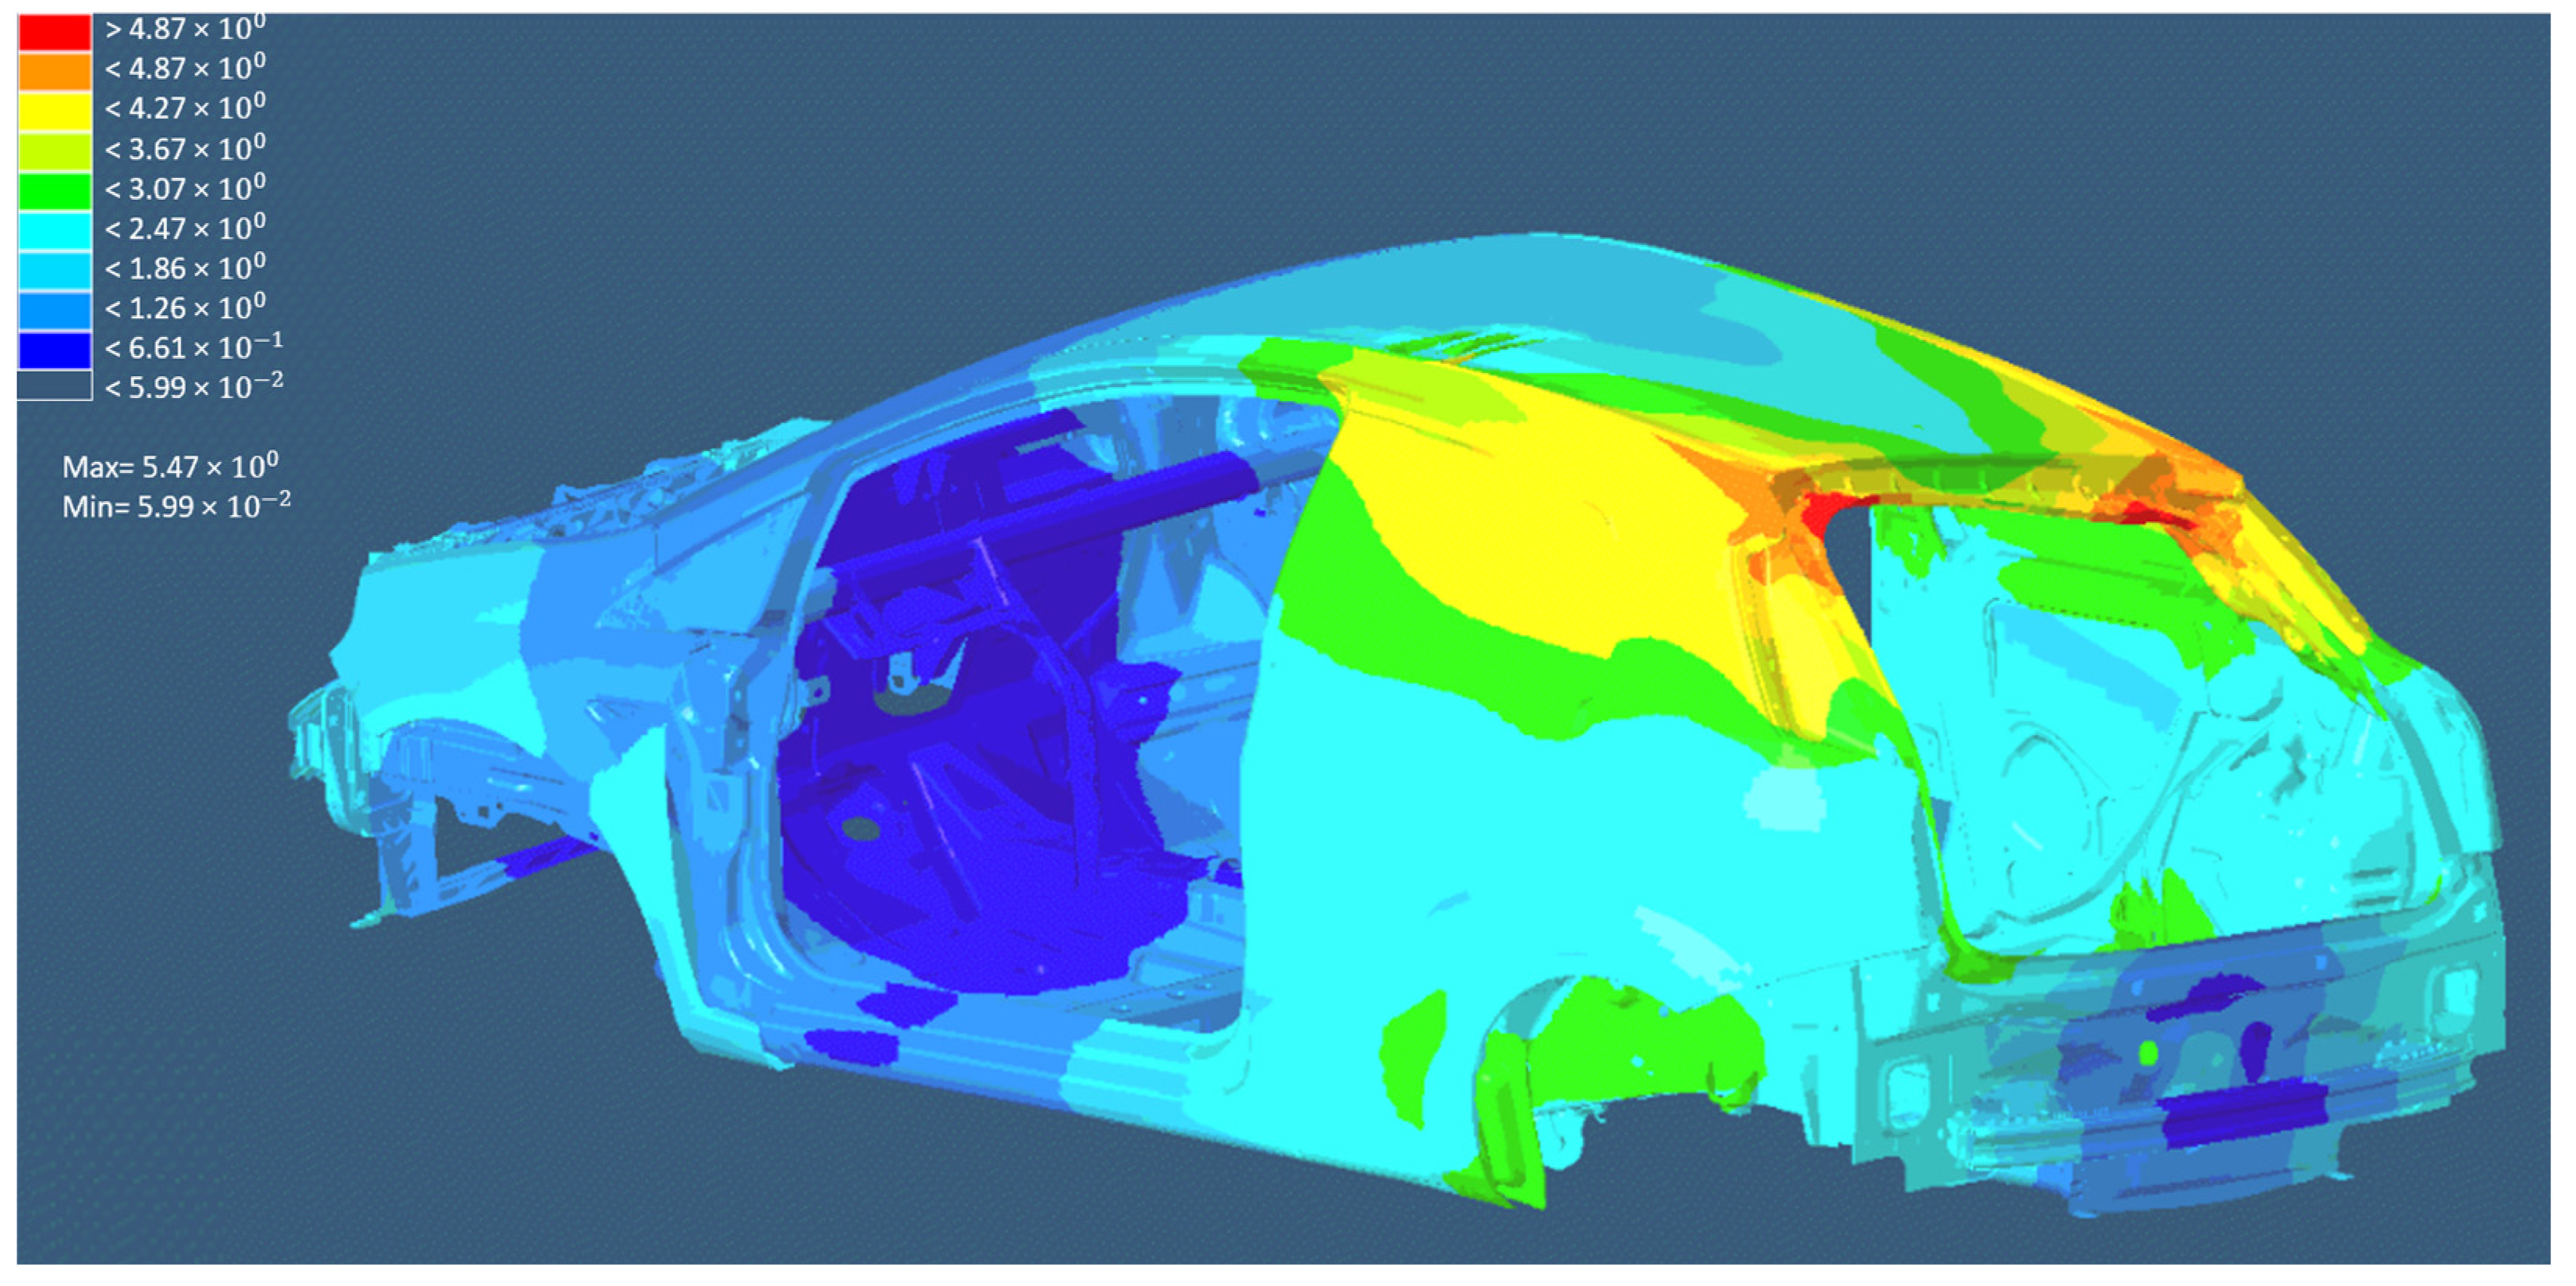
Figure 3. First torsional mode on BIW model.
Applsci 13 03552 g003
Figure 4. Moment applied on TB model to perform the forced response analysis.
Applsci 13 03552 g004
Figure 5. Accelerations on the four excited suspension points.
Applsci 13 03552 g005
Figure 6. First torsional mode on TB model.
Applsci 13 03552 g006
Figure 7. Nodes of the car body involved in the sensitivity analysis.
Applsci 13 03552 g007
Figure 8. Frequency percentage increase in the first torsional mode in correspondence of each modified configuration (a), with highlights (circled in black) of most critical nodes (b).
Applsci 13 03552 g008
Figure 9. Original rear part (made of steel) of the car body, with highlights of the adopted mesh.
Applsci 13 03552 g009
Figure 10. Aluminum rear part, to be internally optimized and then 3D printed, with highlight of the subdivision in 6 parts.
Applsci 13 03552 g010
Figure 11. Connections with glue, highlighted in red, in the rear part.
Applsci 13 03552 g011
Figure 12. Areas of the rear part where the connections were obtained with screws.
Applsci 13 03552 g012
Figure 13. Rear part design space.
Applsci 13 03552 g013
Figure 14. Highlight of the loaded points with a configuration of forces (yellow arrows) useful to simulate a twisting moment.
Applsci 13 03552 g014
Figure 15. Reticular structure on Node D.
Applsci 13 03552 g015
Figure 16. Reticular structure on Node G.
Applsci 13 03552 g016
Figure 17. Complete new rear part of the vehicle with highlight of the reticular internal structure resulting from optimization.
Applsci 13 03552 g017
Figure 18. Flow chart of the optimization process.
Applsci 13 03552 g018
Figure 19. Acceleration vs. frequency on the four suspension attachment points of the new TB optimized model.
Applsci 13 03552 g019
Figure 20. Left connection of the door hinge (a) with related close-up (b).
Applsci 13 03552 g020
Figure 21. Left lock connection of the door hinge (a) with related close-up (b).
Applsci 13 03552 g021
Figure 22. Force application point (a), static (b), and dynamic (c) stiffness of the tailgate hinge, with highlight of frequency ranges where the stiffness of the optimized model is lower than original one.
Applsci 13 03552 g022aApplsci 13 03552 g022b
Figure 23. Force application point (a), static (b), and dynamic (c) stiffness of the tailgate lock.
Applsci 13 03552 g023
Figure 24. Hinge attachment, with increased thickness from 2 to 4 mm in the area highlighted in red.
Applsci 13 03552 g024
Figure 25. Lock attachment, with increased thickness from 2 to 4 mm in the area highlighted in red.
Applsci 13 03552 g025
Figure 26. Lock attachment, with highlight of added connections between inner and outer parts (red circles).
Applsci 13 03552 g026
Figure 27. Dynamic stiffness vs. frequency for the hinge attachment.
Applsci 13 03552 g027
Figure 28. Dynamic stiffness vs. frequency for the tailgate lock.
Applsci 13 03552 g028
Figure 29. TB model with highlight of acoustic cavities: seats (brown), cockpit (cyan), boot (blue).
Applsci 13 03552 g029
Figure 30. First two cavity modes: longitudinal global mode (a); local mode (b).
Applsci 13 03552 g030aApplsci 13 03552 g030b
Figure 31. Position of virtual microphone 2 (driver’s ear) and 5 (passenger’s ear).
Applsci 13 03552 g031
Figure 32. Vibrational excitation at anterior suspension attachment (a) and related transfer functions (b,c).
Applsci 13 03552 g032aApplsci 13 03552 g032b
Figure 33. Vibrational excitation at left front dome (a) and related transfer-functions (b,c).
Applsci 13 03552 g033aApplsci 13 03552 g033b
Figure 34. Pavè track.
Applsci 13 03552 g034
Figure 35. Multibody suspension system.
Applsci 13 03552 g035
Figure 36. Real force spectrum at the suspension points, corresponding to the pave track.
Applsci 13 03552 g036
Figure 37. Acoustic pressure on MIC2 (right ear driver) with highlight of the frequency ranges with reduced SPL.
Applsci 13 03552 g037
Figure 38. Acoustic pressure on MIC5 (Left ear, right rear passenger), with highlight of the frequency ranges with reduced SPL.
Applsci 13 03552 g038
Table 1. Static and dynamic optimization.
Decrease in the Sum of
Displacements of Four Loaded Points [%]
Torsional Natural Frequency Increase [%]Weight Savings
Considering Only the Rear Part [%]
36.8%14%19%
Table 2. Static stiffness of the hinge attachment.
Tailgate HingeStatic Stiffness [N/mm]
Original TB ModelK
Optimized Model1.05×K
Optimized and Stiffened TB Model1.46×K
Table 3. Static stiffness of the tailgate lock.
Tailgate LockStatic Stiffness [N/mm]
Original TB ModelK
Optimized Model0.5×K
Optimized and Stiffened TB Model1.25×K
Disclaimer/Publisher’s Note: The statements, opinions and data contained in all publications are solely those of the individual author(s) and contributor(s) and not of MDPI and/or the editor(s). MDPI and/or the editor(s) disclaim responsibility for any injury to people or property resulting from any ideas, methods, instructions or products referred to in the content.