Article

Theoretical and Experimental Analysis of the Thermal Response in Induction Thermography in the Frequency Range of 2.5 Hz to 20 kHz

Fraunhofer Institute for Nondestructive Testing IZFP, Campus E3 1, 66123 Saarbrücken, Germany
Appl. Sci. 2023, 13(6), 3565; https://doi.org/10.3390/app13063565
Submission received: 8 February 2023 / Revised: 2 March 2023 / Accepted: 7 March 2023 / Published: 10 March 2023

Abstract

:

Featured Application

Induction thermography as a nondestructive technique for defect detection in electrically conducting materials.

Abstract

The one-dimensional propagation of electromagnetic waves and the propagation of the resulting thermal waves in conducting material are analysed in a coherent way. The heat release due to resistive losses has a static and an oscillating part. Both are considered as heat source terms for the thermal diffusion equation. The time dependence of the temperature is described by analytical solutions. Electrically and thermally conducting materials are classified by the ratio of thermal penetration depth to the skin depth. Experiments performed on ferritic steel, stainless steel and carbon-fibre-reinforced polymer show the time dependence of the thermal signal after heating begins, as described by the theory. At low induction frequencies, an oscillating part of the surface temperature at the double of the induction frequency is detected in accordance with the theory. The results point out new opportunities for induction thermography.

1. Introduction

Electromagnetic waves obey classical wave equations, whereas thermal processes are governed by a diffusion equation. In spite of the different physics, one can find similarities between electromagnetic waves in an electrically conducting medium and time-periodic thermal diffusion waves. In the case of one-dimensional propagation (and only in this case), there are strong formal analogies between both types of ‘waves’, as has been pointed out by Cooper [1].
Induction thermography (or eddy current pulsed thermography) relies on both the electromagnetic propagation in a metal and the thermal wave (or pulse) generation by electromagnetic heat sources. Thermal wave excitation has been reported as eddy current lock-in thermography by using an amplitude-modulated induction signal, where the modulation frequency is much lower than the induction frequency [2]. Pulsed excitation is the standard technique in industrial application, where a single induction burst of finite length is applied to the sample [3]. Induction thermography is a promising technique for nondestructive testing for detection of surface defects in metals with an increasing number of applications in industry. Examples are testing of defects in long steel bars [4,5], testing of cracks in turbine blades [6] and defects in forged and welded components [7,8]. There are previous descriptions of the principles of the technique [3,9,10]. There are still some basic aspects not studied, until now. One example is the transition between the surface heating and volume heating regimes. Volume heating in composites has been discussed by He et al. [11]. Yi at al. have analysed the multilayer structure in carbon-fibre-reinforced polymer (CFRP) structures using a semianalytical model [12]. The thermal effect of a transient magnetic field in circular geometry has been analysed in [13]. Wang et al. studied the time-dependent processes at the beginning of electromagnetic excitation, including the thermal diffusion that follows [14].
Whereas the lowest induction frequency reported in literature was 50 Hz [15], in this work, induction frequencies far below 50 Hz are used for the first time. In Section 2.1, the basic theory for electromagnetic and thermal wave propagation is discussed. In Section 2.3, the transition from volume to surface heating is described analytically based on one-dimensional electromagnetic wave propagation in a metal. The power release is calculated from the basic equations. It has an average contribution superimposed by a periodic oscillation. The first contribution is the excitation energy source usually considered in most applications of induction thermography. The latter contribution is usually neglected in previous literature. In Section 3, there is experimental verification for both contributions. For the first time, the signal at the double of the induction frequency is detected by thermography.

2. Materials and Methods

2.1. Basic Theory

Following the approach in [1], one can consider the one-dimensional propagation of an electromagnetic wave in the z-direction in an isotropic, homogeneous electrically conducting medium. Other than in [14], the transient phenomena at the very beginning of the electromagnetic excitation are ignored as they are very short compared to pulse lengths of 10 to 200 ms. Harmonic electromagnetic excitation is considered. If the electric field vector lies in the y-direction and is E y , the magnetic field vector in the x-direction is H x ; the time dependence is harmonic, it can be described from Faraday’s law by
E y z = μ 0 μ R H x t = i ω μ 0 μ R H x
and from Ampere´s law by
H x z = σ E y
where ω is the frequency of the electromagnetic wave, σ is the electrical conductivity and μ R the relative high-frequency magnetic permeability, which is
μ R = ( μ r 2 + μ r 2 ) 1 / 2 μ r
where μ r and μ r are the real and the imaginary part of the complex relative permeability at the frequency ω , respectively. At typical induction frequencies of 10 to 100 kHz, μ R is usually somewhat smaller than the static relative permeability [16].
Here, Z = i ω μ 0 μ R can be called the impedance parameter and Y = σ the admittance parameter.
The wave propagation in the conducting medium is described by
H x = E y Z 0 exp ( Γ 0 z ) ,
where
Z 0 = Z Y = i ω μ 0 μ R σ
is the characteristic impedance and
Γ 0 = Z Y = i ω σ μ 0 μ R = ( 1 + i ) ω σ μ 0 μ R 2 = 1 + i δ
is the propagation coefficient of the medium. Here,
δ = 2 ω σ μ 0 μ R
is the electromagnetic skin depth.
In the case of thermal waves, one considers the temperature oscillation ϑ and the heat flow f instead of E and H. From the definition of the thermal conductivity λ , one obtains
ϑ z = 1 λ f
and from the temperature change in an elemental volume by a gradient of the heat flow one obtains
f z = i ω ρ c ϑ
Comparing (8) and (9) with (1) and (2), one can see the formal analogy of wave propagation with Z = 1 / λ and Y = i ω ρ c , and one obtains the thermal impedance
Z 0 , t h = Z Y = 1 i ω λ ρ c
and the thermal propagation constant
Γ 0 , t h = Z Y = i ω ρ c λ = ( 1 + i ) ω ρ c 2 λ = 1 + i μ t h
where
μ t h = 2 λ ρ c ω
is the thermal diffusion length, the thermal analog of the electromagnetic skin depth.

2.2. The Distributed Heat Source Due to Eddy Currents

The local heat release q in W/m3 is given by the current density j:
q = 1 σ j 2 = σ E ( t ) 2 .
The electromagnetic wave propagating into the conducting medium is described by
E ( t ) = H 0 Z 0 exp ( Γ 0 z ) exp ( i ω t ) e x
where H 0 is the magnetic field at the surface. Using Equations (5), (7) and (13), the energy flow q is given by
q ( z , t ) = H 0 2 δ 2 σ exp ( 2 z δ ) [ 1 + cos ( π 2 2 z δ + 2 ω t ) ]
The released power density decays exponentially with a constant half of the skin depth δ . There are two terms in the bracket, where the first one describes the static power flow and the second one an oscillating power flow.
Figure 1 visualizes the density profiles q(z,t) of the released power over the depth z, normalised to the skin depth of the sample for four different times of one period of the double of the induction frequency.
The profiles resemble those of a thermal wave penetrating into the surface. The average of the oscillating term over one period is zero. For an induction frequency of 100 kHz, typical in nondestructive testing applications, and a typical length of an induction pulse of 100 ms, the pulse contains 10,000 periods, which then justifies neglecting the second term, even if the induction pulse does not contain an integer number of periods. In Section 2.3, the focus is on the first addend in Equation (15).

2.3. Temperature Rise in Time Domain Due to the Static Heating Term

Using (7), the static heating term in (15) can be written as
q D C ( z ) = H 0 2 2 μ 0 μ R ω exp ( 2 z δ )
When induction heating starts at the time t = 0, the resulting surface temperature change Δ T at the surface can be calculated based on a result in [17] (p. 80):
Δ T = H 0 2 2 µ 0 µ R ω λ δ 2 ( 1 2 π µ T δ 1 4 ( 1 exp ( ( µ T δ ) 2 ) e r f c ( µ T δ ) ) )
where
µ T ( t ) = 2 α t
is the thermal penetration depth, the depth of the thermal propagation for a given observation time t after heating begins. λ and α are the thermal conductivity and the thermal diffusivity of the conducting material, respectively. The time dependence of Δ T in Equation (17) is implicitly given by μ T (Equation (18)). The temperature change is governed by the ratio of thermal penetration depth and electromagnetic skin depth. Equation (17) can be used to compare the thermal response of a material after a certain heating time caused by a given induction field at its surface (in the following called ’induction heating efficiency‘). Table 1 shows examples for material parameters and penetration depths and for selected materials in induction thermography. Table 1 lists the surface temperature rise Δ T resulting from a magnetic induction B 0 = 0.02 T in air or a magnetic field of H 0 = 1.59 × 10⁴ A/m at an induction frequency of 100 kHz after 0.1 s of inductive heating.
Four groups of materials can be identified in Table 1. Owing to their high magnetic permeability, the ferromagnetic metals have a very small skin depth compared to the thermal penetration even after a short time. Only a thin surface layer generates the heat. The nonmagnetic metals in the second group are often good electrical conductors, but their relative permeability is close to one. Their skin depth is still one order below the typical thermal penetration. In the third group, there are metallic alloys with relatively poor electrical and thermal conduction. Here, the electromagnetic and thermal penetration depths are of comparable size for the given parameters. Finally, the materials of the last group have an electromagnetic skin depth significantly larger than the thermal penetration.
Table 1 shows that the ferromagnetic metals have the highest induction heating efficiency. On the other hand, the induction heating efficiency in the second group is poor. In particular, the aluminium alloys have an efficiency about a factor of 30 below that of magnetic steel, rendering testing of these materials difficult. This is further complicated by their often low infrared emissivity. In spite of this, successful applications on aluminium were reported [18].
If the thermal penetration depth is larger than the skin depth, μ T >> δ , Equation (17) can be simplified to
Δ T ( t ) = H 0 2 2 µ 0 µ R 2 π ω δ t ( λ ρ c ) .
Here, ρ and c are the density and the specific heat capacity of the material, respectively. This describes a classical surface heating process, which is characterised by a temperature rise proportional to the square root of time. As the skin depth δ is proportional to ω −0.5, the temperature rise Δ T is proportional to the square root of the induction frequency.
Owing to their larger skin depth, the alloys with µ T / δ 1 represent a transition from surface heating to volume heating. The induction heating efficiency is much better than that of the second group. Indeed, many successful applications of crack detection in aeronautical or power-generation turbine components were reported [6].
Finally, for some materials like carbon-fibre-reinforced polymers (CFRP), μ T << δ is fulfilled for typical observation times in experiments. Equation (17) can be simplified to
Δ T ( t ) = H 0 2 2 µ 0 µ R ω t ρ c .
The surface temperature rises proportional to time, which is typical for a volume heat source. It is proportional also to the induction frequency. The induction heating efficiency does not reach that of magnetic steel, but is better than that of most alloys. Successful applications for CFRP have been reported [19,20,21,22].
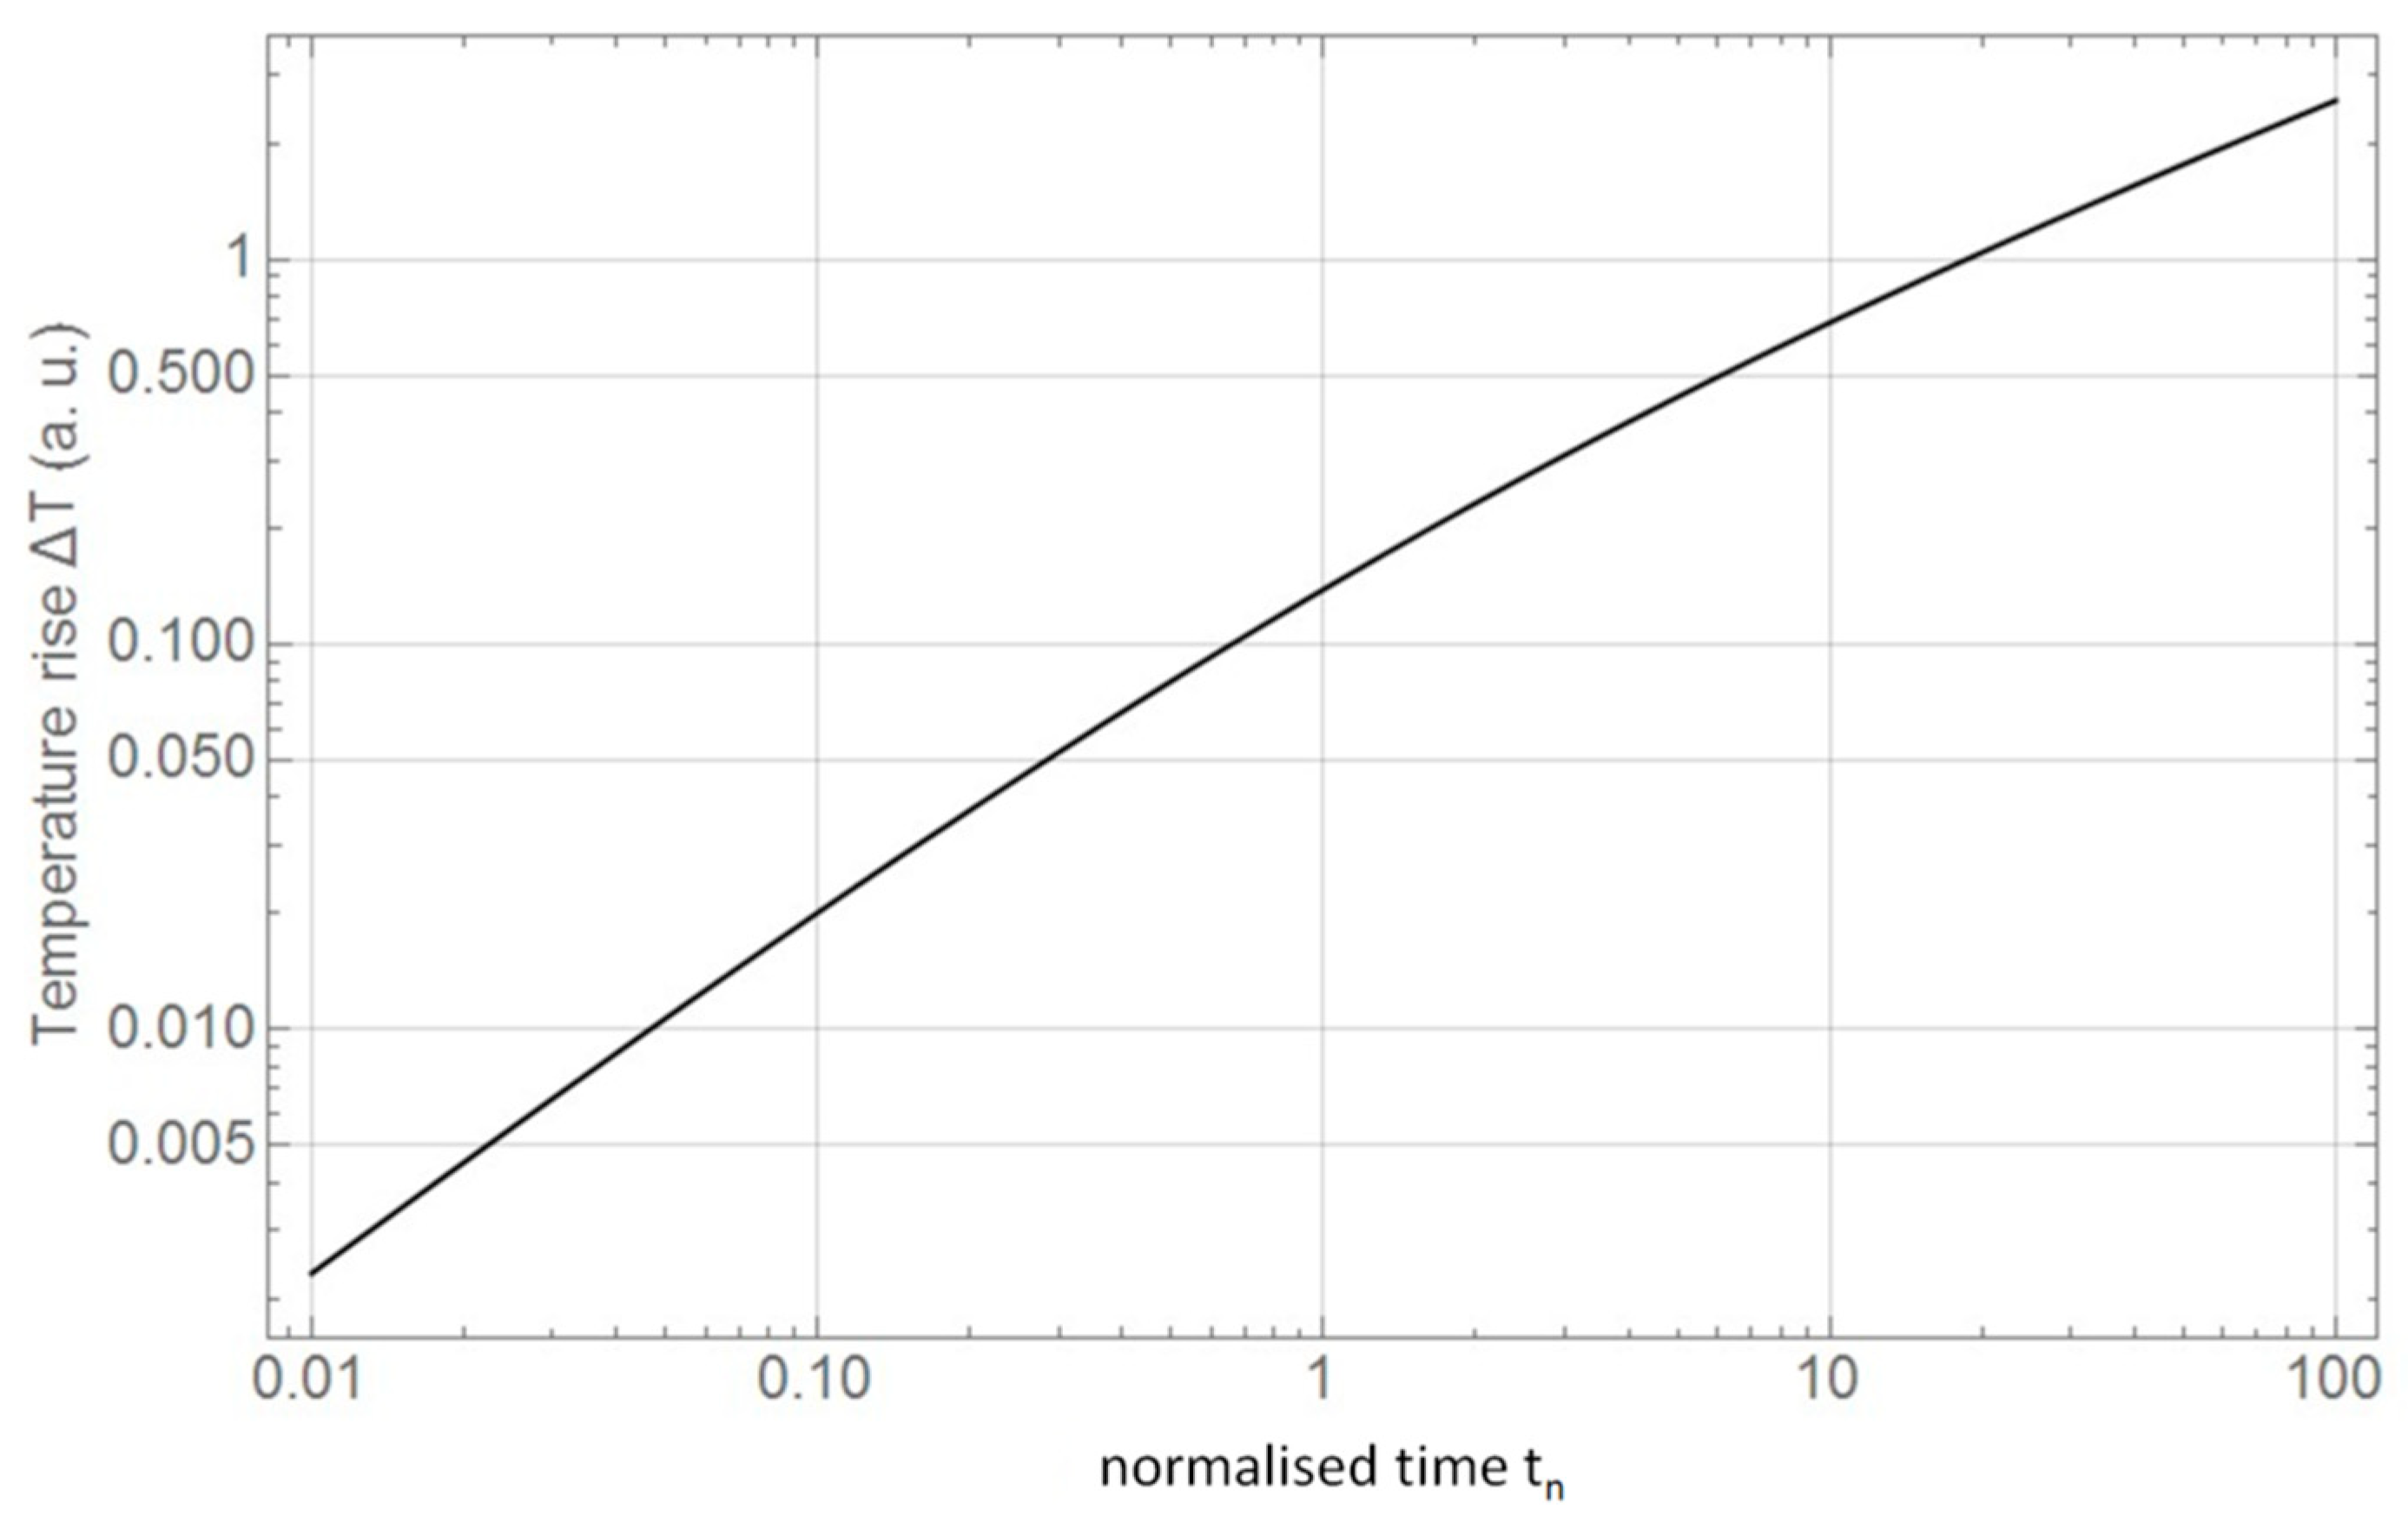
In Figure 2, the temperature contrast as a function of the normalised time t n is shown. t n is 1 when the thermal penetration depth μ T equals the skin depth δ . As discussed above, the slope in the double logarithmic representation approaches 1 for times tn << 1 and 0.5 for tn >> 1.
The total power density S in W/m2 released in the sample can be obtained from the integration of the static power density term in Equation (16) from z = 0 to infinity. It is given by
S = 0 q D C ( z ) d z = H 0 2 2 ω µ 0 µ R 2 σ
In all cases, higher magnetic permeability increases the signal, which explains the high induction efficiency in ferritic steel. For magnetic materials, Equations (3)–(6) are an approximation for small deviations of the magnetization from its equilibrium. It has been shown that static magnetic fields applied in addition to the high-frequency field can improve the thermographic contrast of cracks, when applied in a proper direction [23].
It should be mentioned that the electromagnetic skin depth as defined in Equation (7) is valid for a plane electromagnetic wave incident to a plane, electromagnetically thick conductor. The damping lengths will be somewhat different for rod and tube geometries, for thin plates, small components and under inductor wires. Even more complicated are the current paths in anisotropic conductors such as CFRP.

2.4. Temperature Oscillation Due to the Harmonic Heating Term

In the following, the oscillating term in Equation (15) is considered. Extended to the complex space, the distributed oscillating heat source can be written as
q a c = H 0 2 δ 2 σ exp ( 2 z δ ) exp ( i 2 z δ ) exp ( i π 2 ) exp ( i 2 ω t ) .
There is some similarity to a Beer-type absorption law, but there is an additional phase delay with increasing depth z. The thermal diffusion equation to be solved for the temperature oscillation ϑ is
ρ c ϑ t λ 2 ϑ z 2 = H 0 2 δ 2 σ exp ( 2 z δ ) exp ( i 2 z δ ) exp ( i π 2 ) exp ( i 2 ω t )
The solution is obtained similar to the proceeding in [24]. After separation of time, a sum of two terms decaying exponentially with depth is assumed for the temperature oscillation. Using an adiabatic surface condition, one can calculate the complex temperature at the frequency 2ω:
ϑ ( z ) = H 0 2 λ σ exp ( 2 z δ ) 2 + i ( δ μ 2 ω ) 2 ( i exp ( 2 i z δ ) + μ 2 ω δ ( 1 i ) exp ( ( 1 + i ) z μ 2 ω ) )
where
µ 2 ω = 2 λ ρ c 2 ω
is the thermal diffusion length of the material at the frequency 2 ω of heating due to the induction currents, not to be confused with the thermal penetration depth μ T defined in the last section.
The result for the temperature oscillation at the surface z = 0 is
ϑ ( 0 ) = H 0 2 2 λ σ i + μ 2 ω δ ( 1 i )   2 + i ( δ μ 2 ω ) 2
and depends strongly on the ratio of the thermal diffusion length to the skin depth. The ratio is
µ 2 ω δ = α 2 μ 0 μ R σ ,
which is independent of the induction frequency. Values are given in Table 1. For all common materials, the ratio is much smaller than one. In this case ( μ 2 ω / δ < < 1 ), the surface temperature oscillation at the frequency 2ω can be approximated from Equation (26) as
ϑ ( 0 ) = H 0 2 ρ c 1 4 μ 0 μ R
It is real and independent on the induction frequency. For the parameters of cast iron in Table 1 and H0 = 1.59 × 10⁴ A/m corresponding to B0 = 0.02 T in air, the temperature amplitude is 4.8 mK. For most nonmagnetic materials, the temperature amplitude is two orders of magnitude smaller and probably not detectable or detectable only by using averaging or lock-in techniques.

2.5. Experimental

For the experiments, a cooled infrared camera FLIR SC5000 for the wavelength range 2–5 µm was used. The induction system consists of a QSC PL380 NF stereo power amplifier for the frequency range 2.5 Hz to 30 kHz and a maximum power output of 4 kW per channel. Only one channel was used.

2.5.1. Experiments in the kHz Range

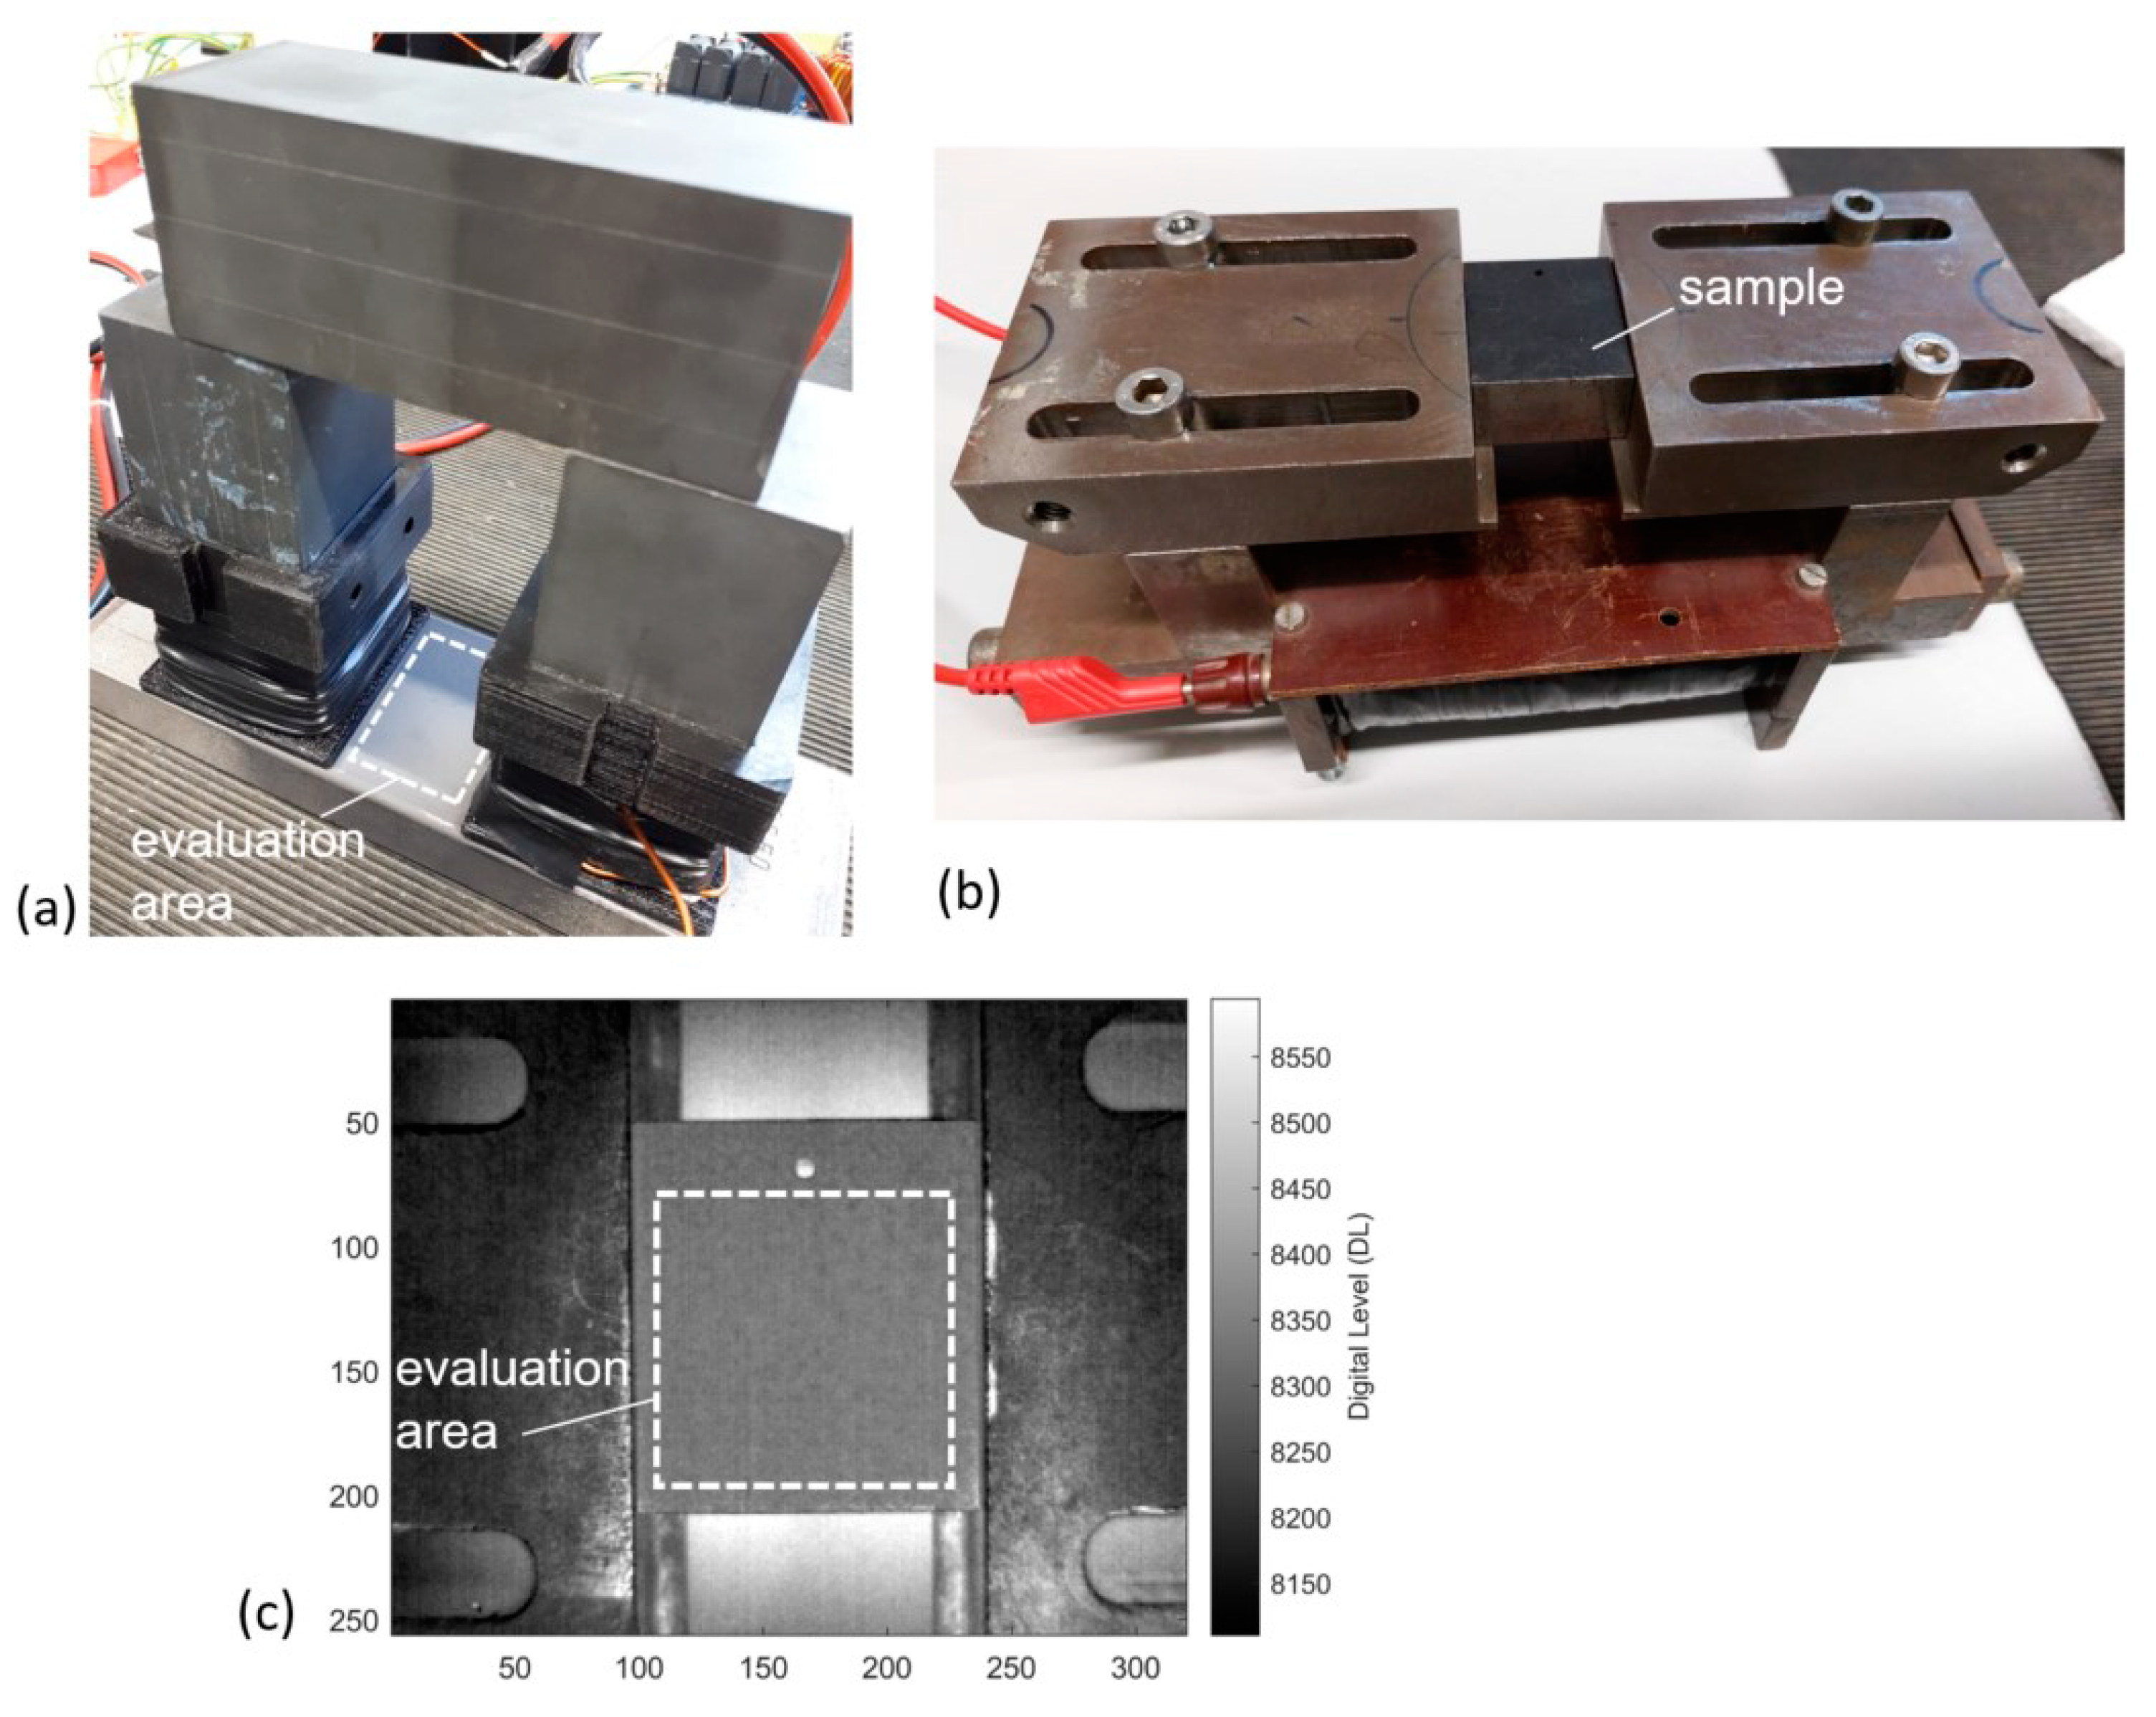
An inductor based on a ferrite yoke was connected to the amplifier and set on top of a slab of the material to be investigated (Figure 3a). To avoid a slow rise-time of the induction current and to work easily at different induction frequencies, the induction system is nonresonant. Given by the amplifier used, induction frequencies between 7.5 and 20 kHz were applied for a total time of 5 s. The voltage amplitude over the inductor was kept constant and checked for absence of possible nonharmonic distortions. Owing to the frequency dependent impedance of the inductor, excitation current and efficiency decreased with increasing frequency. Images with a frame rate of 100 Hz from an evaluation area between the yoke arms were recorded for the time of the excitation burst. All following evaluations of the temperature as a function of time were obtained as an average over the area marked in Figure 3a.
One sample was a slab of stainless steel 316 with a thickness of 19 mm. Using the values shown in Table 1, the thermal penetration depth after 5 s was 8.3 mm and the skin depth at 10 kHz was 4.6 mm. For comparison, slabs of ferritic steel and of CFRP were studied. Their thickness was 3 and 4 mm, respectively. The steel samples measured were thermally and electromagnetically thick, the CFRP sample was thermally thick and electromagnetically thin for the parameters of the experiments.
As the excitation power was limited and the signals of stainless steel and CFRP were relatively small, averaging of several repeated experiments was performed, followed by slight smoothing of the signal curves by a gliding average.
The stainless steel sample had a quite homogeneous natural surface. The measurement on this sample was repeated with a black paint coating and led to similar results. The ferritic steel sample was measured with a thin black coating. The CFRP sample was not coated.

2.5.2. Experiments in the 2.5 to 7 Hz Range

Detection of the temperature oscillation at the double of the induction frequency, as predicted by Equation (22), is difficult as the infrared cameras available are usually not fast and sensitive enough to measure the oscillation at typical induction frequencies f much higher than a kHz. Low induction frequencies should be used. Another inductor was employed based on a coil on a yoke from soft magnetic steel (Figure 3b,c). At frequencies 2.5 to 7 Hz, its impedance was sufficiently well matched to that of the amplifier.
In the experiment, a ferromagnetic steel sample in shape of a block 35 mm × 40 mm × 20 mm was excited continuously at frequencies from 2.5 to 7 Hz. At these frequencies, the sample is electromagnetically thick. A small resistance in series with the magnet allowed one to measure the current. The electrical phase between the current and the applied voltage was determined. From this, the active power to the magnet could be calculated. The current varied from 9.3 to 5.3 Aeff and the active power from 120 to 80 W in the frequency range 2.5 to 7 Hz induction frequency.
The temperature response was typically recorded over 20 s by the infrared camera at a frame rate of 100 Hz.

3. Results and Discussion

3.1. Temperature Rise with Excitation Frequencies in the kHz Range

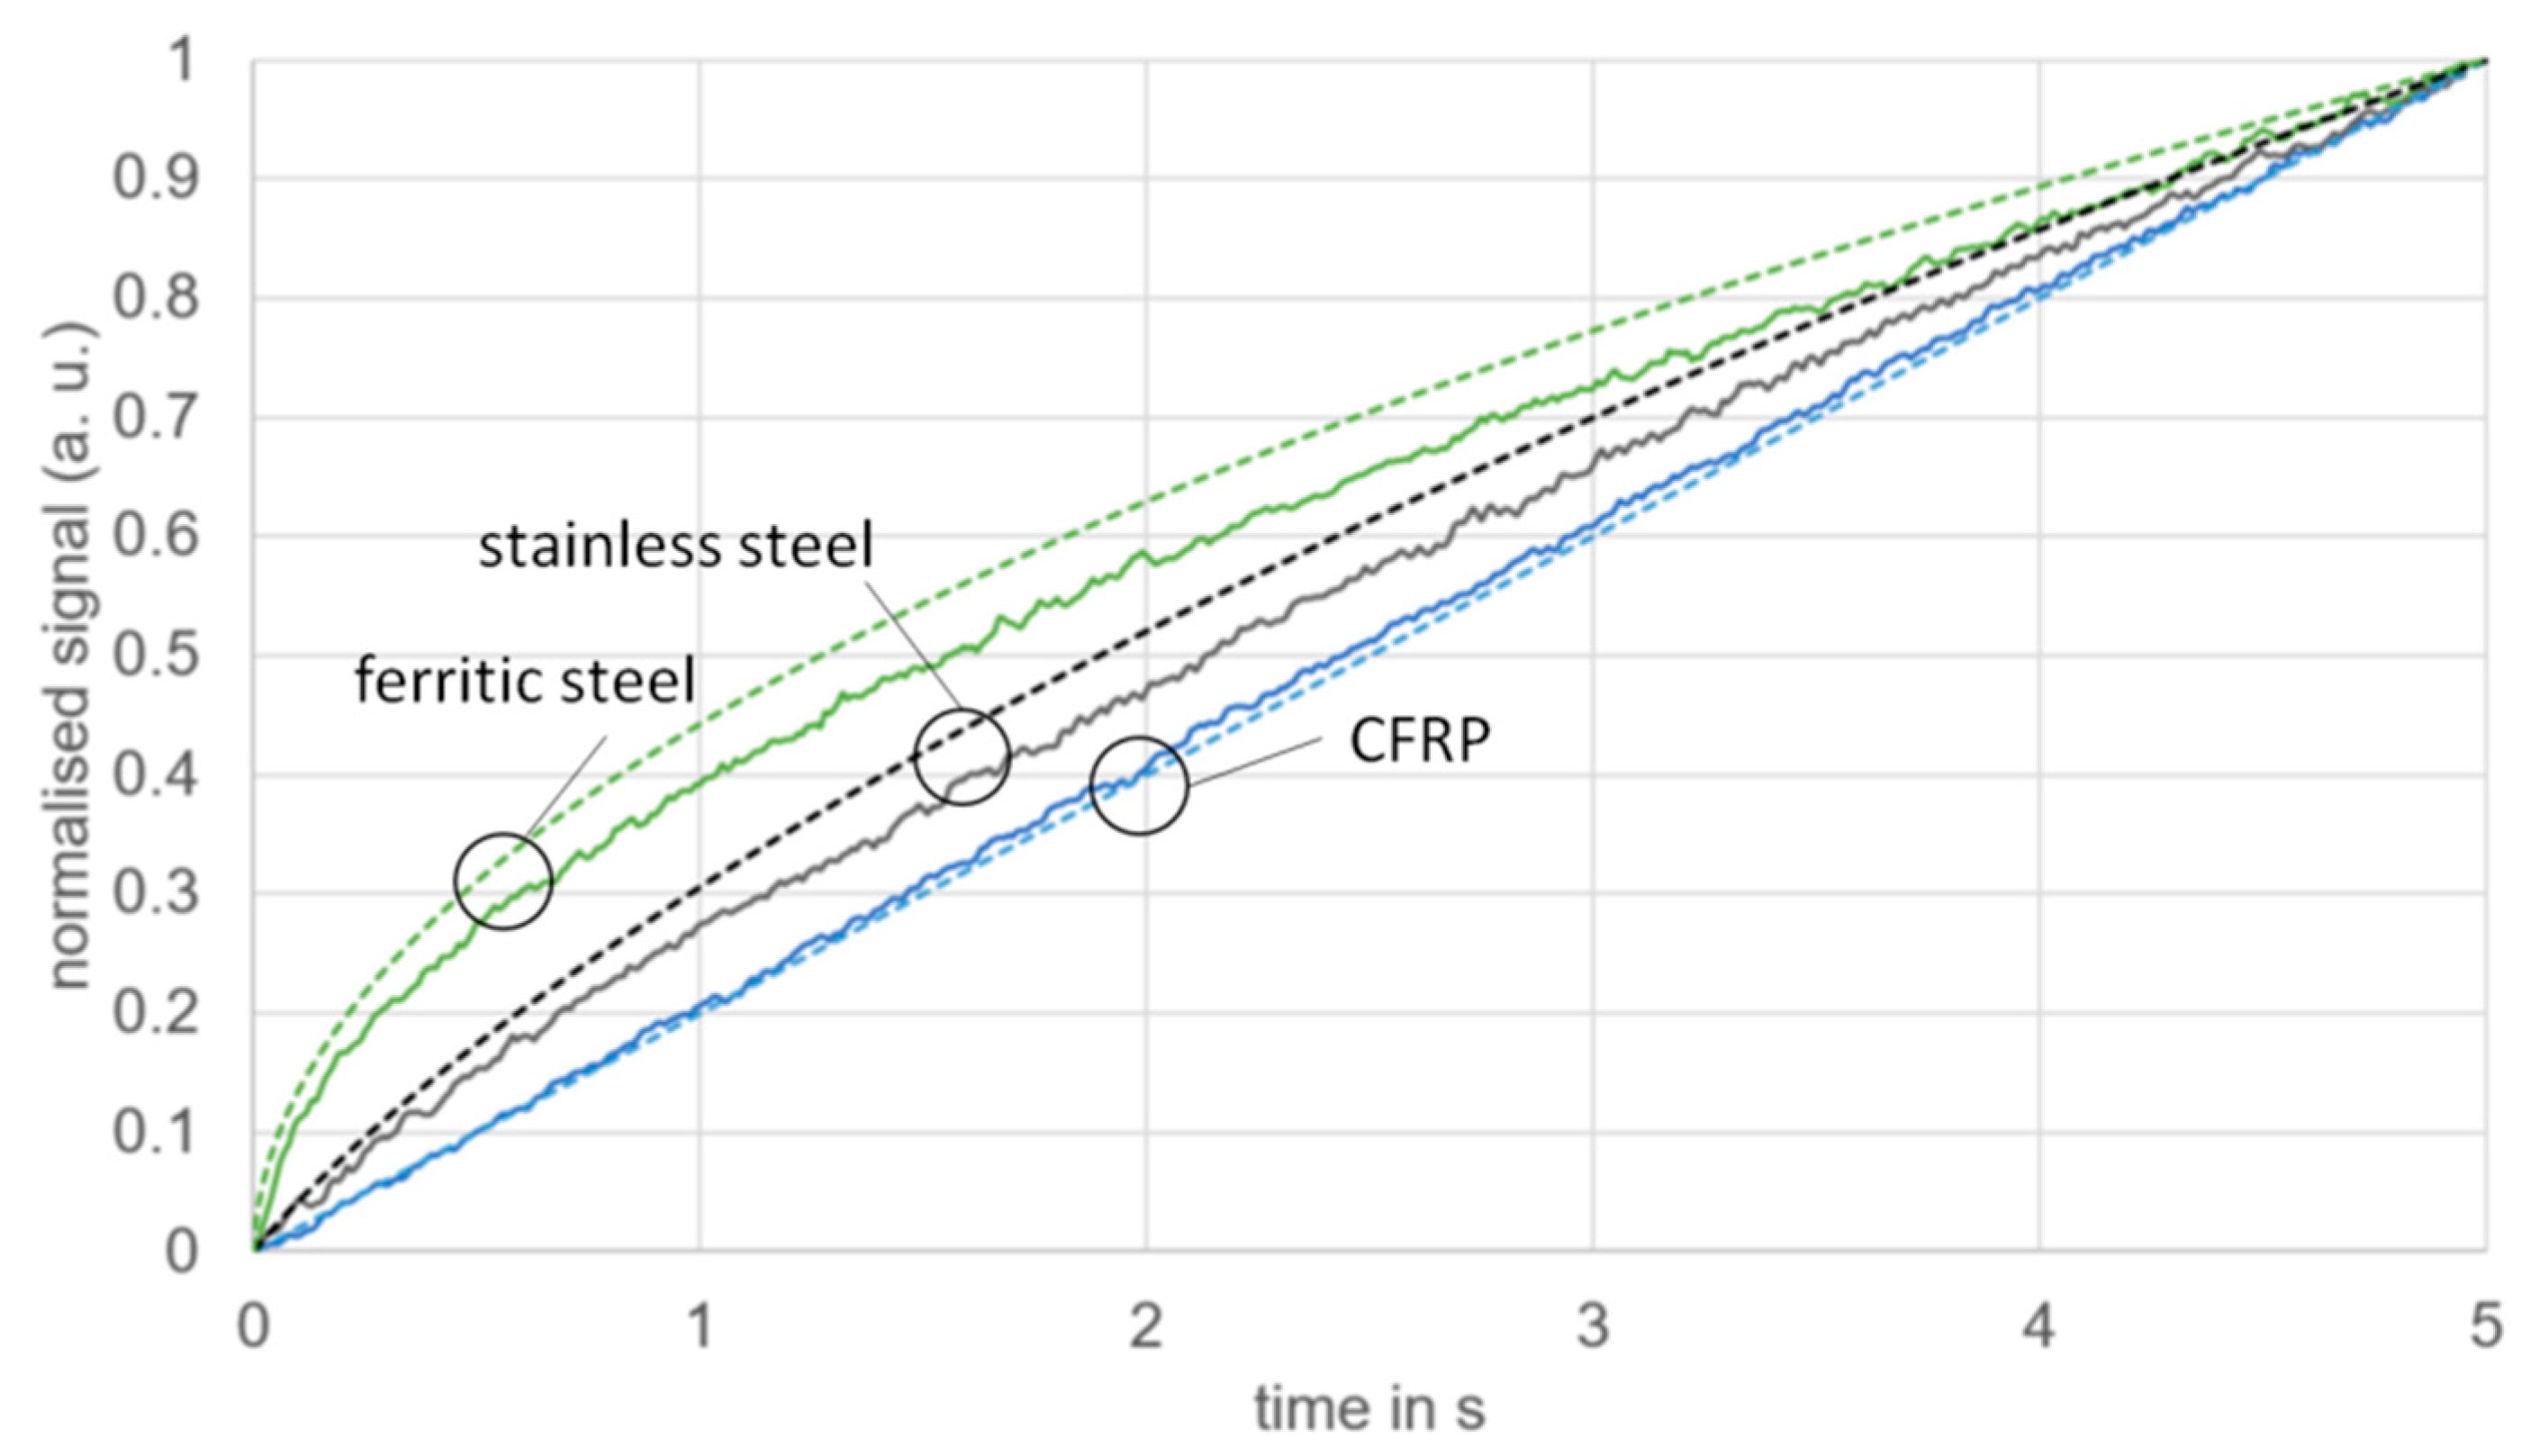
Figure 4 shows the experimental temperature rise curves for stainless steel, for ferritic steel and for CFRP at an induction frequency of 10 kHz. Calculated curves based on Equation (17) and the material parameters from Table 1 are also shown. For better comparison, all curves were normalised at t = 5 s.
The curves for CFRP show an almost linear temperature rise, as μ T << δ holds for the full time of 5 s. The curves for ferritic steel from the beginning have dependence proportional to the square root of time. A calculation based on the material parameters in Table 1 shows that the thermal penetration depth exceeds the skin depth very early at t > 34 ms. The curves for stainless steel lie in between the curves of CFRP and cast iron. For the curve of stainless steel, the thermal penetration depth equals the skin depth at t = 1.4 s. It starts with a more linear part and has a more square-root-dependent part for later times. There is deviation between the theoretical and the experimental curves. This is mainly accounted for the fact that the one-dimensional wave propagation from theory cannot perfectly be realised in the experiment. There is also some uncertainty about the actual thermal and electrical properties of the materials.

3.2. Temperature Rise with Excitation Frequencies in the 2.5 to 7 Hz Range

At very low frequencies, a ferromagnetic material will be magnetised in the well-known form of a hysteresis loop. The area in the loop is equal to the power released per cycle of the excitation, the hysteresis loss. However, the shape of the hysteresis curve is frequency dependent, as Barkhausen jumps have a characteristic time constant and eddy currents are generated locally around moving domain walls [25]. With increasing induction frequency, hysteresis curves under sinusoidal excitation deform increasingly more to an elliptical shape. Initially, the eddy currents around the Bloch walls lead to additional (excess) heat release; afterward, the macroscopic eddy current losses on a scale beyond the length of a domain wall (classical losses) dominate, allowing for approximation of the magnetic behaviour by a relative permeability μ R , as introduced in Section 2.1.
At frequencies lower than 50 Hz, the losses in ferritic steel are often dominated by hysteresis losses [25]. It has been shown that the release of heat within one hysteresis cycle occurs with two peaks in time [26]. This means that a doubling of the electromagnetic excitation frequency should occur, not only in the domain of macroscopic eddy current losses, but also in the hysteresis domain.
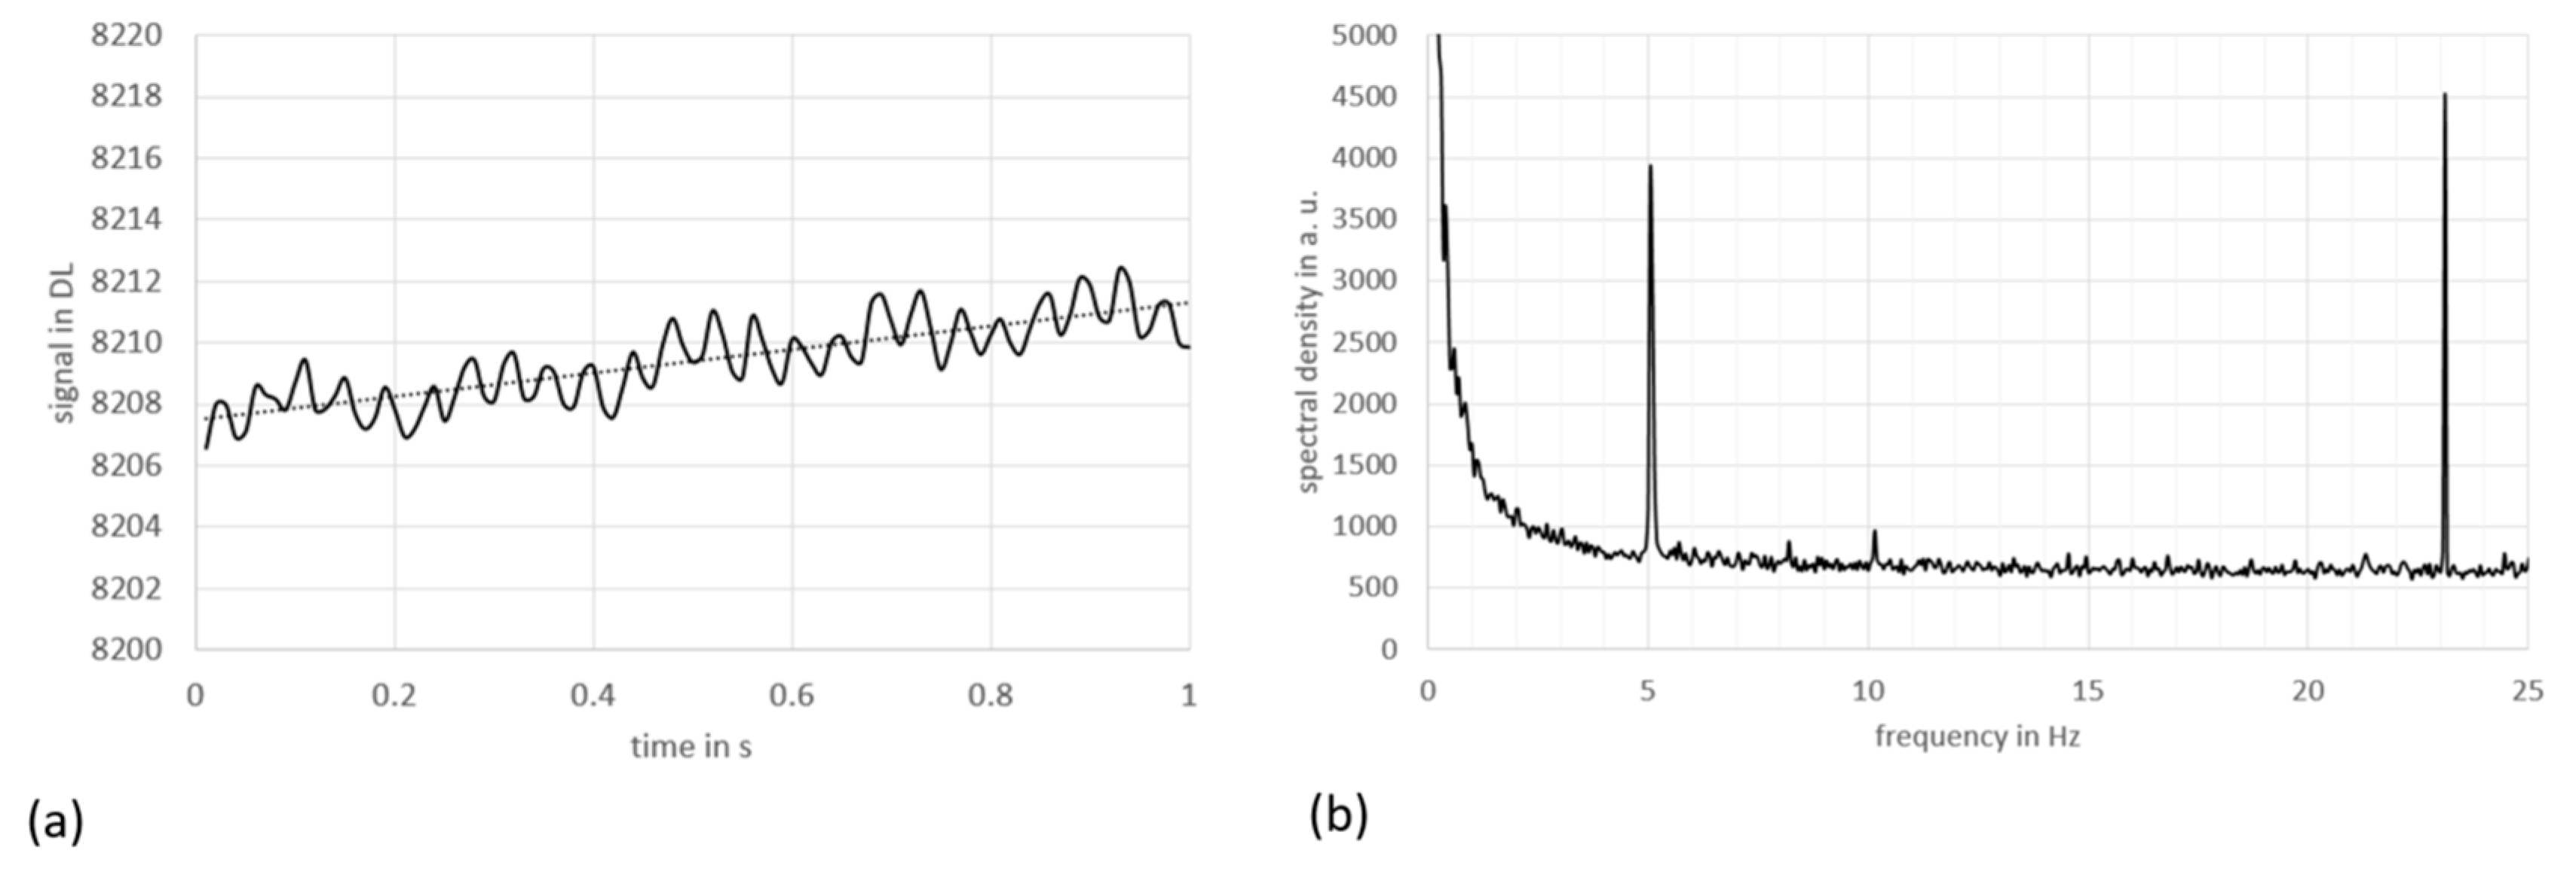
A recorded temperature rise in the first second of excitation averaged over the evaluation area is shown in Figure 5a. The recorded temperature signal over 20 s was processed by a pulse phase thermography algorithm (a Fourier transform for each pixel) in order to obtain the frequency spectra shown in Figure 5b.
In Figure 5a, one can see that the thermal response at the induction frequency f = 2.5 Hz exhibits a periodicity at 5 Hz. It is superimposed by a background signal close to 23 Hz. This also appears in the amplitude frequency spectrum shown in Figure 5b. The 23 Hz component is always present in the spectra, independent of the induction frequency and even without any inductive excitation and is probably due to vibrations in the IR camera. The frequency of this changes through time, probably due to a temperature dependence, up to 25 Hz within one hour. There is no peak at the induction frequency of 2.5 Hz, but a strong peak at 5 Hz. A higher harmonic signal at 10 Hz is weakly visible. The origin of the tiny peak at 8.2 Hz is unknown. The rise in the spectrum towards zero frequency is due to the general linear rise of temperature, as expected for µT < δ. The dashed line in Figure 5a is a fit to this temperature rise.
Owing to the small 2f signals, care has to be taken to exclude other effects as origin. Some of these might be:
(a) Mechanical vibration of the sample and/or magnet or magnetostriction due to the strong magnetic fields.
Some vibrations of the system magnet-sample are present. They are visible at 2f at the sample edges, which cause an edge-contrast enhancement. Vibration and magnetostriction might also cause such effects in the evaluation area. However, the signal from the evaluation area remains unchanged when the camera lens is defocused, which causes significant spatial averaging. Measurement of the actual mechanical vibration using an acoustic transducer was not successful, as the stray field close to the magnet generated electromagnetic interference in the transducer and its connections.
(b) Direct electromagnetic interaction of the magnetic stray fields with the IR camera.
Such artefacts are occasionally observed in induction thermography experiments. However, when the sample is covered by a plate of rubber with a thickness of 2 mm, the camera signal is largely damped. In addition, when the typical distance of 20 cm between camera lens and sample is increased to 3 m by using a telephoto lens, the 2f signal from the sample remains unchanged.
In total, the observed 2f signal can be assigned to the hysteretic heating of the sample.
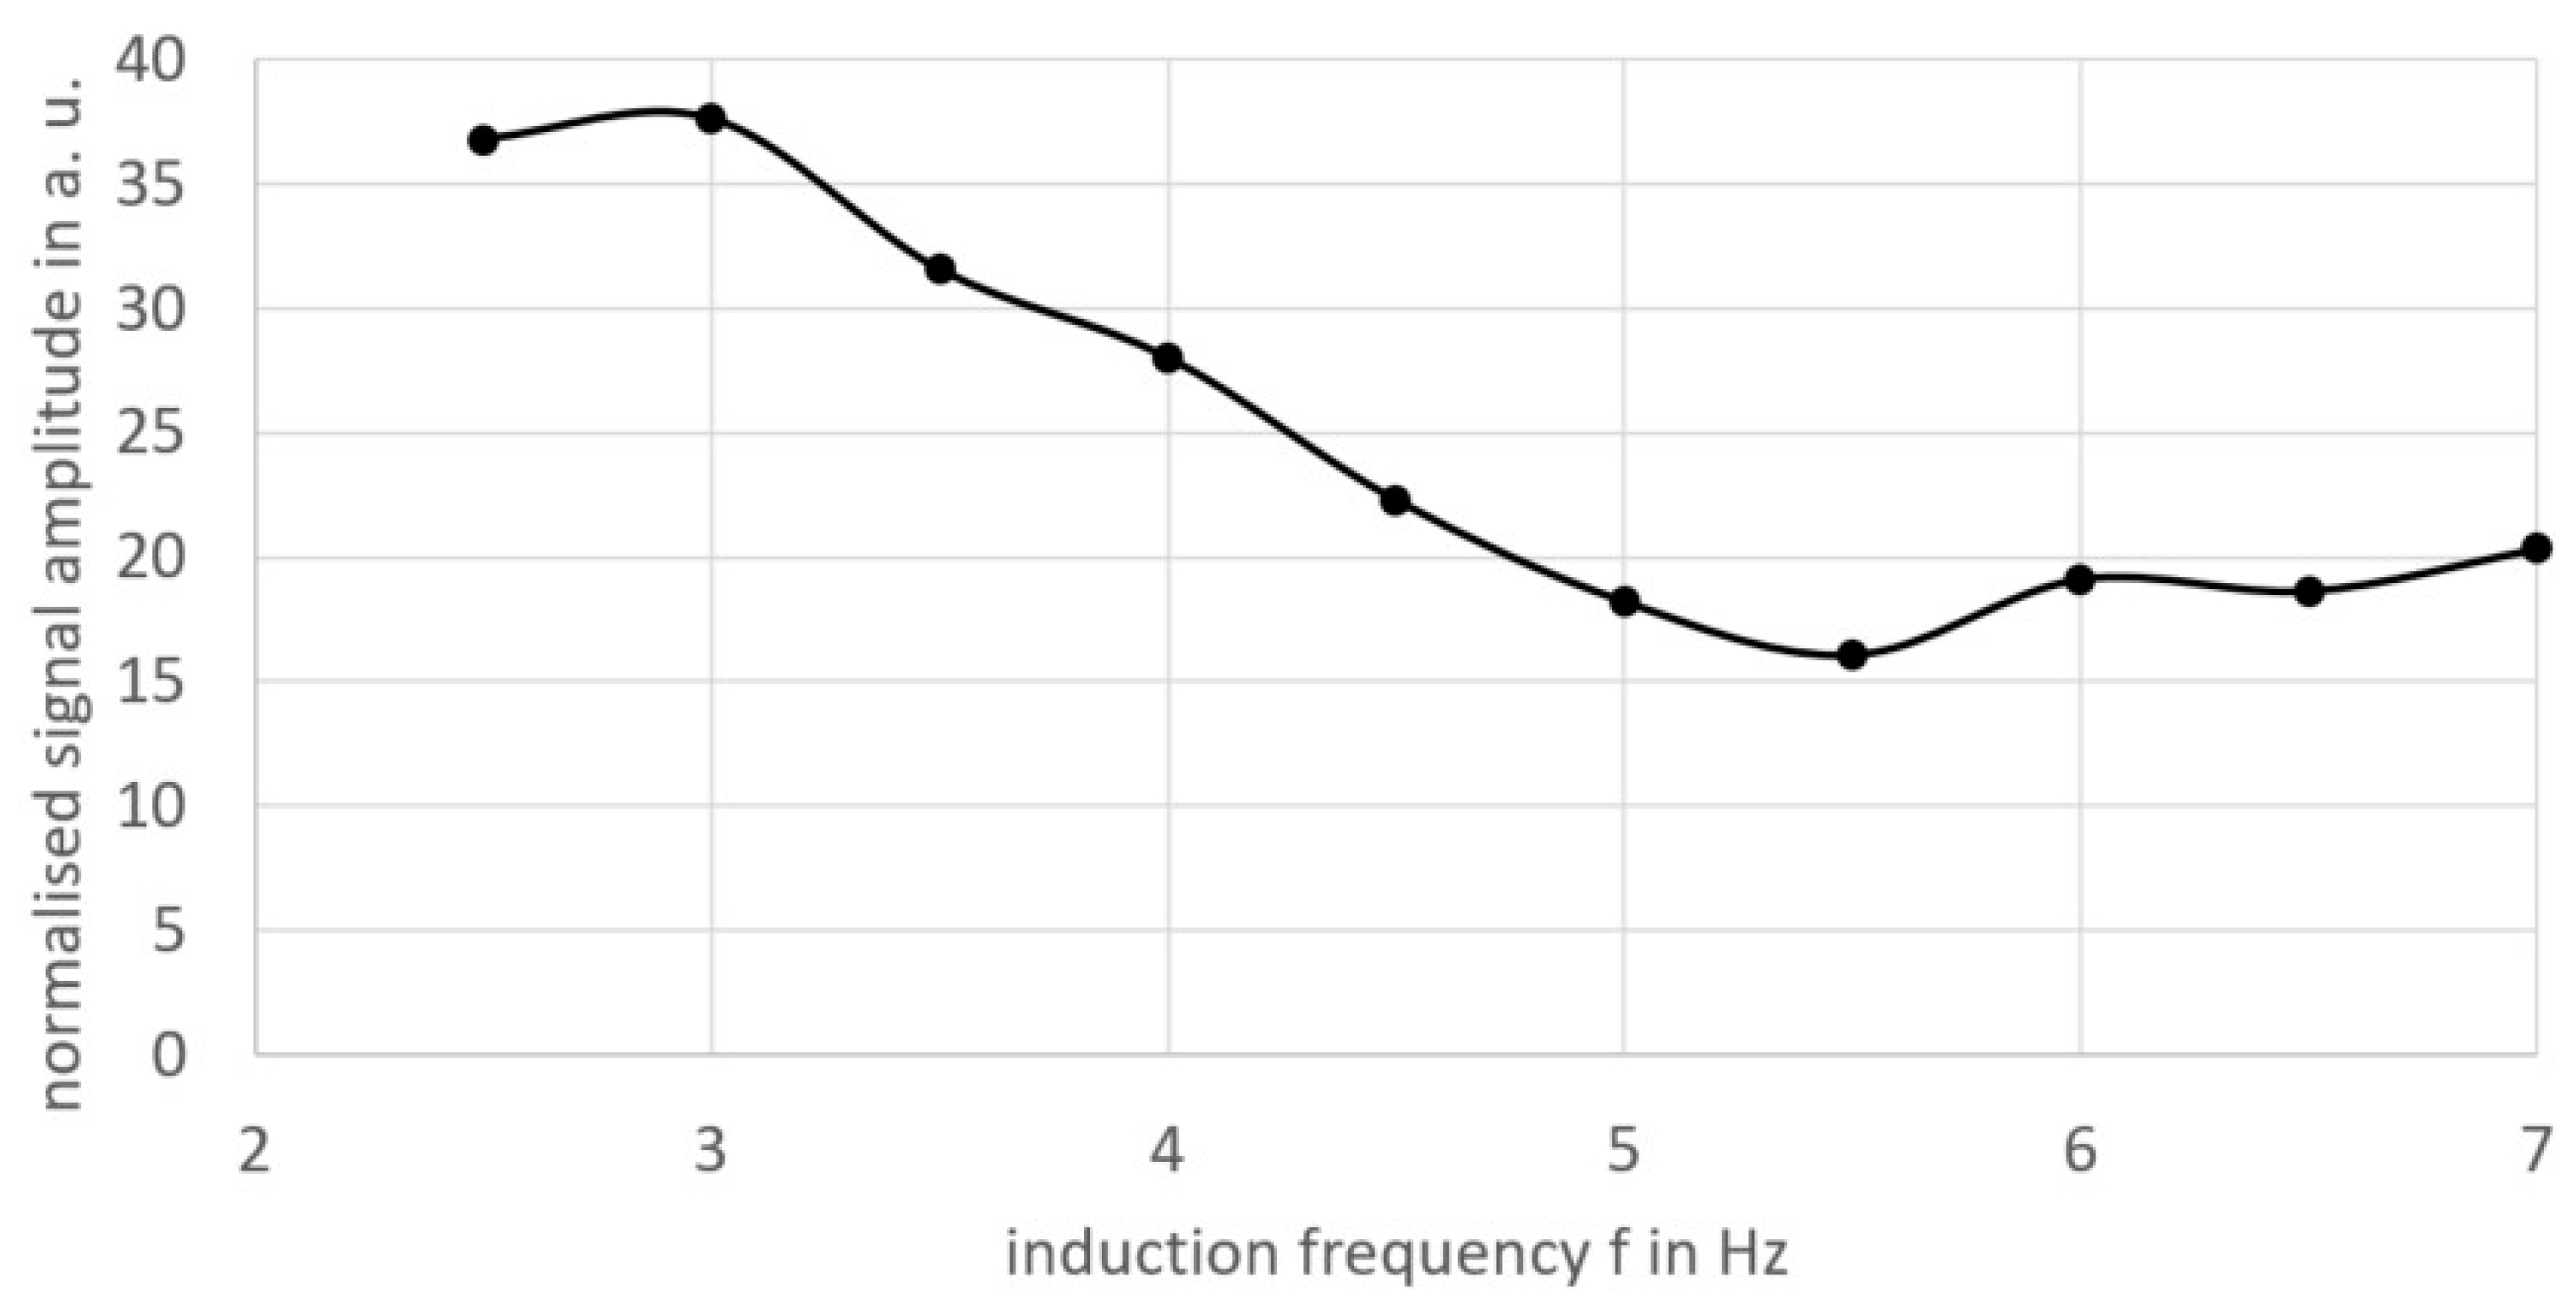
The amplitude of the temperature oscillation at 2f obtained from the spectra is not constant as a function of the induction frequency, as predicted in Equation (27), even if the signals are normalised to the square of the frequency-dependent induction current (Figure 6). The reason may be that the theory presented is not valid for the hysteretic regime. A reason for occurrence of a minimum in Figure 6 has probably no easy explanation due to the complexity of the magnetic phenomena involved.

4. Conclusions

In this contribution, the electromagnetic and thermal propagation in an electrically conducting material were analysed starting with the basic equations of one-dimensional wave propagation. The heating source due to the induced currents consists of a static term and an oscillating term at the double induction frequency. Both terms were considered separately and coupled with the thermal diffusion equation. For the static term, an analytical solution in the time domain was found and discussed in dependence of the ratio µ T / δ of the thermal penetration depth to the electromagnetic skin depth. This solution allows a unified description of surface and volume heating, which is different from previously published articles. Theory and experiment show that temperature rises proportional to time if the ratio is smaller than one and proportional to the square root of time when the ratio is larger than one.
The oscillating heating term generates thermal waves at the double of the induction frequency. In contrast to light absorption in a translucent body, the heat source contains a phasor component. An analytical solution of the thermal diffusion equation could be found and yields a small temperature oscillation at the surface independent of the induction frequency. At very low induction frequencies, this temperature oscillation was observed experimentally on a ferritic steel sample.

5. Outlook

Verification of the analytical solutions presented will require more investigations than those presented here. In particular, the nonlinear hysteretic phenomena and saturation effects have to be studied.
From the viewpoint of nondestructive testing, an interesting application of low-frequency induction thermography may be material characterization of magnetic materials by analyzing their nonlinear magnetic properties using thermographic imaging. Here, the noncontact operation would be an advantage in applications. One application could be imaging of hardened zones in steel.
For crack detection, the crack depth and its relation to the skin depth is an important parameter for the formation of the thermal contrast, as has been demonstrated earlier by extensive numerical simulations and experiments [27].
It is known that hidden cracks in steel can be detected by induction thermography, either by interaction of the induction currents with the crack (if the coverage is less or equal half of the skin depth [28]) or by their interaction with the thermal wave generated close to the surface within the thermal diffusion length. Calculations based on Equation (24) show that there are phase shifts as a function of depth that depend on the ratio of thermal diffusion length to skin depth. They may influence the quantitative determination of the defect depth. The phase shifts will be significant mainly for materials with low magnetic permeability.

Funding

This research received no external funding.

Institutional Review Board Statement

Not applicable.

Informed Consent Statement

Not applicable.

Data Availability Statement

Data can be obtained from the author on request.

Acknowledgments

The author thanks Timo Menzenbach for his support in the experimental work.

Conflicts of Interest

The author has no conflict of interest.

References

  1. Cooper, W. A communication network approach to sub-millimetric wave techniques in nondestructive testing. In Research Techniques in Nondestructive Testing; Sharpe, R.S., Ed.; Academic Press: London, UK, 1970; Volume 1, pp. 315–344. [Google Scholar]
  2. Riegert, G.; Zweschper, T.; Busse, G. Eddy-current lockin-thermography: Method and potential. J. Phys. IV (Proc.) 2005, 125, 587–591. [Google Scholar] [CrossRef]
  3. Oswald-Tranta, B. Thermoinductive investigations of magnetic materials for surface cracks. QIRT J. 2004, 1, 33–46. [Google Scholar] [CrossRef]
  4. Kremer, K. Das THERM-O-MATIC-Verfahren-Ein neuartiges Verfahren für die Online-Prüfung von Stahlerzeugnissen auf Oberflächenfehler. In Proceedings of the 3rd European Conference in Nondestructive Testing, Florence, Italy, 15 October 1984; pp. 171–186. [Google Scholar]
  5. Koch, S. Non-destructive testing of bars by inductive heat-flux thermography. Millenium Steel India 2014, 140–142. [Google Scholar]
  6. Zenzinger, G.; Bamberg, J.; Satzger, W.; Carl, V. Thermographic crack detection by eddy current excitation. Nondestruct. Test. Eval. 2007, 22, 101–111. [Google Scholar] [CrossRef]
  7. Bouteille, P.; Legros, G.; Walazek, H. Comparison between Induction Thermography and Conventional NDT Methods for Forged Parts. In Proceedings of the 11th European Conference on Non-Destructive Testing (ECNDT 2014), Prague, Czech Republic, 6–10 October 2014. [Google Scholar]
  8. Srajbr, C. Quality control of steel components in automotive production by induction thermography. In Proceedings of the Conference SCT 2017—Steels in Cars and Trucks, Amsterdam, The Netherlands, 18 June 2017; VDEh Düsseldorf: Düsseldorf, Germany, 2017. [Google Scholar]
  9. Vrana, J. Grundlagen und Anwendungen der Aktiven Thermografie Mit Elektromagnetischer Anregung (Fundamentals and Applications of Active Thermography Using Electromagnetic Excitation). Ph.D. Thesis, Universität des Saarlandes (University of Saarland), Saarland, Germany, 2008. [Google Scholar]
  10. He, Y.; Gao, B.; Sophian, A.; Yang, R. Transient Electromagnetic Thermal Nondestructive Testing: Pulsed Eddy Current and Transient Eddy Current Thermography; Elsevier: Oxford, UK, 2017. [Google Scholar]
  11. He, Y.; Yang, R.; Zhang, H.; Zhou, D.; Wang, G. Volume or inside heating thermography using electromagnetic excitation for advanced composite materials. Int. J. Therm. Sci. 2017, 111, 41–49. [Google Scholar] [CrossRef]
  12. Yi, Q.; Tian, G.; Chebbi, H.; Premel, D. Investigation of layer interface model of multi-layer structure using semi-analytical and FEM analysis for eddy current pulsed thermography. In Proceedings of the 2020 IEEE International Instrumentation and Measurement Technology Conference (I2MTC), Dubrovnik, Croatia, 25–28 May 2020; pp. 1–5. [Google Scholar] [CrossRef]
  13. Siakavellas, N. Analysis of the transient thermal field and heat flux in circular plates heated rapidly by a fast-decaying magnetic field. Heat Mass Transf. 2006, 42, 200–213. [Google Scholar] [CrossRef]
  14. Wang, Y.; Gao, B.; Tian, G.; Woo, W.; Miao, Y. Diffusion and separation mechanism of transient electromagnetic and thermal fields. Int. J. Therm. Sci. 2016, 102, 308–318. [Google Scholar] [CrossRef]
  15. Lahiri, B.; Bagavathiappan, S.; Soumya, C.; Mahendran, V.; Pillai, V.; Philip, J.; Jayakumar, T. Infrared thermography based defect detection in ferromagnetic specimens using a low frequency alternationg field. Infrared Phys. Technol. 2014, 64, 125–133. [Google Scholar] [CrossRef]
  16. Bowler, N. Frequency-dependence of relative permeability in steel. Rev. Quant. NDE 2006, 25, 1269–1276. [Google Scholar]
  17. Carslaw, H.; Jaeger, J. Conduction of Heat in Solids; Claredon Press: Oxford, UK, 1959. [Google Scholar]
  18. Tsopelas, N.; Siakavellas, N. Experimental evaluation of electromagnetic-thermal non-destructive inspection by eddy current thermography in square aluminium plates. NDT&E Int. 2011, 44, 609–620. [Google Scholar]
  19. Lehtiniemi, R.; Hartikainen, J. An application of induction heating for fast thermal nondestructive evaluation. Rev. Sci. Instrum. 1994, 65, 2099–2101. [Google Scholar] [CrossRef]
  20. Shepard, S.; Ihota, J.R.; Ahmed, T. Development of NDE Technique with Induction Heating on Conductive Composite Material; USAF Report Number AFRL-SR-AR-TR-05-0043; Department of Defense: Washington, DC, USA, 2004. [Google Scholar]
  21. Liang, T.; Ren, W.; Tian, G.; Elradi, M.; Gao, Y. Low energy impact damage detection in CFRP using eddy current pulsed thermography. Compos. Struct. 2016, 143, 352–361. [Google Scholar] [CrossRef] [Green Version]
  22. Guo, J.; Gao, X.; Toma, E.; Netzelmann, U. Anisotropy in carbon fiber reinforced polymer (CFRP) and its effect on induction thermography. Nondestr. Test. Eval. Int. 2017, 91, 1–8. [Google Scholar] [CrossRef]
  23. Jäckel, P.; Netzelmann, U. The influence of external magnetic fields on crack contrast in magnetic steel detected by induction thermography. QIRT J. 2013, 10, 237–247. [Google Scholar] [CrossRef]
  24. Rosencwaig, A.; Gersho, A. Theory of the photoacoustic effect with solids. J. Appl. Phys. 1976, 47, 64. [Google Scholar] [CrossRef]
  25. Bertotti, G. Hysteresis in Magnetism; Academic Press: San Diego, CA, USA, 1998. [Google Scholar]
  26. Woodbridge Constant, F. The distribution of the heat emission in the magnetic hysteresis cycle. Phys. Rev. 1928, 32, 486–493. [Google Scholar] [CrossRef]
  27. Oswald-Tranta, B. Induction thermography for surface crack detection and depth determination. Appl. Sci. 2018, 8, 257. [Google Scholar] [CrossRef] [Green Version]
  28. Walle, G.; Netzelmann, U.; Stumm, C.; Valeske, B. Low frequency induction thermography for the characterization of hidden cracks in ferromagnetic steel components. In Proceedings of the 11th International Conference on Quantitative Infrared Thermography (QIRT), Naples, Italy, 11 June 2012; p. 218. [Google Scholar]
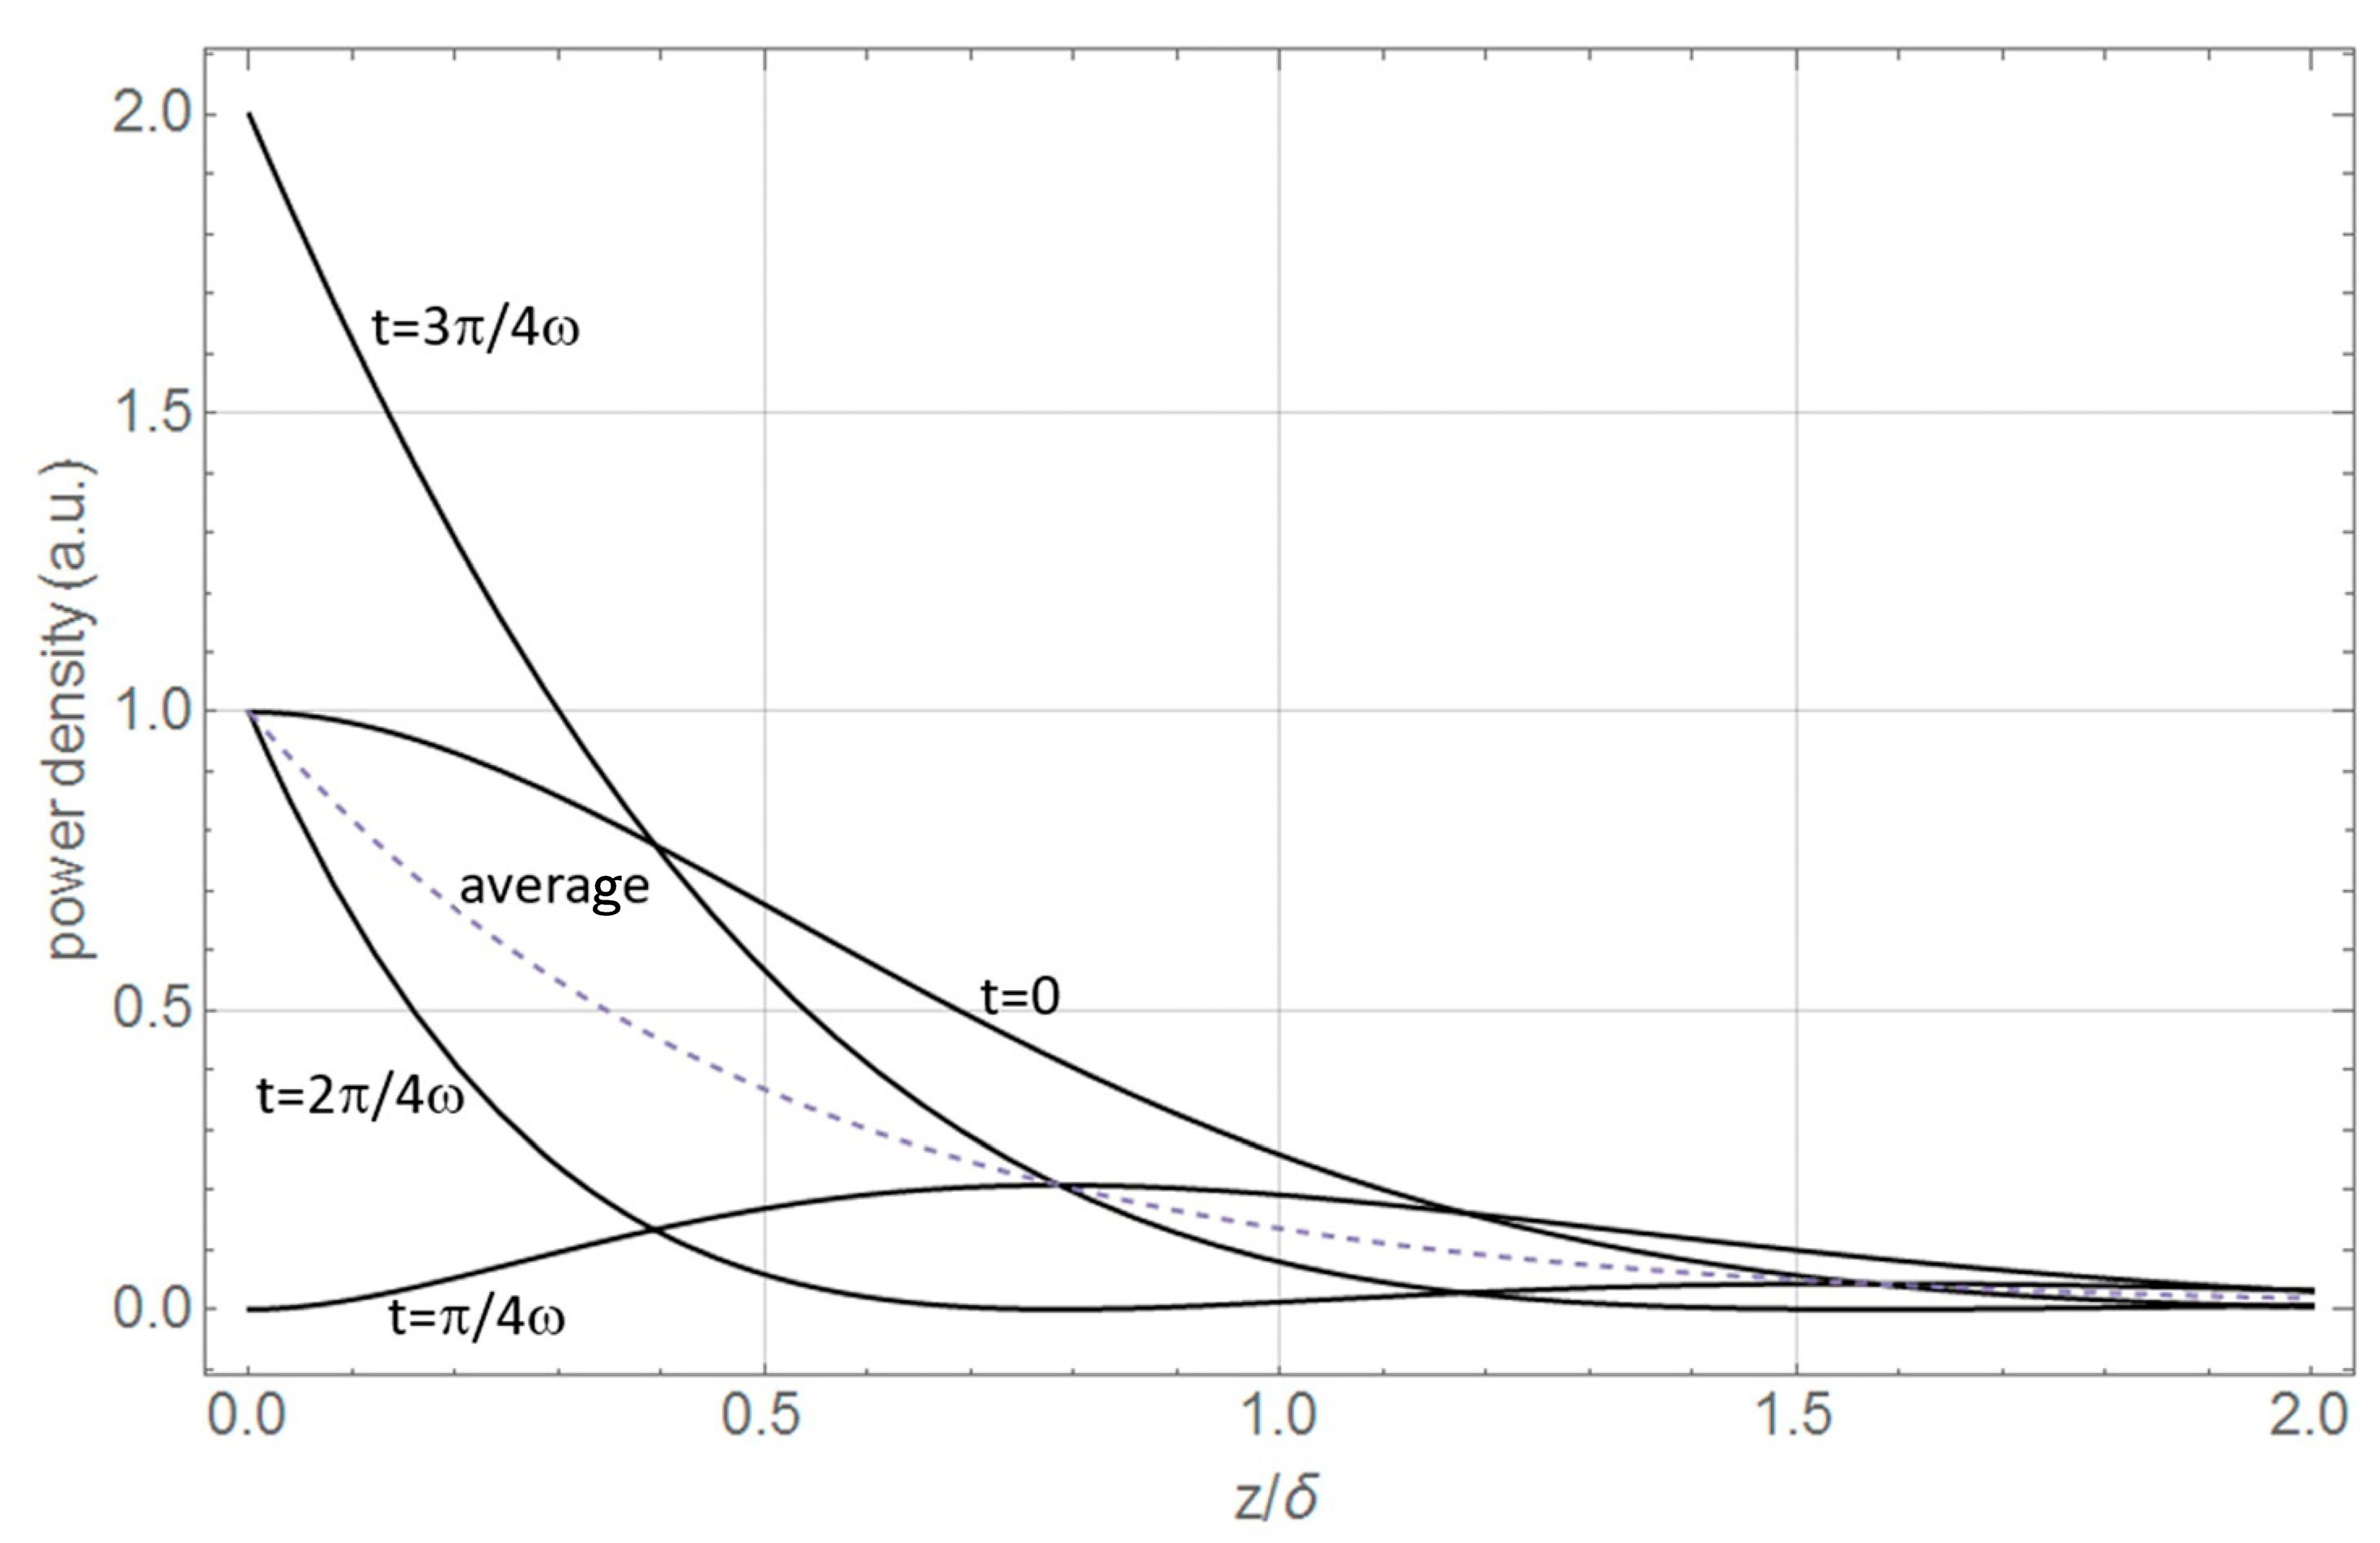
Figure 1. Power density profiles q(z,t) in the conducting material for selected times t. The dashed line represents the time average.
Applsci 13 03565 g001
Figure 2. Temperature rise Δ T as a function of the normalised time tn calculated based on Equation (17).
Applsci 13 03565 g002
Figure 3. (a) Photo of the inductor for the kHz range experiment with the sample underneath and marking of the evaluation area. (b) Photo of the inductor for the low-frequency experiment with the sample between the adjustable yokes. (c) Thermographic image of the sample in (b) with marking of the evaluation area.
Applsci 13 03565 g003
Figure 4. Normalised thermal signal after begin of induction heating obtained for ferritic steel, stainless steel and CFRP at an induction frequency of 10 kHz. Solid lines: experiment, dashed lines: theory.
Applsci 13 03565 g004
Figure 5. (a) Measured temperature signal in digital levels DL as a function of time on the sample surface of the ferromagnetic sample over 1 s of excitation at an induction frequency of 2.5 Hz. (b) The corresponding frequency amplitude spectrum obtained for a recording time of 20 s.
Applsci 13 03565 g005
Figure 6. Thermal oscillation amplitude at 2f as a function of the induction frequency f.
Applsci 13 03565 g006
Table 1. Electrical conductivity σ, magnetic permeability µR, thermal conductivity λ, skin depth δ at 100 kHz, thermal penetration depth µT at 0.1 s, induction heating efficiency (the surface temperature rise in K after 0.1 s heating with 0.02 T induction field amplitude at 100 kHz), and ratio of thermal diffusion length to skin depth µ/δ for selected materials.
CaseMaterialσ in 106 S/mµRλ in W/(mK)δ in mm (100 kHz)µT in mm (t = 0.1 s)Induction Heating Efficiency in Kµ2ω/δ
µ T δ > > 1 cast iron6.2200490.0452.4312.40.108
nickel, pure14.6210090.70.0423.033.90.146
µ T δ > 1 silver, pure62.8714080.2018.150.10.081
zinc, rolled16.2411130.3954.060.40.021
aluminium 2014-T622.5311770.3355.970.30.0357
copper, pure60.0914010.2056.830.10.0666
µ T δ 1 Inconel 6000.98114.91.6081.261.60.00157
stainless steel 3161.33113.41.3801.181.50.00171
titanium 6AL-4V0.5817.22.0901.082.90.00103
µ T δ < < 1 CFRP perp. to fibre0.000110.71590.395.30.000005
SiC ceramic0.000051802253.363.50.000030
silicon0.0011148506.115.80.000243
Disclaimer/Publisher’s Note: The statements, opinions and data contained in all publications are solely those of the individual author(s) and contributor(s) and not of MDPI and/or the editor(s). MDPI and/or the editor(s) disclaim responsibility for any injury to people or property resulting from any ideas, methods, instructions or products referred to in the content.