Article

Salient Semantic Segmentation Based on RGB-D Camera for Robot Semantic Mapping

1
School of Computer Science and Technology, Chongqing University of Posts and Telecommunications, Chongqing 400065, China
2
Advanced Manufacturing and Automatization Engineering Laboratory, Chongqing University of Posts and Telecommunications, Chongqing 400065, China
*
Author to whom correspondence should be addressed.
Appl. Sci. 2023, 13(6), 3576; https://doi.org/10.3390/app13063576
Submission received: 19 February 2023 / Revised: 9 March 2023 / Accepted: 9 March 2023 / Published: 10 March 2023

Abstract

:
Semantic mapping can help robots better understand the environment and is extensively studied in robotics. However, it is a challenge for semantic mapping that calibrates all the obstacles with semantics. We propose integrating two network models to realize the salient semantic segmentation used for mobile robot mapping, which differs from traditional segmentation methods. Firstly, we detected salient objects. The detection result was the grayscale image form, which was recognized and annotated by our trained model. Then, we projected the salient objects’ contour with semantics to the corresponding RGB image, which realized the salient objects’ semantic segmentation. We treated the salient objects instead of all the obstacles as semantic segmentation objects that could reduce the background consideration. The neural network model trained based on the salient object’s shape information was stable for object recognition and easy for model training. We only used the shape feature for training, which could reduce the calculation amount of feature details. Experiments demonstrated that the algorithm could quickly realize the model’s training and provide a semantic landmark in the point cloud map as the relative position reference for robot repositioning when the map needs to be used again and exist in a similar environment.

1. Introduction

The semantic map refers to the application of neural network-based object recognition, image segmentation, and other computer vision technology to the camera-based geometric map [1,2,3,4], which has developed rapidly with the Convolutional Neural Network (CNN) applied in computer vision. However, CNN does not sufficiently solve the challenge of image pixel-level segmentation. On this basis, Long et al. [5] proposed a Fully Convolutional Network (FCN), which abandoned the fully connected layer commonly used in CNN and realizes pixel-level semantic segmentation. FCN is the pioneer of semantic segmentation. Since then, outstanding network architectures such as U-Net, SegNet, PSPNet, DeepLab, and CANet et al. [6,7,8] have been proposed one after another. It is still a big challenge for them to realize accurate image semantic segmentation in real-time of all the geometric obstacles under the limited computing power condition of the mobile robot’s onboard processor, such as the speed (FPS) of PSPNet is 5 [6], and the speed (FPS) of DeepLab-v2 is 6 [7].
A semantic map helps robots classify obstacles according to semantic information and can help mobile robots understand the geometric environment further than the traditional robot map that only has geometric information. Which can be widely used in the field of autonomous cars [9], intelligent manufacturing [10], UAVs [11,12], service robots [13], etc. An ideal SLAM (Simultaneous localization and mapping) should quickly relocate when encountering a robot kidnapping problem or using a map again. Semantic mapping can give semantic labels to the various objects in a geometric environment. This can help robots improve the accuracy of repositioning and further mapping, plan the motion more intelligently in the process of autonomous movement, and have better interaction capabilities with the environment compared with geometric maps [14,15,16].
Salient objects are the most eye-catching objects in the robot’s view field. They are different from the environment in shape, color, direction, depth information, etc., usually as the preprocessing stage of advanced computer vision tasks [17,18,19]. Such as, we proposed to realize the fusion of two kinds of sensor information based on salient objects in previous work [20]. We proposed to estimate the relative position and attitude based on salient objects in RGB-D cameras [21]. We further worked on the real-time semantic mapping of salient objects in RGB-D cameras in this study. Salient objects are mobile robots’ most prominent and important obstacles in map building. To reduce the calculation amount during semantic segmentation, we sought to achieve semantic segmentation on salient objects in the mapping process because semantic segmentation is a much more complicated multi-classification problem than salient object detection. It is the deeper scene understanding. The more obstacles that need semantic segmentation, the greater the mobile robots’ computational pressure owing to the details of the picture that are considered more carefully. It has more training sets that need pixel-level annotation and be used for the training model. However, semantic segmentation still faces the bottleneck of lacking excellent manual annotation datasets.
We propose the salient object semantic segmentation under limited computing power. This paper attempts to replace semantic segmentation’s huge calculation amount with the calculation of salient object detection and recognition. Semantic segmentation faces bottlenecks limited by the framework structure and dataset. Semantic segmentation accuracy is upper bound limited by the consistency of annotation and pixel accuracy of artificial semantic segmentation annotation that is difficult to guarantee [22]. The neural network training time is consuming, and the shortcomings of a large amount of segmentation calculation make it not easy to implement in the industry communities and not as reliable as salient object detection and object recognition. Such as, in related works, the salient object detection method [23] runs at 300 FPS, at the maximum dimension of input images is 300 pixels. This paper’s model [24] runs at 57 FPS while producing better detection results than previous state-of-the-art methods. The YOLO V3 [25] for object recognition runs at 45.5 FPS at an input size of 320 × 320. However, FPS in semantic segmentation is generally small [26] compared to the above, such as the representative work among them FCN-8s [5], SegNet [8], PSPNet [6], DeepLab-v2 [7] respectively run at 15, 17, 5, 6 FPS on NVIDIA Titan. Semantic mapping based on semantic segmentation has not been applied in the industrial field, but object recognition used to detect defective items on the production line and salient object detection used as the preprocessing stage of high-order tasks have been applied in the industrial field. The above-related works prove that the method proposed in this paper is feasible in theory.
The contour shape feature is the most crucial object feature, and it is relatively stable [27,28]. It is not be affected by the objects in different categories with similar color and texture characteristics and indistinguishable. The grayscale image has fewer data dimensions than the RGB image and has fewer feature details that can easily be learned by the neural network, which is used in this paper and can reduce the calculation amount. For the above reasons, we used grayscale images with object contours as the training data to train the neural network model based on salient object contours to recognize objects for the semantic annotation of salient objects’ contour segmentation in the process of mobile robot RGB-D mapping.
Furthermore, we chose YOLO to improve the running speed further to meet the real-time requirements of semantic segmentation when building maps. YOLO uses a single-pipe strategy, and its training and prediction are both end-to-end, so the YOLO algorithm is relatively simple and fast compared with a variety of neural network models [29,30,31]. YOLO convolves the picture with a larger field of view used for object recognition, and it is not easy to misjudge the background [32,33]. YOLO has a strong generalization ability and has high robustness when doing transfer learning. In the YOLO series, YOLO V3 is the Most Classic balanced object recognition network in terms of speed and accuracy by far, and it is the peak of the YOLO series. The new YOLO series are all perfected and supplemented based on YOLO V3 by the fusion of various advanced methods for improvement [34,35]. YOLO V3 has irreplaceable advantages for real-time object recognition applications in the industry. It has the most potential to meet the real-time demand for semantic annotation in mobile robot mapping.
RGB-D camera can acquire the depth information of the RGB image. This makes up for the shortcomings of (1) the uncertainty of the monocular camera scale and (2) the binocular camera, which has a large calculation amount when calculating the depth. The RGB-D camera is becoming the mainstream sensor in the field of visual SLAM research [36,37,38,39].
First, this paper proposes detecting the salient objects in the RGB-D image and recognizing the salient objects by the trained neural network model YOLO V3 based on the contour shape feature. Furthermore, we extracted the salient object contours in the grayscale image and projected them into the corresponding RGB image, which realized the salient objects’ semantic segmentation in the RGB-D image’s RGB part used for mobile robot mapping. The organization of this paper is as follows: The relevant algorithms are analyzed and connected with the research points of our work in the second part. The main theory of the proposed method is described in the third part. The proposed method’s experimental details and conclusion analysis are in the fourth part. The highlights of this article are:
(1) The proposed method replaces the vast computation amount of semantic segmentation with salient semantic segmentation, providing a reference way to deal with large scene mapping.
(2) Our proposed salient semantic segmentation bypasses mainstream semantic segmentation bottlenecks, time-consuming dataset annotation, and the algorithm bottleneck.
(3) Our method provides a reference for similar situations when the objects’ contour shapes and semantics are presented in different image forms. We can realize semantic segmentation by fusing two kinds of information.
(4) Our method is easy to train, can be further transformed into the semantic landmark in the 3D point cloud map, and provides a relative position reference for robot repositioning and further mapping.

2. Related Work

In mobile robot semantic mapping, much related research has been carried out in the semantic segmentation field. Here, we mainly focus on the current representative methods of the features used for object recognition, the reduction of semantic segmentation calculation, and the real-time semantic mapping that is most relevant to our work.
Y. Chen et al. [40] proposed a method of color segmentation using a simplified PCNN to recognize objects. S. Sasano et al. [41] proposed a food recognition method combining color and texture features. Their method could adaptively learn representative colors or textures for food recognition. Relevant works showed that color features do not depend on the image’s direction, angle, and size, which could be used for object recognition. Still, if the different objects’ colors are relatively similar and there is no obvious texture difference, it was unsuitable. This problem could be solved by using a more stable shape feature that is rich in semantic information [27,28,42].
RGB images have higher data dimensions and richer feature information than grayscale images used for object recognition, which has been the subject of much research work. M. Leet et al. [43] proposed a method to recognize outdoor scene objects using local color, texture, and context features. F. Garcia et al. [44] proposed a method of fruit recognition used for supermarkets, which mainly includes the fruit’s shape and texture features. Object recognition based on multiple features in RGB images is the mainstream method at present, which can make up for the shortcomings of each feature. The more features and details are considered for neural networks, the more computation is needed. To better meet the construction of semantic maps for mobile robots with limited computing power that requires high real-time performance, we propose recognizing objects based on the contour shapes because they are relatively stable and rich in semantic information. Furthermore, we use the grayscale image to show the contour shape of the objects because most details of contour shapes can be easily presented in grayscale images.
G. Zuo et al. [45] proposed a method using a dense segmentation network (DS-Net) to achieve good performance of semantic mapping fusion. C. Zhang et al. [46] proposed a reconstruction method for a large outdoor 3D dense semantic map based on monocular vision. The algorithm could reconstruct globally consistent semantic maps in large-scale outdoor scenes. In their article, if the scene became larger and more types of semantic segmentation were considered, there was more consideration for the image details. The calculation amount was larger when the mobile service robot faced an environment full of objects, such as semantic segmentation of various daily necessities, furniture, office supplies, and other items in the indoor mapping scene. Ensuring the multiple objects’ accurate segmentation and the semantic mapping’s real-time requirements is not a small challenge.
Wu, Zi Feng et al. [47] proposed a method of semantic segmentation that reduced the calculation amount by 25 times without significantly impacting the quality of the results. Eduardo Romera et al. [48] proposed a deep architecture that could run in real-time while providing accurate semantic segmentation. The core of their deep architecture was a new layer that uses residual connections and factored convolutions to maintain efficiency while maintaining excellent performance. M Siam et al. [49] and A Briot et al. [50] also did a lot of work on real-time semantic segmentation. The above works mainly focused on the neural network structure. The speed of most semantic segmentation methods will increase at the cost of mAP reduction. We propose to explore the semantic segmentation of salient objects from the data source to reduce the calculation of semantic mapping for all objects, and while maintaining a high FPS by using salient object detection to filter out the background objects that are not important but consume computing resources. The salient is a concept that can distinguish objects from other insignificant objects. As such, Zuo Yong et al. [51] proposed a method for robust single-object image segmentation based on salient transition region that achieved better segmentation accuracy and robustness while maintaining simplicity and efficiency.
H. Soebhakti et al. [31] explained the implementation of YOLO V3 in a Barelang mobile soccer robot to detect objects. The experimental result shows the object detection gets 28.3 FPS under the experimental configurations with an Intel Core i7-7700HQ processor, 16 GB of RAM, and an NVIDIA GeForce GTX 1060 graphics card. J. Hu et al. [30] proposed a real-time detection application for helmet-wearing based on YOLO V3, packaging it into a real-time detection software with an early warning function, and successfully applying it to multiple construction sites. Related works [29,30,31,33] have shown that the YOLO algorithm used for object detection is faster and more accurate than other algorithms used in their respective experiments.
R. Scona et al. [52] proposed a robust, dense RGB-D SLAM method in a dynamic environment, detecting moving targets and simultaneously reconstructing the background structure. T. Zhang et al. [53] proposed a new dense RGB-D SLAM method, which can simultaneously complete dynamic/static segmentation, camera self-motion estimation, and static background reconstruction. Related works [54,55,56] have made contributions to the research of SLAM in dynamic environments and have been helpful in improving the robustness of the SLAM algorithm and improving the robot’s response-ability to the environment. In practical working scenes of mobile robots, the robots need to pay attention to not only dynamic objects be the key objects. If the robot focuses only on dynamic objects, it will ignore some key information for the robot in a purely static environment, such as the fixed prompt information and fixed high-risk objects in the walking path and robot view field. We have achieved semantic mapping of salient objects in the RGB-D and are not limited by whether they are static or dynamic objects. The dynamic objects were generally not used as a reference for robot repositioning but could be used to remind the obstacle avoidance of the robot against uncertain moving objects. The static objects were used for relative position reference for robot repositioning and further mapping, which helped improve mobile robots’ interaction and response-ability to the environment.

3. Salient Semantic Segmentation Methodology

This section gives a flowchart, as shown in Figure 1, of the algorithm proposed in this paper and illustrates each step. Besides, we describe the details of the proposed method, including three main components, salient object extraction from RGB images, salient object recognition in RGB-D images, and semantic segmentation of salient objects in RGB-D images.

3.1. Salient Object Extraction from RGB Images

We used a salient object detection method [24] that introduces a dynamic feature integration strategy to choose favored features dynamically in an end-to-end learning manner and runs at 57 FPS while producing good detection results. This dynamic strategy can largely ease architecture construction and promote the backbone to adjust its parameters for solving problems adaptively. Our prophase experiment verified the trained model’s good accuracy and stability. This study extracted the salient objects from the RGB-D image’s RGB part, which is the preprocessing step of the proposed algorithm.

3.2. Salient Object Recognition in RGB-D Image

We used YOLO V3 [25], a kind of neural network that uses a single-pipe strategy, and its training and prediction are both end-to-end. The neural network model has high speed, accuracy, and strong generalization ability for salient object recognition. We chose the salient objects often encountered in human–computer interaction scenes: persons, cars, and dogs, as the objects of recognition. Furthermore, we constructed the training and testing set of these three kinds of objects and kept the training and testing set’s features consistently used for neural network training and testing, respectively.
The performance of the neural network model we trained was evaluated based on the Duts dataset. The recognition experiments based on BDD 100K dataset analyzed the influencing factors of the experimental effect used for complex street scenes. The feasibility was demonstrated by semantic annotation experiments of salient objects in the RGB-D people dataset and shown by obtaining semantic information of generating point cloud experiments in the TUM dataset.

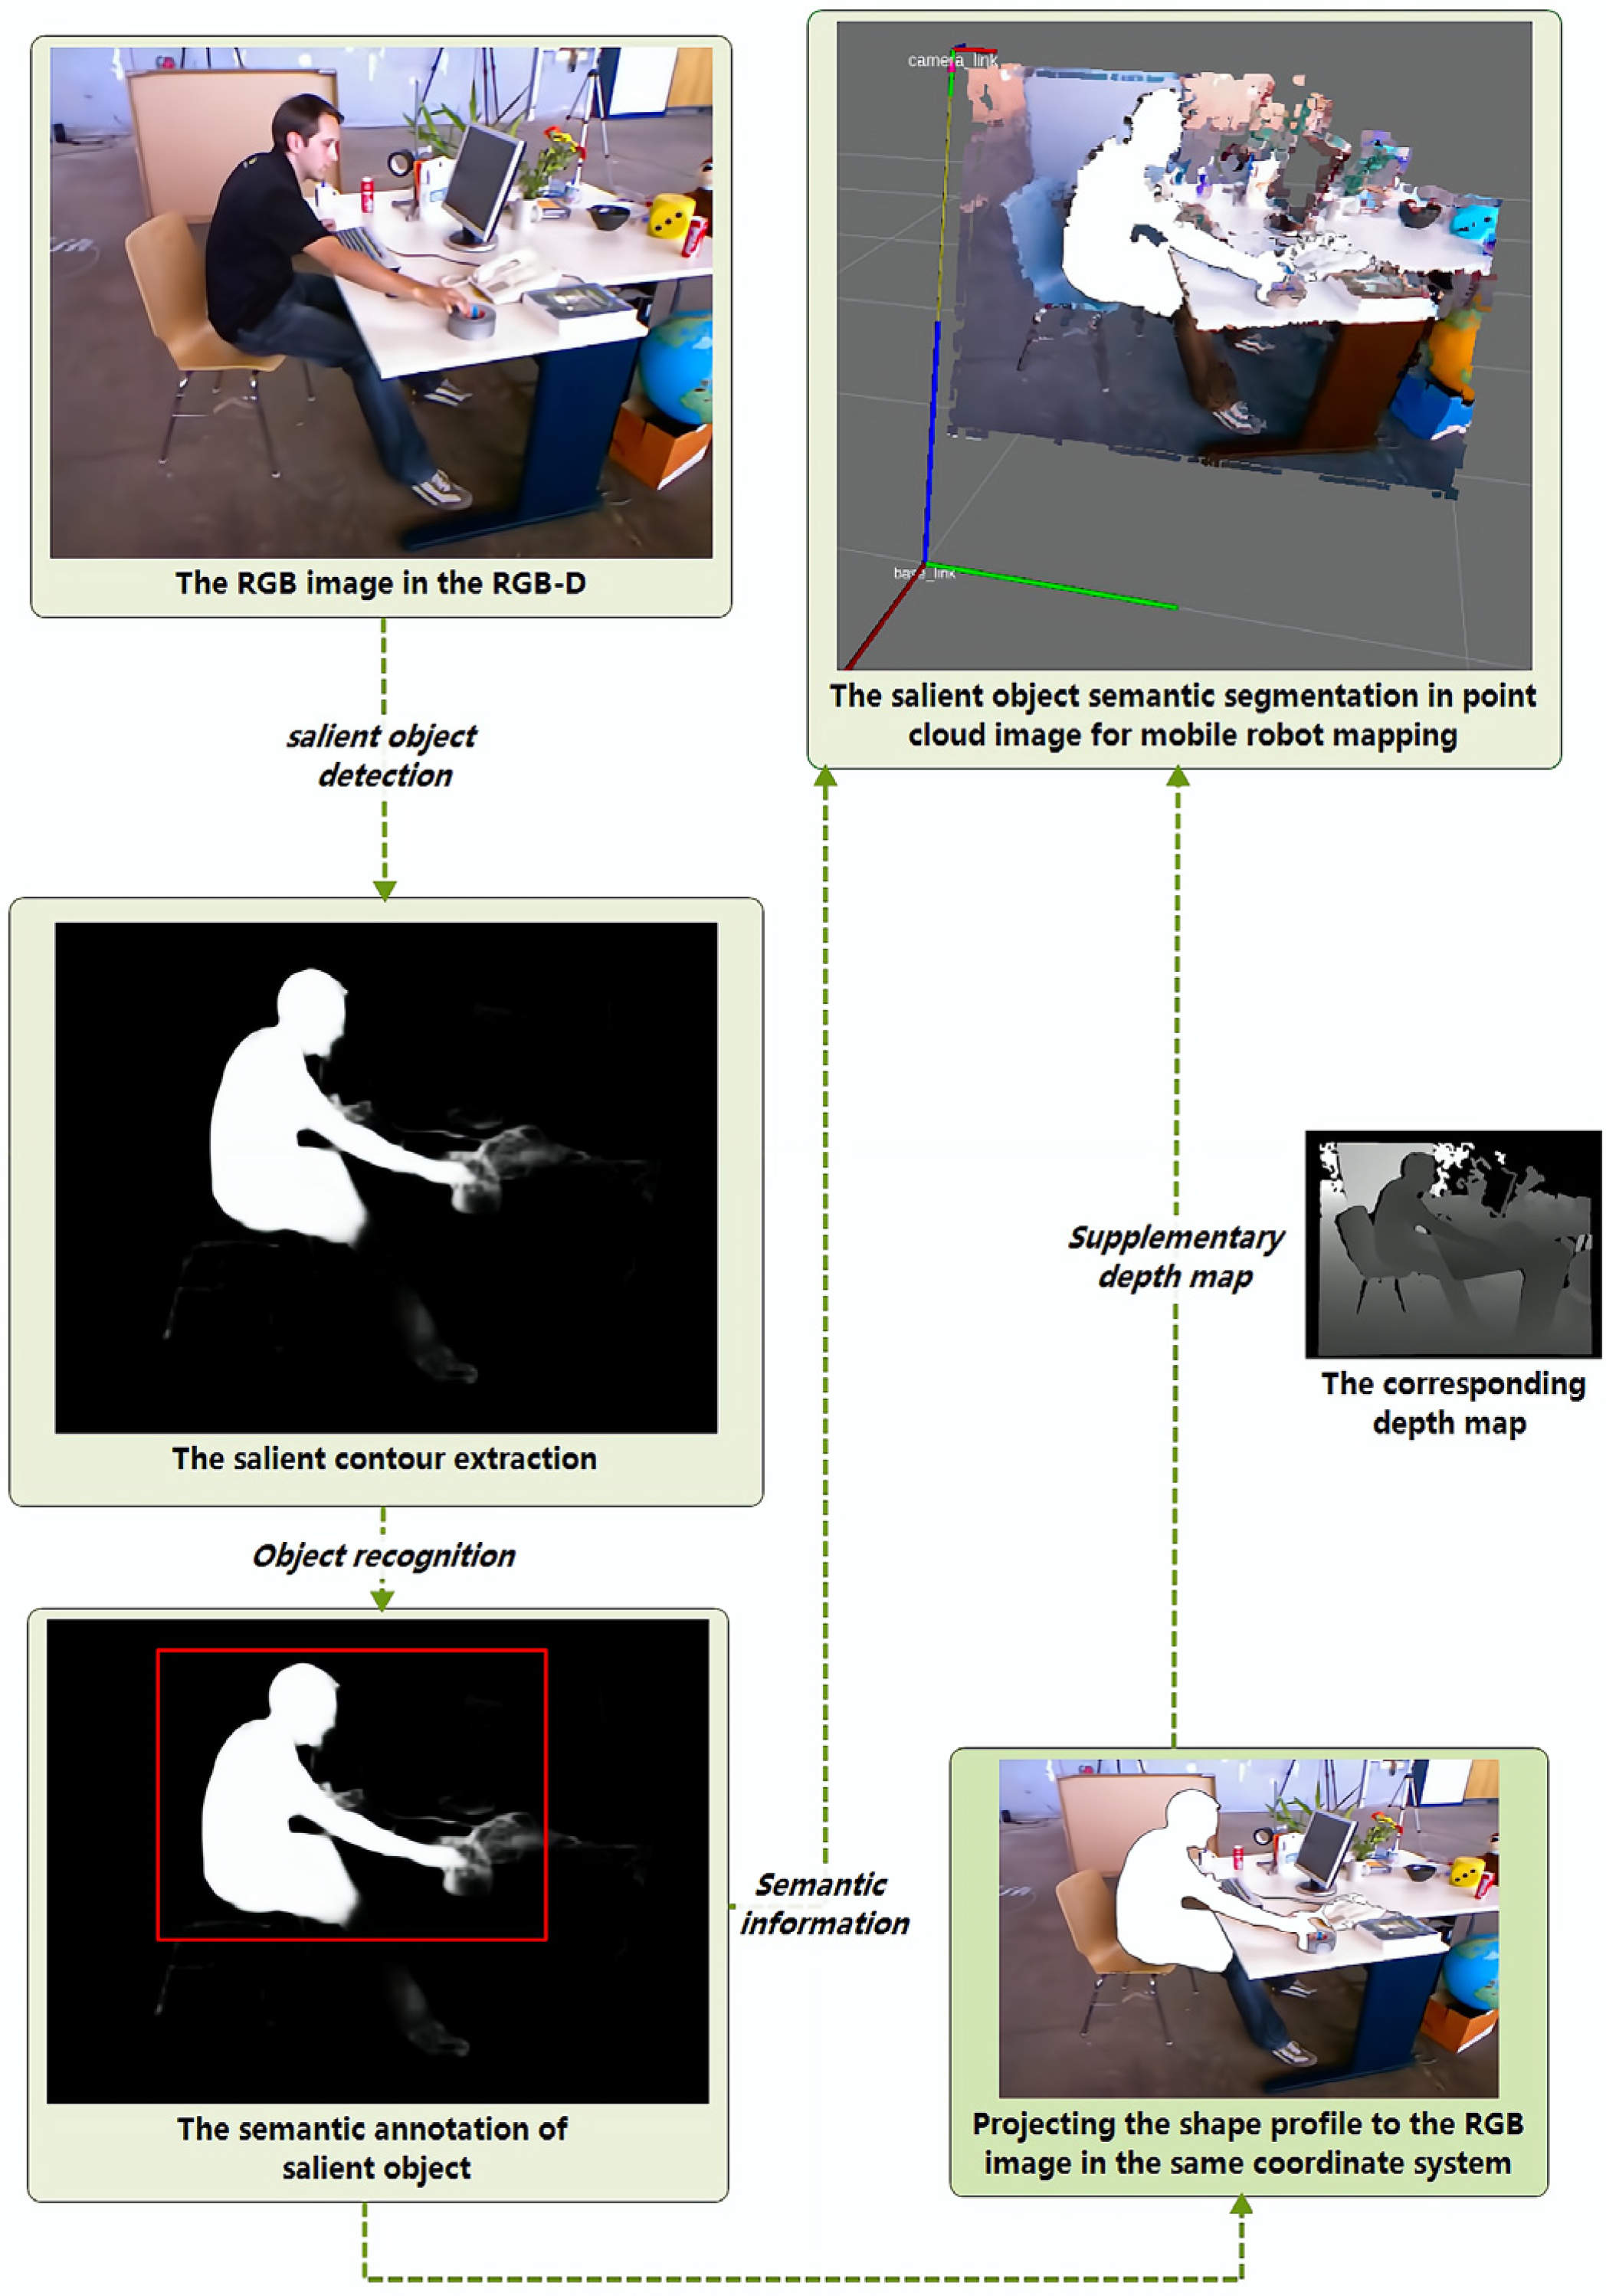
3.3. Semantic Segmentation of Salient Objects in RGB-D Images

Pixel-level salient object segmentation is more precise than the semantic annotation bounding box’s fuzzy location, which can accurately determine whether each pixel in an RGB-D image belongs to the salient object.
(1) Firstly, we placed the salient object grayscale image and its corresponding RGB image in the same coordinate system.
(2) Secondly, we projected the semantic information obtained from the grayscale image object recognition to the same place in the corresponding RGB image.
(3) We manually adjusted the RGB three-channel pixel values into any consistent color where the pixel values’ coordinates were consistent with the grayscale image’s coordinates at the place where the salient object(s)’ pixel values are greater than 200.
The proposed salient object pixel-level semantic segmentation based on object recognition and segmented contour was simple and could be further converted to a point cloud semantic map.

4. Experiments

This section describes the experimental details and conducted theoretical and experimental analyses. We explored its performance in different datasets by four kinds since there is no standard salient semantic segmentation dataset. Section 4.1 describes how to train the neural network model for recognizing persons, dogs, and cars. Then the performance is based on the random sampling from the DUTs and Stanford Cars training sets by the holdout verification method. Section 4.2.2 infers the influence factors on the neural network’s recognition performance based on the predicted confidence on the DUTs and Stanford cars dataset. Section 4.2.3 also studies the relationship between the predicted recognition confidence and the gray value imaging effect of salient objects in complex traffic scenes of the BDD 100k traffic scene dataset. In Section 4.2.4, we verify the feasibility of the proposed method based on the RGB-D people dataset and realize the semantic segmentation of salient objects in RGB images. Section 4.2.5 compares the speed and performance between our proposed algorithm and the related classic algorithms. Finally, Section 4.3 uses the TUM dataset to verify the feasibility of the proposed algorithm for generating point cloud images. The involved salient segmentation quality, except DUTS, depends on the segmentation quality of the salient object detection model. The acquisition of semantic information uses the model trained in this paper.

4.1. Training and Evaluation in the Training Data

4.1.1. Training Data

The data type used for the neural network training in this paper is the grayscale image containing salient objects’ contours. This paper mainly recognizes the grayscale images of people, cars, and dogs for the most human-computer interaction in life scenarios. We set up a training set of three types of object recognition. As shown in Table 1, the training set collected persons and dogs from the salient object detection dataset Duts-tr-mask and collected cars from the Cars dataset [57] because there are not enough car pictures in Duts-tr-mask [58]. The color image datasets are not grayscale images and cannot be used directly for the neural network. We randomly collected 224 person and dog images from the Duts-tr-mask, respectively. To ensure that the training sample size was uniform, we randomly collected 224 car images from the Cars dataset and transformed them into a grayscale image that masked the background by the salient object detection with only the car contour imaging. This randomly collected training set had three categories and each with 224 images. The requirement for the number of samples was not high because there were fewer categories for recognition. The contour shape feature in the grayscale image had fewer details that needed to be considered and was easily trained by the neural network.
These training data images were processed and resized into images with a resolution of 416 × 416, as the input requirements of the proposed network.

4.1.2. Network Model Parameters

We used the Keras-YOLO V3 model that downloads from GitHub [59] and the YOLO V3.weight that downloads from [60]. In terms of initialization, parameter settings are those in the .cfg configuration file. Since it was a grayscale image that needed to be recognized, we changed the Channel variable to 1. According to the computer’s memory situation, the Batch was set as 16, and the input images were resized to a resolution of 416 × 416. The Momentum of the network that affects the speed of gradient descent to the optimal value was set as 0.9. The weight Decay regularization represents the ability to suppress over-fitting was set as 0.0005. The Learning rate determines the speed of weight update. We set the learning rate higher at the beginning of training. The attenuation of the learning rate should be more than 100 times when the training is about to end; the initial learning rate was 0.001, and was reduced to 0.0001 and 0.0000.1 after 6400 and 7200, respectively. Since only three types of objects were involved, the maximum number of iterations max batches was set to 8008. Three types of objects needed to be identified in the experimental scene and Classes were set to 3. The above parameters were set according to the relevant work of YOLO V3 model training [61,62,63,64]. The main initialization parameters of the proposed network are listed in Table 2. The experimental configurations are shown in Table 3.

4.1.3. Model Evaluation

This section uses the Holdout verification method to evaluate the model. In all, 70% of the training set data in Table 1 were randomly selected for training. Moreover, the remaining 30% of the data were used to verify and evaluate the effectiveness of the model.
As shown in Table 4, the maximum value of the average F1 score of the neural network was 0.979 at the threshold of 0.7. Moreover, the F1 scores of persons, dogs, and cars were currently 0.977, 0.979, and 0.982. The F1 score is the calculation result of comprehensive consideration of model Precision and Recall. The larger the F1 value, the higher the model quality. The AP of persons, dogs, and cars were 0.970, 0.965, and 0.975, respectively, and their mAP (mean AP) was 0.970. The mAP is the index to measure the effect of the model, and it is the mean value of three kinds of AP. The larger the mAP value, the better the model performance. For object recognition, the AP value is the area under the P-R curve of a certain category, and the precision (P) and recall rate (R) can be calculated for the recognition of each object under different thresholds. Figure 2 is the P-R curve of the three categories’ average precision (P) and average recall (R).
The training set of the three objects proposed in this paper is not from the same dataset, but the AP and F1 scores of each class of objects were good when the threshold of the three objects’ recognition was set at 0.7. In addition to the F1 score, AP, and the relevant evaluation indicators, as shown in Table 4, the precision, recall, and accuracy were both good. Furthermore, the model has a processing speed of 23 consecutive frames per second (FPS) based on the experimental configuration, as shown in Table 3, which can be further improved by improving the hardware configurations. The main evaluation indicators show that the neural network model trained in this paper can be used in theory.
F1 is calculated by the following formula:
F 1 = 2 P R P + R .
The basis of F1-score and AP value calculation are Precision, Recall. We take the human category as an example to illustrate the calculation of the indicators, Precision, Recall, and Accuracy. (The AP value is the area under the P-R curve of a certain category.)
Precision = TP TP + FP   ,
where P is the Precision denotes the ratio of the real person sample among the total number of samples predicted to be the person (TP) to the total number of samples predicted to be the person (TP + FP) when at a certain threshold.
Recall = TP TP + FN   ,
where R is the Recall that denotes the predicted real person number (TP) ratio to the real total person number (TP + FN) when at a certain threshold.
Accuracy = TP + TN TP + TN + FP + FN   ,
where Accuracy denotes the proportion of all the correct predicted samples (TP + TN) to all the testing samples (TP + TN + FP + FN) when at a certain threshold.
In this article, our training samples were not large. We found that the model was only based on the contour shape feature in our experiments, which was easy to overfit and would worsen neural network generalization ability when the training samples were too large.

4.2. The Performance in the Testing Set Data

We have conducted sufficient experimental tests on various datasets and analyzed the performance results.

4.2.1. Testing Data

This study had four kinds of validation datasets for these three recognizable objects in our method, as shown in Table 5:
The four kinds of validation datasets include:
(1) A set of 50 pedestrian and 50 dog images were randomly collected from the Duts-te-mask, and 50 car images were randomly collected from the cars dataset test. (2) A set of 300 traffic scene images were randomly collected from the traffic scene BDD100k dataset. (3) A set of 100 RGB-D people images were randomly collected from the RGB-D people dataset. (4) A set of 100 RGB-D images were randomly collected from the RGB-D TUM dataset.
Persons, dogs, and cars belonged to the first kind of validation data; the traffic scene belonged to the second kind of validation data; RGB-D people belonged to the third kind of validation data; TUM belonged to the fourth kind of validation data. The details of various datasets are introduced as follows.
We have given a brief evaluation indicator of the neural network by the test set and conducted a detailed analysis. The first part of the test set, Table 5, and the training set, Table 1, was from the same type of database. There was no need to repeat the detailed performance indicators of the model evaluation. The second and third datasets were not used in the model evaluation detail because the detection and imaging effect of salient objects in the actual scene would directly affect the contour-based object recognition of the neural network. In this part, we propose recognizing salient object contour by YOLO V3 and applying the semantic information to salient object segmentation in mapping. We do not consider how to improve the imaging of salient object detection.
These testing data images were processed and resized into the image with a resolution of 416 × 416.

4.2.2. Salient Semantic Information in the Duts and Stanford Cars

The experiments of test set data show that the average recognition confidence of persons, dogs, and cars is 90.4%, 94.3, and 97.8%, respectively, based on the premise that we only count the confidence as actually this kind of object. Every object has other kinds of fallacious confidence and is not included in the calculation. In the experiment, our confidence threshold was set to 0.7. The detection accuracy of persons, dogs, and cars was 90.3%, 90.4%, and 94.8%, respectively, which was the proportion of all the correct predicted samples to all the testing samples. Object confidence may sometimes receive interference from the contour of other objects, as shown in multiple object images in Figure 3, Figure 4 and Figure 5. We selected 16 images with representative shapes for comparison and analyzed the neural network model’s generalization ability combined with the object recognition confidence change.
As shown in Figure 3, the recognition confidence of the half-length image of the first linewas generally low and could even be misjudged as a dog in the fourth image of the first line, which was far lower than the recognition confidence of the full-body contour of the third line. Because the half-length image could not effectively display the morphological characteristics of the person, the half-length image data of the person in our training set was less. The slight difference in the half-length image contour in the test dataset easily led to misjudgment. The second line is the confidence of the person’s recognition that they carry something with them, and there are high and low confidence levels. It can be seen that the confidence is higher when the person is spreading his limbs, such as the first in the second line. The confidence is slightly low when the person is walking sideways or bending the waist because the contour shape is overlapping in imaging, such as the second in the second line. The confidence is higher when a person’s half-body clamps the ball because there were similar images of the clamping ball in the training set, such as the third in the second line.
As shown in Figure 3, the confidence of the third row of images is better than that of the other rows because the whole body of the figure is imaged with more contour feature details used for recognition. In the fourth line of the atlas, if the distance between the people is too close will affect the recognition confidence, such as the low confidence of 0.190 in the first picture’s second child of the fourth line and the low confidence of 0.458 in the fourth picture’s second person of the fourth line. At this time, recognizing the contour of one person will receive interference from the other person’s contours when there are multiple objects with close contours in a picture. There is usually more than one contour in one predicted bounding box, such as the one in the second picture of the fourth row.
As shown in Figure 4, the confidence in car recognition is the highest in our object recognition. This is because the contour shape features of the car are relatively simple compared to the person and dog. Experiments show that the recognition confidence of the cars is high no matter the view from the side or front. When multiple cars are recognized from one picture, the confidence level drops severely and cannot even be recognized. As such, the car on the right of the fourth line’s first picture is recognized as the car with a confidence of 0.729, and the positioning accuracy of the predicted bounding box is not accurate, which contains the contour of the other car. The car at the below side in the fourth line’s second picture has a confidence level of 0.855 because, with the contour of other cars, both are recognized as a whole with one bounding box, compared with the third and fourth picture of the fourth line is lower.
As shown in Figure 5, the confidence in dog recognition is high, even if there is only a half-length image in the second line. The average confidence of the two dogs in one image of the fourth line is higher than that of the multiple persons and cars in one image. Because the training set involves the dog with various contour features, including the contour of the half-length image, the contour of the dog is highly identifiable. Regarding the result of these three kinds of object recognition performance, our dataset used for training is characterized by artificially randomly collecting some datasets rather than a specialized grayscale image dataset used for contour recognition. The random selection makes the contour feature details in the training set unable to be included totally. Some contour feature details of the training and test set are inconsistent. This is why other objects perform well in training and not so well in the tests.
The experimental results show that the neural network trained in this paper is based on the clear grayscale image of salient objects, which can be effectively used to detect persons, cars, and dogs. The confidence performance of the test set depends on whether the morphological contour features of the training set are similar to the test set. The experimental results show that more training sets are needed for the neural network when the contour features difference between the two kinds of objects is not obvious. Such as, the contour features difference between the half-length image of a dog and a person is not obvious. The confidence of the half-length image of the person is easily followed closely by the confidence of the dog. Their contour curves have some similarities and cannot be 100% distinguished by our model, which needs more datasets used for training.

4.2.3. Salient semantic information in the BDD100k

We also tested object recognition in complex traffic scenes. Our experiment demonstrates that the confidence level of object recognition mainly depends on whether the contour shape is clear. The images collected from the BDD100K were converted to grayscale, as shown in Figure 6. We randomly selected 300 images for testing.
We counted the Average confidence of object recognition in different situations when multiple salient object contours had different imaging effects on one picture, as shown in Table 6. Here we only counted the object’s confidence that was actually this kind of object because an object usually has multiple categories of confidence.
The experiment in this part demonstrates that the recognition of objects in outdoor scenes largely depends on the effect of salient object detection. When the contour of the salient object in the grayscale image was clearer, the confidence was higher, as shown in Figure 6 and Figure 7, no matter whether it was a single car or multiple cars in an image. As long as the object contour features were clear, it could have high confidence. When the contour of the image was more blurred or incomplete, the confidence was lower. Moreover, when the contour occlusion was more serious, confidence was lower.

4.2.4. Salient Semantic Segmentation in RGB-D People Dataset

In this part, we used the indoor RGB-D people dataset [66,67], an indoor life scene, to verify the practical usability of the proposed algorithm.

Semantic Annotation

We recognized salient objects in RGB images based on the work above, as shown in Figure 8.
(1) Firstly, we transformed the walking person RGB-D image’s RGB part into a grayscale image.
(2) Secondly, we took the grayscale image as the input image of the trained neural network to obtain the semantic information and predicted bounding boxes.
(3) Thirdly, we obtained the salient objects’ semantic annotation information in the RGB image by projecting the semantic annotations with bounding boxes from the greyscale image to the same coordinate position in the RGB image under the same coordinate system.

Salient Semantic Segmentation

As shown in Figure 9, we put the grayscale and RGB images into the same coordinate system and ensured that the two pictures were the same size. To achieve the salient semantic segmentation of the RGB image at the pixel level, we adopted a method by setting the pixel values of the RGB image’s two walking persons to any three-channel consistent values. This method completely differs from the pixel-level semantic segmentation based on neural network architecture.
The realization of the salient semantic segmentation is achieved by the following steps.
(1) Ensure that the size of the grayscale image containing the salient objects with semantic information is consistent with the corresponding RGB image.
(2) The two images are placed in the same coordinate system. The X-axis and Y-axis represent the width and height of the images, respectively. The image sizes in Figure 8 are both 480 × 640.
(3) The RGB three-channel value can be set into any value at the place where the RGB image’s coordinates are the same as the grayscale image’s gray values’ coordinates of more than 200. As shown in Figure 9b, we set the values of the salient objects’ three channels in the RGB image to 255, 255, and 255.
The experimental results show that the proposed algorithm depends on the imaging effect of the salient object. When the imaging of the salient gray value images is clear and without occlusion, the imaging quality, as shown in Figure 9, the average correct predicted confidence is 0.925.

4.2.5. Speed and Performance Comparison

We also compared the real-time performance of our proposed salient semantic segmentation with the related Highly Cited Models in semantic segmentation.
We pay attention to the real-time performance and manually label the 100 BDD100k images’ ground truth used for salient semantic segmentation testing. The real-time of our proposed method in Table 7 is the performance of the proposed method in high-resolution images and general GPU speed. Similarly, FPS can be improved by using a lower image input resolution and a more powerful GPU. In theory, it could reach 33 FPS under the condition of image size 224 × 224 and Titan GPU.
The work performance improvement of neural networks for semantic segmentation usually means sacrificing real-time performance. As shown in Table 7, good semantic segmentation performance is not good enough in real-time performance. We integrated the excellent performance and good real-time model [24] and model [25] to solve the real-time problem of salient semantic segmentation while retaining the excellent performance of the two models, as shown in Table 8.
We manually labeled the 100 BDD100k testing part’s ground truths for salient semantic segmentation testing. The saliency detection of these images has a clear contour, as shown in Figure 7. Other classical semantic segmentation algorithms used for comparison are based on the ground truth of the 100 images with semantic segmentation annotations from the BDD100K testing part for the three-class objects’ test calculations. To compare the quantitative performance of our method and the related highly cited algorithms, we used three commonly used performance measures to illustrate.
The relevant experimental details were as above in Table 9. In order to facilitate horizontal comparison, we made the same experimental arrangement as much as possible. These semantic segmentation neural networks are trained based on 224 BDD100K images (randomly selected from the training part with semantic segmentation annotations of BDD100K). The training segmentation targets are also three types of objects. The image 10K datasets in BDD100K can be used for semantic segmentation training and testing, and the per picture has 5.9 cars, 5.8 poles, and 1.8 traffic signs on average. BDD100k image contains more objects and types. Although there are only 224 images, it contains more training information than the dataset used in our method. Our training dataset differs from BDD100k because our algorithm only needs object recognition training and does not require semantic-level annotation. The salient objects in DUTS and Cars are imaging larger, there is only one kind of object in an image, and the details of contour features are detailed. It is easy to implement salient object detection and carry object recognition training. Through the comparison, we can know that our proposed algorithm is easier to realize the model’s training and has better real-time speed and performance. Our method avoids the bottleneck challenge of semantic segmentation and provides a new way to label mobile robot semantic information.

4.3. Converting RGB-D Image to Point Cloud

Here we further used the TUM dataset [68] to verify the feasibility of the proposed algorithm for generating point cloud images after the salient objects in the RGB-D image’s RGB part were segmented.
We selected 100 images from the TUM dataset and separated the salient objects with semantics from the RGB image background by the method proposed in this article. The white color represents the salient objects with pixel values of 255, as shown in Figure 10, the semantic segmented RGB image and the Corresponding original RGB image are combined with the depth information map to generate point cloud images, respectively. Through experimental comparison, the proposed algorithm in this article could achieve the semantic segmentation of the salient objects in the point cloud image with a 100% success rate as long as there was a salient semantic segmented RGB image and the corresponding depth image. The point cloud map can be formed by accumulating the image frame by frame used for the relative position reference in robot repositioning and further mapping.

5. Conclusions

We propose a method for salient semantic segmentation in the mapping process based on the mobile robot RGB-D camera. The primary motivation behind salient semantic segmentation is that the semantic segmentation of key objects can reduce the calculation amount and bypass the bottleneck problems that conventional semantic segmentation faces.
We tested the trained neural network YOLO V3 on the various datasets, as shown in Table 5. The main YOLO V3 performance evaluation and test were carried out with the objects data persons, dogs, and cars. The traffic scene BDD 100K containing complex traffic scenes and RGB-D people containing indoor pedestrian scenes, respectively, were used to verify the usability of the proposed method. We found that the good performance of salient object recognition depended on the salient object detection’s imaging effect. Further, the salient object detection’s imaging effect affected the salient object contour’s segmentation quality and the point cloud’s segmentation effect. If the salient object detection’s imaging effect is too bad will limit the proposed method. Finally, the TUM dataset was used to verify the feasibility of our method for generating point cloud images. This is based on using salient objects to replace semantic segmentation of all the obstacles, which can save the calculation amount and bypass the semantic segmentation bottleneck problems, providing a technical reference for real-time semantic segmentation algorithm in mobile robot mapping. The comparative experiments show that our method is easier to train and effectively segment salient objects with semantic information and can further transform them into semantic landmarks in the 3D point cloud map. The landmarks can provide relative position references for robot repositioning, further mapping, path planning, and improving human-computer interaction.

Author Contributions

Conceptualization, L.H. and Y.Z.; methodology, L.H.; software, H.Y. and L.H.; validation, L.H., Y.W. and Y.Z.; formal analysis, Y.W.; investigation, L.H. and S.T.; resources, S.T.; data curation, H.Y.; writing—original draft preparation, L.H.; writing—review and editing, L.H.; visualization, Y.W.; supervision, Y.Z. and L.H.; project administration, Y.Z.; funding acquisition, Y.Z. All authors have read and agreed to the published version of the manuscript.

Funding

This research is supported in part by the Research Project of China Disabled Persons Federation on assistive technology under Grant 2022CDPFAT-01, in part by the Science and Technology Planning Project of Chongqing Changshou District under Grant cskj2022014, in part by the National Nature Science Foundation of China under Grant 51775076, 51905065.

Institutional Review Board Statement

Not applicable.

Informed Consent Statement

Not applicable.

Data Availability Statement

The data used to support the findings of this study are available from the corresponding author upon request.

Conflicts of Interest

The authors declare that they have no known competing financial interests or personal relationships that could have appeared to influence the work reported in this paper.

References

  1. Lai, L.; Yu, X.; Qian, X.; Ou, L. 3D Semantic Map Construction System Based on Visual SLAM and CNNs. In Proceedings of the IECON 2020 The 46th Annual Conference of the IEEE Industrial Electronics Society, Singapore, 18–21 October 2020. [Google Scholar] [CrossRef]
  2. Balaska, V.; Bampis, L.; Kansizoglou, I.; Gasteratos, A. Enhancing satellite semantic maps with ground-level imagery. Robot. Auton. Syst. 2021, 139, 103760. [Google Scholar] [CrossRef]
  3. Li, J.; Zhang, X.; Li, J.; Liu, Y.; Wang, J. Building and optimization of 3D semantic map based on Lidar and camera fusion. Neurocomputing 2020, 409, 394–407. [Google Scholar] [CrossRef]
  4. Wang, W.; Yang, J.; You, X. Combining ElasticFusion with PSPNet for RGB-D Based Indoor Semantic Mapping. In Proceedings of the 2018 Chinese Automation Congress (CAC), Xi’an, China, 30 November–2 December 2018. [Google Scholar] [CrossRef]
  5. Long, J.; Shelhamer, E.; Darrell, T. Fully convolutional networks for semantic segmentation. In Proceedings of the IEEE Conference on Computer Vision and Pattern Recognition (CVPR), Boston, MA, USA, 7–12 June 2015. [Google Scholar] [CrossRef] [Green Version]
  6. Zhao, H.; Shi, J.; Qi, X.; Wang, X.; Jia, J. Pyramid scene parsing network. In Proceedings of the 30th IEEE Conference on Computer Vision and Pattern Recognition (CVPR), Honolulu, HI, USA, 21–26 July 2017. [Google Scholar] [CrossRef] [Green Version]
  7. Chen, L.-C.; Papandreou, G.; Kokkinos, I.; Murphy, K.; Yuille, A.L. DeepLab: Semantic Image Segmentation with Deep Convolutional Nets, Atrous Convolution, and Fully Connected CRFs. IEEE Trans. Pattern Anal. Mach. Intell. 2018, 40, 834–848. [Google Scholar] [CrossRef] [Green Version]
  8. Badrinarayanan, V.; Kendall, A.; Cipolla, R. Segnet: A deep convolutional encoder-decoder architecture for image segmentation. IEEE Trans. Pattern Anal. Mach. Intell. 2017, 39, 2481–2495. [Google Scholar] [CrossRef]
  9. Yin, R.; Cheng, Y.; Wu, H.; Song, Y.; Yu, B.; Niu, R. FusionLane: Multi-Sensor Fusion for Lane Marking Semantic Segmentation Using Deep Neural Networks. IEEE Trans. Intell. Transp. Syst. 2020, 23, 1543–1553. [Google Scholar] [CrossRef]
  10. Jokić, A.; Petrović, M.; Miljković, Z. Semantic segmentation based stereo visual servoing of nonholonomic mobile robot in intelligent manufacturing environment. Expert Syst. Appl. 2022, 190, 116203. [Google Scholar] [CrossRef]
  11. Wang, S.; Wang, H.; She, S.; Zhang, Y.; Qiu, Q.; Xiao, Z. Swin-T-NFC CRFs: An encoder–decoder neural model for high-precision UAV positioning via point cloud super resolution and image semantic segmentation. Comput. Commun. 2023, 197, 52–60. [Google Scholar] [CrossRef]
  12. Zhang, B.; Kong, Y.; Leung, H.; Xing, S. Urban UAV Images Semantic Segmentation Based on Fully Convolutional Networks with Digital Surface Models. In Proceedings of the 2019 Tenth International Conference on Intelligent Control and Information Processing (ICICIP), Marrakesh, Morocco, 14–19 December 2019. [Google Scholar] [CrossRef]
  13. Hernandez, A.C.; Gomez, C.; Barber, R.; Mozos, O.M. Exploiting the confusions of semantic places to improve service robotic tasks in indoor environments. Robot. Auton. Syst. 2023, 159, 104290. [Google Scholar] [CrossRef]
  14. Wang, Z.; Tian, G. Hybrid offline and online task planning for service robot using object-level semantic map and probabilistic inference. Inf. Sci. 2022, 593, 78–98. [Google Scholar] [CrossRef]
  15. Miller, I.D.; Soussan, R.; Coltin, B.; Smith, T.; Kumar, V. Robust semantic mapping and localization on a free-flying robot in microgravity. In Proceedings of the 2022 International Conference on Robotics and Automation (ICRA), Philadelphia, PA, USA, 23–27 May 2022; pp. 4121–4127. [Google Scholar]
  16. Kaneko, M.; Iwami, K.; Ogawa, T.; Yamasaki, T.; Aizawa, K. Mask-SLAM: Robust feature-based monocular SLAM by masking using semantic segmentation. In Proceedings of the IEEE Conference on Computer Vision and Pattern Recognition (CVPR) Workshops, Salt Lake City, UT, USA, 18–22 June 2018. [Google Scholar] [CrossRef]
  17. Wei, L.; Zong, G. EGA-Net: Edge feature enhancement and global information attention network for RGB-D salient object detection. Inf. Sci. 2023, 626, 223–248. [Google Scholar] [CrossRef]
  18. Wang, W.; Zhao, S.; Shen, J.; Hoi, S.C.H.; Borji, A. Salient object detection with pyramid attention and salient edges. In Proceedings of the IEEE/CVF Conference on Computer Vision and Pattern Recognition (CVPR), Long Beach, CA, USA, 18–22 June 2019. [Google Scholar] [CrossRef]
  19. Fang, Y.; Zhang, H.; Yan, J.; Jiang, W.; Liu, Y. UDNet: Uncertainty-aware deep network for salient object detection. Pattern Recognit. 2023, 134, 109099. [Google Scholar] [CrossRef]
  20. Hu, L.; Zhang, Y.; Wang, Y.; Jiang, Q.; Ge, G.; Wang, W. A simple information fusion method provides the obstacle with saliency labeling as a landmark in robotic mapping. Alex. Eng. J. 2022, 61, 12061–12074. [Google Scholar] [CrossRef]
  21. Hu, L.; Zhang, Y.; Wang, Y.; Ge, G.; Wang, W. Salient Preprocessing: Robotic ICP Pose Estimation Based on SIFT Features. Machines 2023, 11, 157. [Google Scholar] [CrossRef]
  22. Zhou, B.; Zhao, H.; Puig, X.; Xiao, T.; Fidler, S.; Barriuso, A.; Torralba, A. Semantic Understanding of Scenes Through the ADE20K Dataset. Int. J. Comput. Vis. 2019, 127, 302–321. [Google Scholar] [CrossRef] [Green Version]
  23. Huang, X.; Zhang, Y.-J. 300-FPS Salient Object Detection via Minimum Directional Contrast. IEEE Trans. Image Process. 2017, 26, 4243–4254. [Google Scholar] [CrossRef]
  24. Liu, J.-J.; Hou, Q.; Cheng, M.-M. Dynamic Feature Integration for Simultaneous Detection of Salient Object, Edge, and Skeleton. IEEE Trans. Image Process. 2020, 29, 8652–8667. [Google Scholar] [CrossRef] [PubMed]
  25. Redmon, J.; Farhadi, A. YOLO v.3: Incremental Improvement. arXiv 2018, arXiv:1804.02767. [Google Scholar]
  26. Lyu, H.; Fu, H.; Hu, X.; Liu, L. Esnet: Edge-Based Segmentation Network for Real-Time Semantic Segmentation in Traffic Scenes. In Proceedings of the 2019 IEEE International Conference on Image Processing (ICIP), Taipei, Taiwan, 22–25 September 2019. [Google Scholar] [CrossRef]
  27. Cruz, J.P.N.; Dimaala, M.L.; Francisco, L.G.L.; Franco, E.J.S.; Bandala, A.A.; Dadios, E.P. Object recognition and detection by shape and color pattern recognition utilizing Artificial Neural Networks. In Proceedings of the 2013 International Conference of Information and Communication Technology (ICoICT), Bandung, Indonesia, 20–22 March 2013. [Google Scholar] [CrossRef]
  28. Wu, J.; Xiao, Z. Video surveillance object recognition based on shape and color features. In Proceedings of the 2010 3rd International Congress on Image and Signal Processing, Yantai, China, 16–18 October 2010. [Google Scholar] [CrossRef]
  29. Murugesan, M.; Arieth, R.M.; Balraj, S.; Nirmala, R. Colon cancer stage detection in colonoscopy images using YOLOv3 MSF deep learning architecture. Biomed. Signal Process. Control 2023, 80, 104283. [Google Scholar] [CrossRef]
  30. Hu, J.; Gao, X.; Wu, H.; Gao, S. Detection of Workers without the Helments in Videos Based on YOLO V3. In Proceedings of the 2019 12th International Congress on Image and Signal Processing, BioMedical Engineering and Informatics (CISP-BMEI), Suzhou, China, 9–21 October 2019. [Google Scholar] [CrossRef]
  31. Soebhakti, H.; Prayoga, S.; Fatekha, R.A.; Fashla, M.B. The Real-Time Object Detection System on Mobile Soccer Robot using YOLO v3. In Proceedings of the 2019 2nd International Conference on Applied Engineering (ICAE), Batam, Indonesia, 2–3 October 2019. [Google Scholar] [CrossRef]
  32. Lan, W.; Dang, J.; Wang, Y.; Wang, S. Pedestrian detection based on yolo network model. In Proceedings of the 2018 IEEE International Conference on Mechatronics and Automation (ICMA), Changchun, China, 5–8 August 2018. [Google Scholar] [CrossRef]
  33. Shen, L.; Tao, H.; Ni, Y.; Wang, Y.; Vladimir, S. Improved YOLOv3 model with feature map cropping for multi-scale road object detection. Meas. Sci. Technol. 2023, 34. [Google Scholar] [CrossRef]
  34. Li, Y.; Zhang, X.; Shen, Z. YOLO-Submarine Cable: An Improved YOLO-V3 Network for Object Detection on Submarine Cable Images. J. Mar. Sci. Eng. 2022, 10, 1143. [Google Scholar] [CrossRef]
  35. Liu, H.; Duan, X.; Chen, H.; Lou, H.; Deng, L. DBF-YOLO: UAV Small Targets Detection Based on Shallow Feature Fusion. IEEJ Trans. Electr. Electron. Eng. 2023. [CrossRef]
  36. Xie, W.; Liu, P.X.; Zheng, M. Moving Object Segmentation and Detection for Robust RGBD-SLAM in Dynamic Environments. IEEE Trans. Instrum. Meas. 2021, 70, 5001008. [Google Scholar] [CrossRef]
  37. Sun, Y.; Liu, M.; Meng, M.Q.-H. Motion removal for reliable RGB-D SLAM in dynamic environments. Robot. Auton. Syst. 2018, 108, 115–128. [Google Scholar] [CrossRef]
  38. Yuan, J.; Zhu, S.; Tang, K.; Sun, Q. ORB-TEDM: An RGB-D SLAM Approach Fusing ORB Triangulation Estimates and Depth Measurements. IEEE Trans. Instrum. Meas. 2022, 71, 5006315. [Google Scholar] [CrossRef]
  39. Fu, Q.; Yu, H.; Lai, L.; Wang, J.; Peng, X.; Sun, W.; Sun, M. A Robust RGB-D SLAM System With Points and Lines for Low Texture Indoor Environments. IEEE Sensors J. 2019, 19, 9908–9920. [Google Scholar] [CrossRef]
  40. Chen, Y.; Ma, Y.; Kim, D.H.; Park, S.-K. Region-Based Object Recognition by Color Segmentation Using a Simplified PCNN. IEEE Trans. Neural Networks Learn. Syst. 2015, 26, 1682–1697. [Google Scholar] [CrossRef]
  41. Sasano, S.; Han, X.H.; Chen, Y.W. Food recognition by combined bags of color features and texture features. In Proceedings of the 2016 9th International Congress on Image and Signal Processing, BioMedical Engineering and Informatics (CISP-BMEI), Datong, China, 15–17 October 2016. [Google Scholar] [CrossRef]
  42. Gupta, S.; Singh, Y.J.; Kumar, M. Object detection using multiple shape-based features. In Proceedings of the 2016 Fourth International Conference on Parallel, Distributed and Grid Computing (PDGC), Waknaghat, India, 22–24 December 2016. [Google Scholar] [CrossRef]
  43. Le, M.H.; Deb, K.; Jo, K.H. Recognizing outdoor scene objects using texture features and probabilistic appearance model. In Proceedings of the ICCAS 2010, Gyeonggi-do, Republic of Korea, 27–30 October 2010. [Google Scholar] [CrossRef]
  44. Garcia, F.; Cervantes, J.; Lopez, A.; Alvarado, M. Fruit Classification by Extracting Color Chromaticity, Shape and Texture Features: Towards an Application for Supermarkets. IEEE Lat. Am. Trans. 2016, 14, 3434–3443. [Google Scholar] [CrossRef]
  45. Zuo, G.; Zheng, T.; Xu, Z.; Gong, D. A dense segmentation network for fine semantic mapping. In Proceedings of the 2019 IEEE International Conference on Robotics and Biomimetics (ROBIO), Dali, China, 6–8 December 2019. [Google Scholar] [CrossRef]
  46. Zhang, C.; Liu, Z.; Liu, G.; Huang, D. Large-Scale 3D Semantic Mapping Using Monocular Vision. In Proceedings of the 2019 IEEE 4th International Conference on Image, Vision and Computing (ICIVC), Xiamen, China, 5–7 July 2019. [Google Scholar] [CrossRef]
  47. Wu, Z.; Shen, C.; Hengel, A.V.D. Real-time semantic image segmentation via spatial sparsity. arXiv 2017, arXiv:1712.00213. [Google Scholar]
  48. Romera, E.; Alvarez, J.M.; Bergasa, L.M.; Arroyo, R. Efficient ConvNet for real-Time semantic segmentation. In Proceedings of the 2017 IEEE Intelligent Vehicles Symposium (IV), Los Angeles, CA, USA, 11–14 June 2017. [Google Scholar] [CrossRef]
  49. Siam, M.; Gamal, M.; Abdel-Razek, M.; Yogamani, S.; Jagersand, M.; Zhang, H. A comparative study of real-time semantic segmentation for autonomous driving. In Proceedings of the IEEE Conference on Computer Vision and Pattern Recognition (CVPR) Workshops, Salt Lake City, UT, USA, 18–22 June 2018. [Google Scholar] [CrossRef]
  50. Briot, A.; Viswanath, P.; Yogamani, S. Analysis of efficient CNN design techniques for semantic segmentation. In Proceedings of the IEEE Conference on Computer Vision and Pattern Recognition (CVPR) Workshops, Salt Lake City, UT, USA, 18–22 June 2018. [Google Scholar] [CrossRef]
  51. Li, Z.; Liu, G.; Zhang, D.; Xu, Y. Robust single-object image segmentation based on salient transition region. Pattern Recognit. 2016, 52, 317–331. [Google Scholar] [CrossRef]
  52. Scona, R.; Jaimez, M.; Petillot, Y.R.; Fallon, M.; Cremers, D. StaticFusion: Background Reconstruction for Dense RGB-D SLAM in Dynamic Environments. In Proceedings of the 2018 IEEE International Conference on Robotics and Automation (ICRA), Brisbane, Australia, 21–25 May 2018. [Google Scholar] [CrossRef]
  53. Zhang, T.; Zhang, H.; Li, Y.; Nakamura, Y.; Zhang, L. FlowFusion: Dynamic Dense RGB-D SLAM Based on Optical Flow. In Proceedings of the 2020 IEEE International Conference on Robotics and Automation (ICRA), Paris, France, 31 May–31 August 2020. [Google Scholar] [CrossRef]
  54. Yu, C.; Liu, Z.; Liu, X.-J.; Xie, F.; Yang, Y.; Wei, Q.; Fei, Q. DS-SLAM: A Semantic Visual SLAM towards Dynamic EnvironmentsIn Proceedings of the 2018 IEEE/RSJ International Conference on Intelligent Robots and Systems (IROS), Madrid, Spain, 1–5 October 2018. [CrossRef] [Green Version]
  55. Yang, S.; Wang, J.; Wang, G.; Hu, X.; Zhou, M.; Liao, Q. Robust RGB-D SLAM in dynamic environment using faster R-CNN. In Proceedings of the 2017 3rd IEEE International Conference on Computer and Communications (ICCC), Chengdu, China, 13–16 December 2017. [Google Scholar] [CrossRef]
  56. Xiao, L.; Wang, J.; Qiu, X.; Rong, Z.; Zou, X. Dynamic-SLAM: Semantic monocular visual localization and mapping based on deep learning in dynamic environment. Robot. Auton. Syst. 2019, 117, 1–16. [Google Scholar] [CrossRef]
  57. Krause, J.; Stark, M.; Deng, J.; Fei-Fei, L. 3D object representations for fine-grained categorization. In Proceedings of the IEEE International Conference on Computer Vision (ICCV) Workshops, Sydney, Australia, 3–6 December 2013. [Google Scholar] [CrossRef]
  58. Wang, L.; Lu, H.; Wang, Y.; Feng, M.; Wang, D.; Yin, B.; Ruan, X. Learning to detect salient objects with image-level supervision. In Proceedings of the 30th IEEE Conference on Computer Vision and Pattern Recognition (CVPR), Honolulu, HI, USA, 21–26 July 2017. [Google Scholar] [CrossRef]
  59. Phillip, K.S.; Chu, A. Keras Implementation of YOLOv3 (Tensorflow Backend). Available online: https://github.com/qqwweee/keras-yolo3 (accessed on 18 February 2018).
  60. Redmon, J.; Farhadi, A. YOLO: Real-Time Object Detection. Available online: https://pjreddie.com/media/files/yolov3.weights (accessed on 18 February 2018).
  61. Zhu, C.; Liang, J.; Zhou, F. Transfer learning-based YOLOv3 model for road dense object detection. J. Electron. Imaging 2023, 32, 062505. [Google Scholar] [CrossRef]
  62. Lam, L.; George, M.; Gardoll, S.; Safieddine, S.; Whitburn, S.; Clerbaux, C. Tropical Cyclone Detection from the Thermal Infrared Sensor IASI Data Using the Deep Learning Model YOLOv3. Atmosphere 2023, 14, 215. [Google Scholar] [CrossRef]
  63. Geng, K.; Yin, G. Using Deep Learning in Infrared Images to Enable Human Gesture Recognition for Autonomous Vehicles. IEEE Access 2020, 8, 88227–88240. [Google Scholar] [CrossRef]
  64. Hu, Y.; Wu, X.; Zheng, G.; Liu, X. Object detection of UAV for anti-UAV based on improved YOLO v3. In Proceedings of the 2019 Chinese Control Conference (CCC), Guangzhou, China, 27–30 July 2019. [Google Scholar] [CrossRef]
  65. Yu, F.; Chen, H.; Wang, X.; Xian, W.; Chen, Y.; Liu, F.; Madhavan, V.; Darrell, T. BDD100K: A Diverse Driving Dataset for Heterogeneous Multitask Learning. In Proceedings of the 2020 IEEE/CVF Conference on Computer Vision and Pattern Recognition (CVPR), Seattle, WA, USA, 13–19 June 2020. [Google Scholar] [CrossRef]
  66. Spinello, L.; Arras, K.O. People detection in RGB-D data. In Proceedings of the 2011 IEEE/RSJ International Conference on Intelligent Robots and Systems, San Francisco, CA, USA, 25–30 September 2011. [Google Scholar] [CrossRef]
  67. Luber, M.; Spinello, L.; Arras, K.O. People tracking in RGB-D data with on-line boosted target models. In Proceedings of the 2011 IEEE/RSJ International Conference on Intelligent Robots and Systems, San Francisco, CA, USA, 25–30 September 2011. [Google Scholar]
  68. Sturm, J.; Engelhard, N.; Endres, F.; Burgard, W.; Cremers, D. A benchmark for the evaluation of RGB-D SLAM systems. In Proceedings of the 2012 IEEE/RSJ International Conference on Intelligent Robots and Systems, Vilamoura-Algarve, Portugal, 7–12 October 2012. [Google Scholar] [CrossRef] [Green Version]
Figure 1. The flow chart with illustrations. The picture used is from the TUM dataset.
Applsci 13 03576 g001
Figure 2. The P-R curve of the model.
Applsci 13 03576 g002
Figure 3. The 16 representative person contour shape maps were selected from the test set with their confidence and predicted bounding boxes.
Applsci 13 03576 g003
Figure 4. The 16 representative car contour shape maps were selected from the test set with their confidence and predicted bounding boxes.
Applsci 13 03576 g004
Figure 5. The 16 representative dog contour shape maps were selected from the test set with their confidence and predicted bounding boxes.
Applsci 13 03576 g005
Figure 6. There is only one salient object in the traffic scene. Its confidence is judged to be a car is 0.928.
Applsci 13 03576 g006
Figure 7. There are three salient objects in the traffic scene. Their confidences judged to be the cars from left to right are 0.929, 0.903, 0.944.
Applsci 13 03576 g007
Figure 8. We project the semantic information with bounding boxes in the grayscale image into the color image under the same coordinates.
Applsci 13 03576 g008
Figure 9. In the same coordinate system, we set the RGB’s three channels to 255, where the coordinates are identical to the salient objects’ coordinates in grayscale images. The salient objects’ coordinates in grayscale images are where the gray values are greater than 200. Here the threshold of 200 is set according to the imaging effect of the salient objects in the grayscale image (Confidence: Left person 0.951, Right person 0.969).
Applsci 13 03576 g009
Figure 10. Point cloud images (a,b) are generated from RGB image (d) and segmented RGB image (e) combined with depth map (c), respectively.
Applsci 13 03576 g010
Table 1. Data information of three objects in the training set.
CategoryData TypeNumberSampling ModeDataset Source
PersonsOriginal grayscale image224Random samplingduts-tr-mask [58]
DogsOriginal grayscale image224Random samplingduts-tr-mask [58]
CarsWe convert RGB into salient grayscale image224Random samplingcars data set-train [57]
Duts-tr-mask is the masking part that contains 10,553 grayscale images in the training set of the DUTS dataset; Cars data set-train is the RGB image training set containing 8144 images of the Stanford Cars dataset, which needed to be converted to the grayscale image used for training.
Table 2. Main initialization parameters of the proposed network.
ChannelsBatchSize of ImageMomentumDecayInitial Learning Rate
116416 × 4160.90.00050.001
Table 3. Experimental configurations.
Experimental ConfigurationDetail Information
Development environmentPytorch
Torchvision
Opencv
python 3.6
tensorflow 1.8.0
keras 2.3.6
anaconda
pycharm
Memory8 GB
GPUNVIDIA GeForce GTX 1650
Processor AMD Ryzen 5 4600H with Radeon Graphics
Table 4. Model evaluation indicators of salient object recognition.
CategoryPersonsDogsCarsAverage Value
F1 score0.9770.9790.9820.979
AP0.9700.9650.9750.970
Precision0.9830.9870.9880.986
Recall0.9710.9720.9760.973
Accuracy0.9130.9250.9520.930
The model’s main evaluation indicators are when its threshold for recognizing the three objects is set at 0.7. Our evaluation is based on our manually labeled ground truth of object recognition instead of based on the quality of salient semantic segmentation because there is no standard salient semantic segmentation dataset. The involved salient segmentation quality of the cars dataset depends on the segmentation quality of the used salient object detection model. Please refer to reference [24] for model details.
Table 5. Details of the testing data information used for our method.
CategoryData PreprocessingNumberSampling ModeDataset Source
PersonsOriginal grayscale image50Random samplingduts-te-mask [58]
DogsOriginal grayscale image50Random samplingduts-te-mask [58]
CarsWe convert RGB into salient grayscale image50Random samplingcars data set-test [57]
Traffic scenesWe convert RGB into salient grayscale image300Random samplingBDD 100k [65]
RGB-D peopleWe convert RGB into salient grayscale image100Random samplingRGB-D people dataset [66,67]
RGB-DWe convert RGB into salient grayscale image100Random samplingTUM dataset [68]
There is no standard salient semantic dataset. We adopted the form of random sampling because random sampling data can represent the overall dataset, which saves time for testing various types of datasets and manually marking the ground truth of salient object recognition. Duts-te-mask is the masking part that contains 5019 images in the testing set of the DUTS dataset. The cars dataset-test is the testing set that contains 8041 images in the Stanford Cars dataset. BDD100K has 100k images and contains the 10K dataset with semantic segmentation annotations. Our dataset contains 200 images from the BDD100K testing part with semantic segmentation annotations and 100 images from the BDD100K training part. RGB-D people dataset containing 3399 RGB-D images. TUM’s Computer Vision Lab publishes the TUM dataset. This dataset is very large. The dataset contains data with different structures and textures, moving objects, 3D object reconstruction, etc.
Table 6. The relationship between the imaging of the salient object contours and the recognizability of the salient objects.
Salient Object DetectionNumber of ImagesDataset SourceAverage Confidence of Object Recognition
Clear contour175BDD 100K93.3%
Fuzzy contour76BDD 100K69.7%
Contour partial occlusion49BDD 100K51.2%
Table 7. Average Speed comparison of the related model architectures.
ModelApplicationImage SizeExperimental ConfigurationSpeed (FPS)
OursSalient semantic segmentation416 × 416NVIDIAGTX 16508.2
YOLO V3 [25]Object recognition320 × 320M40 or Titan X GPU45.5
Salient object detection [24]Salient object detection400 × 300NVIDIA RTX-2080Ti GPU57
FCN-8s [5,26]Semantic segmentation224 × 224NVIDIA Titan15
SegNet [8,26]Semantic segmentation224 × 224NVIDIA Titan17
PSPNet [6,26]Semantic segmentation224 × 224NVIDIA Titan5
DeepLab-v2 [7,26]Semantic segmentation224 × 224NVIDIA Titan6
We only compared the real-time performance with other related work, mainly related to the input image size and GPU. We did not build high-configuration experimental conditions but simulated ordinary experimental conditions of the onboard processor with limited computing resources. The processing speed of the GTX1650 used is almost 0.58 times that of GTX TITAN X, 0.85 times that of GTX TITAN, and 0.33 times that of RTX 2080Ti.
Table 8. Three commonly used performance measures.
ModelGlobal AccuracyClass Average AccuracymIOUDefects
Ours62.7748.4237.24Not obvious
FCN-8s [5] 40.4228.7125.12Inherent Network architecture bottleneck and the model’s training require a large number of datasets with ground truth.
SegNet [8] 44.7635.2128.13
PSPNet [6] 44.1936.3729.53
DeepLab-v2 [7] 43.3532.7827.26
Global accuracy (G) denotes the percentage of pixels correctly classified. Class average accuracy (C) denotes the mean of the predictive accuracy of overall classes. mIoU denotes mean intersection over union over all classes. All experiments were performed under the same experimental configuration, as shown in Table 3.
Table 9. Experimental arrangements.
ModelDetection ContentTraining DatasetGround TruthTesting Dataset
OursSalient semantic segmentation of three types of objects224 car images,
224 dog images,
224 person images
Correct segmentation of these three types of salient objects100 BDD100k images
FCN-8s [5]Semantic segmentation of three types of objects224 BDD100k images Correct segmentation of these three types of objects100 BDD100k images
SegNet [8]
PSPNet [6]
DeepLab-v2 [7]
It should be noted that the 224 BDD100k images used for training semantic segmentation only trains three types of objects. We set the pixel values to 0 except for these three types of objects in the local category label. Finally, we converted the local category label images to global category label images for training. An image contains multiple types of objects in the classic related models’ training dataset, and the per picture has 5.9 cars, 5.8 poles, and 1.8 traffic signs on average. An image contained one object type in our training dataset because we only needed to implement salient object detection and carry object recognition training. We used 224 images of different classes of objects separately in our training dataset.
Disclaimer/Publisher’s Note: The statements, opinions and data contained in all publications are solely those of the individual author(s) and contributor(s) and not of MDPI and/or the editor(s). MDPI and/or the editor(s) disclaim responsibility for any injury to people or property resulting from any ideas, methods, instructions or products referred to in the content.

