Article

Straightness Perception Mechanism of Scraper Conveyor Based on the Three-Dimensional Curvature Sensing of FBG

1
School of Mines, China University of Mining and Technology, Xuzhou 221116, China
2
Research Center of Intelligent Mining, China University of Mining and Technology, Xuzhou 221116, China
*
Author to whom correspondence should be addressed.
Appl. Sci. 2023, 13(6), 3619; https://doi.org/10.3390/app13063619
Submission received: 28 January 2023 / Revised: 7 March 2023 / Accepted: 10 March 2023 / Published: 12 March 2023
(This article belongs to the Section Optics and Lasers)

Abstract

:
In order to solve the key technical problem of accurate perception of the straightness of a scraper conveyor in intelligent mining of coal mines, a three-dimensional (3D) curvature sensor of fiber Bragg grating (FBG) is designed and developed based on the curvature sensing principle of FBG. The grating string embedded in the FBG curvature sensor is simulated under the radius of curvature of 100 m, 200 m, 300 m, 400 m and 500 m. The results show that the strain of the built-in FBG string is linearly related to the curvature at the bend of the FBG string. The simulation results are consistent with the theoretical results, which verifies the rationality of the sensor design. Based on the discrete curvature information obtained by the 3D curvature sensor of FBG, the curve reconstruction algorithm is derived by using the method of fitting recursion, and the bending shape fitting perception and curve reconstruction of the scraper conveyor is realized. A test platform for the three-dimensional bending of the scraper conveyor is set up. The measuring effect of perceived and actual shape at the straight and bending states of the scraper conveyor is verified. The test results show that the measured curve is basically the same as the perceptual curve in the three-dimensional bending configuration of the scraper conveyor, and the error of the direction of each coordinate axis is not more than ±15 mm, which can meet the requirements of the accuracy of detecting the straightness of the intelligent work.

1. Introduction

With the increasing complexity of coal mining, the traditional mechanized and automatic mining technology can no longer meet the requirements of the coal industry to improve further. Therefore, intelligent coal mining has become inevitable [1]. As an important part of many pieces of equipment in a comprehensive working face, the scraper conveyor not only undertakes the important task of coal loading and transportation but also provides an operation track for the shearer. Therefore, realizing intelligent perception and decision-making of scraper conveyor straightness has become a key technical problem to solve the stope ‘three machines’ (hydraulic support, shearer, conveyor) equipment attitude monitoring.
Straightness perception and straightening methods of scraper conveyors commonly used in the field are manual straightening and direct observation methods. In 2003, the Australian Federal Academy of Sciences (CSIRO) proposed a set of automated coal mining technology—LASC based on strapdown inertial navigation technology [2]. Since the shearer runs along the scraper conveyor, the spatial geometry of the scraper conveyor can be measured by the position of the shearer. Subsequently, the Landmark project carried out by CSIRO proposed the idea of inverting the shape of the scraper conveyor by detecting the three-dimensional path of the shearer through strapdown inertial navigation technology [3]. The position of the shearer has been accurately measured using an inertial navigation system (INS) or inertial measurement unit (IMU) [4,5]. Reid et al. [6] proposed an integrated inertial navigation system aiming at various drifts and errors of the inertial navigation system in applying inertial navigation systems based on open-pit coal mines. Yang et al. [7] deduced the error compensation model of a strapdown inertial navigation system (SINS) for shearers based on vibration characteristics by establishing the dynamic model of double-drum shearers. Finally, the simulation analysis proved that the error compensation model of SINS using a three-sample algorithm and a four-sample algorithm could improve the calculation accuracy of a shearer strapdown inertial navigation system. Wang et al. [8] proposed a closed path optimal estimation model based on the motion characteristics of the shearer and Kalman filter (KF). Through simulation experiments, the positioning accuracy of the shearer is improved by about one order of magnitude without using external sensors. Hao et al. [9] constructed a geometric measurement model of the scraper conveyor based on the IMU installed on the shearer and developed a measuring instrument using the IMU and the axial encoder to meet the requirements of the straightness of the longwall face. Xing et al. [10] used the dynamic graph convolutional neural network (DGCNN) to extract the geometric features of the sphere in the point cloud of the fully mechanized mining face (FMMF) to obtain the position of the sphere (mark) in the FMMF point cloud, which can provide an effective basis for the straightening and inclination adjustment of the scraper conveyor. By analyzing the movement law of the floating connection mechanism between the hydraulic support and scraper conveyor, Li et al. [11] established a Coal Seam + Equipment Joint Virtual Straightening System. In addition, the straightening simulation of the scraper conveyor was performed on the complex coal seam floor.
In the late 1970s, countries worldwide began to study the new sensing technology based on fiber Bragg grating (FBG). Mendez et al. [12] first applied optical fiber to a concrete structure for structural detection. Since then, it has entered the upsurge of optical fiber sensing technology application, opening the era of optical fiber application theory research [13,14]. In the past few decades, FBG has been widely used in the measurement of strain [15,16], pressure [17,18], tilt angle [19], and temperature [20]. Compared with other types of sensors, FBG sensors have many outstanding advantages, such as dust prevention, anti-electromagnetic interference, moisture resistance, and high-temperature resistance, so they have been widely promoted in the field of coal mines. By analyzing the kinematics model of the hydraulic support, Liang et al. [21] proposed an FBG inclination sensor for monitoring the attitude of the hydraulic support. Zhao et al. [22] proposed an FBG displacement sensor for analyzing roof separation and studying displacement changes during blasting. Wang et al. [23] designed a full rod FBG force-measuring bolt and system, which realized the continuous monitoring of the roof pressure of the coal mine roadway. Zhao et al. [24] developed a new type of coal mine roof safety control monitoring system with FBG material as a sensing element and transmission medium, further preventing catastrophic roof collapse accidents. In view of this, scholars have gradually begun to study the FBG curvature sensor of scraper conveyors. The first measurement of curvature made using Bragg gratings written in separate cores of a multi-core fiber was reported by Gander et al. [25]. Local three-dimensional curvature can be measured by embedding three or more non-aligned strain sensors in the core of an optical multi-core fiber cross-section [26]. Song et al. [27] proposed a precise compensation model based on the rotation error angle. When the rotation error angle is within the range of 0–90°, according to the strain of FBG obtained by numerical simulation, the radius of the curvature is inversely calculated by the compensation model.
Based on optical fiber sensing technology and the structure of the scraper conveyor, a three-dimensional curvature sensor of FBG is designed and developed. Combined with the curvature information of the sensor and the idea of differential geometry, the three-dimensional bending shape fitting perception and reconstruction of the scraper conveyor is realized, and the bending test experiment platform of the scraper conveyor is built to prove the feasibility of the method.

2. Design and Development of 3D Curvature Sensor of FBG

2.1. Curvature Sensing Principle of FBG

Due to the cross-sensitivity of temperature and strain of FBG, the relationship between the Bragg wavelength change Δ λ B and the axial surface line strain ε of the measured position of the FBG sensor can be expressed as follows [28]:
Δ λ B = λ B 1 P ε ε + λ B ( α Λ + α n ) Δ T
where λ B is the initial wavelength of the FBG; P ε is the effective elastic optical coefficient of optical fiber, and the value is about 0.22; α Λ and α n are, respectively, the thermal expansion coefficient and the thermal light coefficient of optical fiber; Δ T is the temperature variation.
Under the condition of constant temperature [27]:
Δ λ B / λ B = 1 P ε × ε
The 3D curvature sensor of FBG selected in this study is a circular section. Under the condition of pure bending, the relationship between the axial strain and the curvature of the elastic beam with a circular section is as follows:
ε = r / ρ = r K
where r is the distance from the fixed surface of the FBG to the neutral surface; ρ is the radius of curvature of the measuring point; K is the curvature corresponding to this point. Given r and K in Equation (3), the strain ε of the FBG can be obtained. According to Equation (2), the strain ε is directly proportional to the change of the central wavelength Δ λ B of the FBG, so the curvature K is directly proportional to Δ λ B . Therefore, according to Equations (2) and (3), the relationship between K and Δ λ B can be obtained:
K = Δ λ B 1 P ε λ B r = Δ λ B M
where M is defined as the curvature sensitivity coefficient of the FBG, which is a constant value and proportional to r . According to Equation (4), it can be known that
Δ λ B = M ρ
Thus, the relation between the change of Bragg wavelength and the radius of curvature of the measuring point can be obtained.

2.2. Feasibility Analysis of Space Curvature Measurement

In this paper, the actual three-dimensional bending shape of the scraper conveyor is reconstructed by fitting the discrete point curvature of space. Since curvature is a vector, it has both direction and magnitude. The vector direction mainly represents the direction of curve plane bending, and the magnitude of the vector mainly indicates the degree of curve plane bending. In order to determine the curvature vector of a point on a space curve, it is necessary to measure the curvature vector magnitude of the point in two known directions to synthesize the direction and magnitude of the curvature vector. However, an FBG can only reflect the curvature value of one direction at a certain point, so at least two FBG strings are required. To simplify the synthetic curvature in two directions, the paper adopts the following method: two FBG strings are placed orthogonally at 90° on the axial surface of the substrate of the circular section, as shown in Figure 1.
Figure 1 is a cross-section diagram of the FBG strings layout of the sensing flexible substrate. MM′ is the neutral plane of the flexible substrate, and NN′ is the curved plane. MM′s plane and NN’s plane are perpendicular to each other. AA′ is the distance FBG string 1 to the neutral plane MM′. A A ¯ = r sin β . BB′ is the distance FBG string 2 to the neutral plane MM′. B B ¯ = r cos β . β is the included angle between MM′ and Y-axis. According to Equation (3), the strain variables of FBG strings in the X direction and Y direction are, respectively:
ε x = r cos β ρ
ε y = r sin β ρ
By substituting Equations (6) and (7) into Equation (5), the wavelength offsets of the FBGs in the X direction and Y direction can be obtained as
Δ λ x = 1 P e λ B x r cos β ρ
Δ λ y = 1 P e λ B y r sin β ρ
where λ B x and λ B y are the initial wavelength of FBGs in two directions. From Equations (8) and (9), we can obtain the angle β of included curvature, and Y-axis is
β = arctan Δ λ y λ B x Δ λ x λ B y
In Equation (10), λ B x and λ B y are fixed values Δ λ x and Δ λ y are constantly changing during the bending process, and we can get that the space curvature at this time is
ρ = r ( 1 P e ) λ B x Δ λ x cos arctan Δ λ y λ B x Δ λ x λ B y

2.3. Development of 3D Curvature Sensor of FBG

Based on the curvature sensing principle of FBG in Section 2.1, this study designed and developed a 3D curvature sensor of FBG suitable for the complex underground environment of a coal mine, which can be used to perceive curvature information of discrete points in the orthogonal direction. The sensor comprised a mining rubber tube with grooves in the orthogonal direction of the surface of the flexible substrate and pasted with a fiber grating string, including a flexible substrate and two fiber Bragg grating strings. In order to ensure that the 3D curvature sensor of FBG can be coordinated with the bending deformation of the scraper conveyor, the selection of the flexible substrate adopts a mining rubber tube with a large deformation ability and strong recovery ability. The cross-section of grooves on the surface of the flexible substrate in the orthogonal direction is shown in Figure 2. In order to improve the sensing accuracy of the 3D curvature sensor of FBG as much as possible, the grating interval of the FBG string is set to 0.5 m. Considering the wavelength demodulation range of the FBG demodulation instrument, 10 grating points are evenly arranged on each FBG string, and one end of the FBG string is equipped with an FC/APC connector. The FBG is laid in the grooves of two orthogonal directions of the rubber pipe for mining using a butt joint. The specific butt joint method is shown in Figure 3. The design and encapsulation of the sensor are shown in Figure 4.

2.4. Sensor Numerical Simulation Study

In order to verify the correctness of curvature—strain relationship, finite element simulation is carried out by Ansys workbench. By adding a fixed constraint at one end of the flexible substrate and deflecting the other end by a certain angle along the direction of the X-axis, the curvature radius of the curvature part of the three-dimensional FBG curvature sensor model is made to be 100 m, 200 m, 300 m, 400 m and 500 m. The relationship between the strain characteristics of the FBG string at the bending side of the pressure sensor and the curvature at the bending side is analyzed. After building the model and dividing the grid, 1,425,803 units and 306,242 nodes were generated. The outer diameter of the sensor is 80 mm, the inner diameter is 60 mm, the thickness is 10 mm, the elastic modulus is E = 6.11 MPa, and the Poisson ratio μ = 0.49. The model of FBG string is NZS-FBG-S, and the main material of bare fiber is glass silica. The elastic modulus of bare fiber is E = 72 GPa, and the Poisson ratio μ = 0.17. Figure 5a–e respectively show the strain characteristics of sensor fiber grating strings under different curvature states.
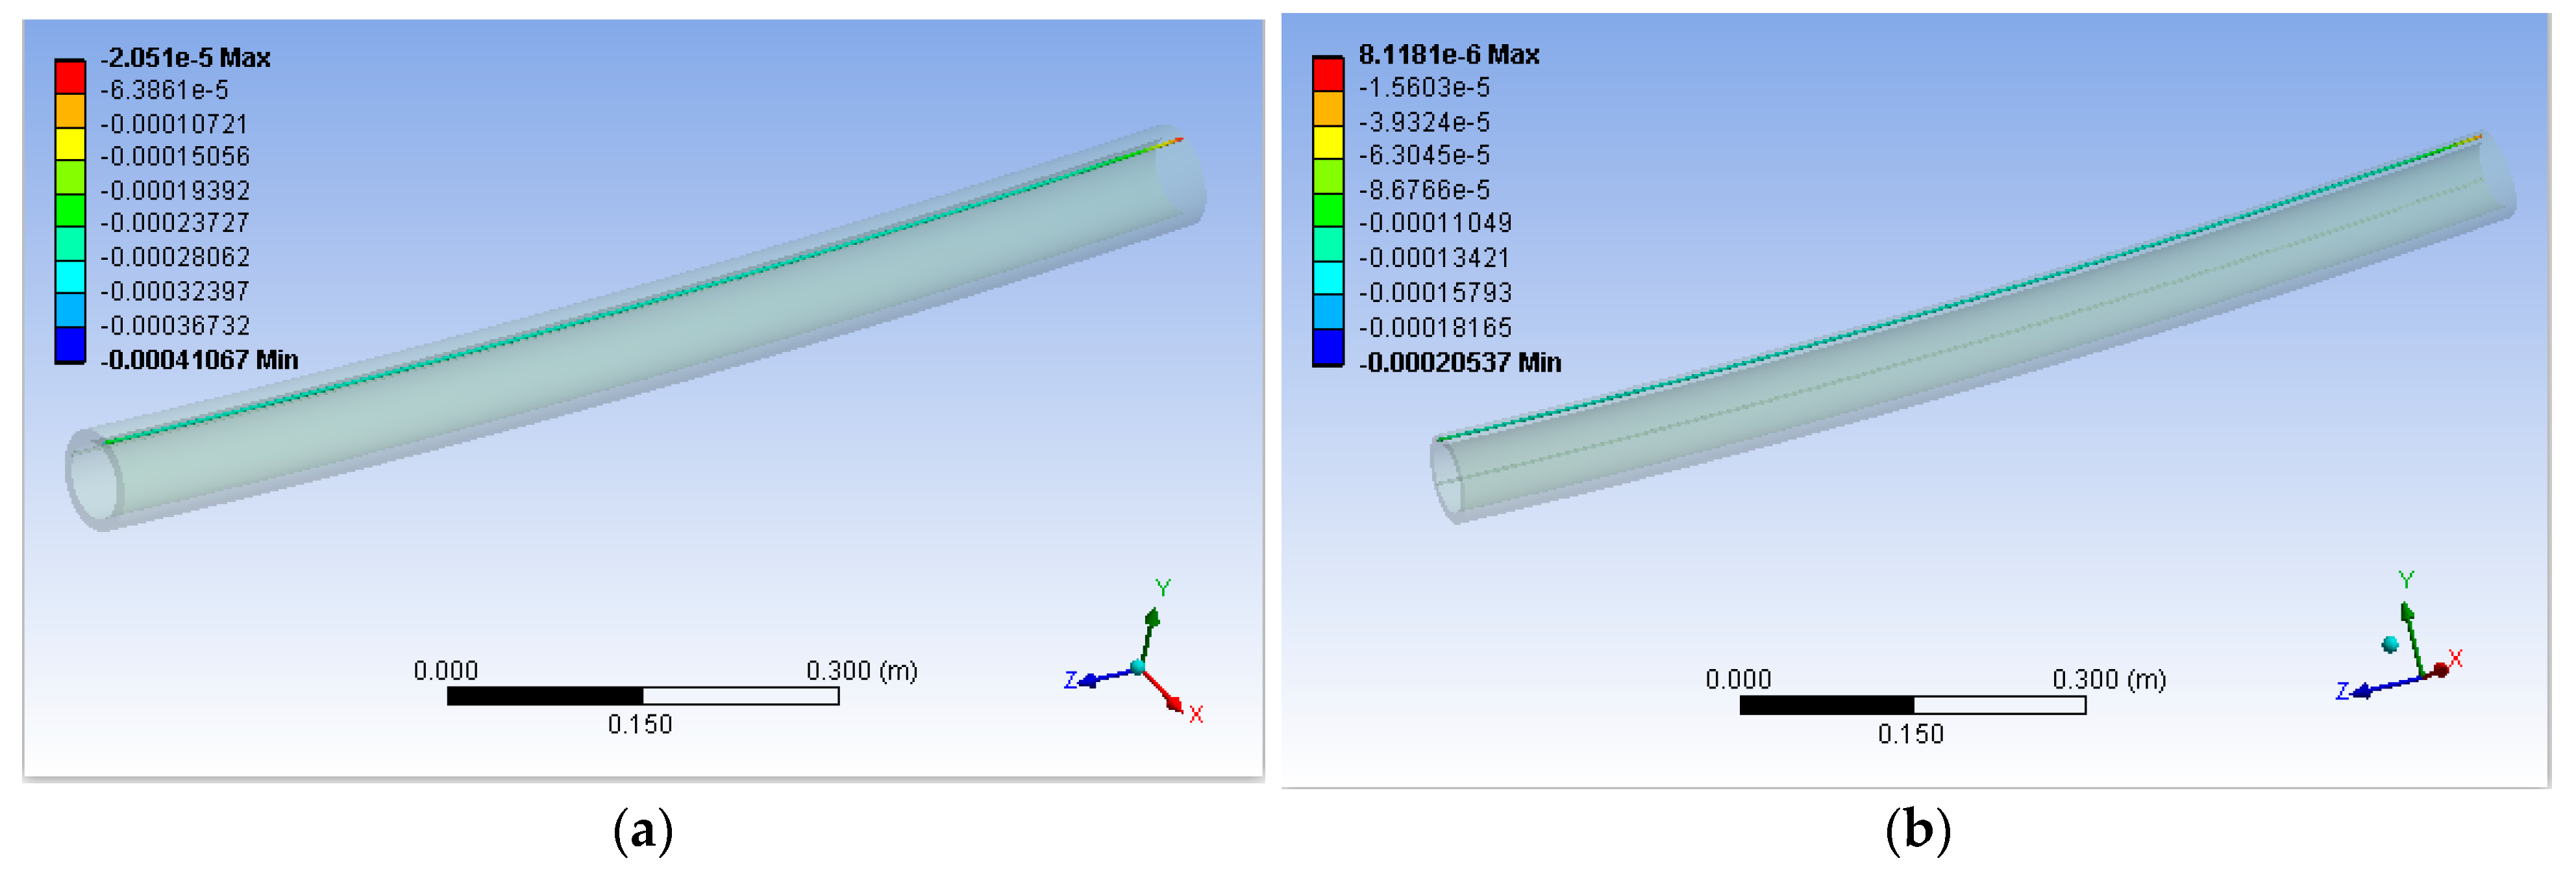
  • Since the simulation study in this paper is the strain characteristics of the FBG string built in the sensor under the condition of small curvature, the string mode of FBG is studied, respectively, on the theory of neutral axis and axis-bearing, and the strain characteristics of FBG string under different curvature modes are simulated. The results show that the strain of the FBG string on the axis-bearing string should be one order of magnitude larger than that of the FBG disguised as a relative neutral axis, which fully indicates that the sensor beam designed with a circular section satisfies the neutral axis theory.
  • It can be seen from the figure that the bending direction of the FBG string is consistent with the bending direction of the flexible substrate of the sensor, which fully indicates that the FBG string inside the sensor can maintain the same deformation as the sensor substrate, and proves the rationality of the selection of the sensor substrate and filling material.
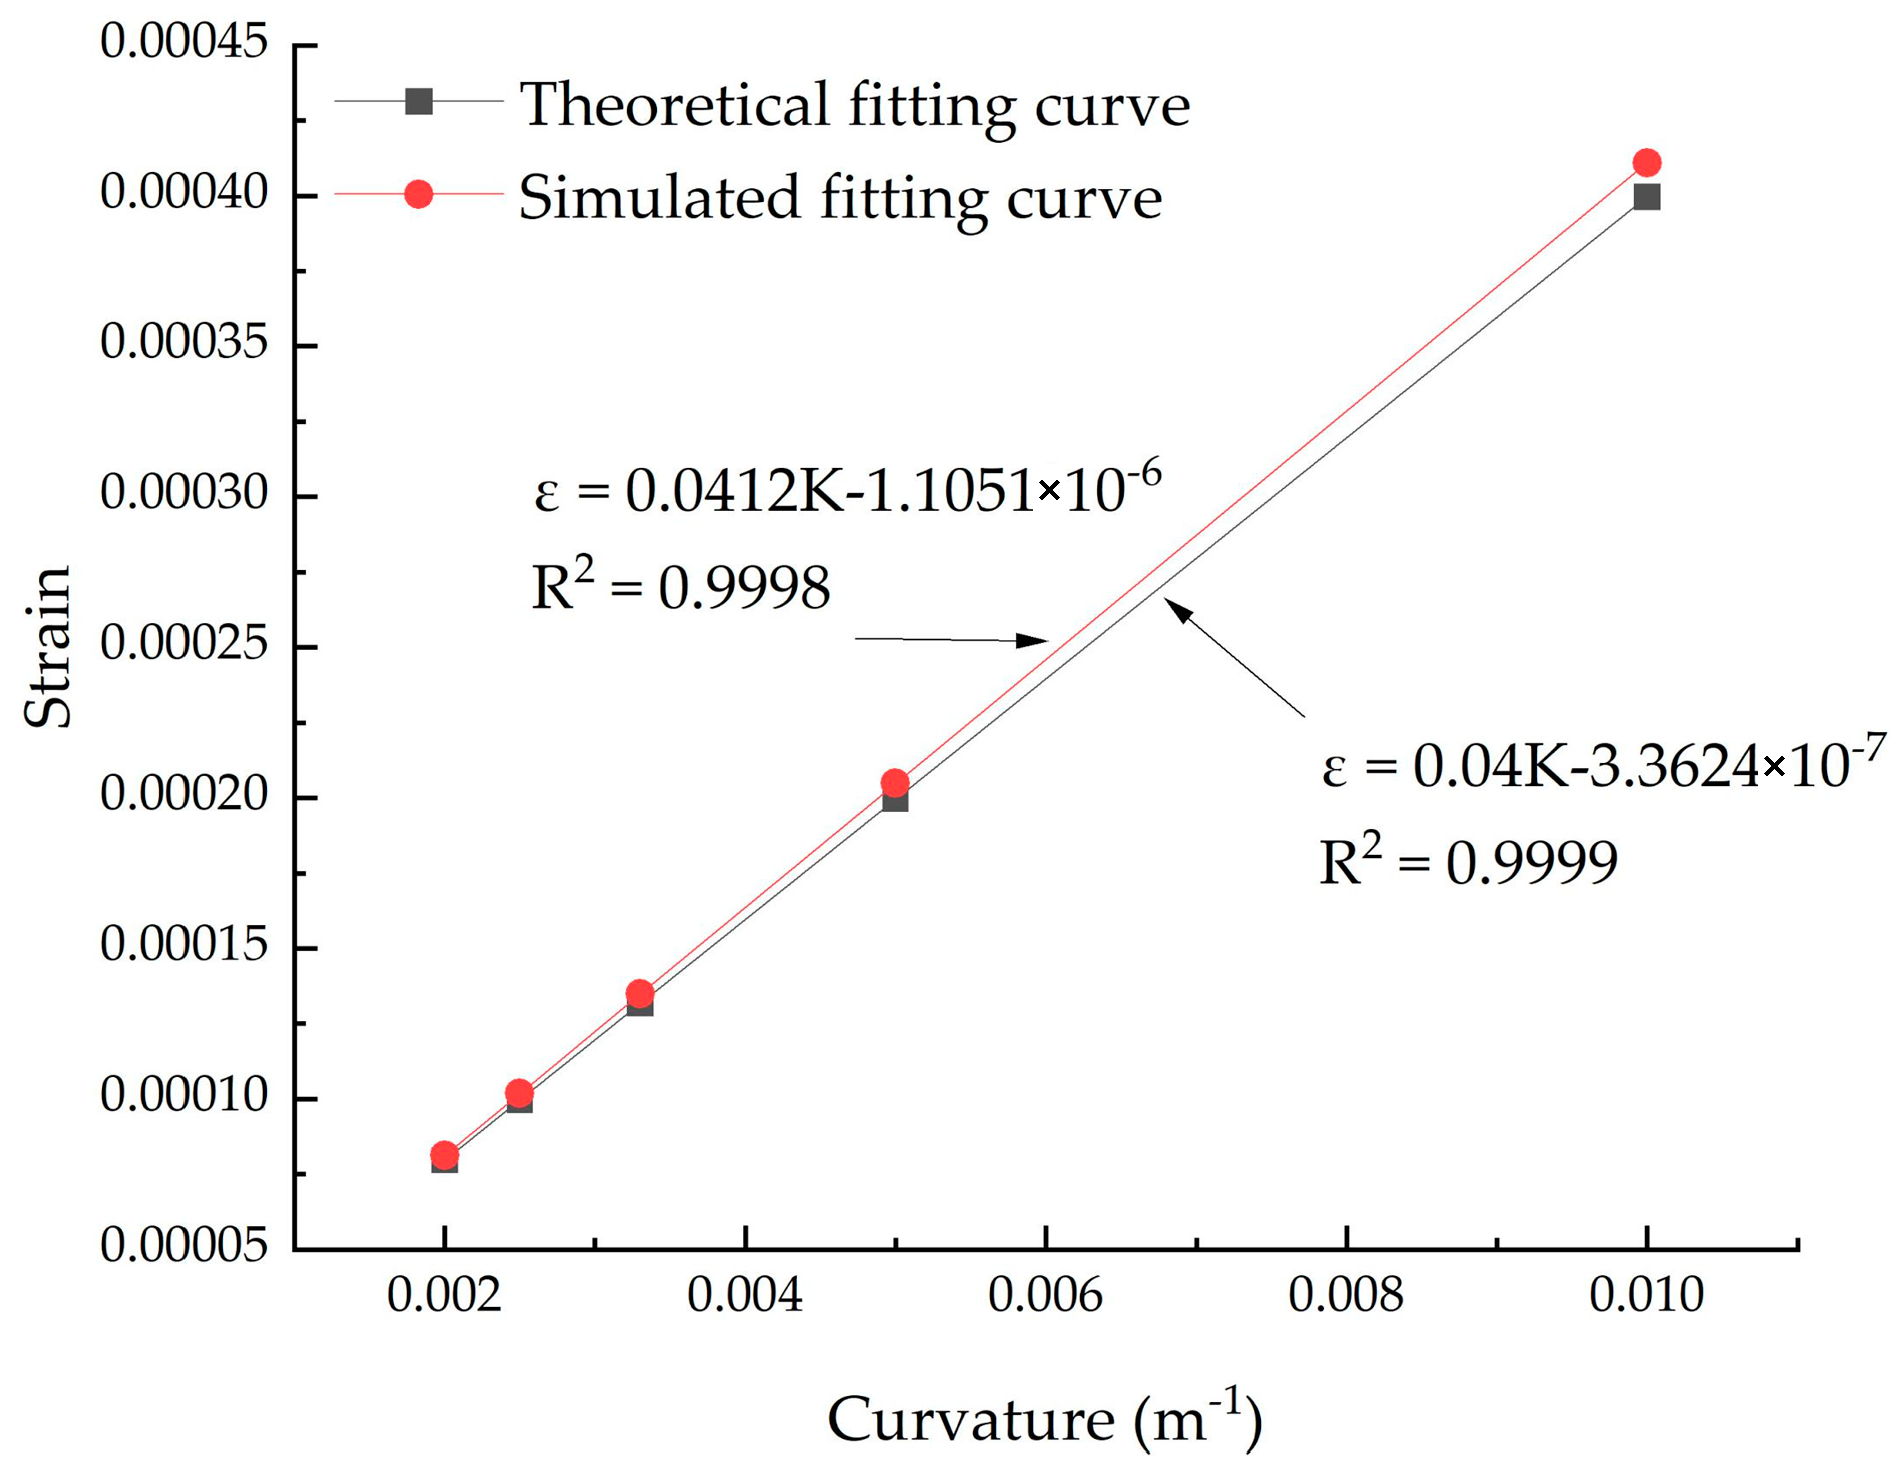
  • The maximum compressive strain of the last beam of FBG under different curvature modes is 0.00041, 0.000205, 0.000137, 0.0001 and 0.0000807, almost consistent with the theoretical calculation results, which proves the correctness of the sensor theory of the developed fiber Bragg grating curvature sensor. Table 1 below shows the theoretical and simulation results of the relationship between curvature and strain. The variation curve of FBG strain with curvature is shown in Figure 6.

3. Test and Result Analysis of Three-Dimensional Bending Test

3.1. Study on Three-Dimensional Curved Shape Fitting Method of Scraper Conveyor Based on Curvature Information

The research idea of this paper is to use an FBG curvature sensor to detect the change of central wavelength, according to the relationship between central wavelength and strain, as well as the transformation relationship between strain and curvature, using the curvature information to reconstruct the curve.

3.1.1. Curvature Continuity Algorithm

Due to the limitation of the number of measuring points and the fixed length of the scraper, only a small amount of discrete data can be obtained from each point in the actual measurement. These data points are often difficult to reconstruct the plane shape of the scraper conveyor. At present, the commonly used interpolation methods are nonlinear interpolation and linear interpolation. The nonlinear curvature interpolation methods mainly include polynomial interpolation and cubic spline interpolation. The following will compare and analyze the interpolation effect of the linear interpolation and the cubic spline interpolation.
  • Linear interpolation method
Assuming that there are n fiber gratings in the sensor, the central wavelength variation of each grating is demodulated by the demodulator, the curvature of each grating is calculated, and the curvature array is formed, which is recorded as a = k 1 , k 2 , , k i , ; s 1 , s 2 , , s i , , where k represents the curvature and s represents the arc length from each point to the starting point.
By inserting m points between two adjacent fiber grating strings, w interpolation points can be obtained:
w = ( n 1 ) × m + n
Curvature variation Δ k between interpolation points:
Δ k = k i + 1 k i , i [ 1 , n )
The curvature between two known measuring points changes uniformly, and the curvature change of each interval is
Δ l = Δ k / ( m + 1 )
The arc length and curvature relationship of each point after interpolation is
k = M s + N
Therefore, the curvature k i j and arc length s i j at the i th and i + 1th interpolation points and two adjacent grating points should satisfy the following:
k i j = M i s i j + N i , i [ 1 , n ) , j [ 0 , m + 1 ) M i = k i + 1 k i s i + 1 s i N i = s i + 1 k i s i k i + 1 s i + 1 s i
where i and j are positive integers.
  • Cubic spline interpolation method
Assume that in a group of discrete data points, the arc length is divided into small segments. Then, in the range of (a, b), the cubic spline function is set to k ( s ) , s = a < s 0 < s 1 < < s n = b , and the corresponding curvature is ( k 0 , k 1 , , k n ) .
The interpolation curve of the cubic function is defined by the piecewise function. Using the n + 1 discrete points measured by the grating fiber sensor, n intervals can be constructed. The following conditions are the basic conditions for solving the undetermined coefficients:
  • In each segment of the division, we must ensure that k ( s ) = k i ( x ) , i = 0 , 1 , 2 , , n ;
  • To meet k ( s i ) = k i ;
  • Spline function of the first derivative and second derivative exist, and continuity ensures that the spline function itself is continuous and smooth.
Therefore, the relationship between curvature and arc length is as follows:
k ( s ) = a i + b i ( s s i ) + c i ( s s i ) 2 + d i ( s s i ) 3
where a i , b i , c i , d i are four undetermined coefficients, s i is the arc length of the ith dividing point from the starting point.
Curve interpolation and continuity are defined as follows:
k i ( s i ) = k i k i + 1 ( s i + 1 ) = k i + 1 ( i = 0 , 1 , , n 1 )
The continuity of curve differential is defined as follows:
k i ( s i + 1 ) = k i + 1 ( s i + 1 ) k i ( s i + 1 ) = k i + 1 ( s i + 1 ) ( i = 0 , 1 , , n 1 )
Combining Equations (18) and (19), combining the boundary conditions, and satisfying the Equation k ( 0 ) = 0 , k ( s sum ) = 0 , the values of each coefficient can be obtained, and the functional relationship between the arc length and the curvature at each point on the curve can be obtained.
For complex curves, linear interpolation often makes it difficult to achieve the ideal interpolation effect. The cubic spline interpolation method uses the cubic function to ensure that each interpolation interval can be smooth and continuous. As a result, the accuracy of this method is higher than that of the linear interpolation method, and it also has a better curve-fitting effect in the case of complex curve bending.

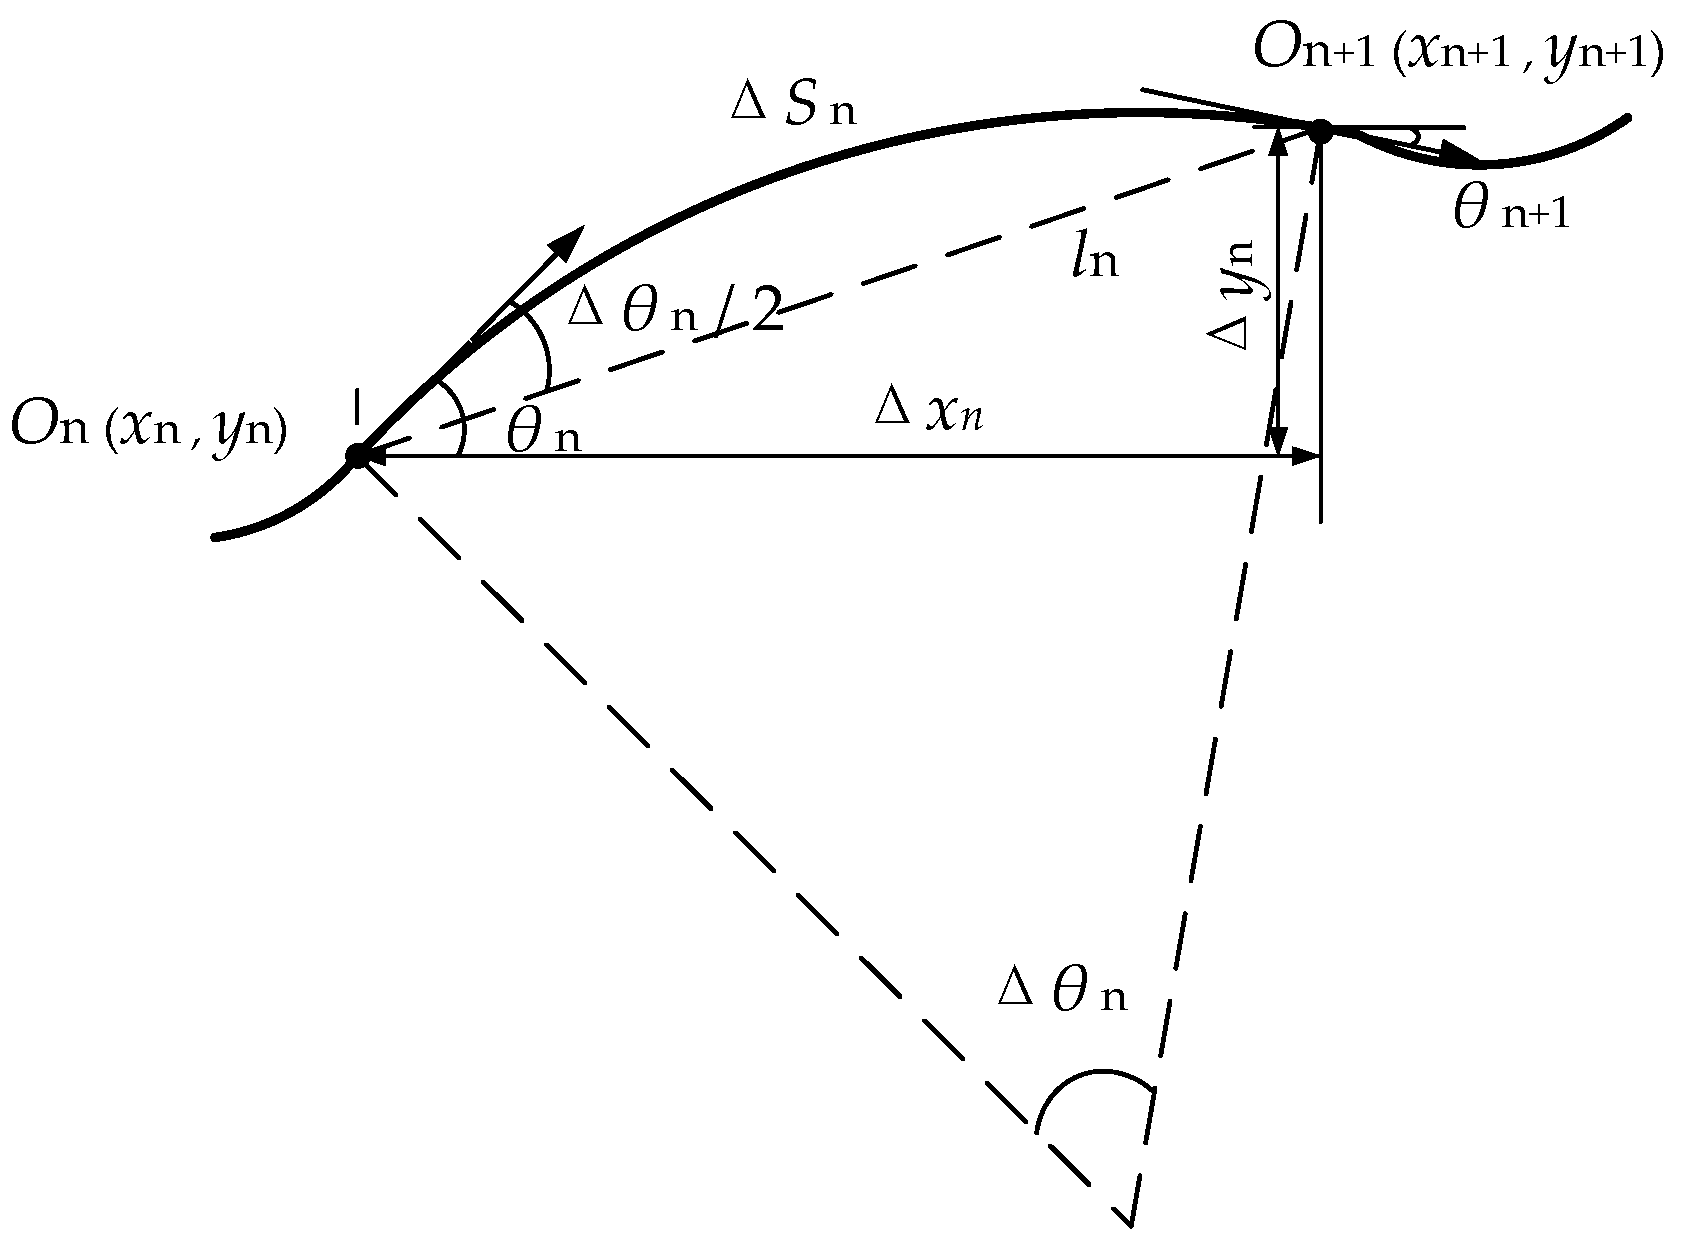
3.1.2. Curve Reconstruction Algorithm Based on Curvature

In this paper, the tangent angle recursive algorithm is used to reconstruct the curve according to the curvature information. The diagram of tangent recursion is shown in Figure 7. The curve is divided into several small segments; each small segment can be seen as an arc, O n , O n + 1 is the two endpoints of the small segment, the corresponding curvature is k n , k n + 1 . l n is the corresponding arc chord length, its length is approximately equal to the arc length Δ s n . The angle between the tangent of the O n point and the x-axis is θ n , and the angle between the tangent of the O n + 1 point and the x-axis is θ n + 1 .
Derived from the geometric relationship:
Δ θ n = θ n + 1 θ n l n = 2 sin ( Δ θ n / 2 ) k n , k n 0 l n = Δ s n , k = 0 Δ x n = l n cos ( θ n Δ θ n 2 ) Δ y n = l n sin ( θ n Δ θ n 2 ) x n + 1 = x n + Δ x n y n + 1 = y n + Δ y n
By the definition of curvature k ( s ) = lim Δ θ 0 Δ θ Δ s :
θ ( s ) = k ( s ) d s
According to the linear interpolation method described in Section 3.1.1, the curve is divided into n segments, and the relationship between the angle and the arc length in each segment is obtained by combining Equations (15) and (16) as follows:
θ ( s ) = 1 2 M s 2 + N s + c
The value of c is related to the boundary condition of each segment. Therefore, it can be solved by using the curvature value of each segment boundary as the boundary condition.
When the cubic spline interpolation method is used, the relationship between curvature and arc length is obtained, as shown in Equation (17). Then, after a series of conditions, each undetermined coefficient is solved and combined with Equation (15) to obtain:
θ ( s ) = c + a i ( s s i ) + 1 2 b i ( s s i ) 2 + 1 3 c i ( s s i ) 3 + 1 4 d i ( s s i ) 4
After the interpolation function of each curve segment is obtained, the curve can be reconstructed by substituting it into Equation (20)

3.2. Three-Dimensional Bending Shape Determination

According to the mining technology and terrain characteristics of the comprehensive working face, the bending state that may exist in the actual production process of the scraper conveyor is analyzed, the bending test of the scraper conveyor under the three-dimensional straight line, three-dimensional bending state 1 and three-dimensional bending state 2 will be carried out, respectively, in this test. The specific layout of the test is shown in Figure 8.

3.3. Perception and Collection of Data

In the three-dimensional bending test of the scraper based on FBG, the wavelength signal of the sensing fiber was demodulated by using the sm125 demodulation instrument produced by Micron Optics. The channel number of the demodulator is 4. The demodulation wavelength ranges from 1510 nm to 1590 nm.
The measured data of the three-dimensional curved shape were collected by a standard tape measure, and the X-direction, Y-direction and Z-direction coordinate offsets of each grating point relative to the starting point of the fixed end were obtained and then translated into corresponding coordinate values ( X 0 i , Y 0 i , Z 0 i ).
The wavelength drift at each grating point in the orthogonal direction was demodulated by the sm125 FBG demodulation instrument, and 3D bending shape sensing data was collected. Then, converted into the corresponding curvature according to Equation (4). Finally, the coordinate values of each grating point ( X 1 i , Y 1 i , Z 1 i ) were obtained according to the 3D curve reconstruction method based on curvature information of discrete points described in this paper.
However, when the bending direction changes, especially when the bending direction is opposite, FBG can still sense the bending information of the flexible substrate. Similarly, the wavelength drift at each grating point is obtained by demodulation with the sm125 FBG demodulator instrument. First, according to Equation (4), the corresponding curvature is converted. Then, according to the three-dimensional curve reconstruction method based on the curvature information of discrete points described in this paper, the coordinate values of each grating point ( X 2 i , Y 2 i , Z 2 i ) were obtained.

3.4. Data Processing Analysis

This experiment measured three-dimensional curvature fiber Bragg grating sensors in a three-dimensional linear state, three-dimensional bending state 1 and three-dimensional bending state 2.
In this experiment, the data of the 3D curvature sensor of FBG in the three-dimensional linear state, three-dimensional bending state 1 and three-dimensional bending state 2 were measured, respectively. The perceived data were measured twice, and the measured data were measured once. According to the three-dimensional spatial curve reconstruction method described in this paper based on curvature information of discrete points, Matlab was used for programming fitting. The actual and perceived curves under various states were compared and analyzed, as shown in Figure 9.
The data processing and analysis results show that the shape of the measured curve is basically consistent with the shape of the perceived curve in the three bending forms. In the three-dimensional bending perception state, the error of each coordinate axis direction is generally no more than 15 mm. In engineering practice, it is generally required that the error should not exceed 10%. Therefore, the precision of the designed optical fiber three-dimensional curvature sensor meets the error range of the straightening of the scraper conveyor in coal mine engineering. The error between the sensing data and the actual data of the three-dimensional curvature sensor of the FBG does not exceed 1.6% of the maximum bending deformation, and it shows good repeatable test stability in adapting to different bending forms.

4. Conclusions

  • The numerical simulation results show a high linear correlation between the strain of the built-in FBG string and the curvature at the bend. The linearity is up to 0.9998, which is consistent with the theoretical results and verifies the theoretical rationality of the sensor design.
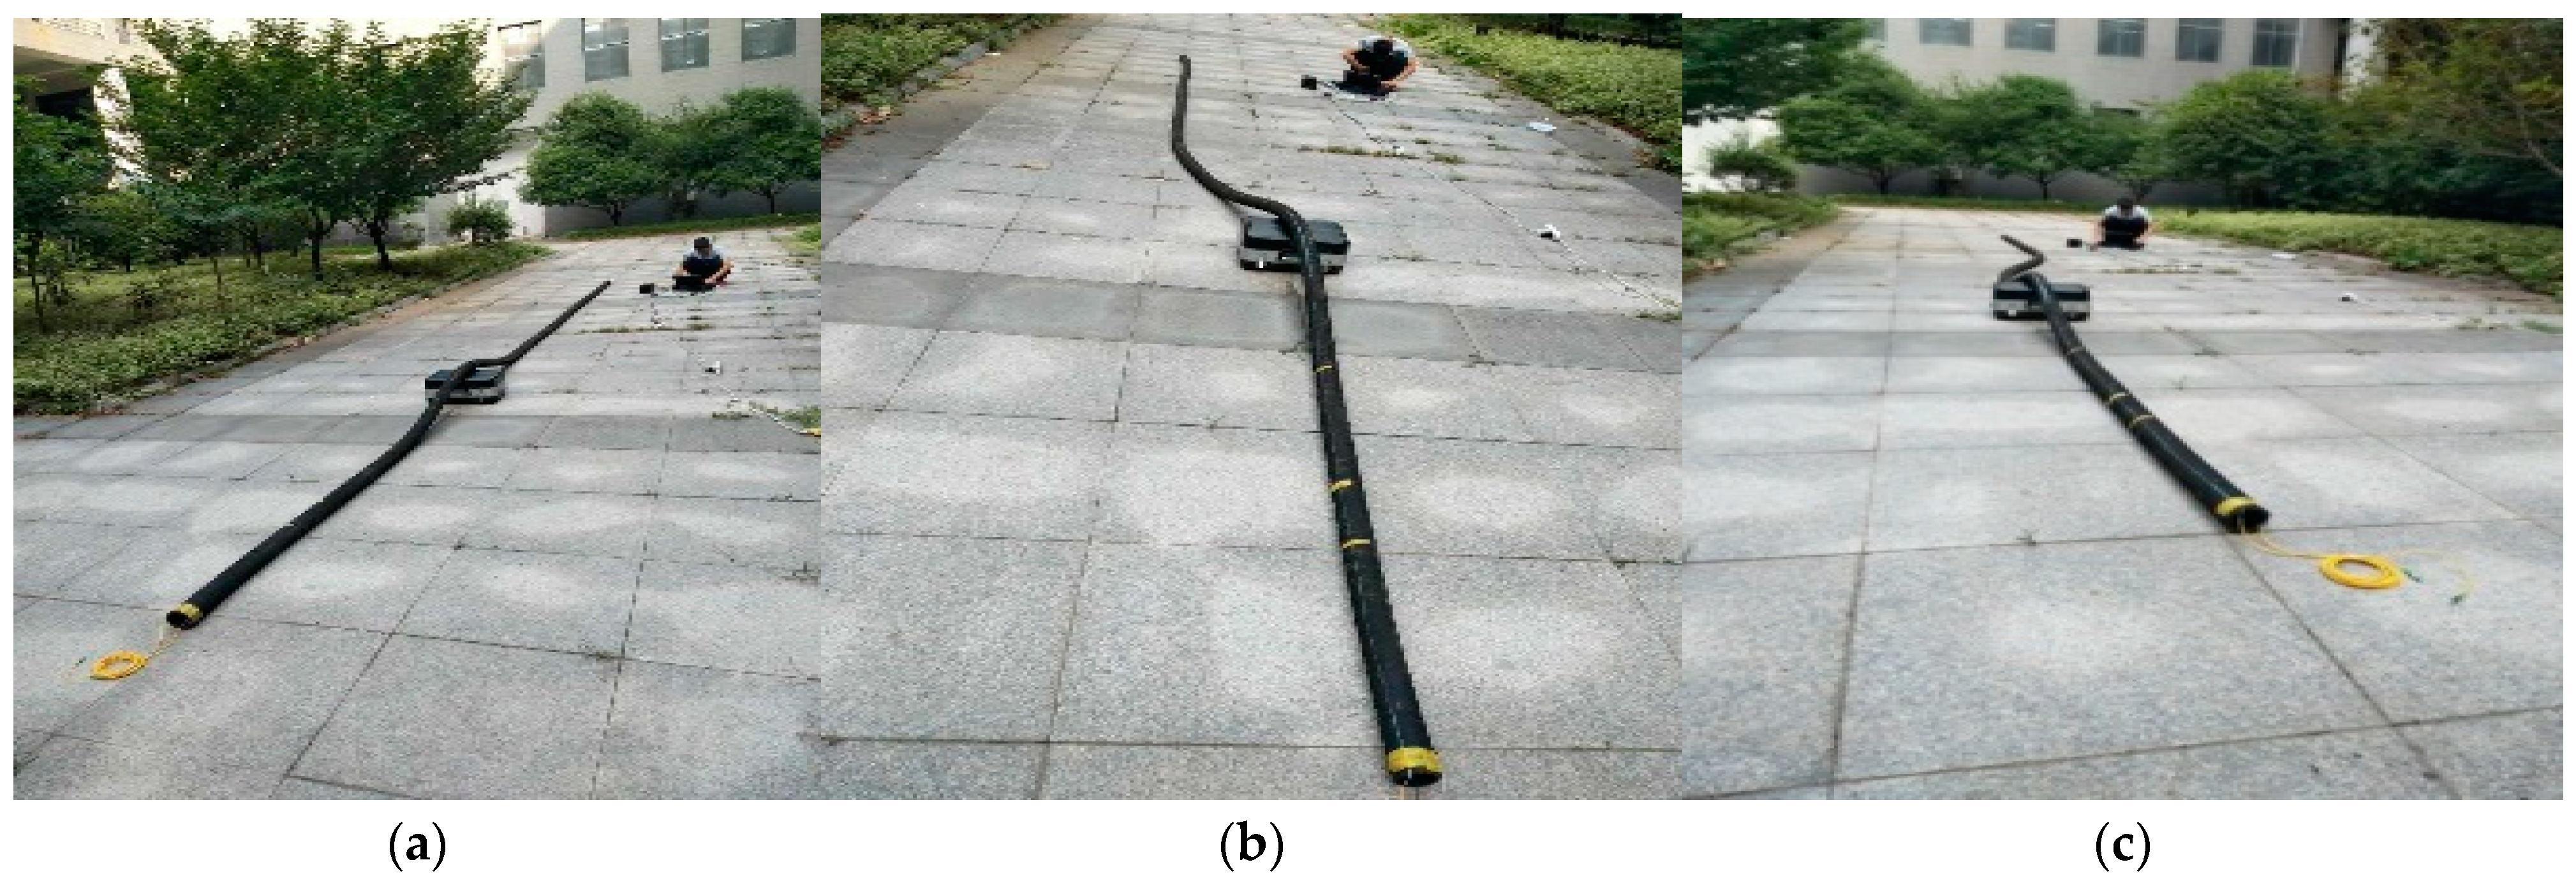
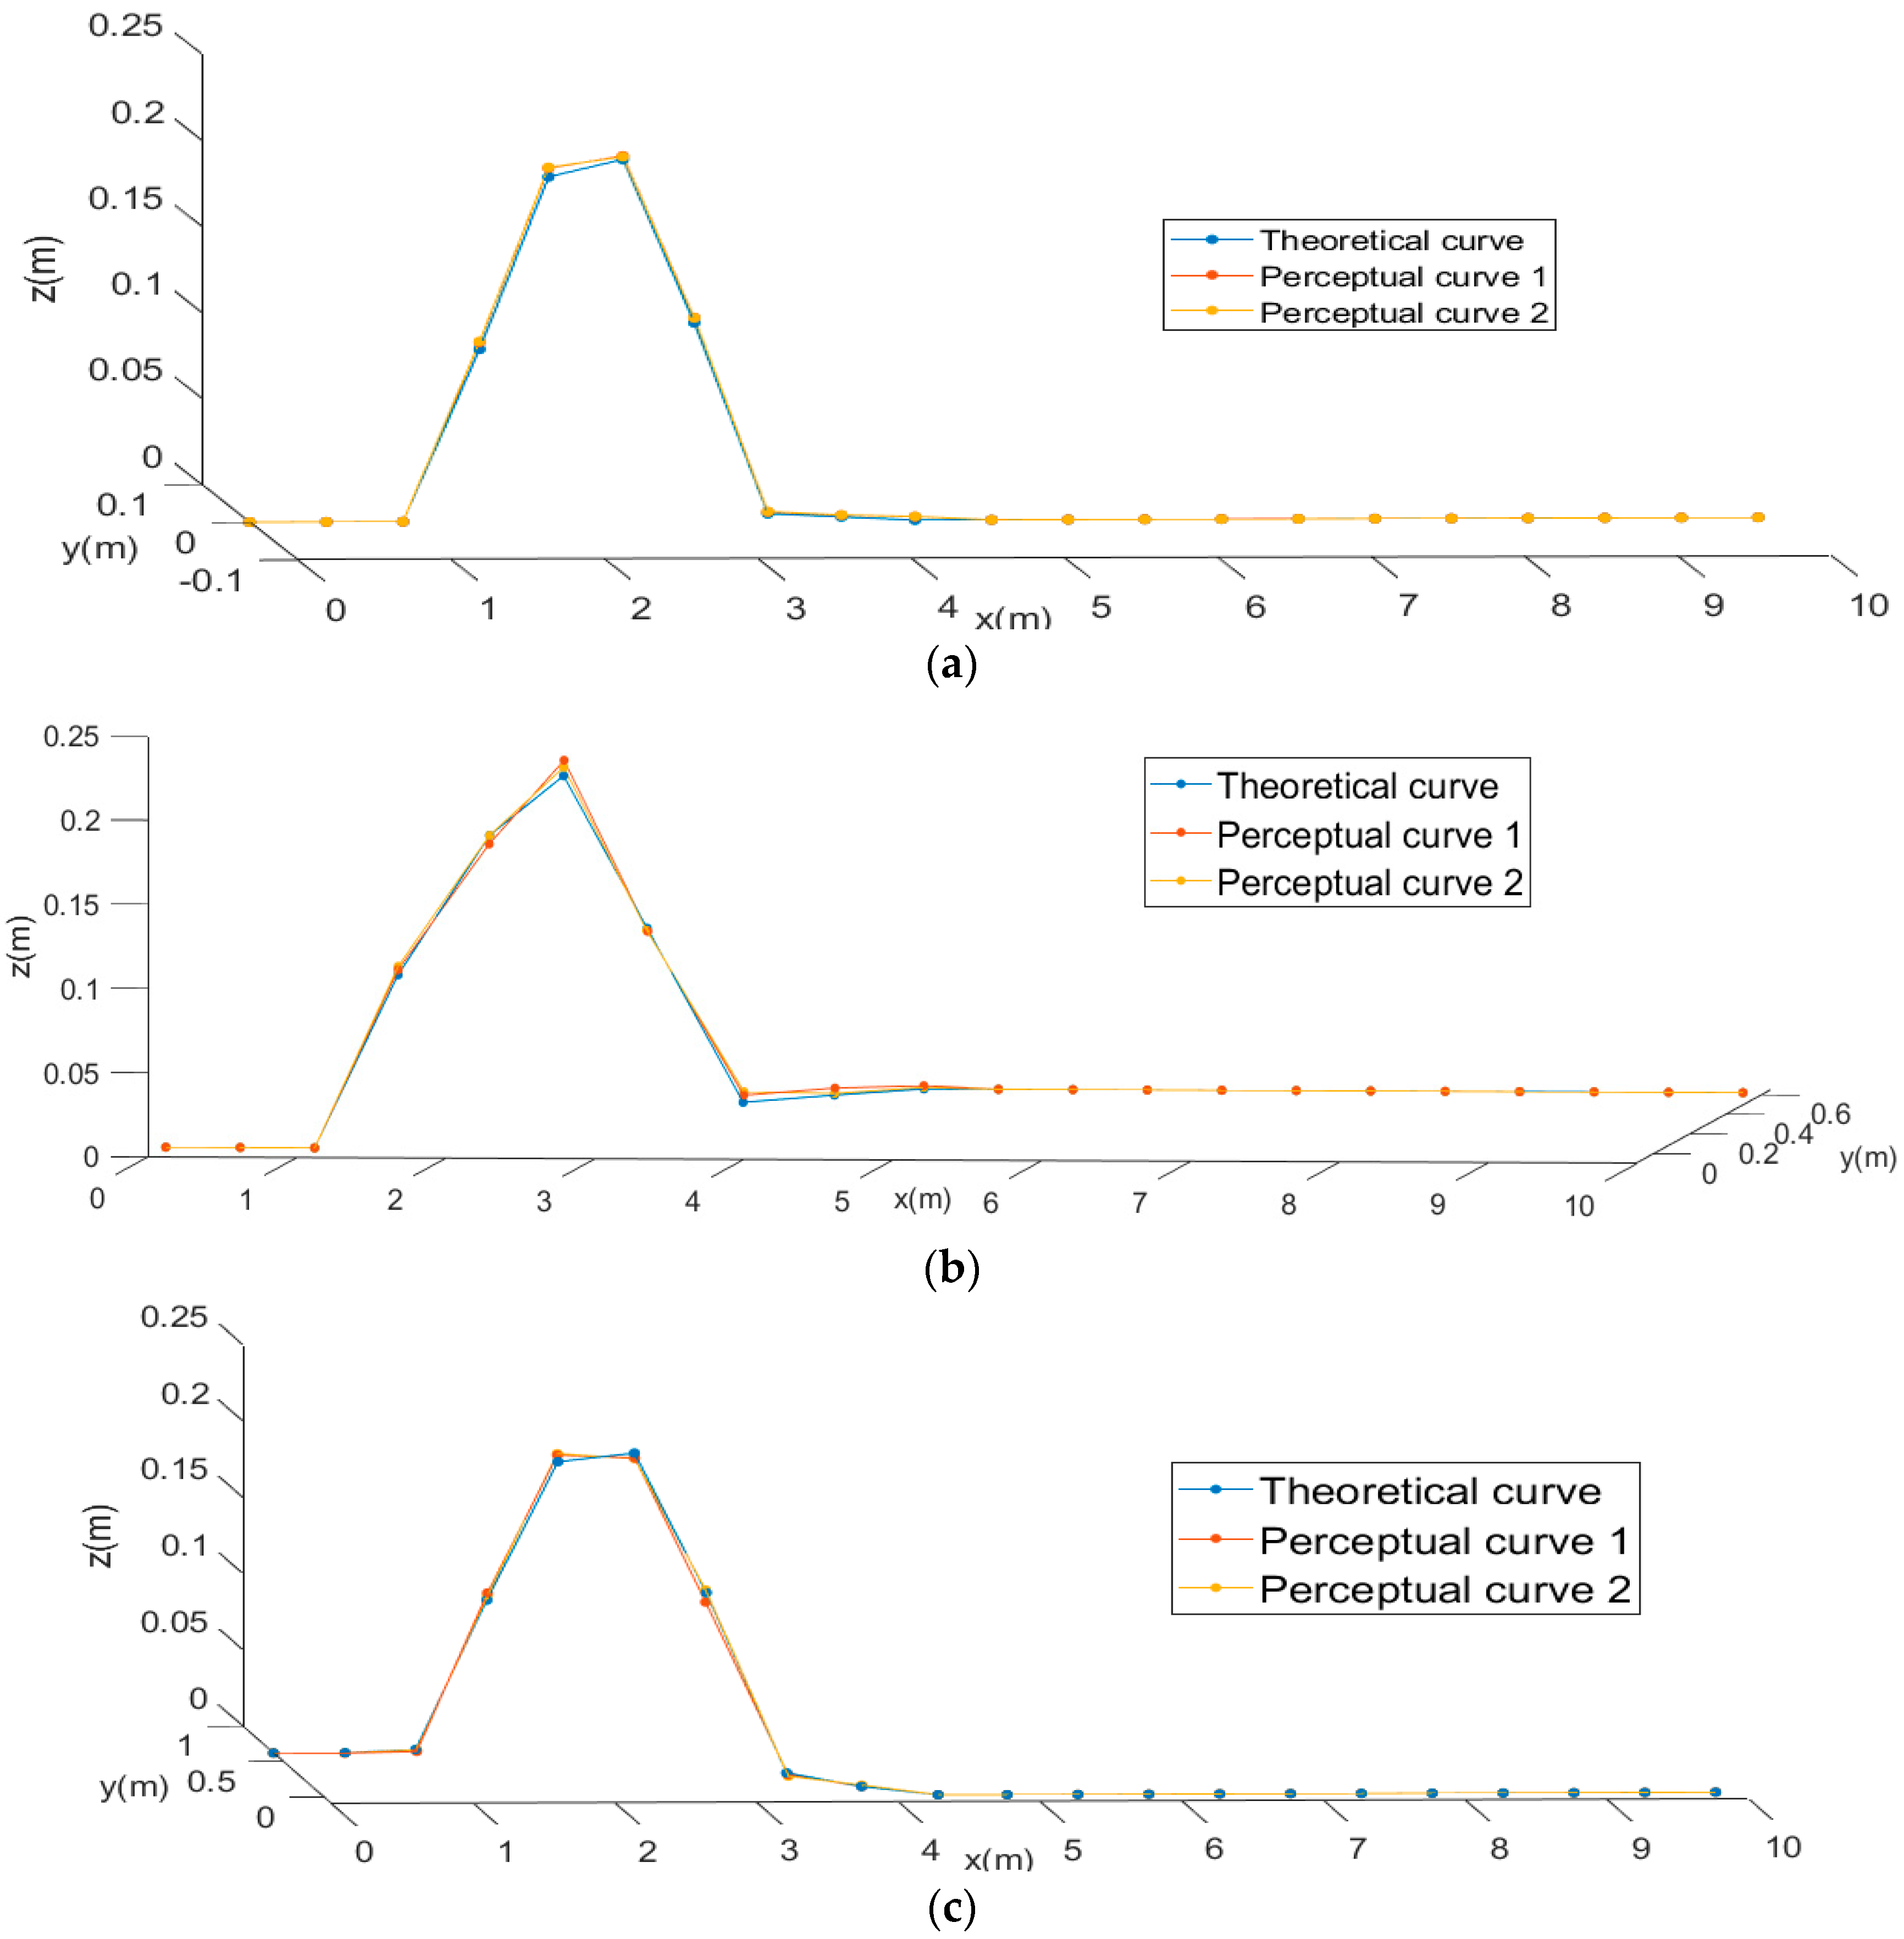
  • Based on the curvature sensing principle of FBG, the 3D curvature sensor of FBG was designed and developed, the 3D spatial curve reconstruction algorithm based on the curvature information in the orthogonal direction was derived, and the 3D bending test platform was built for verification according to the actual bending morphological characteristics of the scraper conveyor on the working face. The test results show that, in the case of the three-dimensional curved shape layout of the scraper conveyor, the measured curve is basically consistent with the perceived curve, and the error of each coordinate axis is generally no more than 15 mm, which can meet the detection accuracy requirements of the straightness of the intelligent working face.
  • The three-dimensional curvature sensor of FBG can adapt to the three-dimensional bending shape of different scraper conveyors and shows good stability of repeated tests.
  • Three-dimensional curvature sensor of FBG can be used for the real-time perception of the three-dimensional bending shape of the scraper conveyor.
  • The research results can greatly promote the intelligent process of a coal mine and provide a new idea for realizing the perception and control of the straightness of the scraper conveyor of an intelligent working face.

Author Contributions

Conceptualization, G.W. and X.F.; validation, G.W., F.Q., X.F., M.L. and Y.S.; data curation, G.W.; writing—original draft preparation, G.W. and F.Q.; writing—review and editing, G.W., F.Q., X.F., M.L. and Y.S.; project administration, G.W. and X.F.; funding acquisition, G.W. and M.L. All authors have read and agreed to the published version of the manuscript.

Funding

This work was supported by the National Natural Science Foundation of China (Nos. 52104167 and 52004273), the Natural Science Foundation of Jiangsu Province (No. BK20200639), the China Postdoctoral Science Foundation (No. 2019M661992), the Fundamental Research Funds for the Central Universities (No. 2020ZDPY0209) and the Open Competition Mechanism to Select the Best Candidates Foundation of Shanxi Province (No. 20201101005).

Institutional Review Board Statement

Not applicable.

Informed Consent Statement

Not applicable.

Data Availability Statement

The study did not report any data.

Conflicts of Interest

The authors declare no conflict of interest.

References

  1. Wang, G.; Xu, Y.; Ren, H. Intelligent and ecological coal mining as well as clean utilization technology in China: Review and prospects. Int. J. Min. Sci. Technol. 2019, 29, 161–169. [Google Scholar] [CrossRef]
  2. Li, S.; Xie, J.; Wang, X.; Ren, F.; Zhang, X.; Bao, Q. Path planning of hydraulic support pushing mechanism based on extreme learning machine and descartes path planning. Symmetry 2021, 13, 97. [Google Scholar] [CrossRef]
  3. Kelly, M.; Hainsworth, D.; Reid, D.; Caris, C.; Gurgenci, H. Progress towards longwall automation. In Proceedings of the 5th International Symposium on Mining Science and Technology, Xuzhou, China, 20–22 October 2004. [Google Scholar]
  4. Hatherly, P. Overview on the application of geophysics in coal mining. Int. J. Coal. Geol. 2013, 114, 74–84. [Google Scholar] [CrossRef]
  5. Fan, Q.; Li, W.; Hui, J.; Wu, L.; Yu, Z.; Yan, W.; Zhou, L. Integrated positioning for coal mining machinery in enclosed underground mine based on SINS/WSN. Sci. World J. 2014, 2014, 460415. [Google Scholar] [CrossRef] [Green Version]
  6. Reid, D.C.; Hainsworth, D.W.; Ralston, J.C.; McPhee, R.J. Shearer guidance: A major advance in longwall mining. In Proceedings of the 4th International Conference on Field and Service Robotics, Mt Fuji, Japan, 14–16 July 2006. [Google Scholar]
  7. Yang, H.; Li, W.; Zhang, J.; Si, Z. Research on error compensation property of strapdown inertial navigation system using dynamic model of shearer. IEEE Access 2016, 4, 2045–2055. [Google Scholar] [CrossRef]
  8. Wang, S.; Zhang, B.; Wang, S.; Ge, S. Dynamic precise positioning method of shearer based on closing path optimal estimation model. IEEE Trans. Autom. Sci. Eng. 2019, 16, 1468–1475. [Google Scholar]
  9. Hao, S.; Wang, S.; Malekian, R.; Zhang, B.; Liu, W.; Li, Z. A geometry surveying model and instrument of a scraper conveyor in unmanned longwall mining faces. IEEE Access 2017, 5, 4095–4103. [Google Scholar] [CrossRef]
  10. Xing, Z.; Zhao, S.; Guo, W.; Guo, X.; Wang, Y. Processing laser point cloud in fully mechanized mining face based on DGCNN. ISPRS Int. J. Geo-Inf. 2021, 10, 482. [Google Scholar] [CrossRef]
  11. Li, S.; Xie, J.; Ren, F.; Zhang, X.; Wang, X.; Wang, B. Virtual straightening of scraper conveyor based on the position and attitude solution of industrial robot model. Int. J. Coal Sci. Technol. 2021, 8, 1149–1170. [Google Scholar] [CrossRef]
  12. Mendez, A.; Morse, T.F.; Mendez, F. Applications of embedded optical fiber sensors in reinforced concrete buildings and structures. In Proceedings of the Fiber Optic Smart Structures and Skins II, Boston, MA, USA, 5 September 1989. [Google Scholar]
  13. Zhao, Y.; Ansari, F. Embedded fiber optic sensor for characterization of interface strains in FRP composite. Sens. Actuators A Phys. 2002, 200, 247–251. [Google Scholar] [CrossRef]
  14. Ou, J.; Zhou, Z.; Wu, Z.; Tian, S.; Zhao, X. Optical FBGs’ sensing properties and practical application in civil infrastructures. In Proceedings of the 2nd Asia/Pacific Conference on Fundamental Problems of Optoelectronics and Microelectronics, Vladivostok, Russia, 30 September–4 October 2002. [Google Scholar]
  15. Du, J.; He, Z. Sensitivity enhanced strain and temperature measurements based on FBG and frequency chirp magnification. Opt. Express 2013, 21, 27111–27118. [Google Scholar] [CrossRef] [PubMed]
  16. Ren, L.; Jia, Z.; Li, H.; Song, G. Design and experimental study on FBG hoop-strain sensor in pipeline monitoring. Opt. Fiber Technol. 2014, 20, 15–23. [Google Scholar] [CrossRef]
  17. Chen, H. Fiber optic pressure sensor based on a single-mode fiber F–P cavity. Measurement 2010, 43, 370–374. [Google Scholar] [CrossRef]
  18. Liang, M.; Fang, X.; Wu, G.; Xue, G.; Li, H. A FBG pressure sensor with temperature compensation based on diaphragm-cantilever structure. Optik 2017, 145, 503–512. [Google Scholar] [CrossRef]
  19. Au, H.Y.; Khijwania, S.K.; Fu, H.; Chung, W.H.; Tam, H.Y. Temperature-insensitive FBG based tilt sensor with large dynamic range. J. Lightwave Technol. 2011, 29, 1714–1720. [Google Scholar] [CrossRef]
  20. Liu, T.; Sun, W.; Kou, H.; Yang, Z.; Meng, Q.; Zheng, Y.; Wang, H.; Yang, X. Experimental study of leakage monitoring of diaphragm walls based on distributed optical fiber temperature measurement technology. Sensor 2019, 19, 2269. [Google Scholar] [CrossRef] [Green Version]
  21. Liang, M.; Fang, X.; Li, S.; Wu, G.; Ma, M.; Zhang, Y. A fiber bragg grating tilt sensor for posture monitoring of hydraulic supports in coal mine working face. Measurement 2019, 138, 305–313. [Google Scholar] [CrossRef]
  22. Zhao, Z.; Zhang, Y.; Li, C.; Wan, Z.; Li, Y.; Wang, K.; Xu, J. Monitoring of coal mine roadway roof separation based on fiber Bragg grating displacement sensors. Int. J. Rock Mech. Min. 2015, 74, 128–132. [Google Scholar] [CrossRef]
  23. Wang, P.; Zhang, N.; Kan, J.; Xie, Z.; Wei, Q.; Yao, W. Fiber bragg grating monitoring of full-bolt axial force of the bolt in the deep strong mining roadway. Sensor 2020, 20, 4242. [Google Scholar] [CrossRef] [PubMed]
  24. Zhao, Y.; Zhang, N.; Si, G. A fiber bragg grating-based monitoring system for roof safety control in underground coal mining. Sensor 2016, 16, 1759. [Google Scholar] [CrossRef] [Green Version]
  25. Gander, M.J.; MacPherson, W.N.; McBride, R.J.; Jones, D.C.; Zhang, L.; Bennion, I.; Blanchard, P.M.; Burnett, J.G.; Greenaway, A.H. Bend mesurement using bragg gratings in multicore fibre. Electron. Lett. 2000, 36, 2–3. [Google Scholar] [CrossRef]
  26. Floris, I.; Adam, J.M.; Calderón, P.A.; Sales, S. Fiber optic shape sensors: A comprehensive review. Opt. Laser Eng. 2021, 139, 106508. [Google Scholar] [CrossRef]
  27. Song, Y.; Fang, X.; Wu, G.; Chen, N.; Liang, M.; Xu, Z.; Zhang, F. Research on straightness perception compensation model of FBG scraper conveyor based on rotation error angle. Sensor 2022, 22, 6399. [Google Scholar] [CrossRef] [PubMed]
  28. Chen, N.; Fang, X.; Liang, M.; Xue, X.; Zhang, F.; Wu, G.; Qiao, F. Research on hydraulic support attitude monitoring method merging FBG sensing technology and adaboost algorithm. Sustainability 2023, 15, 2239. [Google Scholar] [CrossRef]
Figure 1. Section Diagram of FBG Series Arrangement on Flexible Substrate Surface. The A is the position of the FBG string 1 on the Y-axis, and A′ is the projection of A onto the neutral plane MM′. The B is the position of the FBG string 2 on the X-axis, and B′ is the projection of B onto the neutral plane MM′. The O is the origin of the coordinates. The meanings of M and N have been given in the manuscript. The β is the angle between the Y-axis and the neutral plane MM′.
Applsci 13 03619 g001
Figure 2. Slot section diagram of flexible substrate surface.
Applsci 13 03619 g002
Figure 3. Diagram of the docking mode of fiber-optic grid.
Applsci 13 03619 g003
Figure 4. Solid picture of fiber grating 3D curvature sensor.
Applsci 13 03619 g004
Figure 5. Strain characteristics of sensor fiber gratings in different curvature states. (a) The radius of curvature is 100 m. (b) The radius of curvature is 200 m. (c) The radius of curvature is 300 m. (d) The radius of curvature is 400 m. (e) The radius of curvature is 500 m.
Applsci 13 03619 g005aApplsci 13 03619 g005b
Figure 6. Curve of sensor curvature—strain relationship.
Applsci 13 03619 g006
Figure 7. Diagram of tangent angle recursion algorithm.
Applsci 13 03619 g007
Figure 8. Test field map in three-dimensional linear and bending state. (a) 3D straight line. (b) 3D bending state 1. (c) 3D bending state 2.
Applsci 13 03619 g008
Figure 9. Comparison curves of measured and perceived trajectories in three-dimensional linear and bending states. (a) The three-dimensional linear. (b) 3D bending state 1. (c) 3D bending state 2.
Applsci 13 03619 g009
Table 1. The relationship between theoretical and simulation strain and curvature.
Concrete ParametersNumerical Value
Radius of Curvature100 m200 m300 m 400 m500 m
Curvature0.01 m−10.005 m−10.00333 m−10.0025 m−10.002 m−1
Theoretical strain0.00040.00020.0001330.00010.00008
Simulated strain0.000410.0002050.0001370.00010.0000807
Disclaimer/Publisher’s Note: The statements, opinions and data contained in all publications are solely those of the individual author(s) and contributor(s) and not of MDPI and/or the editor(s). MDPI and/or the editor(s) disclaim responsibility for any injury to people or property resulting from any ideas, methods, instructions or products referred to in the content.

