
A Statistical Approach to Identify Appropriate Sampling Scheme Capable of Geographical Identification Analysis of the Protected Origin Pulse Crops in Greece
 , , , and
Abstract
:1. Introduction
2. Materials and Methods
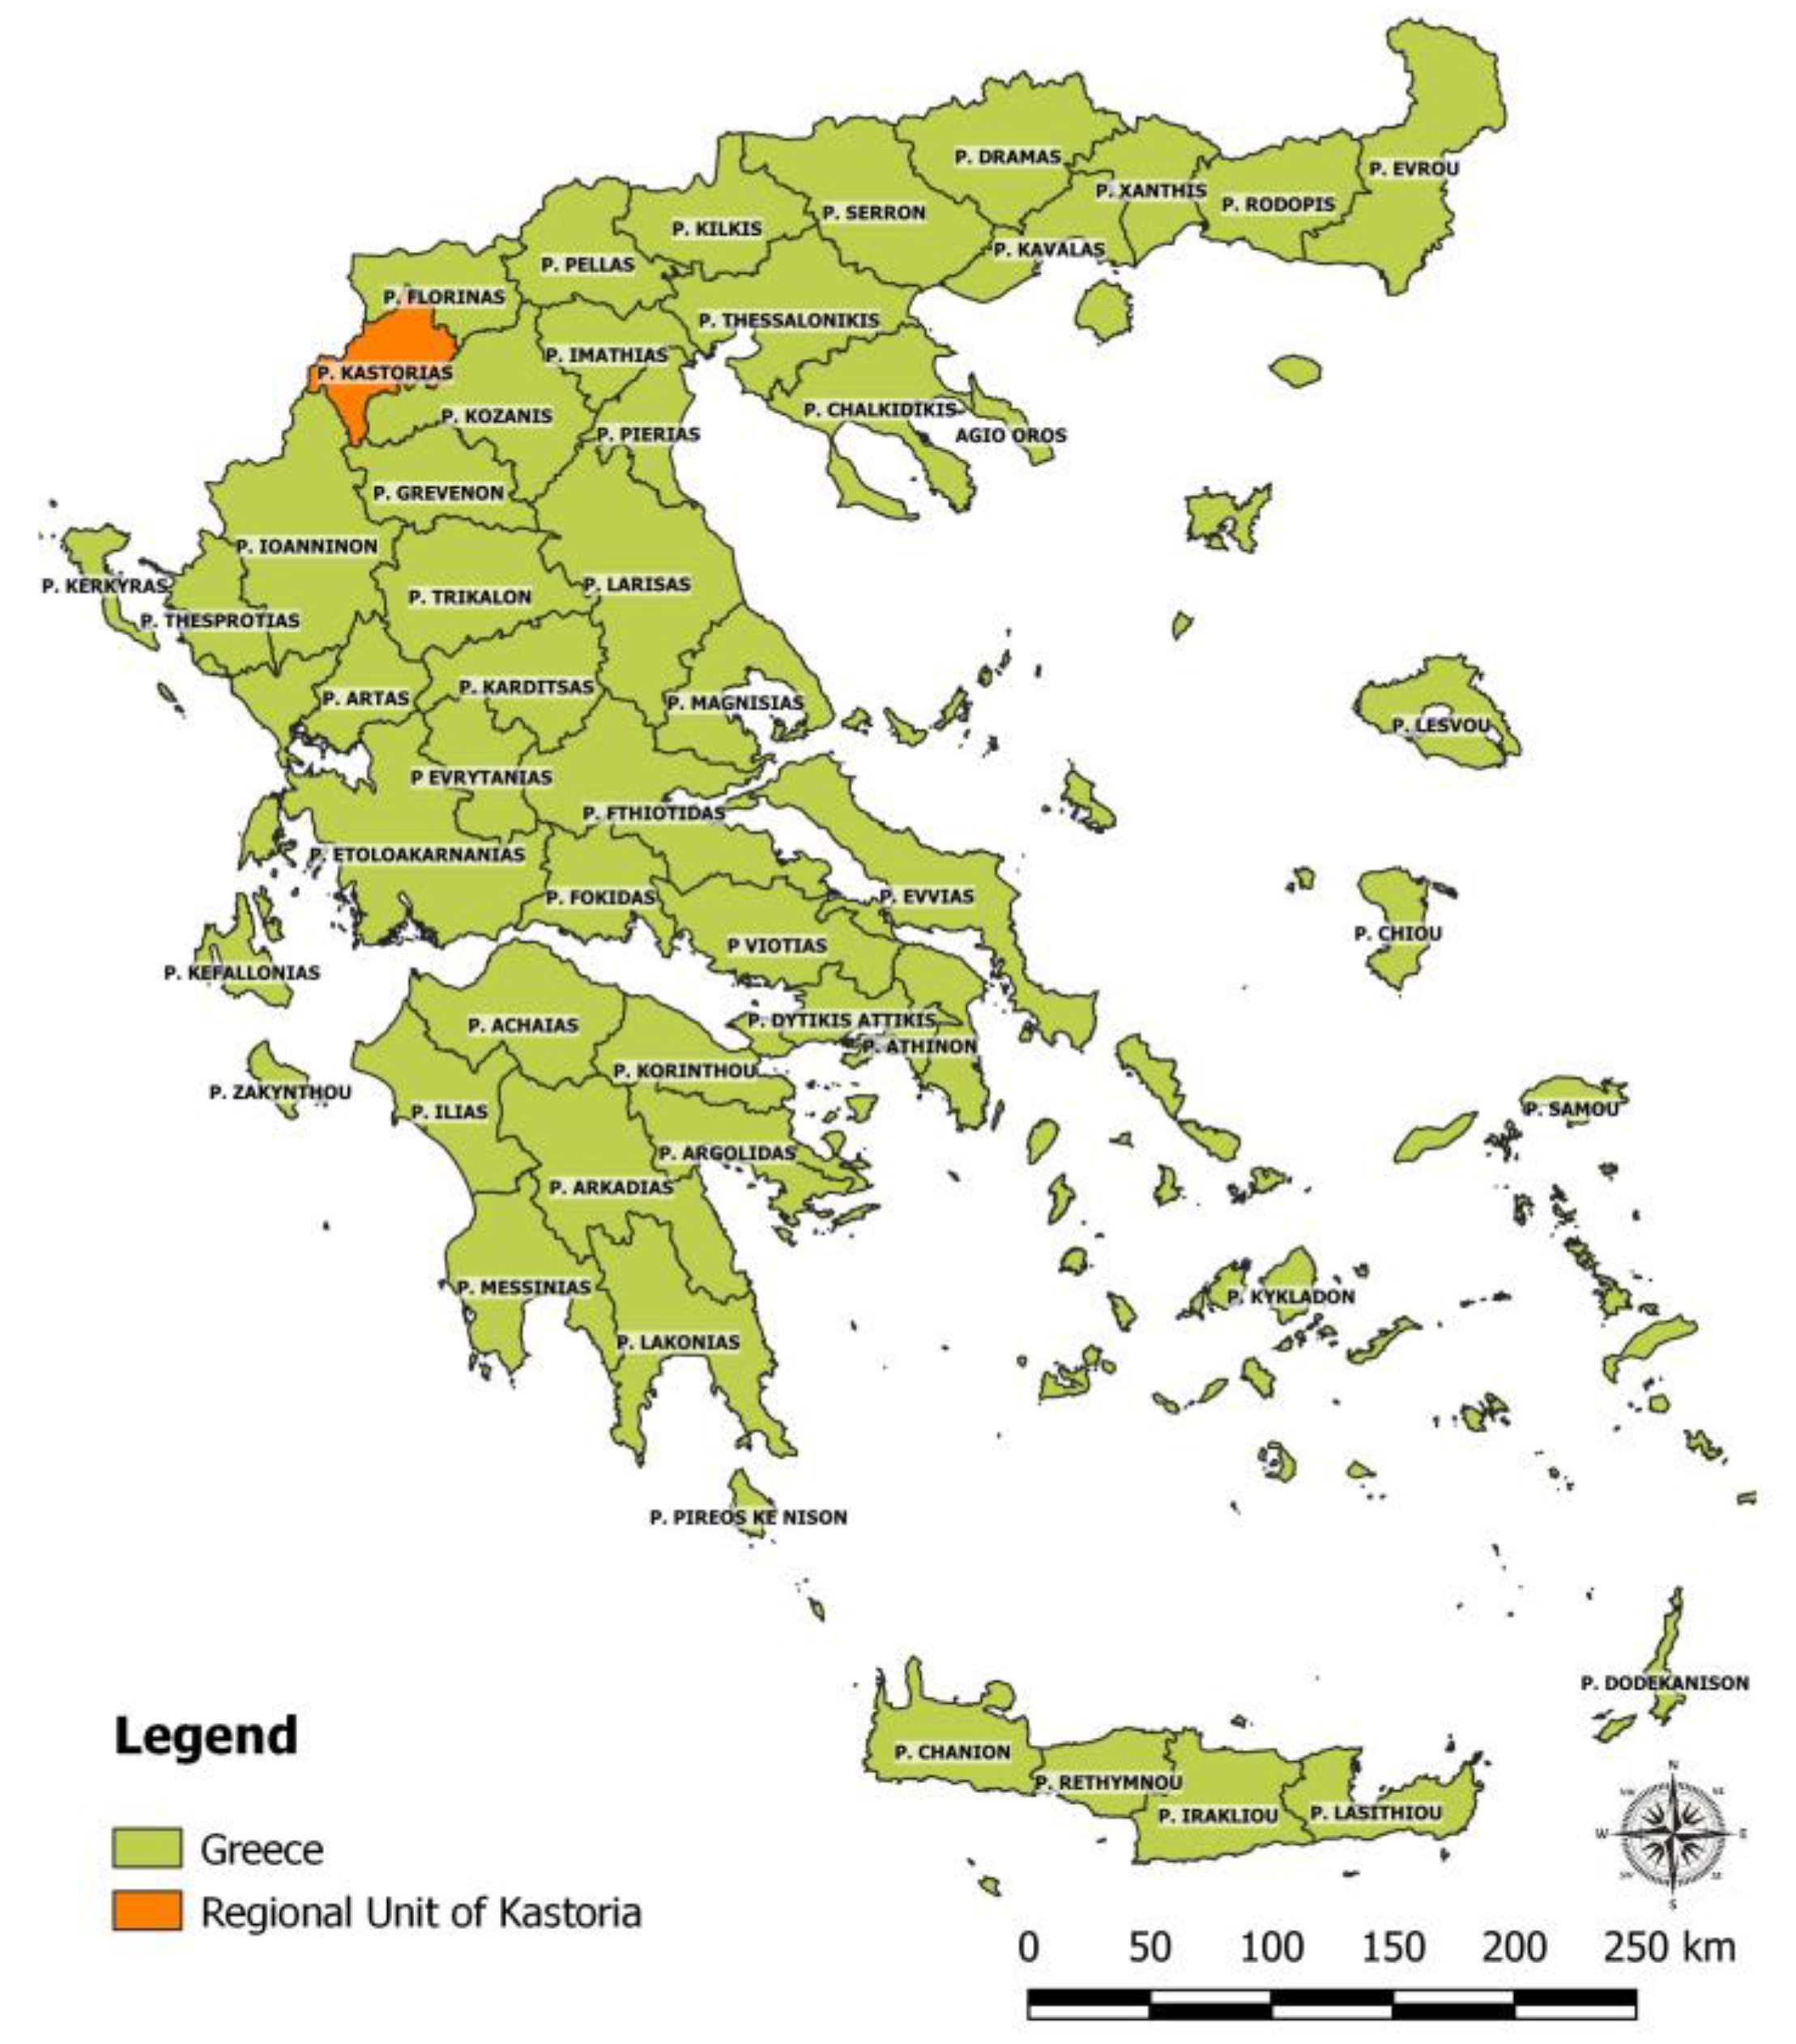
2.1. Region of Interest
2.2. Data Collection and Analysis
2.3. Statistical Analysis
3. Results and Discussion
3.1. Meteorological Factor
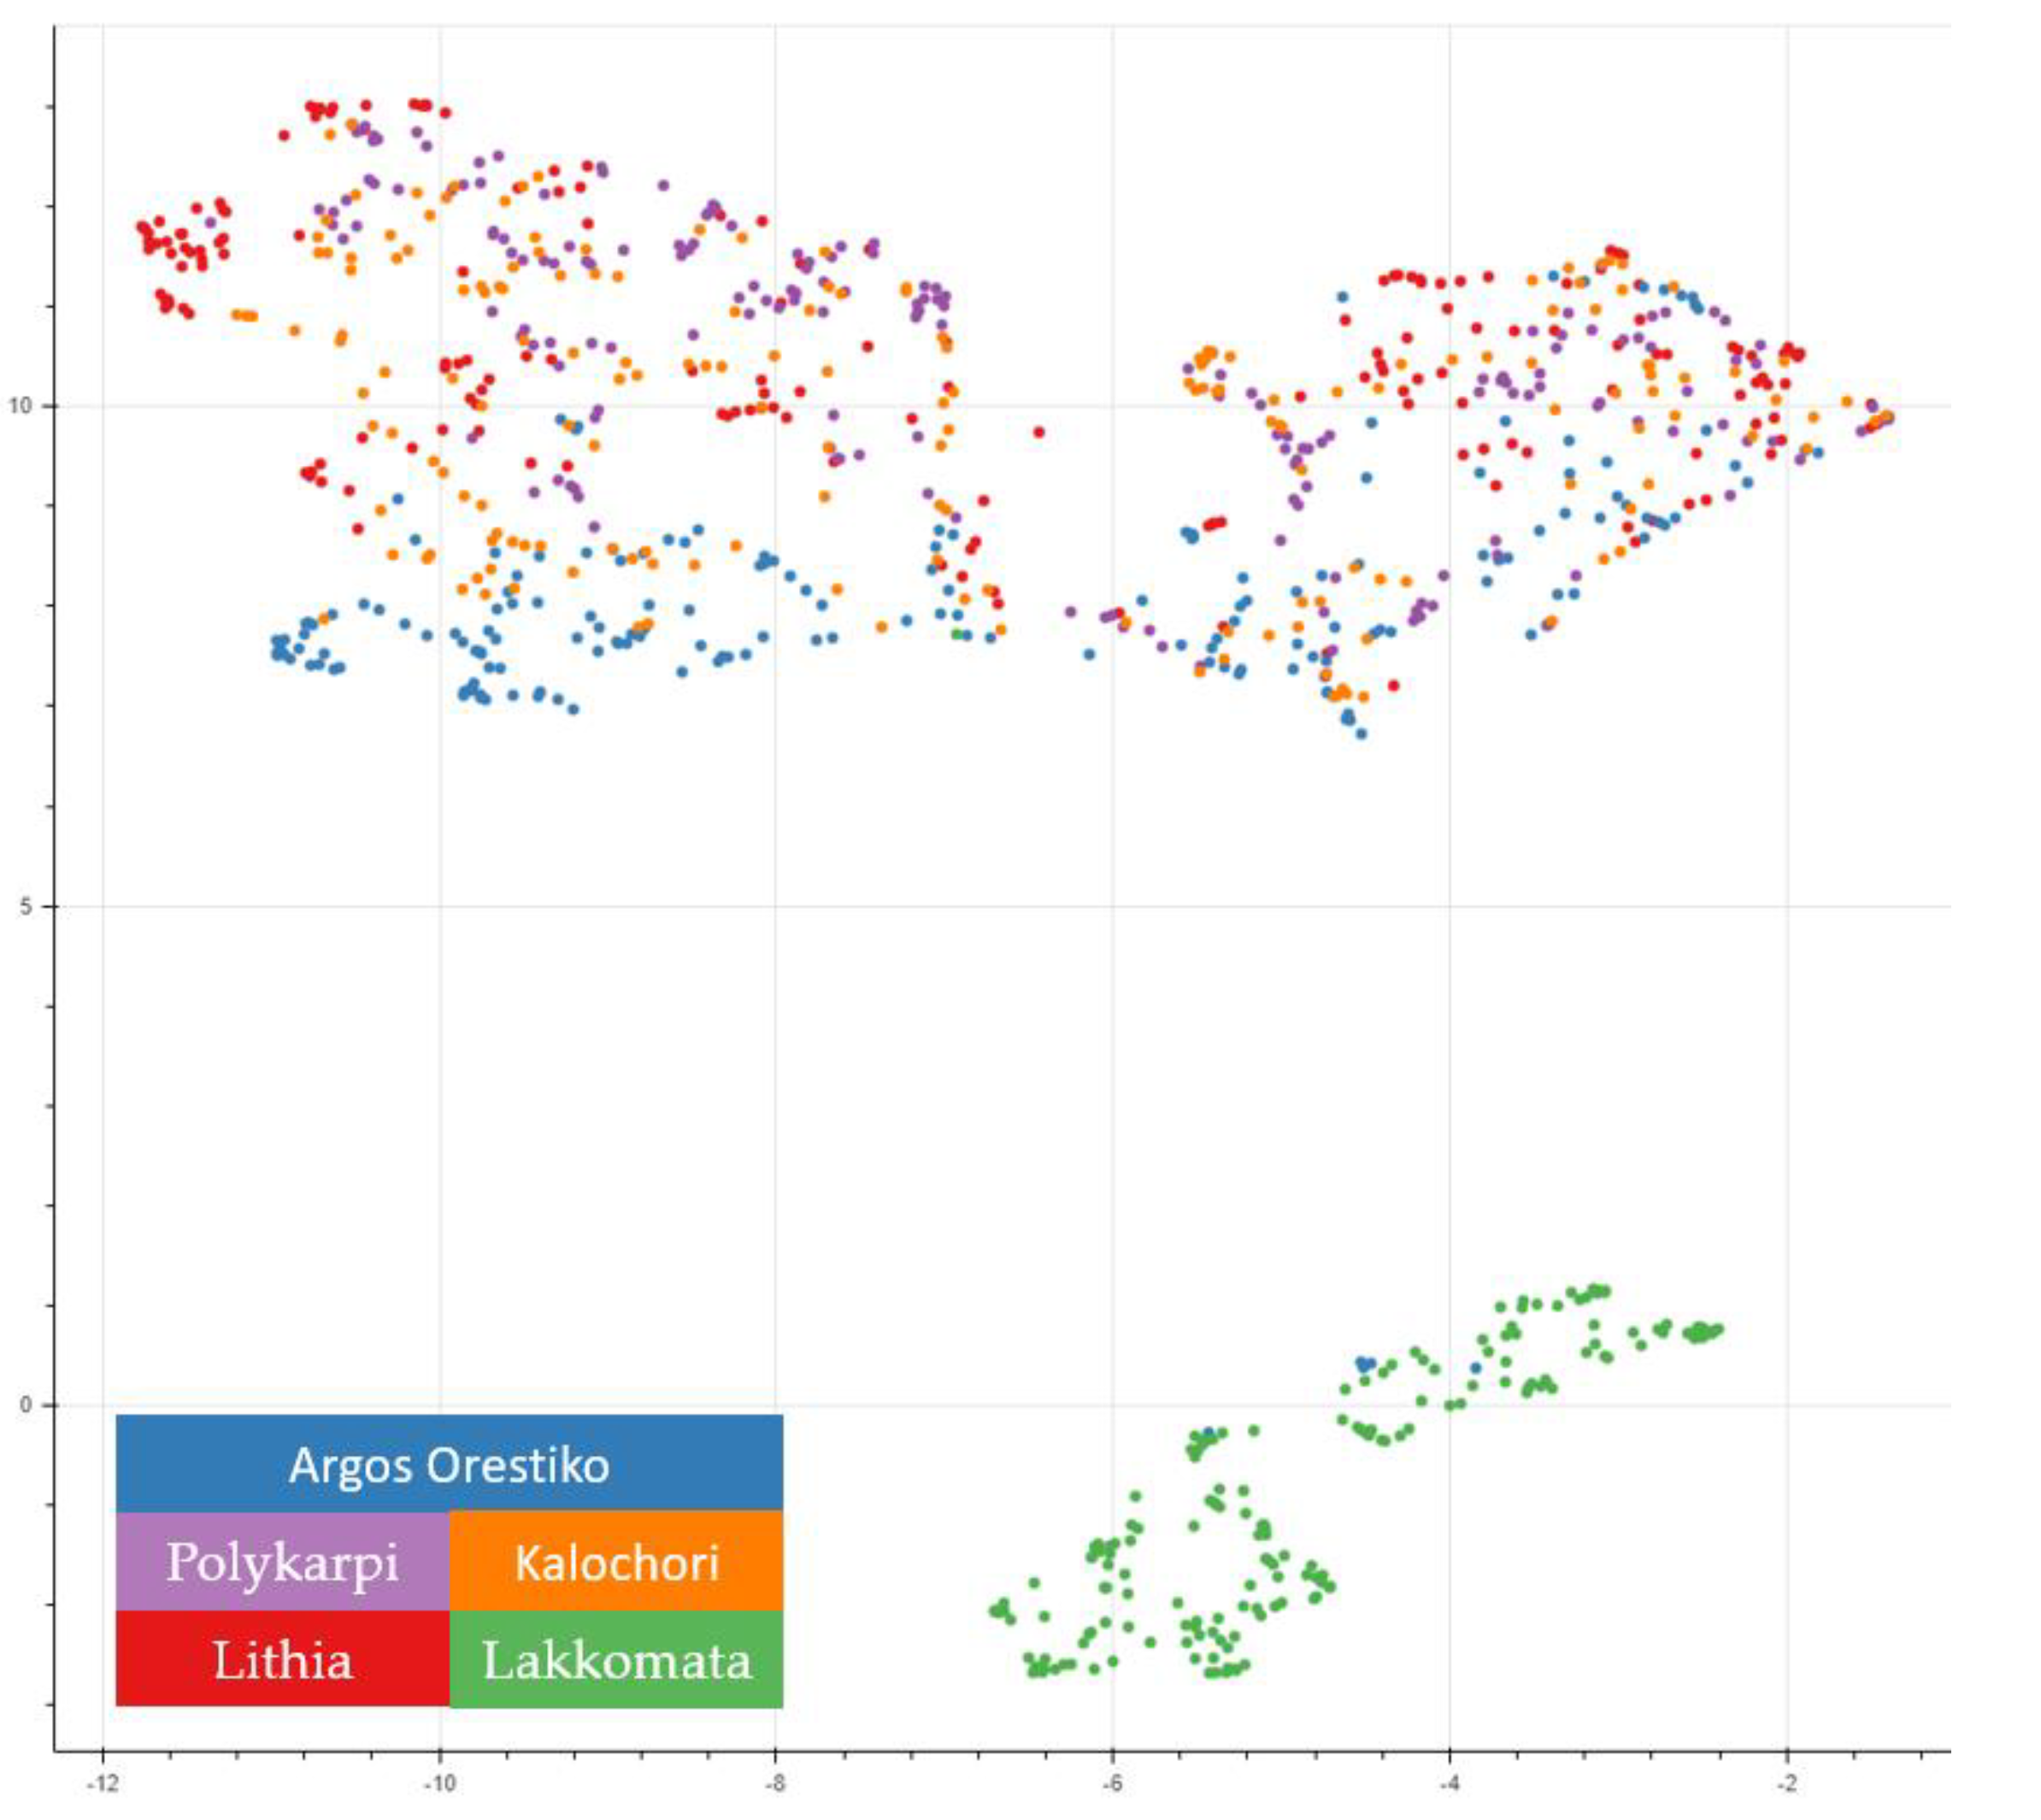
3.1.1. Descriptive Statistics and Topological Data Analysis of the Meteorological Factor
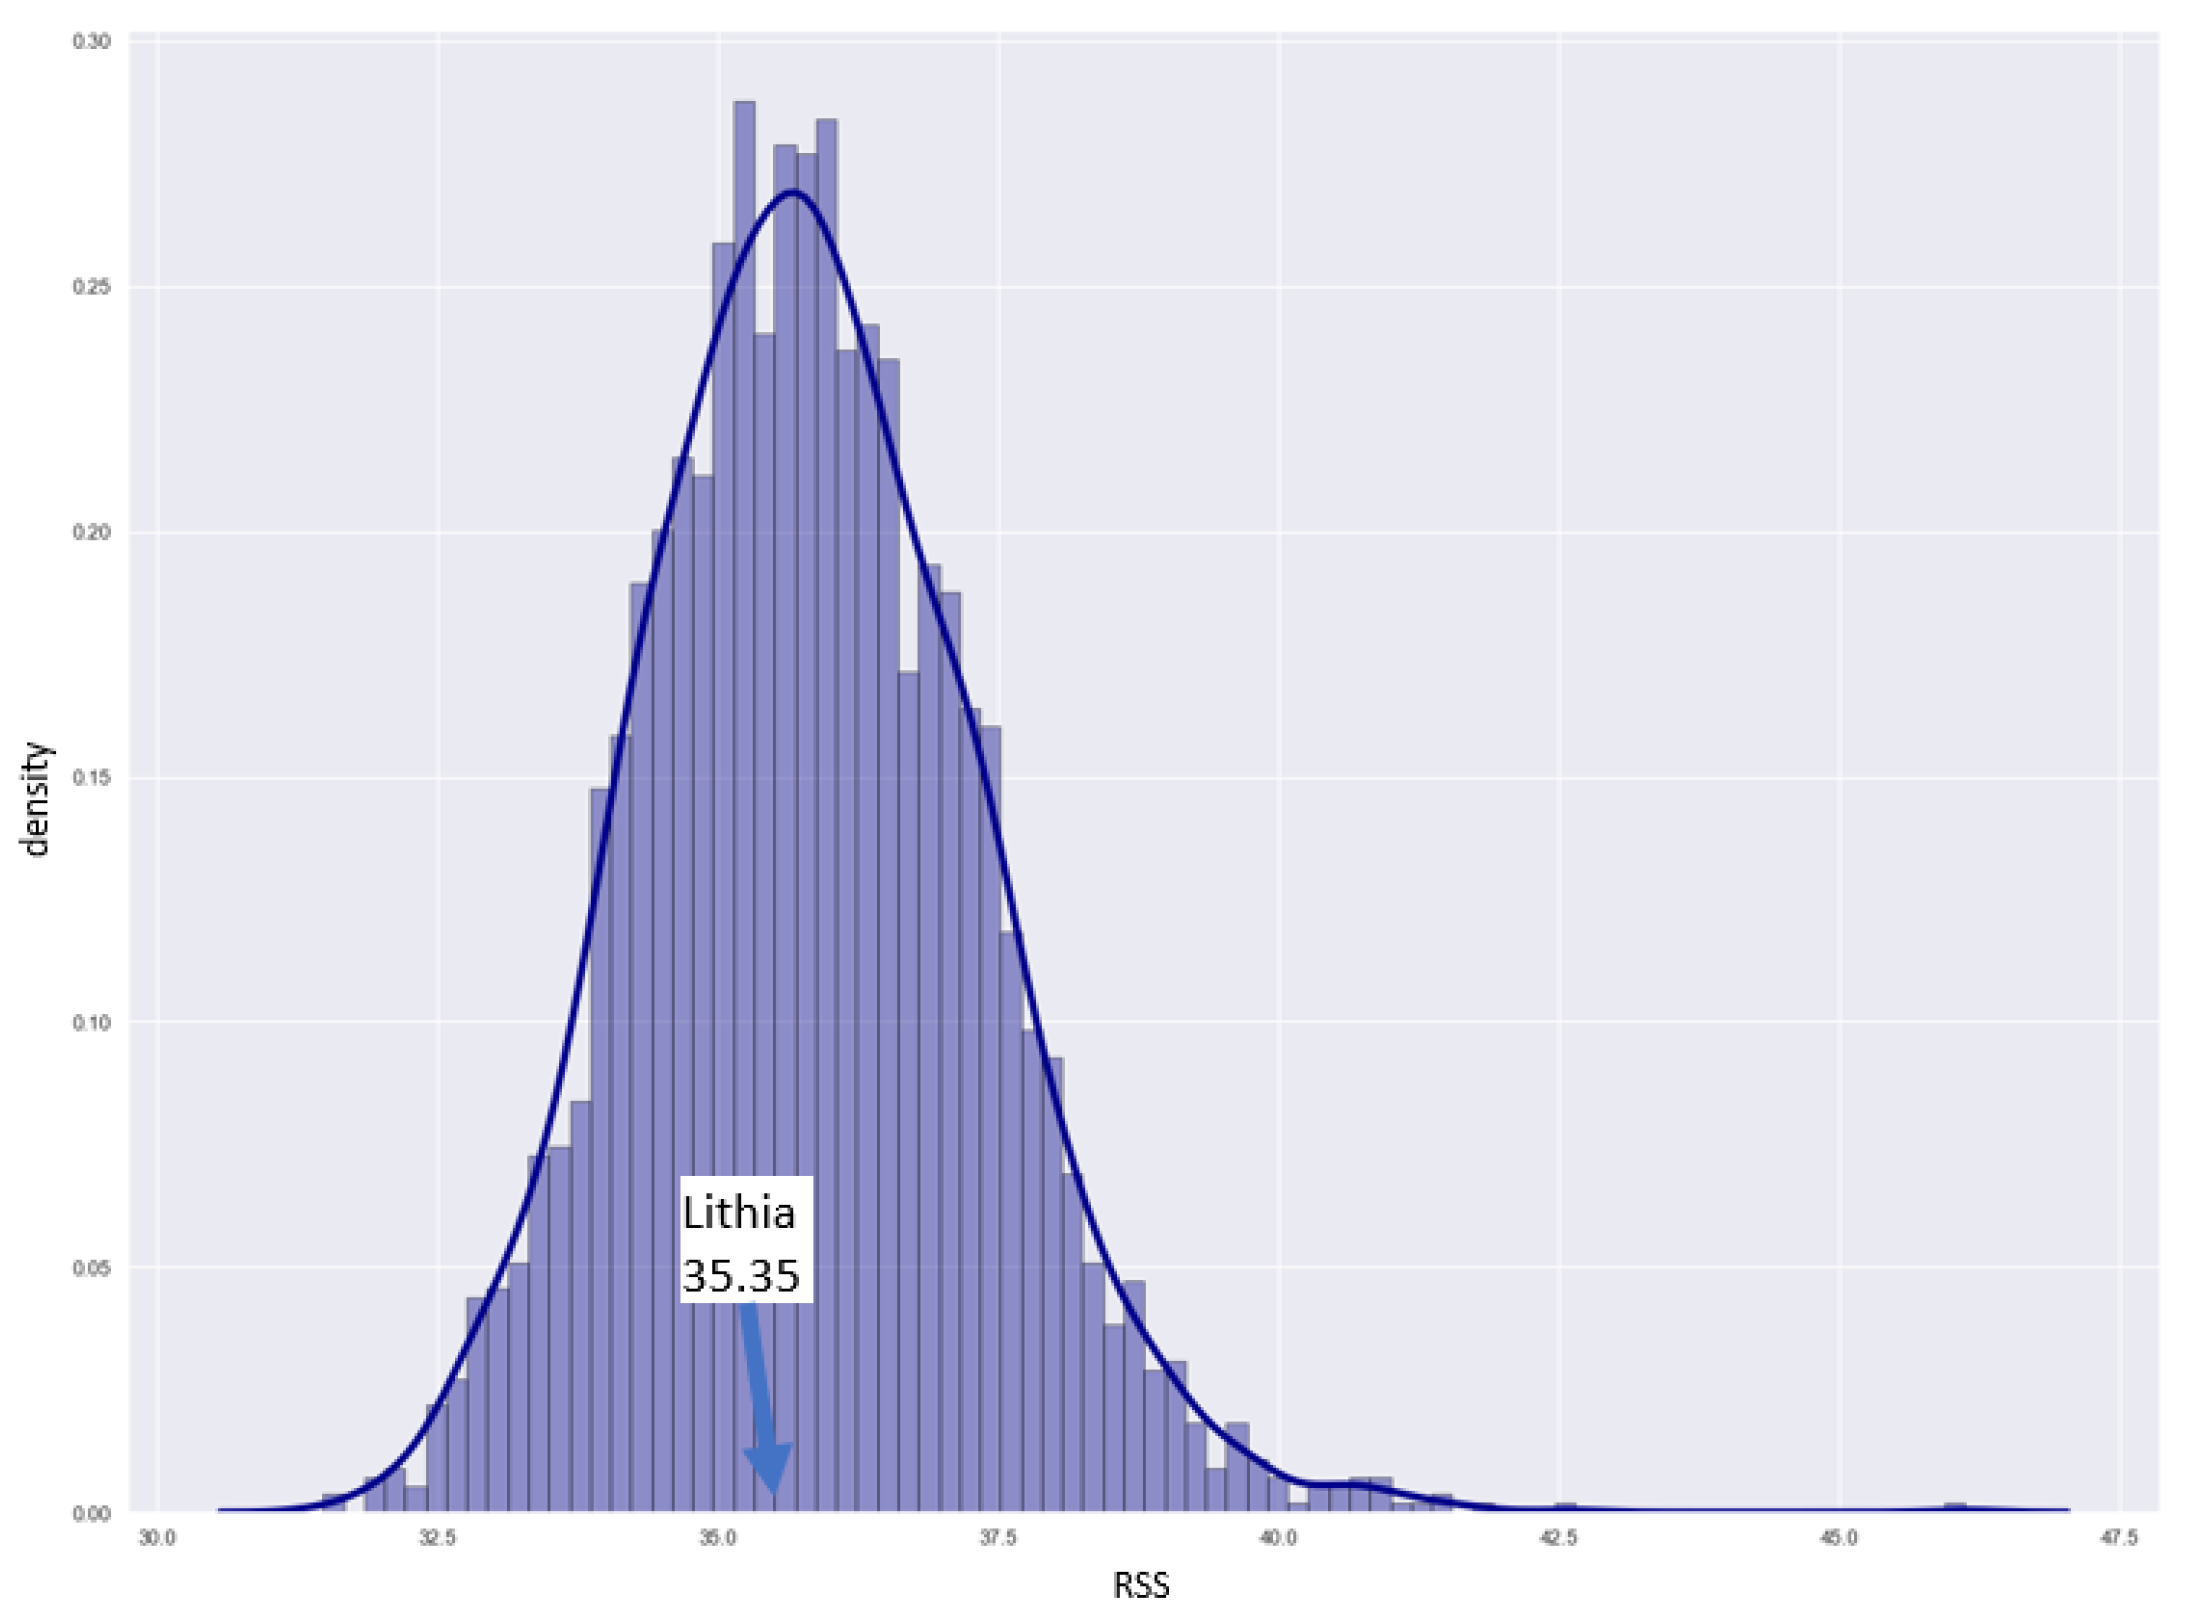
3.1.2. Statistical Analysis and Hypothesis Testing of the Meteorological Factor
3.1.3. Statistical Conclusions on the Meteorological Factor
3.2. Soil Texture Factor
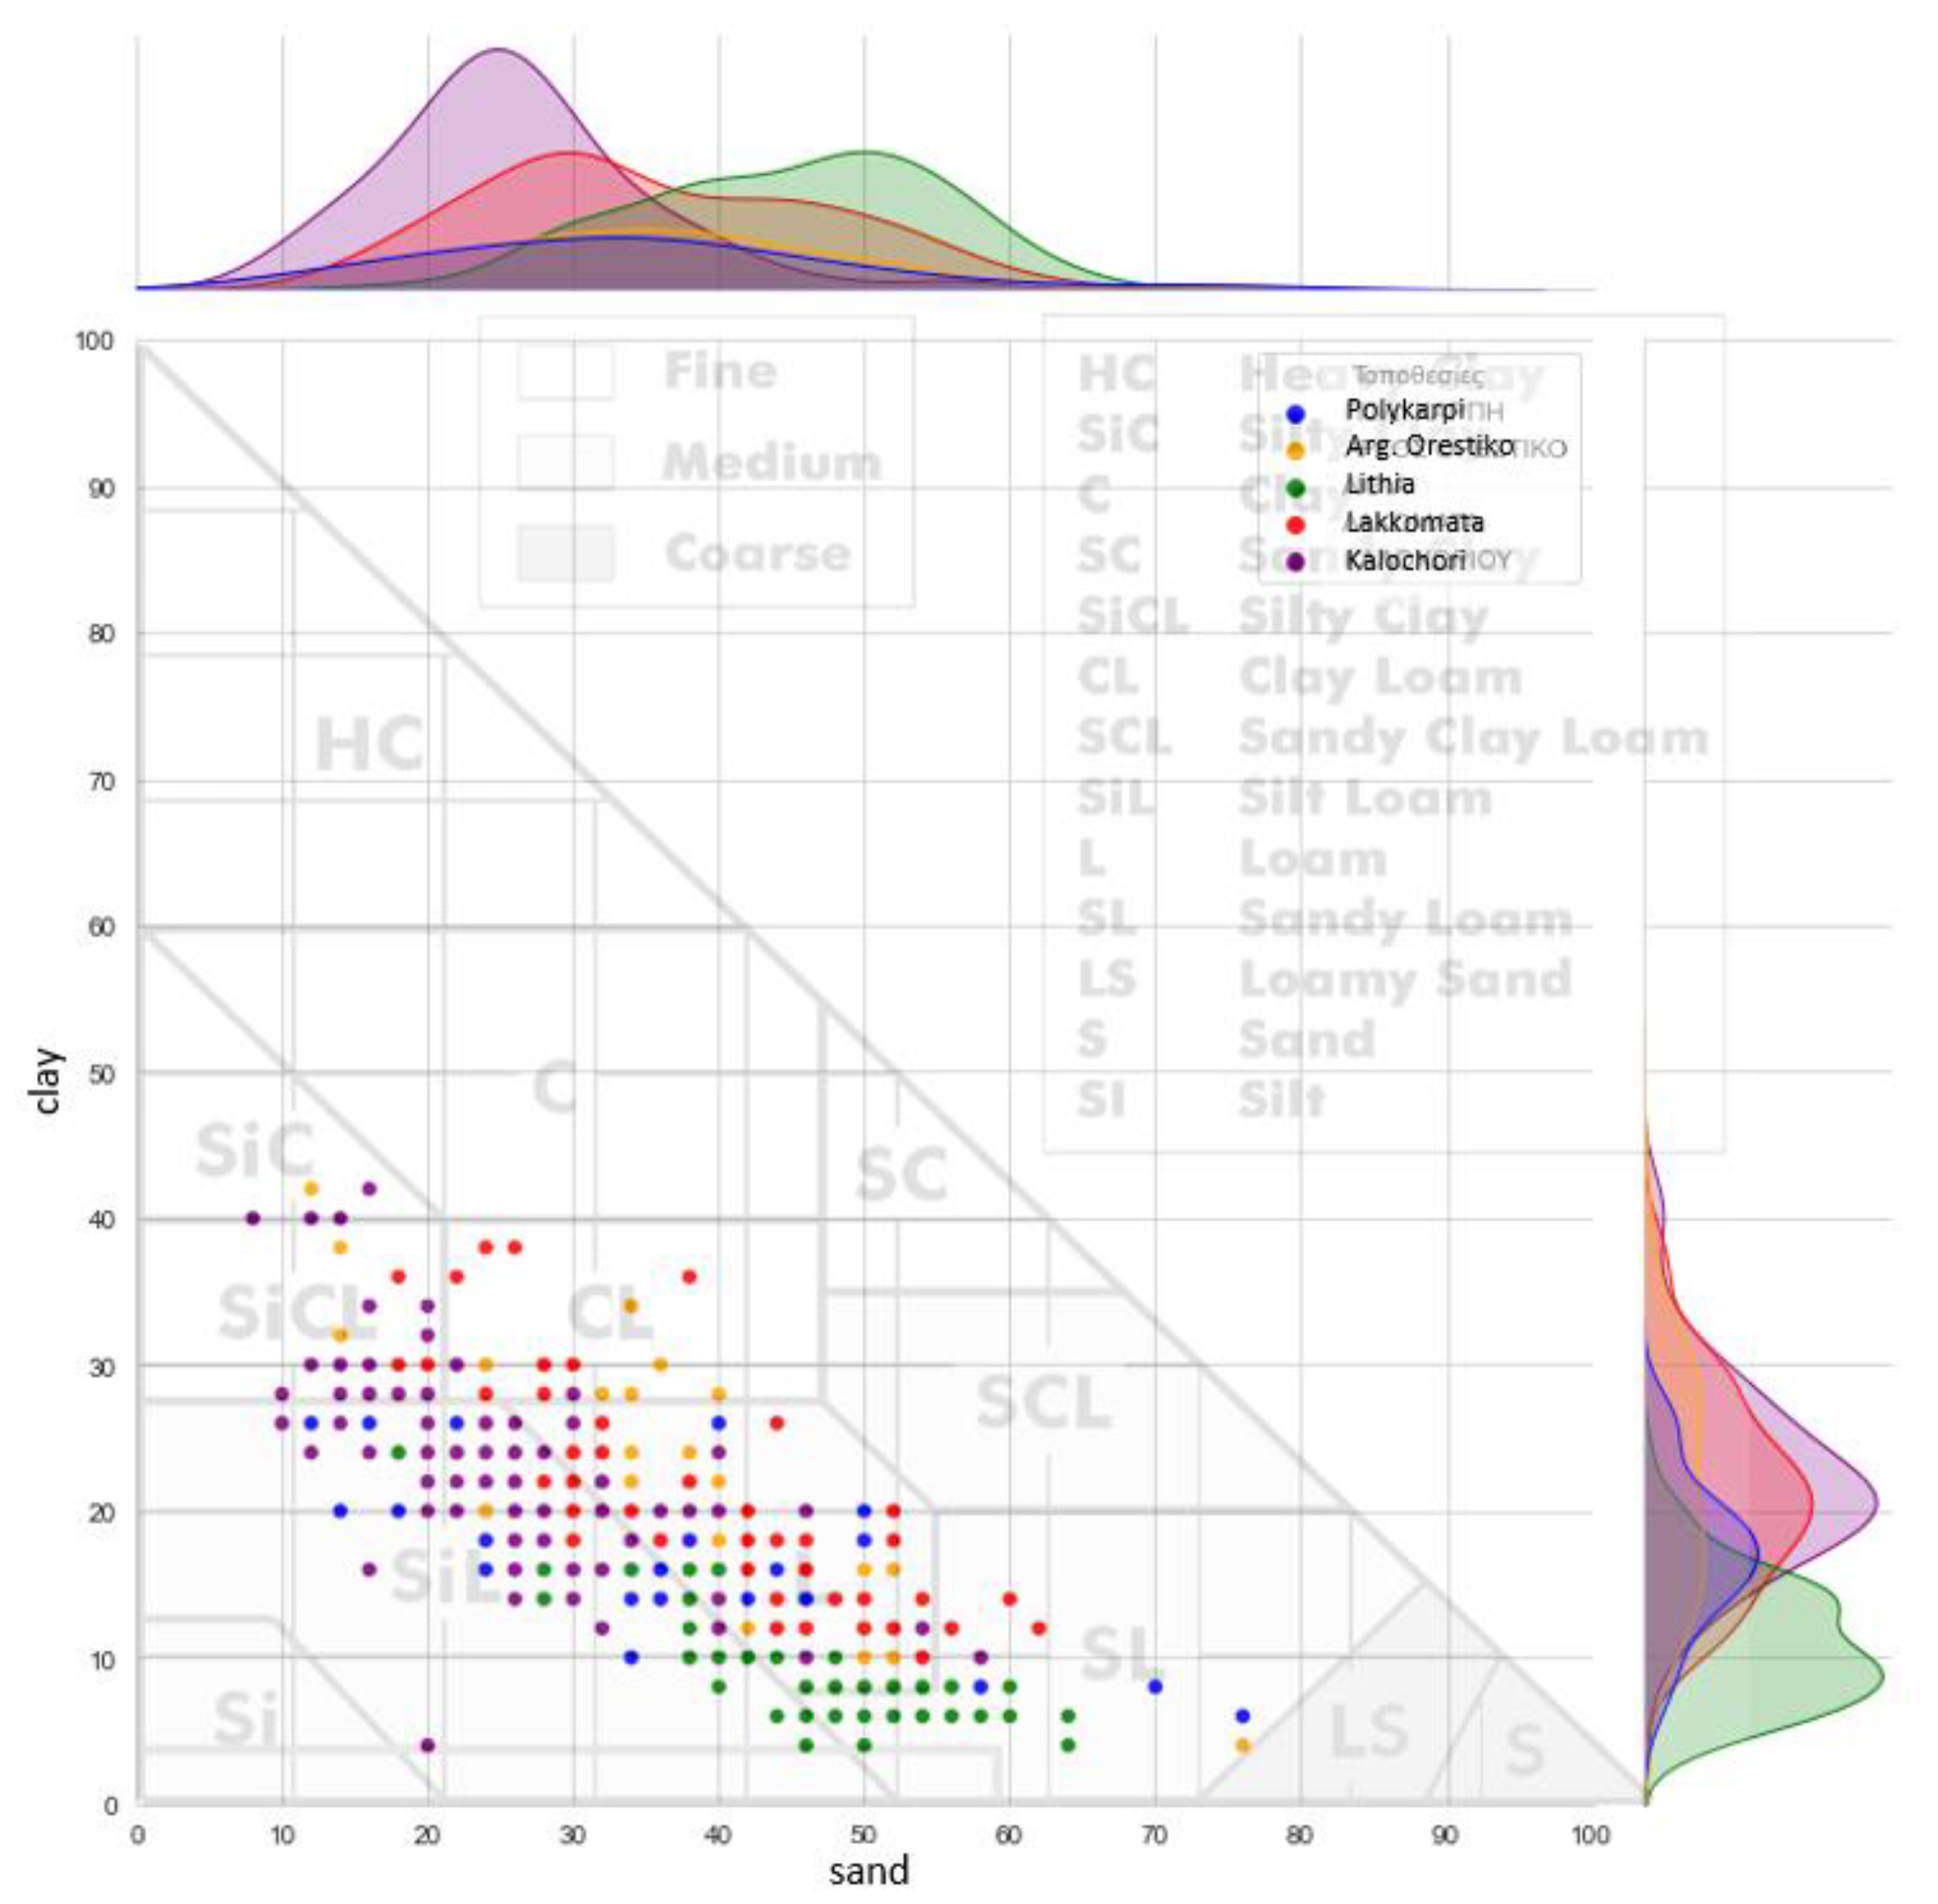
3.2.1. Descriptive Statistics of the Soil Texture Factor

3.2.2. Statistical Analysis and Hypothesis Testing of the Soil Texture Factor
3.2.3. Statistical Conclusions on the Soil Texture Factor
3.3. Proposed Sampling Schemes
4. Conclusions and Future Work
Author Contributions
Funding
Institutional Review Board Statement
Informed Consent Statement
Data Availability Statement
Acknowledgments
Conflicts of Interest
Appendix A


| Polykarpi vs. Argos Orestiko | 8.306559111725096 × 10⁻⁶ |
| Polykarpi vs. Lithia | 0.0002053205823589391 |
| Polykarpi vs. Lakkomata | 3.6336856485210914 × 10⁻⁶ |
| Polykarpi vs. Kalochori | 0.0015215140410542742 |
| Argos Orestiko vs. Lithia | 5.044428484837929 × 10⁻¹¹ |
| Argos Orestiko vs. Lakkomata | 0.22004126416018469 |
| Argos Orestiko vs. Kalochori | 1.3230744173263569 × 10⁻⁶ |
| Lithia vs. Lakkomata | 4.658235373877026 × 10⁻¹⁰ |
| Lithia vs. Kalochori | 4.682843816824416 × 10⁻⁶ |
| Lakkomata vs. Kalochori | 1.2315974377714092 × 10⁻¹² |
Appendix B
| Mechanical Class | Sand (%) | Clay (%) | Silt (%) | Sub-Region |
|---|---|---|---|---|
| SL | 70 | 8 | 22 | POLYKARPI |
| L | 40 | 22 | 38 | ARGOS ORESTIKO |
| CL | 40 | 28 | 32 | ARGOS ORESTIKO |
| SL | 50 | 8 | 42 | LITHIA |
| L | 40 | 12 | 48 | LITHIA |
| L | 38 | 16 | 46 | LITHIA |
| SL | 54 | 6 | 40 | LITHIA |
| L | 50 | 14 | 36 | LITHIA |
| SL | 56 | 6 | 38 | LITHIA |
| SiL | 30 | 16 | 54 | LITHIA |
| L | 44 | 14 | 42 | LITHIA |
| L | 40 | 14 | 46 | LITHIA |
| SL | 52 | 6 | 42 | LITHIA |
| SL | 46 | 6 | 48 | LITHIA |
| SL | 46 | 4 | 50 | LITHIA |
| SL | 46 | 8 | 46 | LITHIA |
| L | 46 | 10 | 44 | LITHIA |
| L | 40 | 12 | 48 | LITHIA |
| SL | 64 | 4 | 32 | LITHIA |
| CL | 24 | 28 | 48 | ARGOS ORESTIKO |
| L | 50 | 12 | 38 | ARGOS ORESTIKO |
| L | 42 | 12 | 46 | ARGOS ORESTIKO |
| SiCL | 14 | 30 | 56 | ARGOS ORESTIKO |
| LS | 76 | 4 | 20 | ARGOS ORESTIKO |
| SiL | 18 | 20 | 62 | POLYKARPI |
| SiL | 30 | 16 | 54 | POLYKARPI |
| L | 44 | 16 | 40 | POLYKARPI |
| L | 42 | 14 | 44 | POLYKARPI |
| SiL | 34 | 10 | 56 | LITHIA |
| SiL | 30 | 14 | 56 | LITHIA |
| L | 46 | 10 | 44 | LITHIA |
| SiL | 30 | 14 | 56 | LITHIA |
| SL | 48 | 6 | 46 | LITHIA |
| SiL | 26 | 18 | 56 | ARGOS ORESTIKO |
| SiL | 26 | 16 | 58 | ARGOS ORESTIKO |
| SiCL | 12 | 30 | 58 | ARGOS ORESTIKO |
| CL | 30 | 30 | 40 | ARGOS ORESTIKO |
| L | 40 | 14 | 46 | ARGOS ORESTIKO |
| L | 50 | 18 | 32 | LAKKOMATA |
| CL | 22 | 30 | 48 | LAKKOMATA |
| L | 30 | 22 | 48 | LAKKOMATA |
| L | 40 | 16 | 44 | LAKKOMATA |
| L | 46 | 14 | 40 | LAKKOMATA |
| SiCL | 18 | 28 | 54 | LAKKOMATA |
| L | 38 | 22 | 40 | LAKKOMATA |
| L | 32 | 22 | 46 | LAKKOMATA |
| L | 32 | 24 | 44 | LAKKOMATA |
| CL | 28 | 30 | 42 | LAKKOMATA |
| L | 30 | 24 | 46 | LAKKOMATA |
| CL | 30 | 30 | 40 | LAKKOMATA |
| SiL | 34 | 16 | 50 | LITHIA |
| L | 40 | 16 | 44 | KALOCHORI |
| SiL | 20 | 22 | 58 | KALOCHORI |
| SiL | 24 | 22 | 54 | KALOCHORI |
| SiL | 28 | 20 | 52 | KALOCHORI |
| SiL | 26 | 20 | 54 | KALOCHORI |
| SiL | 16 | 24 | 60 | KALOCHORI |
| SiL | 24 | 26 | 50 | KALOCHORI |
| SiCL | 16 | 30 | 54 | KALOCHORI |
| SiCL | 20 | 32 | 48 | KALOCHORI |
| SiCL | 12 | 40 | 48 | KALOCHORI |
| SiCL | 16 | 34 | 50 | KALOCHORI |
| CL | 22 | 30 | 48 | KALOCHORI |
| L | 38 | 18 | 44 | ARGOS ORESTIKO |
| L | 32 | 22 | 46 | KALOCHORI |
| L | 28 | 24 | 48 | KALOCHORI |
| L | 46 | 16 | 38 | ARGOS ORESTIKO |
| L | 50 | 16 | 34 | ARGOS ORESTIKO |
| SiL | 26 | 24 | 50 | ARGOS ORESTIKO |
| SiC | 12 | 42 | 46 | ARGOS ORESTIKO |
| L | 38 | 20 | 42 | ARGOS ORESTIKO |
| L | 30 | 24 | 46 | LAKKOMATA |
| L | 46 | 20 | 34 | LAKKOMATA |
| CL | 24 | 28 | 48 | LAKKOMATA |
| SiL | 22 | 24 | 54 | LAKKOMATA |
| SiCL | 18 | 30 | 52 | LAKKOMATA |
| SL | 52 | 12 | 36 | LAKKOMATA |
| SiL | 24 | 24 | 52 | LAKKOMATA |
| SiCL | 18 | 36 | 46 | LAKKOMATA |
| L | 30 | 22 | 48 | LAKKOMATA |
| CL | 24 | 30 | 46 | LAKKOMATA |
| SiCL | 16 | 28 | 56 | LAKKOMATA |
| SL | 52 | 12 | 36 | LAKKOMATA |
| L | 40 | 16 | 44 | LAKKOMATA |
| L | 38 | 18 | 44 | LAKKOMATA |
| SL | 54 | 10 | 36 | LAKKOMATA |
| L | 30 | 24 | 46 | LAKKOMATA |
| L | 34 | 18 | 48 | LAKKOMATA |
| SiL | 26 | 22 | 52 | LAKKOMATA |
| L | 34 | 18 | 48 | LAKKOMATA |
| SL | 54 | 10 | 36 | LAKKOMATA |
| L | 42 | 16 | 42 | LAKKOMATA |
| CL | 30 | 28 | 42 | ARGOS ORESTIKO |
| CL | 34 | 28 | 38 | ARGOS ORESTIKO |
| SiL | 24 | 22 | 54 | KALOCHORI |
| SiL | 20 | 24 | 56 | KALOCHORI |
| SiCL | 20 | 28 | 52 | KALOCHORI |
| L | 36 | 20 | 44 | KALOCHORI |
| SiC | 16 | 42 | 42 | KALOCHORI |
| L | 36 | 20 | 44 | KALOCHORI |
| L | 40 | 24 | 36 | KALOCHORI |
| SiL | 20 | 4 | 76 | KALOCHORI |
| SiL | 24 | 24 | 52 | KALOCHORI |
| SiCL | 16 | 34 | 50 | KALOCHORI |
| SiL | 14 | 26 | 60 | KALOCHORI |
| SiCL | 14 | 28 | 58 | KALOCHORI |
| SiCL | 10 | 28 | 62 | KALOCHORI |
| SiL | 22 | 24 | 54 | KALOCHORI |
| L | 38 | 16 | 46 | ARGOS ORESTIKO |
| SL | 52 | 8 | 40 | LITHIA |
| L | 44 | 10 | 46 | LITHIA |
| SiL | 30 | 14 | 56 | LITHIA |
| SL | 56 | 8 | 36 | LITHIA |
| SiL | 30 | 18 | 52 | LITHIA |
| SL | 56 | 8 | 36 | LITHIA |
| L | 38 | 14 | 48 | LITHIA |
| SL | 64 | 6 | 30 | LITHIA |
| SiL | 38 | 10 | 52 | LITHIA |
| SiL | 30 | 14 | 56 | LITHIA |
| SL | 48 | 6 | 46 | LITHIA |
| SiL | 40 | 10 | 50 | POLYKARPI |
| SiL | 34 | 14 | 52 | POLYKARPI |
| SL | 44 | 6 | 50 | LITHIA |
| SL | 54 | 8 | 38 | LITHIA |
| SiL | 30 | 20 | 50 | LITHIA |
| SL | 54 | 6 | 40 | LITHIA |
| SL | 60 | 6 | 34 | LITHIA |
| SL | 50 | 4 | 46 | LITHIA |
| SL | 50 | 6 | 44 | LITHIA |
| SiL | 36 | 14 | 50 | LITHIA |
| SiL | 38 | 10 | 52 | LITHIA |
| SiL | 40 | 10 | 50 | LITHIA |
| L | 50 | 12 | 38 | LITHIA |
| SL | 60 | 8 | 32 | LITHIA |
| L | 50 | 14 | 36 | LITHIA |
| SL | 54 | 10 | 36 | LITHIA |
| SL | 58 | 6 | 36 | LITHIA |
| SL | 54 | 8 | 38 | LITHIA |
| L | 38 | 20 | 42 | LITHIA |
| L | 50 | 12 | 38 | LITHIA |
| L | 48 | 14 | 38 | LITHIA |
| SL | 58 | 10 | 32 | LITHIA |
| SL | 54 | 12 | 34 | LITHIA |
| L | 46 | 14 | 40 | LITHIA |
| SL | 52 | 10 | 38 | LITHIA |
| SL | 56 | 8 | 36 | LITHIA |
| L | 40 | 14 | 46 | LITHIA |
| SiL | 24 | 20 | 56 | LITHIA |
| SL | 58 | 8 | 34 | LITHIA |
| SL | 56 | 12 | 32 | LITHIA |
| SL | 54 | 10 | 36 | LITHIA |
| L | 50 | 14 | 36 | LITHIA |
| L | 46 | 20 | 34 | LITHIA |
| SiL | 26 | 16 | 58 | POLYKARPI |
| SL | 58 | 8 | 34 | POLYKARPI |
| SiL | 28 | 16 | 56 | POLYKARPI |
| SiL | 34 | 10 | 56 | POLYKARPI |
| SiL | 18 | 24 | 58 | POLYKARPI |
| L | 34 | 20 | 46 | POLYKARPI |
| SiL | 10 | 26 | 64 | POLYKARPI |
| SiL | 34 | 16 | 50 | POLYKARPI |
| L | 46 | 14 | 40 | POLYKARPI |
| SiL | 12 | 26 | 62 | POLYKARPI |
| SiL | 22 | 26 | 52 | POLYKARPI |
| SiL | 26 | 20 | 54 | POLYKARPI |
| SiL | 22 | 20 | 58 | POLYKARPI |
| SiL | 18 | 20 | 62 | POLYKARPI |
| L | 34 | 18 | 48 | POLYKARPI |
| L | 40 | 26 | 34 | POLYKARPI |
| SiL | 26 | 20 | 54 | KALOCHORI |
| CL | 30 | 28 | 42 | KALOCHORI |
| SiL | 22 | 20 | 58 | KALOCHORI |
| SiL | 22 | 20 | 58 | KALOCHORI |
| SiL | 22 | 22 | 56 | KALOCHORI |
| SiL | 30 | 20 | 50 | KALOCHORI |
| SiL | 30 | 16 | 54 | KALOCHORI |
| SiL | 32 | 16 | 52 | KALOCHORI |
| SiL | 28 | 20 | 52 | KALOCHORI |
| SiL | 20 | 22 | 58 | KALOCHORI |
| SiL | 24 | 20 | 56 | KALOCHORI |
| SiL | 22 | 20 | 58 | KALOCHORI |
| CL | 24 | 38 | 38 | LAKKOMATA |
| CL | 22 | 36 | 42 | LAKKOMATA |
| CL | 28 | 30 | 42 | LAKKOMATA |
| SiCL | 14 | 30 | 56 | LAKKOMATA |
| SL | 54 | 10 | 36 | POLYKARPI |
| SiL | 40 | 10 | 50 | LITHIA |
| L | 42 | 10 | 48 | LITHIA |
| SL | 58 | 10 | 32 | LITHIA |
| SiL | 38 | 10 | 52 | LITHIA |
| SiL | 30 | 18 | 52 | LITHIA |
| SiL | 30 | 16 | 54 | LITHIA |
| SiL | 40 | 8 | 52 | LITHIA |
| SL | 52 | 8 | 40 | LITHIA |
| SiCL | 14 | 40 | 46 | KALOCHORI |
| SiCL | 14 | 30 | 56 | KALOCHORI |
| SL | 54 | 12 | 34 | KALOCHORI |
| L | 40 | 14 | 46 | KALOCHORI |
| L | 44 | 12 | 44 | POLYKARPI |
| L | 36 | 16 | 48 | POLYKARPI |
| L | 36 | 18 | 46 | POLYKARPI |
| SiL | 28 | 16 | 56 | LITHIA |
| SiCL | 14 | 38 | 48 | ARGOS ORESTIKO |
| SiCL | 14 | 32 | 54 | ARGOS ORESTIKO |
| CL | 34 | 34 | 32 | ARGOS ORESTIKO |
| SiCL | 20 | 30 | 50 | ARGOS ORESTIKO |
| L | 38 | 24 | 38 | ARGOS ORESTIKO |
| CL | 24 | 30 | 46 | ARGOS ORESTIKO |
| SL | 52 | 16 | 32 | ARGOS ORESTIKO |
| SL | 52 | 10 | 38 | ARGOS ORESTIKO |
| L | 40 | 12 | 48 | ARGOS ORESTIKO |
| SiL | 28 | 22 | 50 | LAKKOMATA |
| L | 32 | 20 | 48 | ARGOS ORESTIKO |
| SiL | 30 | 16 | 54 | ARGOS ORESTIKO |
| CL | 32 | 28 | 40 | ARGOS ORESTIKO |
| L | 44 | 18 | 38 | LAKKOMATA |
| SL | 54 | 10 | 36 | LAKKOMATA |
| SiL | 24 | 24 | 52 | LAKKOMATA |
| SiL | 30 | 18 | 52 | LAKKOMATA |
| L | 34 | 20 | 46 | LAKKOMATA |
| L | 32 | 24 | 44 | LAKKOMATA |
| L | 30 | 22 | 48 | LAKKOMATA |
| L | 38 | 22 | 40 | LAKKOMATA |
| L | 40 | 20 | 40 | LAKKOMATA |
| CL | 22 | 30 | 48 | LAKKOMATA |
| SL | 52 | 20 | 28 | LAKKOMATA |
| L | 50 | 12 | 38 | ARGOS ORESTIKO |
| SiL | 20 | 24 | 56 | LAKKOMATA |
| L | 30 | 22 | 48 | LAKKOMATA |
| L | 44 | 18 | 38 | LAKKOMATA |
| SL | 54 | 14 | 32 | LAKKOMATA |
| L | 42 | 18 | 40 | LAKKOMATA |
| SiL | 24 | 26 | 50 | LAKKOMATA |
| CL | 38 | 36 | 26 | LAKKOMATA |
| L | 44 | 26 | 30 | LAKKOMATA |
| SiCL | 20 | 30 | 50 | LAKKOMATA |
| L | 30 | 24 | 46 | LAKKOMATA |
| CL | 26 | 38 | 36 | LAKKOMATA |
| L | 38 | 18 | 44 | LAKKOMATA |
| SiL | 30 | 20 | 50 | LAKKOMATA |
| SiL | 30 | 20 | 50 | LAKKOMATA |
| L | 32 | 20 | 48 | LAKKOMATA |
| L | 46 | 18 | 36 | LAKKOMATA |
| L | 32 | 20 | 48 | LAKKOMATA |
| SiL | 26 | 22 | 52 | KALOCHORI |
| CL | 22 | 30 | 48 | KALOCHORI |
| SiL | 26 | 24 | 50 | KALOCHORI |
| SiCL | 16 | 28 | 56 | KALOCHORI |
| SiL | 26 | 24 | 50 | ARGOS ORESTIKO |
| L | 34 | 22 | 44 | ARGOS ORESTIKO |
| SiL | 14 | 20 | 66 | POLYKARPI |
| L | 50 | 18 | 32 | POLYKARPI |
| SL | 48 | 8 | 44 | LITHIA |
| L | 48 | 10 | 42 | LITHIA |
| SiL | 24 | 18 | 58 | KALOCHORI |
| SiL | 26 | 18 | 56 | KALOCHORI |
| SiL | 20 | 20 | 60 | KALOCHORI |
| SiL | 30 | 14 | 56 | KALOCHORI |
| SiL | 26 | 18 | 56 | KALOCHORI |
| SiL | 24 | 18 | 58 | KALOCHORI |
| SiL | 28 | 14 | 58 | KALOCHORI |
| SiL | 26 | 22 | 52 | KALOCHORI |
| SiL | 26 | 16 | 58 | KALOCHORI |
| SiL | 26 | 14 | 60 | KALOCHORI |
| SiL | 30 | 16 | 54 | KALOCHORI |
| SiL | 24 | 22 | 54 | KALOCHORI |
| SiL | 24 | 20 | 56 | KALOCHORI |
| L | 40 | 20 | 40 | KALOCHORI |
| L | 38 | 20 | 42 | KALOCHORI |
| SiL | 26 | 24 | 50 | KALOCHORI |
| L | 32 | 22 | 46 | KALOCHORI |
| SiL | 28 | 20 | 52 | KALOCHORI |
| L | 46 | 20 | 34 | KALOCHORI |
| L | 36 | 18 | 46 | KALOCHORI |
| SiL | 22 | 24 | 54 | KALOCHORI |
| SiL | 26 | 20 | 54 | KALOCHORI |
| SiL | 26 | 22 | 52 | KALOCHORI |
| SiL | 30 | 16 | 54 | KALOCHORI |
| SiCL | 20 | 28 | 52 | KALOCHORI |
| SiCL | 8 | 40 | 52 | KALOCHORI |
| SiL | 12 | 24 | 64 | KALOCHORI |
| SiL | 32 | 12 | 56 | KALOCHORI |
| SiL | 16 | 16 | 68 | KALOCHORI |
| SiL | 10 | 26 | 64 | KALOCHORI |
| L | 34 | 18 | 48 | KALOCHORI |
| L | 34 | 18 | 48 | KALOCHORI |
| SiCL | 20 | 28 | 52 | KALOCHORI |
| L | 30 | 26 | 44 | KALOCHORI |
| SiL | 20 | 26 | 54 | KALOCHORI |
| SL | 58 | 10 | 32 | KALOCHORI |
| SiL | 32 | 16 | 52 | KALOCHORI |
| L | 40 | 12 | 48 | KALOCHORI |
| SiL | 20 | 24 | 56 | KALOCHORI |
| SiL | 28 | 18 | 54 | KALOCHORI |
| SiL | 30 | 20 | 50 | KALOCHORI |
| L | 26 | 26 | 48 | KALOCHORI |
| L | 36 | 20 | 44 | KALOCHORI |
| L | 32 | 20 | 48 | KALOCHORI |
| SL | 76 | 6 | 18 | POLYKARPI |
| L | 50 | 20 | 30 | POLYKARPI |
| L | 50 | 10 | 40 | ARGOS ORESTIKO |
| L | 38 | 16 | 46 | ARGOS ORESTIKO |
| SL | 48 | 8 | 44 | LITHIA |
| L | 38 | 14 | 48 | LITHIA |
| SiL | 28 | 18 | 54 | POLYKARPI |
| SiL | 24 | 18 | 58 | POLYKARPI |
| SiL | 24 | 16 | 60 | POLYKARPI |
| L | 38 | 18 | 44 | POLYKARPI |
| L | 48 | 14 | 38 | POLYKARPI |
| SiL | 28 | 14 | 58 | POLYKARPI |
| L | 36 | 18 | 46 | POLYKARPI |
| SiL | 26 | 20 | 54 | POLYKARPI |
| L | 36 | 16 | 48 | POLYKARPI |
| SiL | 16 | 26 | 58 | POLYKARPI |
| SiL | 34 | 16 | 50 | LITHIA |
| SL | 50 | 8 | 42 | LITHIA |
| SiL | 28 | 14 | 58 | LITHIA |
| L | 40 | 16 | 44 | LITHIA |
| SiL | 18 | 24 | 58 | LITHIA |
| L | 38 | 16 | 46 | LITHIA |
| L | 42 | 20 | 38 | LAKKOMATA |
| SL | 60 | 14 | 26 | LAKKOMATA |
| L | 32 | 26 | 42 | LAKKOMATA |
| SiL | 24 | 24 | 52 | LAKKOMATA |
| SiCL | 18 | 28 | 54 | LAKKOMATA |
| CL | 28 | 30 | 42 | LAKKOMATA |
| SL | 52 | 18 | 30 | LAKKOMATA |
| L | 46 | 16 | 38 | LAKKOMATA |
| SL | 62 | 12 | 26 | LAKKOMATA |
| L | 50 | 12 | 38 | LAKKOMATA |
| L | 48 | 14 | 38 | LAKKOMATA |
| SL | 56 | 12 | 32 | LAKKOMATA |
| L | 44 | 14 | 42 | LAKKOMATA |
| L | 44 | 12 | 44 | LAKKOMATA |
| L | 46 | 12 | 42 | LAKKOMATA |
| L | 44 | 14 | 42 | LAKKOMATA |
| L | 36 | 18 | 46 | LAKKOMATA |
| L | 46 | 12 | 42 | LAKKOMATA |
| L | 34 | 20 | 46 | LAKKOMATA |
| SiL | 30 | 20 | 50 | LAKKOMATA |
| L | 46 | 10 | 44 | KALOCHORI |
| L | 34 | 24 | 42 | ARGOS ORESTIKO |
| L | 50 | 14 | 36 | ARGOS ORESTIKO |
| L | 40 | 18 | 42 | ARGOS ORESTIKO |
| SiL | 24 | 20 | 56 | ARGOS ORESTIKO |
| SiL | 24 | 24 | 52 | ARGOS ORESTIKO |
| SiCL | 18 | 28 | 54 | ARGOS ORESTIKO |
| SiL | 26 | 16 | 58 | KALOCHORI |
| SiL | 36 | 14 | 50 | KALOCHORI |
| SiL | 26 | 20 | 54 | KALOCHORI |
| SiL | 28 | 18 | 54 | KALOCHORI |
| SiCL | 20 | 34 | 46 | KALOCHORI |
| SiL | 24 | 24 | 52 | KALOCHORI |
| SiCL | 18 | 28 | 54 | KALOCHORI |
| CL | 22 | 30 | 48 | KALOCHORI |
| SiCL | 12 | 30 | 58 | KALOCHORI |
| L | 30 | 22 | 48 | LAKKOMATA |
| CL | 28 | 28 | 44 | LAKKOMATA |
| L | 50 | 14 | 36 | LAKKOMATA |
| SiL | 36 | 14 | 50 | POLYKARPI |
| SiL | 26 | 24 | 50 | KALOCHORI |
| SiL | 24 | 26 | 50 | KALOCHORI |
| SiL | 38 | 12 | 50 | LITHIA |
| CL | 36 | 30 | 34 | ARGOS ORESTIKO |
| Polykarpi | 0.666272771407832 | 0.16031658465601523 |
| Lithia | 1.0284853302716628 | 0.029673729263590087 |
| Lakkomata | 1.9559287379273946 | 0.0001111020613499396 |
| Argos Orestiko | 0.35109431068311686 | 0.7722480057196142 |
| Kalochori | 1.610375954176091 | 0.0009399490740980984 |
| Polykarpi vs. Argos Orestiko | 0.01938135940700507 |
| Polykarpi vs. Lithia | 0.00045249555393457185 |
| Argos Orestiko vs. Lithia | 0.988532912979268 |
| Polykarpi vs. Lithia | 3.4544010000000000 × 10⁻⁹ |
| Argos Orestiko vs. Lithia | 2.8390020000000000 × 10⁻¹⁷ |
References
- Oda, H.; Kawasaki, A.; Hirata, T. Determination of the Geographic Origin of Brown-Rice with Isotope Ratios of 11B/10B and 87Sr/86Sr. Anal. Sci. 2002, 17, i1627–i1630. [Google Scholar] [CrossRef]
- Kawasaki, A.; Oda, H.; Hirata, T. Determination of strontium isotope ratio of brown rice for estimating its provenance. Soil Sci. Plant Nutr. 2002, 48, 635–640. [Google Scholar] [CrossRef]
- Chung, I.-M.; Kim, J.-K.; Prabakaran, M.; Yang, J.-H.; Kim, S.-H. Authenticity of rice (Oryza sativa L.) geographical origin based on analysis of C, N, O and S stable isotope ratios: A preliminary case report in Korea, China and Philippine. J. Sci. Food Agric. 2016, 96, 2433–2439. [Google Scholar] [CrossRef] [PubMed]
- Barbaste, M.; Robinson, K.; Guilfoyle, S.; Medina, B.; Lobinski, R. Precise determination of the strontium isotope ratios in wine by inductively coupled plasma sector field multicollector mass spectrometry (ICP-SF-MC-MS). J. Anal. At. Spectrom. 2002, 17, 135–137. [Google Scholar] [CrossRef]
- Swoboda, S.; Brunner, M.; Boulyga, S.F.; Galler, P.; Horacek, M.; Prohaska, T. Identification of Marchfeld asparagus using Sr isotope ratio measurements by MC-ICP-MS. Anal. Bioanal. Chem. 2008, 390, 487–494. [Google Scholar] [CrossRef]
- Bong, Y.-S.; Shin, W.-J.; Gautam, M.K.; Jeong, Y.-J.; Lee, A.-R.; Jang, C.-S.; Lim, Y.-P.; Chung, G.-S.; Lee, K.-S. Determining the geographical origin of Chinese cabbages using multielement composition and strontium isotope ratio analyses. Food Chem. 2012, 135, 2666–2674. [Google Scholar] [CrossRef]
- Zhao, H.; Guo, B.; Wei, Y.; Zhang, B. Multi-element composition of wheat grain and provenance soil and their potentialities as fingerprints of geographical origin. J. Cereal Sci. 2013, 57, 391–397. [Google Scholar] [CrossRef]
- Laursen, K.H.; Schjoerring, J.K.; Olesen, J.E.; Askegaard, M.; Halekoh, U.; Husted, S. Multielemental Fingerprinting as a Tool for Authentication of Organic Wheat, Barley, Faba Bean, and Potato. J. Agric. Food Chem. 2011, 59, 4385–4396. [Google Scholar] [CrossRef]
- Danezis, G.P.; Georgiou, C.A. Elemental metabolomics: Food elemental assessment could reveal geographical origin. Curr. Opin. Food Sci. 2022, 44, 100812. [Google Scholar] [CrossRef]
- Zhao, H.; Yang, Q. The suitability of rare earth elements for geographical traceability of tea leaves. J. Sci. Food Agric. 2019, 99, 6509–6514. [Google Scholar] [CrossRef]
- Magdas, D.A.; Feher, I.; Cristea, G.; Voica, C.; Tabaran, A.; Mihaiu, M.; Cordea, D.V.; Bâlteanu, V.A.; Dan, S.D. Geographical origin and species differentiation of Transylvanian cheese. Comparative study of isotopic and elemental profiling vs. DNA results. Food Chem. 2019, 277, 307–313. [Google Scholar] [CrossRef] [PubMed]
- White, J.G.; Zasoski, R.J. Mapping soil micronutrients. Field Crops Res. 1999, 60, 11–26. [Google Scholar] [CrossRef]
- Chiocchini, F.; Portarena, S.; Ciolfi, M.; Brugnoli, E.; Lauteri, M. Isoscapes of carbon and oxygen stable isotope compositions in tracing authenticity and geographical origin of Italian extra-virgin olive oils. Food Chem. 2016, 202, 291–301. [Google Scholar] [CrossRef] [Green Version]
- Greenough, J.D.; Fryer, B.J.; Mallory-Greenough, L. Trace element geochemistry of Nova Scotia (Canada) maple syrup. Can. J. Earth Sci. 2010, 47, 1093–1110. [Google Scholar] [CrossRef]
- Vinci, G.; Preti, R.; Tieri, A.; Vieri, S. Authenticity and quality of animal origin food investigated by stable-isotope ratio analysis. J. Sci. Food Agric. 2013, 93, 439–448. [Google Scholar] [CrossRef] [PubMed]
- Maione, C.; Araujo, E.M.; dos Santos-Araujo, S.N.; Boim, A.G.F.; Barbosa, R.M.; Alleoni, L.R.F. Determining the geographical origin of lettuce with data mining applied to micronutrients and soil properties. Sci. Agric. 2021, 79. [Google Scholar] [CrossRef]
- Sabbe, W.E.; Marx, D.B. Soil Sampling: Spatial and Temporal Variability. In Soil Testing: Sampling, Correlation, Calibration, and Interpretation; John Wiley & Sons, Ltd.: Hoboken, NJ, USA, 1987; pp. 1–14. ISBN 978-0-89118-916-9. [Google Scholar]
- Bouyoucos, G.J. Hydrometer Method Improved for Making Particle Size Analyses of Soils1. Agron. J. 1962, 54, 464–465. [Google Scholar] [CrossRef]
- Soil Survey Manual (Hardcover)|Hooked. Available online: https://www.hookedlansing.com/book/9780160937439 (accessed on 5 March 2023).
- Magkos, F.; Arvaniti, F.; Zampelas, A. Organic food: Nutritious food or food for thought? A review of the evidence. Int. J. Food Sci. Nutr. 2003, 54, 357–371. [Google Scholar] [CrossRef]
- Young, K.L.; Woo, M.; Edlund, S.A. Influence of Local Topography, Soils, and Vegetation on Microclimate and Hydrology at a High Arctic Site, Ellesmere Island, Canada. Arct. Alp. Res. 1997, 29, 270–284. [Google Scholar] [CrossRef]
- Bruce, P.; Bruce, A.; Gedeck, P. Practical Statistics for Data Scientists: 50+ Essential Concepts Using R and Python; O’Reilly Media, Inc.: Newton, MA, USA, 2020; ISBN 978-1-4920-7291-1. [Google Scholar]
- McInnes, L.; Healy, J.; Melville, J. UMAP: Uniform Manifold Approximation and Projection for Dimension Reduction. arXiv 2020. [Google Scholar] [CrossRef]
- Freeman, G.H.; Halton, J.H. Note on an exact treatment of contingency, goodness of fit and other problems of significance. Biometrika 1951, 38, 141–149. [Google Scholar] [CrossRef] [PubMed]
- Sidak, Z. Rectangular Confidence Regions for the Means of Multivariate Normal Distributions. J. Am. Stat. Assoc. 1967, 62, 626–633. [Google Scholar] [CrossRef]
- Hotelling, H. The Generalization of Student’s Ratio. Ann. Math. Stat. 1931, 2, 360–378. [Google Scholar] [CrossRef]
- Henze, N.; Zirkler, B. A class of invariant consistent tests for multivariate normality. Commun. Stat.-Theory Methods 1990, 19, 3595–3617. [Google Scholar] [CrossRef]
- Bartlett, M.S.; Fowler, R.H. Properties of sufficiency and statistical tests. Proc. R. Soc. Lond. Ser.-Math. Phys. Sci. 1937, 160, 268–282. [Google Scholar] [CrossRef]


Disclaimer/Publisher’s Note: The statements, opinions and data contained in all publications are solely those of the individual author(s) and contributor(s) and not of MDPI and/or the editor(s). MDPI and/or the editor(s) disclaim responsibility for any injury to people or property resulting from any ideas, methods, instructions or products referred to in the content. |
© 2023 by the authors. Licensee MDPI, Basel, Switzerland. This article is an open access article distributed under the terms and conditions of the Creative Commons Attribution (CC BY) license (https://creativecommons.org/licenses/by/4.0/).
Share and Cite
Tsirogiannis, G.; Zotos, A.; Mazarakioti, E.C.; Kokkotos, E.; Kontogeorgos, A.; Patakas, A.; Ladavos, A. A Statistical Approach to Identify Appropriate Sampling Scheme Capable of Geographical Identification Analysis of the Protected Origin Pulse Crops in Greece. Appl. Sci. 2023, 13, 3623. https://doi.org/10.3390/app13063623
Tsirogiannis G, Zotos A, Mazarakioti EC, Kokkotos E, Kontogeorgos A, Patakas A, Ladavos A. A Statistical Approach to Identify Appropriate Sampling Scheme Capable of Geographical Identification Analysis of the Protected Origin Pulse Crops in Greece. Applied Sciences. 2023; 13(6):3623. https://doi.org/10.3390/app13063623
Chicago/Turabian StyleTsirogiannis, George, Anastasios Zotos, Eleni C. Mazarakioti, Efthimios Kokkotos, Achilleas Kontogeorgos, Angelos Patakas, and Athanasios Ladavos. 2023. "A Statistical Approach to Identify Appropriate Sampling Scheme Capable of Geographical Identification Analysis of the Protected Origin Pulse Crops in Greece" Applied Sciences 13, no. 6: 3623. https://doi.org/10.3390/app13063623