Abstract
Several changes have occurred in the river environment of Nakdong river due to the construction of multifunctional weirs as part of the Four Major Rivers Project. This river currently exhibits characteristics that are similar to those of a stagnant water area in which the river depth increases and the flow velocity decreases. Consequently, blue-green algae are frequently observed. Toxic substances secreted by blue-green algae are harmful to aquatic ecosystems and the human body; therefore, ensuring the stability of the water quality of Nakdong river is of utmost importance. Various factors are associated with the occurrence of blue-green algae. Therefore, the causal relationship between these causative factors must be identified. In this study, we investigated factors influencing algal growth, such as water quality, hydraulics, and weather, and algal occurrence patterns by site were analyzed. Recent studies have used data mining and machine-learning techniques in algal management to quantitatively identify the characteristics of blue-green algae. In machine learning, the prediction results differ depending on the selection of parameters, which are an important aspect in the management of blue-green algae with complex causes. In this study, we quantitatively analyzed the conditions for the occurrence of cyanobacteria according to the influencing factors using decision trees and random forests, which are machine-learning techniques, along with an analysis of the major complex factors influencing the occurrence of blue-green algae in the Nakdong river weirs. Considering the water quality and hydraulic factors, we analyzed the characteristics of algal generation in each weir at different hydraulic volume times. In addition, we investigated the possibility of improving the accuracy of cyanobacterial prediction according to the learning factors. Through these analyses, we attempted to study the characteristics of blue-green algae in stagnant rivers.
1. Introduction
Changes have occurred in the river environment of the Nakdong river due to the construction of multifunctional weirs as part of the Four Major Rivers Project. This river currently exhibits characteristics that are similar to those of a stagnant water area in which the river depth increases and the flow velocity decreases. Therefore, the river exhibits characteristics of a lake, and consequently, the occurrence of algae is becoming more frequent [1]. A large-scale occurrence of blue-green algae causes problems, such as oxygen depletion and increased organic matter in water bodies through proliferation and death. In addition, toxic substances secreted by blue-green algae are harmful to the aquatic ecosystem as well as humans [2]. Moreover, the blue-green algae problem in the Nakdong river, which is used as a source of water, affects the water purification supply system by secreting geosmin and 2-MIB that are responsible for the unpleasant tastes and earthy odors in tap water. The occurrence and flourishing of algal blooms degrade the quality of drinking-water supply reservoirs, which ultimately causes public health problems and increases the treatment costs for water utilities [3].
Various factors are associated with the occurrence of blue-green algae. Therefore, identifying the causal relationship between these causative factors is necessary. Most factors that affect the water environment, such as water quality, hydraulics, and weather, are included, and the pattern of algal occurrence and changes in the influencing factors must be analyzed.
Based on previous studies on cyanobacteria after the construction of weirs in the main section of the Nakdong river in Korea, Ryu (2018) investigated the succession pattern of cyanobacteria in a section of a Nakdong river weir after its installation and identified the morphological characteristics of the genus Dolichospermum in the natural population [4]. Son (2013) investigated the phytoplankton community structure in the middle and lower reaches of the Nakdong river from January to December 2012 and calculated species diversity and dominance indices. Diatoms accounted for 50% and green algae accounted for 28% of the composition ratio of the species appearing in the summer, indicating a high dependence on diatoms and green algae; in summer, Microcystis aeruginosa was the predominant species [5]. In addition, Shin (2018) investigated major environmental factors affecting water quality at weekly intervals in eight weir pools of the Nakdong river from January 2013 to July 2017 and compared and analyzed the dominant currents and correlations. The main causative algae of harmful green algae and red tides were the blue-green algae Microcystis and the diatom Stephanodiscus populations, respectively [6]. Kim (2017) used chlorophyll a (Chl-a) and algae population data, along with water quality and hydrological and meteorological factors in the Mulgeum area of the lower Nakdong river, to analyze the pattern of algal occurrence and changes in influencing factors after the construction of a weir and examined the correlation. After the weir’s construction, the number of cyanobacteria in the Mulgeum area increased significantly, whereas the number of diatoms decreased [7]. Lee (2017) compared and analyzed water quality parameters at four points in the middle and lower reaches of the Nakdong river after a weir’s installation and estimated the correlation between water quality parameters and the number of cyanobacteria through factor analysis. Water temperature and pH, which are important water quality factors for the growth of blue-green algae, were found to be significantly correlated. In particular, the phosphorus elution of the sediment occurred with an increase in pH, which was judged as a condition in which eutrophication and nutrient salts could be continuously maintained [8]. Yang (2017) analyzed water quality data for the water prohibition point in the lower reaches of the Nakdong river, identified the process of increasing and decreasing algae through Chl-a water quality items, and presented directions for water quality improvement through a correlation analysis. Comprehensive research is being conducted to maintain the maximum number of areas where the ecological food chain can operate and provide physicochemical and ecological alternatives, such as an effective supply of dissolved oxygen to the lower part of the water body and the installation of artificial habitats [9]. A previous study analyzed the characteristics of algae using water quality models; Park (2019) built a 3-dimensional Environmental Fluid Dynamics Code (EFDC) model for the Chilgok Weir and Gangjeong Goryeong Weir sections located in the Nakdong river. The effects of the same hydraulic property changes on water quality and algal biomass were evaluated [10]. Choi (2017) evaluated the reproducibility of stratification by applying the EFDC model to the Nakdong river [11]. An EFDC model was built downstream, and a sensitivity analysis was performed on the key parameters sensitive to stratification. In addition, as a countermeasure for algae reduction in the Nakdong River, there is a study that quantitatively analyzed the reduction effect by numerically simulating the pulsed flow [12].
Research trends related to green algae have been identified in the Nakdong river, and studies have been conducted on the succession of blue-green algae, including taxonomic studies and community structure analysis, as well as correlations with water quality factors and occurrence characteristics of blue-green algae. Recently, several studies have been conducted to improve algal forecasting by predicting the occurrence of algae in advance through the combination of meteorological and water quality measurement data, which are the primary factors affecting the occurrence of algae, and operational data of water structures, such as river dam discharge. Technological development through the introduction of artificial intelligence technology, which has shown good results in many applications, has been applied [13,14].
In data mining, the importance of data and learning materials is high. To train an artificial intelligence model with high reliability and excellent performance, data that are exponentially proportional to the complexity of the model are required. For models used for classification problems, the amount of data and the homogeneity between the amounts of data belonging to each class should be considered. This is because, when the amounts of data between classes are imbalanced, learning is biased toward a specific class. When the amount of data belonging to each class is similar, the model achieves a better performance [15].
In algal research, machine-learning methods, which can be used to predict test data, are used to build models based on training data. Bagging, boosting, and random forest (RF) are ensemble machine-learning methods. The basic principle of an ensemble model is that a group of weak learners gather to form a strong learner to increase the accuracy of the model [16]. Recent studies have used neural networks, such as recurrent neural network (RNN) and long short-term memory (LSTM), as components of machine learning to improve the accuracy of green algae prediction [17,18].
In line with the recent trend of water management research, big data on water management in the Nakdong river basin were collected and configured as the input data for data mining in this study. The collected big data can be used as basic water management data for policy establishment. By utilizing data mining technology, we intend to establish an advanced water management system for improving water quality in the Nakdong river basin. Therefore, in this study, we aimed to investigate the characteristics of algal blooms using a data-based prediction model based on machine learning. For the occurrence of algae, we analyzed the accuracy according to the learning factors of the data model. In addition, considering hydraulic and water quality factors, we analyzed the characteristics of algae generation in each weir with different hydraulic volume times. Furthermore, the accuracy of blue-green algae prediction according to the learning factors was improved, thus forming the basis for the study of the characteristics of the occurrence of blue-green algae in stagnant rivers.
2. Materials and Methods
In the Nakdong river basin, water quality and aquatic ecosystems are deteriorating due to the expansion of algal blooms and an increase in the frequency and period of these blooms due to changes in environmental conditions (such as congestion, water temperature, and increase in pollution). In addition, direct countermeasures against changes in the Nakdong river environment due to climate change and policy management plans for integrated water management are required. Therefore, developing feasible and realistic water management measures for the Nakdong river basin is vital.
Because water management requires the collection and processing of various information, it is an essential field that requires big data technology. In this study, through the collection of water management big data, data mining was used to develop and various big data analytical techniques were applied to analyze water quality fluctuations in the Nakdong river basin and derive customized evaluation plans to establish practical watershed management plans. In addition, by presenting the utilization technology of big data analysis, we intend to present the direction of advanced watershed management to improve the water quality of the Nakdong River basin.
The water environment monitoring network data provided by the Water Environment Information System (http://water.nier.go.kr (accessed on 1 January 2020)) were used. The characteristics of blue-green algae generation were analyzed using the observational data from the second half of 2012 to the first half of 2019 after the multifunctional weirs were completed. In addition, to analyze the factors affecting cyanobacteria, the number of cyanobacterial cells was measured by matching the spatial and temporal resolutions. The cyanobacterial cell counts were calculated as the sum of the cell counts of Microcystis, Anabaena, Aphanizomenon, and Oscillatoria. The data provided by the Water Environment Information System were organized by date. The data used in this study included outflow (discharge), pH, electrical conductivity (EC), dissolved oxygen (DO), biochemical oxygen demand (BOD), chemical oxygen demand (COD), total phosphorus (TP), Chl-a, temperature, and cyanobacteria. The standardized precipitation index (SPI) was used as meteorological data, and for the hydraulic characteristics of each weir section, weir discharge, inflow, and hydraulic retention time (HRT) were used for the analysis. Table 1 shows the machine learning dataset analyzed in this study.

Table 1.
Machine learning data sets per multifunctional weir point.
2.1. Study Area
The Nakdong river water system, the target of this study, is composed of eight multifunctional weirs, which are the main water structures of the main stream. Changes have been made to the environment of the watershed with the installation of multifunctional weirs as part of a river project in 2012. Therefore, watershed management measures according to environmental changes are urgently needed. As the water depth of the Nakdong river has increased and the flow speed has decreased after the Daehacheon Project, its water has stagnated, and consequently, changes in water quality and environment have been observed. An algae warning is issued every year due to heat waves and droughts in summer, and on 22 August 2018, the number of harmful cyanobacterial cells per 1 mL of water in Hapcheon–Changnyeong Weir was recorded at 1,264,052, which is the worst case of algal bloom in history [19]. In the main stream of the Nakdong river, eight multifunctional weirs were installed as part of a river project: Sangju, Nakdan, Gumi, Chilgok, Gangjeong–Goryeong, Dalseong, Hapcheon–Changnyeong, and Changnyeong–Haman weirs, which are located from upstream to downstream. Figure 1 shows the location of the multifunctional weir installed in the Nakdong river. Among the eight weir structures, Nakdan, Gangjeong–Goryeong, and Hapcheon–Changnyeong weirs were selected as the target areas. Table 2 shows the multifunction weir specifications. After the construction of the weirs, the hydraulic residence time increased, the characteristics of the stagnant water area were observed, and problems with algae due to heat waves and drought continued to occur.
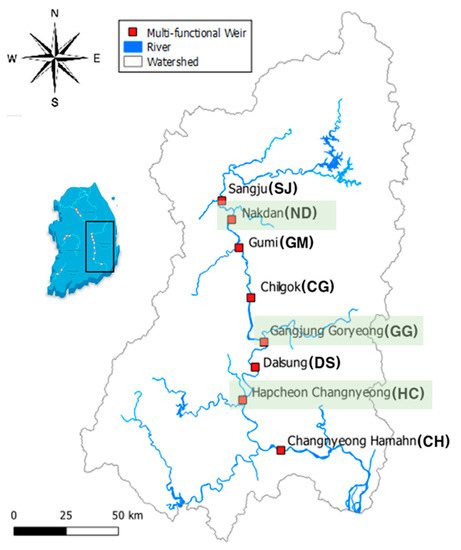
Figure 1.
Geographic position of the multifunctional weirs’ structure.
Table 2.
Design specifications of the multifunctional weirs’ structure.
The hydraulic and hydrological characteristics of the multifunctional weirs located in the Nakdong river were examined through a visualization analysis. Table 3 summarizes the water level, reservoir capacity, HRT, inflow, discharge, and number of cyanobacterial cells for each multifunctional weir. The data were used when the algae population in each weir was 2000 cells/mL or more. Compared to other weirs, the water storage capacity was small, and the HRT was short.
Table 3.
Current status of repair/water gate by multifunctional weir.
2.2. Random Forest
RF is an ensemble learning method used for classification and regression analysis, which operates by outputting classification or average prediction values from a plurality of decision trees constructed during the training process. In particular, an RF is a method in which several decision trees are created, and the result is determined by a majority vote. RFs can be used to evaluate the importance of variables and select the variables to be used in modeling. The importance of a variable in an RF measures the extent to which the variable contributes to improving accuracy and node impurity. Variables that are important for improving accuracy are determined by the mean accuracy decrease and the difference in accuracy decreases when the accuracy of the constructed tree is reconstructed after removing a specific variable, which is averaged for each variable. When the influence of a variable on the classification accuracy is greater, the decrease in accuracy is significant with the removal of the variable. Variables that are important for improving node impurity are determined by the mean Gini decrease; for each tree branch, the amount of impurity reduction of selected variables is measured, and the average value from all trees is used. A high mean Gini decrease value for a specific variable indicates that classifying objects with that variable contributes to reducing impurities, that is, grouping the same categories. In this study, an RF model for each weir point was constructed and analyzed using the programming language R Studio.
2.3. Decision Trees
A decision tree is an analytical method that categorizes a group of interests into several subgroups or performs predictions by charting decision rules. Because the analytical process is represented by a tree structure, researchers can easily understand and explain the analytical process compared to other methods, such as discriminant analysis, regression analysis, and neural networks [20]. In general, a decision tree analysis involves the following steps: Through the formation of the first decision tree, a decision tree is obtained by specifying an appropriate split criterion and a stopping rule according to the purpose of the analysis and data structure. In the second step, i.e., pruning, branches with a high risk of large classification errors or inappropriate rules are removed. In the third validity evaluation, the decision tree is evaluated using cross-validation with benefit charts, risk charts, or test data. Finally, a decision tree is analyzed, and a classification and prediction model is established [21]. A decision tree is a data-mining technique that expresses the decision-making process in the form of a tree, divides the target group of the problem domain into subgroups, and performs classification and prediction. Decision trees are appropriate for solving classification problems in data mining. The decision-tree modeling process proceeds in such a manner that a tree structure is created by identifying important attributes according to the degree of correlation between each attribute among the analyzed attributes of the data. Hence, efficient decision-making can be achieved.
In this study, a classification model was developed by setting the algal alarm rating as a categorical variable using a decision tree. RF is an ensemble model of decision trees, which can be relatively difficult to interpret in terms of model configuration. A decision tree is an analytical method that categorizes a group of interests into several subgroups or performs predictions by charting decision rules. In this study, a variation of the decision tree algorithm, classification and regression tree (CART), was used. The criteria for issuance based on the algae warning system were set as the categorical target variables, and the conditions for the occurrence of blue-green algae were analyzed according to the major influencing factors. In addition, the model accuracy was evaluated using the validation data.
3. Results
3.1. Analysis Using RF
In this study, the main factors influencing the occurrence of blue-green algae in the target area were identified, and the importance of each variable was evaluated. Figure 2 show the graphs of Gini decrease, which is an important variable for improving node impurity when constructing a random forest, and accuracy decrease, which has a significant influence on increasing classification accuracy on the x- and y-axes. For the SPI, the value of the weather station upstream of the weir point is represented as SPI_UP, and the value of the weather station downstream of the weir point is classified as SPI_DOWN. Temp. is the abbreviation for temperature. The ND points appear in the order of HRT, temperature, and outflow. At point GG, the DO, temperature, and EC are important variables. The HC points appear in the following order: temperature, DO, and BOD.
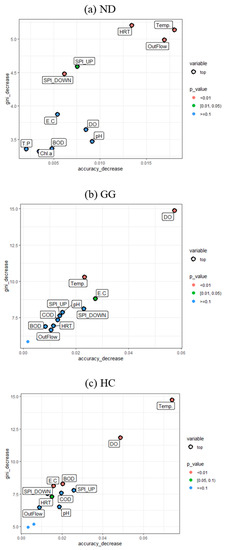
Figure 2.
Scatterplots of important variables for 3 different weir sites.
Overall, temperature is the most important factor affecting the occurrence of blue-green algae. Points affected by drought are the downstream HC points. In particular, HC should consider the effects of algal blooms caused by drought. The increase in water temperature due to an increase in summer temperatures can block the mixing of water in the water body and promote the occurrence of blue-green algae owing to the continuation of stratification. This phenomenon is conspicuous downstream. This indicates that the water depth of the river increases and the flow velocity decreases, showing the characteristics of a stagnant water area. Previous investigations have determined that civilians are vulnerable to environmental changes in water quality, such as algae outbreaks, due to the influence of heat waves and droughts while the characteristics of lake water areas are maintained. Therefore, a preemptive algae management should consider the factors influencing blue-green algae occurrence by branch. Consequently, a blue-green algae occurrence grade prediction model was established by branch using RF.
3.2. Analysis Using Decision Tree
In this study, a decision tree was constructed targeting three weir points located in the main stream of the Nakdong river to examine the conditions for the occurrence of blue-green algae, and their alarming levels were analyzed. The variables were analyzed by selecting those significant to the occurrence of blue-green algae through a variable-importance analysis of the RF. The decision-tree machine learning set comprised 80% of the total data, and the verification set comprised 20%. The target variable was set as a categorical criterion for the issuance of an algal bloom warning system; a classification tree was constructed; and optimization was performed through a pruning process based on the complexity parameter (CP) value to prevent overfitting of the model.
Figure 3, Figure 4 and Figure 5 graphically show the decision tree results. The purity of a node can be approximately checked by looking at its color. In addition, the ratio of each node to the total observation data is classified as the algal bloom warning system’s grade. The first line in the box represents the ratings of the classified algal bloom warning system. The second row shows the percentages by grade. A level of blue-green algae cell count less than 1000 cells/mL is in the normal grade; a level of 1000–10,000 cells/mL is in the attention grade; and a level of 10,000 cells/mL or more is in the warning grade. The bottom row shows the percentage of observations included in the nodes of the total data.
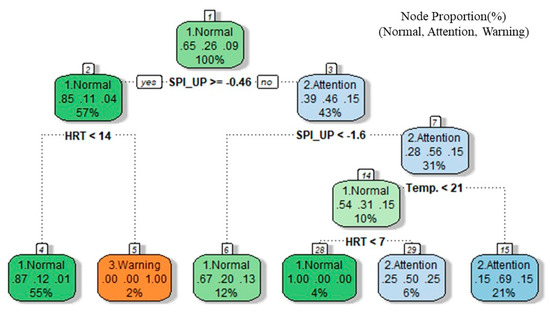
Figure 3.
Results of the tree map of the conditions for cyanobacterial growth (ND).
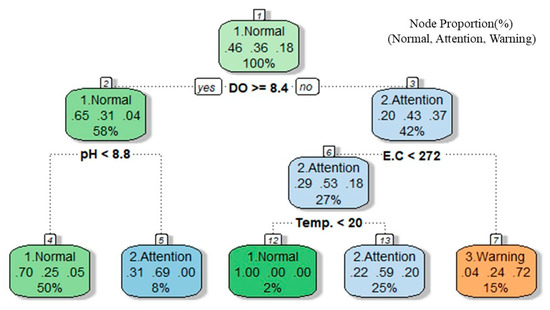
Figure 4.
Results of the tree map of the conditions for cyanobacterial growth (GG).
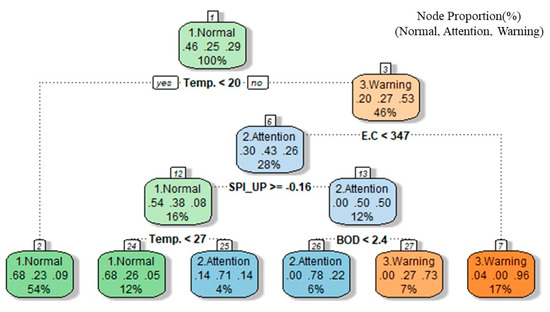
Figure 5.
Results of the tree map of the conditions of cyanobacterial growth (HC).
Among all the learning data of the ND area, the normal grade is 65%, the attention grade is 26%, and the warning grade is 9%. The occurrence conditions classified as node 4 of the tree map account for 55% of the total learning materials, and when the SPI_UP is −0.46 or more and the HRT is less than 14/day, the probability of becoming a normal grade is 87%. The occurrence conditions classified by node 15 account for 21% of the total learning materials, with an SPI_UP of −0.46 or less and −1.6 or more. When the temperature is below 21 °C, the probability of becoming an attention grade is 69%. In node 5, when the SPI_UP is −0.46 or higher and the HRT is 14/day, exceeding 2% of the total learning materials, the probability of becoming a warning grade is 100%.
Among the total learning materials in the GG area, the normal grade comprises 46%, the attention grade is 36%, and the warning grade is 18%. The occurrence conditions classified as node 4 of the tree map are 50% of the total learning data, and the probability of being a normal grade is 70% when the DO is 8.4 mg/L or more and the pH is less than 8.8. The occurrence conditions classified as node 13 account for 25% of the total learning data, and when the DO is less than 8.4 mg/L, the EC is less than 272 μS/cm, and the temperature is above 20 °C, the probability of being an attention grade is 59%. At node 7, when 15% of the total learning materials are below a DO value of 8.4 mg/L and above an EC value of 272 μS/cm, the probability of being a warning grade is 72%.
Among the total learning materials in the HC area, 46% are a normal grade, 25% are an attention grade, and 29% are a warning grade. The occurrence conditions classified as node 2 of the tree map account for 54% of the total learning materials. When the temperature is below 20 °C, the probability of being a normal grade is 68%. The occurrence conditions classified as node 26 are a temperature below 20 °C, an EC less than 347 μS/cm, an SPI_UP at −0.16 or more, and a BOD less than 2.4 mg/L; here, the probability of being an attention grade is 78%. In node No. 7, when the temperature is above 20 °C and the EC is above 347 μS/cm, the probability of becoming a warning grade is 96%.
A detailed analysis was conducted for each branch based on the research results. Unlike the other weirs, the upstream ND points are mostly classified as normal when the HRT is less than 14. This result appears because the volume is smaller than that of other weirs, which is greatly influenced by hydraulics according to the operation of the weir. GG, which is a midstream region, is an important factor in EC; if GG is 272 or higher, it is classified as a warning grade. Large-scale industrial complexes are concentrated, and emissions from basic environmental facilities have a significant influence. During droughts, when river flow is insufficient, the amount of dissolved substances increases, which can promote the occurrence of blue-green algae [22]. At the downstream section, the HC point, temperature, and SPI are important factors. The effects of drought on water quality include increased water temperature, decreased dissolved oxygen, and algal blooms [23]. Prolonged drought can block the mixing of water in a water body and promote the occurrence of blue-green algae, owing to the continued stratification phenomenon.
In this study, the probability of occurrence of blue-green algae could be presented for each weir point based on the numerical standards of the input variables and alert levels. Thus, this study can be used for decision making to customize blue-green algae management for each branch.
4. Conclusions
In this study, we analyzed the characteristics and influencing factors of algal blooms at each weir point in the main stream of the Nakdong river. To analyze the occurrence of blue-green algae, we examined the occurrence status according to SPI and temperature for each weir point. Seasonally, blooms of blue-green algae were most prone to occur during summer. In addition, the average occurrence of cyanobacteria was higher in the lower reaches of the Nakdong river, and the downstream section was judged to have favorable conditions for the occurrence of cyanobacteria, which showed the characteristics of stagnant water due to the increase in hydraulic residence time caused by a decrease in the flow rate and an increase in the water depth. The RF results showed that the HC points in the downstream section, which were found to be one of the major influencing factors, were vulnerable to the occurrence of blue-green algae. A machine-learning model was developed for algal bloom and water quality environmental management. Decision tree and RF were constructed for the weir points to develop a classification model for the occurrence class based on an algae warning system. The criteria for issuance based on the algae warning system were set as the categorical target variables, and the conditions for the occurrence of blue-green algae were analyzed according to the major influencing factors. The probability of blue-green algae occurrence at each weir point was presented based on the numerical standards of the input variables and alert levels. Thus, this study can be used for decision making to customize the management of blue-green algae by branches during heat waves and droughts. A data-based model should eventually accumulate good quality data [24]. Machine learning to build a sophisticated model through high-quality big data can be used as a countermeasure against algal blooms.
Author Contributions
Conceptualization, W.S.J.; methodology, W.S.J. and Y.D.K.; software, W.S.J.; validation, Y.D.K.; formal analysis, W.S.J., B.G.J. and Y.D.K.; investigation, W.S.J. and B.G.J.; data curation, W.S.J.; writing—original draft preparation, W.S.J.; writing—review and editing, B.G.J. and Y.D.K.; visualization, W.S.J.; supervision, Y.D.K.; project administration, Y.D.K.; funding acquisition, Y.D.K. All authors have read and agreed to the published version of the manuscript.
Funding
This study was carried out with a research grant from the National Research Foundation of Korea (NRF-2020R1F1A1076887).
Institutional Review Board Statement
Not applicable.
Informed Consent Statement
Not applicable.
Data Availability Statement
Not applicable.
Conflicts of Interest
The authors declare no conflict of interest.
References
- Jung, W.S.; Kim, Y.D. Effect of abrupt topographical characteristic change on water quality in a river. KSCE J. Civ. Eng. 2019, 23, 3250–3263. [Google Scholar] [CrossRef]
- Ahn, C.Y.; Lee, C.S.; Choi, J.W.; Lee, S.; Oh, H.M. Global occurrence of harmful cyanobacterial blooms and N, P-limitation strategy for bloom control. Korean J. Environ. Biol. 2015, 33, 1–6. [Google Scholar] [CrossRef]
- Harris, T.D.; Graham, J.L. Predicting cyanobacterial abundance, microcystin, and geosmin in a eutrophic drinking-water reservoir using a 14-year dataset. Lake Reserv. Manag. 2017, 33, 32–48. [Google Scholar] [CrossRef]
- Ryu, H.S.; Shin, R.Y.; Seo, K.; Lee, J.H.; Kim, K. Succession of cyanobacterial species and taxonomical characteristics of Dolichospermum spp.(nostocales, cyanophyceae) in the weir regions of the Nakdong River. J. Korean Soc. Water Environ. 2018, 34, 503–513. [Google Scholar]
- Son, H.J. The analysis of phytoplankton community structure in the middle-lower part of the Nakdong River. J. Korean Soc. Environ. Eng. 2013, 35, 430–435. [Google Scholar] [CrossRef]
- Shin, J.; Park, Y. Spatiotemporal and Longitudinal Variability of Hydro-meteorology, Basic Water Quality and Dominant Algal Assemblages in the Eight Weir Pools of Regulated River (Nakdong). Korean J. Ecol. Environ. 2018, 51, 268–286. [Google Scholar] [CrossRef]
- Kim, Y.W.; Lee, J.H.; Park, T.J.; Byun, I.G. Variation of Water Environment and Algae Occurrence Characteristics After Weirs Construction at Mulgeum Site in Downstream of the Nakdong River. J. Korean Soc. Hazard Mitig. 2017, 17, 383–392. [Google Scholar] [CrossRef]
- Lee, S.M.; Kim, I.K. Analysis of correlation between cyanobacterial population and water quality factors in the middle and down stream region of nakdong river. J. Korean Soc. Water Wastewater 2017, 31, 93–101. [Google Scholar] [CrossRef]
- Yang, S.C.; Xia, T.T.; Kang, T.H. Causes and Overcoming of the Algae Excess in a Dam Water-Based on the Data of Water Quality Analysis of Mulgum Area. J. Korean Soc. Environ. Restor. Technol. 2017, 20, 1–13. [Google Scholar]
- Park, D.Y.; Park, H.S.; Kim, S.J.; Chung, S.W. Analysis of Water Quality Variation by Lowering of Water Level in Gangjeong-Goryong Weirin Nakdong River. J. Environ. Impact Assess. 2019, 28, 245–262. [Google Scholar]
- Choi, H.G.; Han, K.Y.; Park, J.H. Reproducibility evaluation of stratification using EFDC model in Nakdong river. KSCE J. Civ. Environ. Eng. Res. 2017, 37, 561–573. [Google Scholar]
- Han, J.K.; Jung, W.S.; Kim, J.M.; Park, I.H.; Kim, Y.D. Analysis of Water Quality Improvement Effect of Controlled River by Multi-Functional Weir Operation. Appl. Sci. 2022, 12, 8883. [Google Scholar] [CrossRef]
- Recknagel, F.; French, M.; Harkonen, P.; Yabunaka, K.I. Artificial neural network approach for modelling and prediction of algal blooms. Ecol. Model. 1997, 96, 11–28. [Google Scholar] [CrossRef]
- Wei, B.; Sugiura, N.; Maekawa, T. Use of artificial neural network in the prediction of algal blooms. Water Res. 2001, 35, 2022–2028. [Google Scholar] [CrossRef] [PubMed]
- Shin, J.H.; Lee, S.H.; Kim, M.S.; Park, H.W. Imbalanced data augmentation for algal blooming warning AI. J. Inf. Technol. Appl. Eng. 2021, 11, 15–23. [Google Scholar]
- Sutton, C.D. Classification and regression trees, bagging, and boosting. Handb. Stat. 2005, 24, 303–329. [Google Scholar]
- Yin, J.; Tsai, F.T.C. Bayesian set pair analysis and machine learning based ensemble surrogates for optimal multi-aquifer system remediation design. J. Hydrol. 2020, 580, 124280. [Google Scholar] [CrossRef]
- Lee, S.; Lee, D. Improved prediction of harmful algal blooms in four Major South Korea’s Rivers using deep learning models. Int. J. Environ. Res. Public Health 2018, 15, 1322. [Google Scholar] [CrossRef]
- National Institute of Environmental Research Water Information System. Available online: https://water.nier.go.kr (accessed on 1 January 2020).
- Choi, J.; Han, S.; Kang, H.; Kim, E. Data Mining Decision Tree Analysis Using Answer Tree; SPSS Academy: Seoul, Republic of Korea, 1998; pp. 17–23. [Google Scholar]
- Berry, M.J.A.; Linoff, G.S. Data Mining Techniques; John Wiley & Sons Publisher: New York, NY, USA, 1997. [Google Scholar]
- Kim, Y.; Lee, E.; Kim, K.; Kim, S. Analysis of Exclusive Causality between Environmental Factors and Cell Number of Cyanobacteria in Guem River. J. Environ. Sci. Int. 2016, 25, 937–950. [Google Scholar] [CrossRef]
- Mosley, L.M. Drought impacts on the water quality of freshwater systems; review and integration. Earth-Sci. Rev. 2015, 140, 203–214. [Google Scholar] [CrossRef]
- Jung, W.S.; Kim, S.E.; Kim, Y.D. Prediction of Surface Water Quality by Artificial Neural Network Model Using Probabilistic Weather Forecasting. Water 2021, 13, 2392. [Google Scholar] [CrossRef]


Disclaimer/Publisher’s Note: The statements, opinions and data contained in all publications are solely those of the individual author(s) and contributor(s) and not of MDPI and/or the editor(s). MDPI and/or the editor(s) disclaim responsibility for any injury to people or property resulting from any ideas, methods, instructions or products referred to in the content. |
© 2023 by the authors. Licensee MDPI, Basel, Switzerland. This article is an open access article distributed under the terms and conditions of the Creative Commons Attribution (CC BY) license (https://creativecommons.org/licenses/by/4.0/).