
Displacement Analyses of Main Structure of Parallel Pit Excavation and Analysis of Countermeasures

Abstract
:1. Introduction
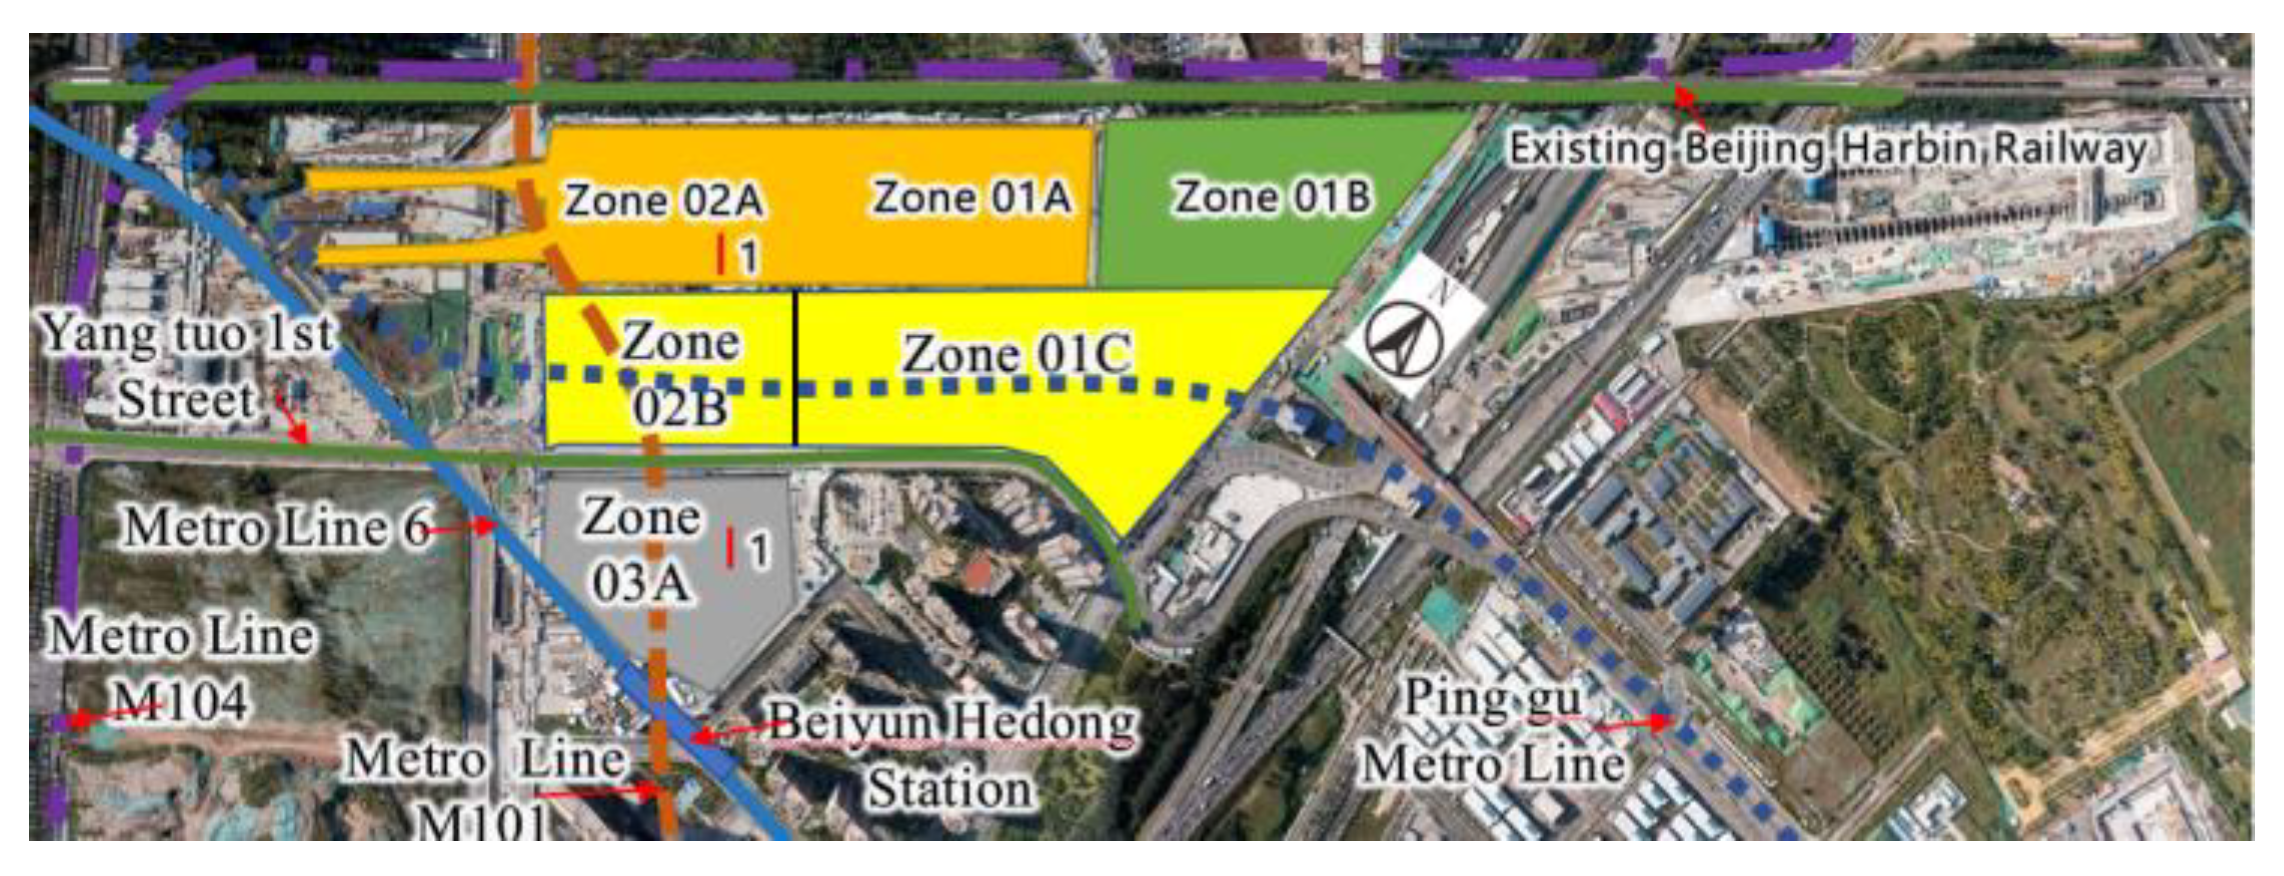
2. Project Overview
2.1. Project Background
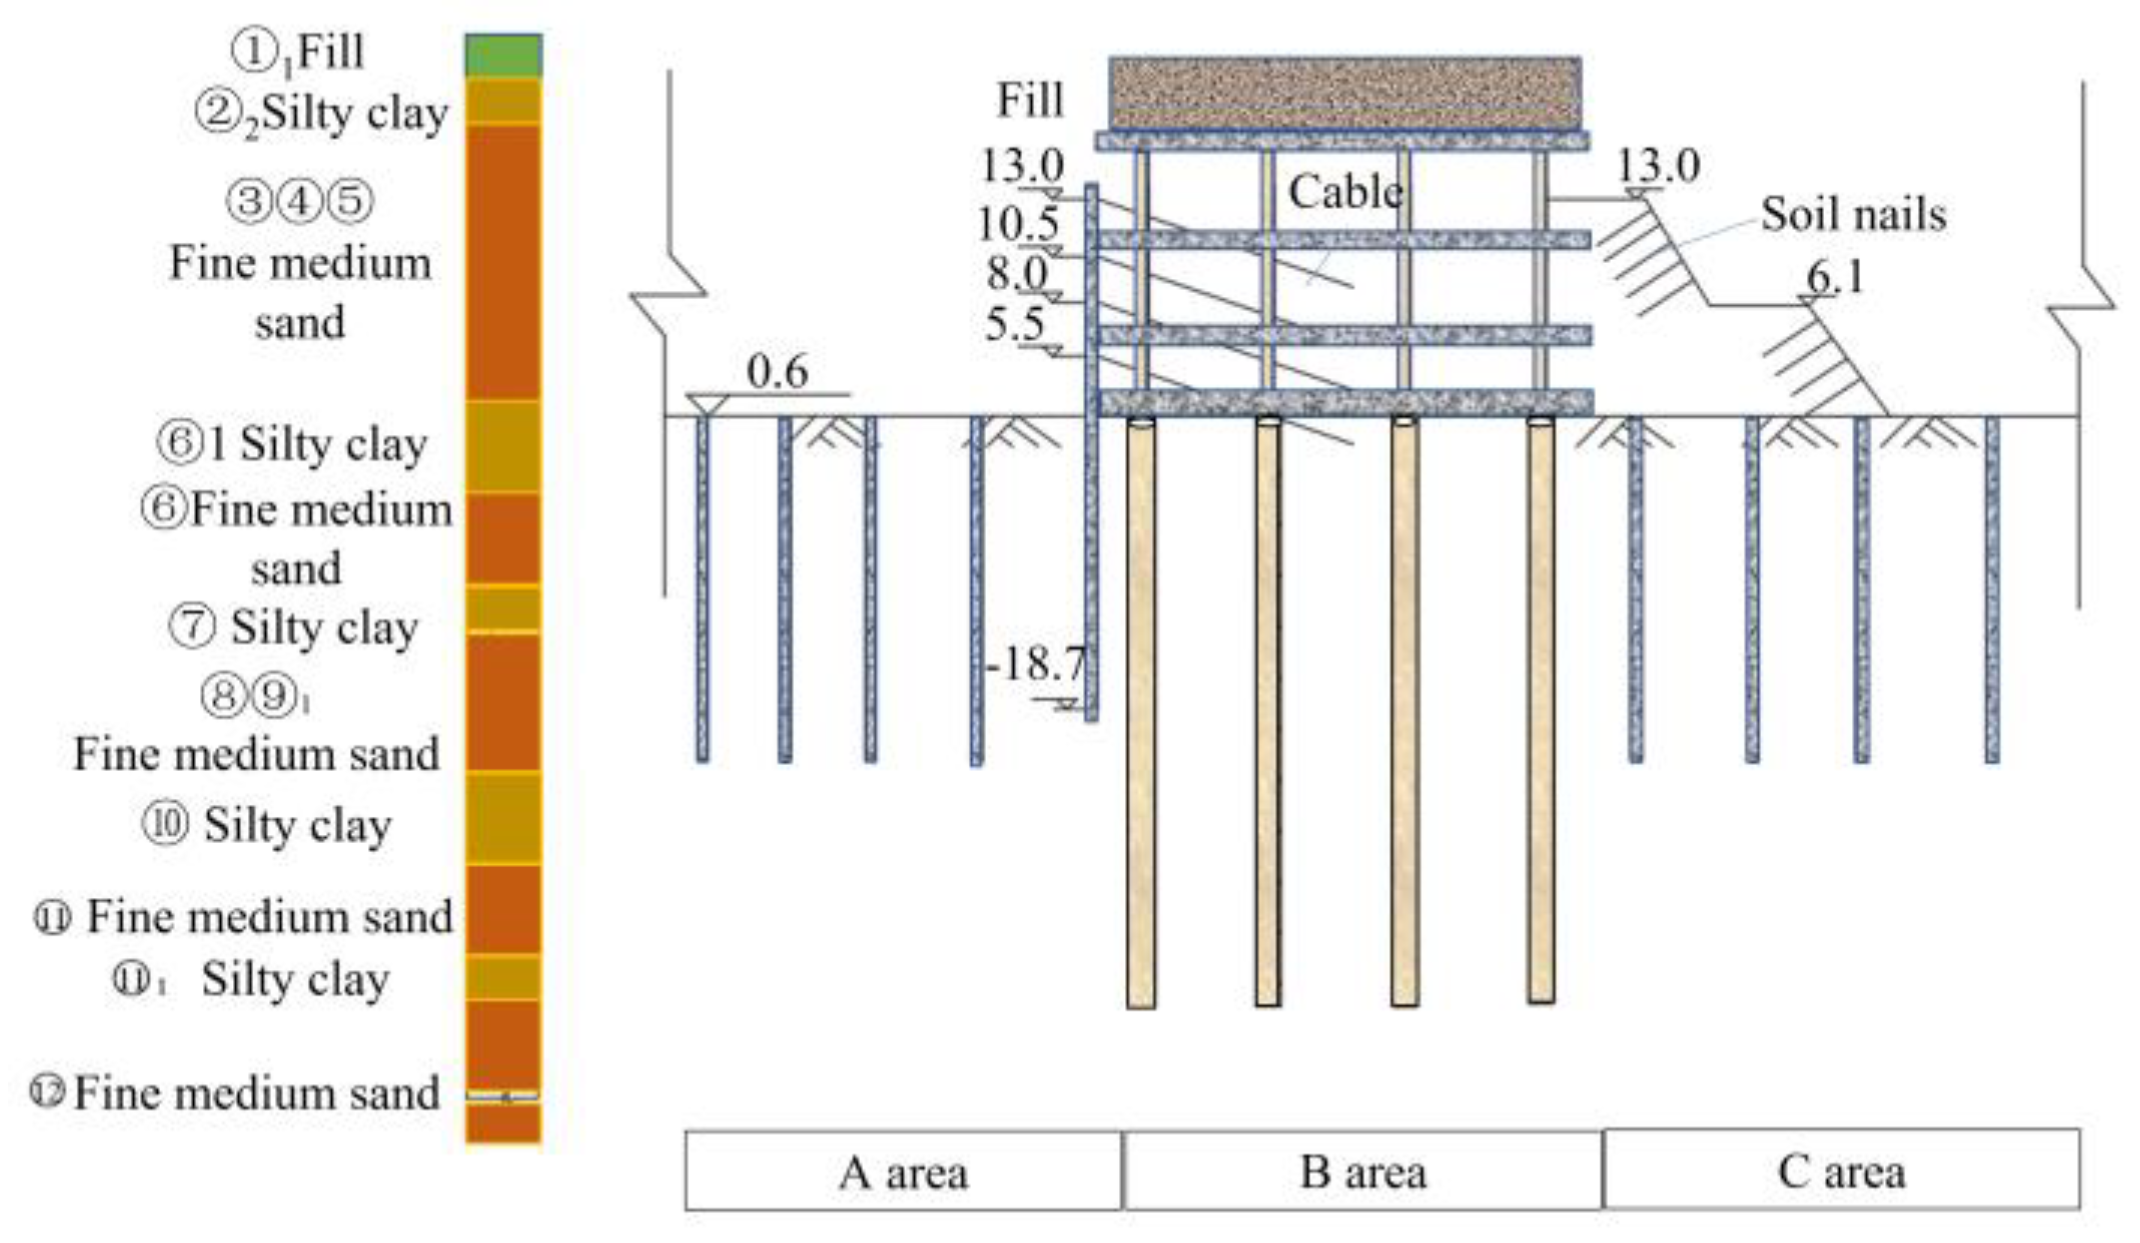
2.2. Site Condition
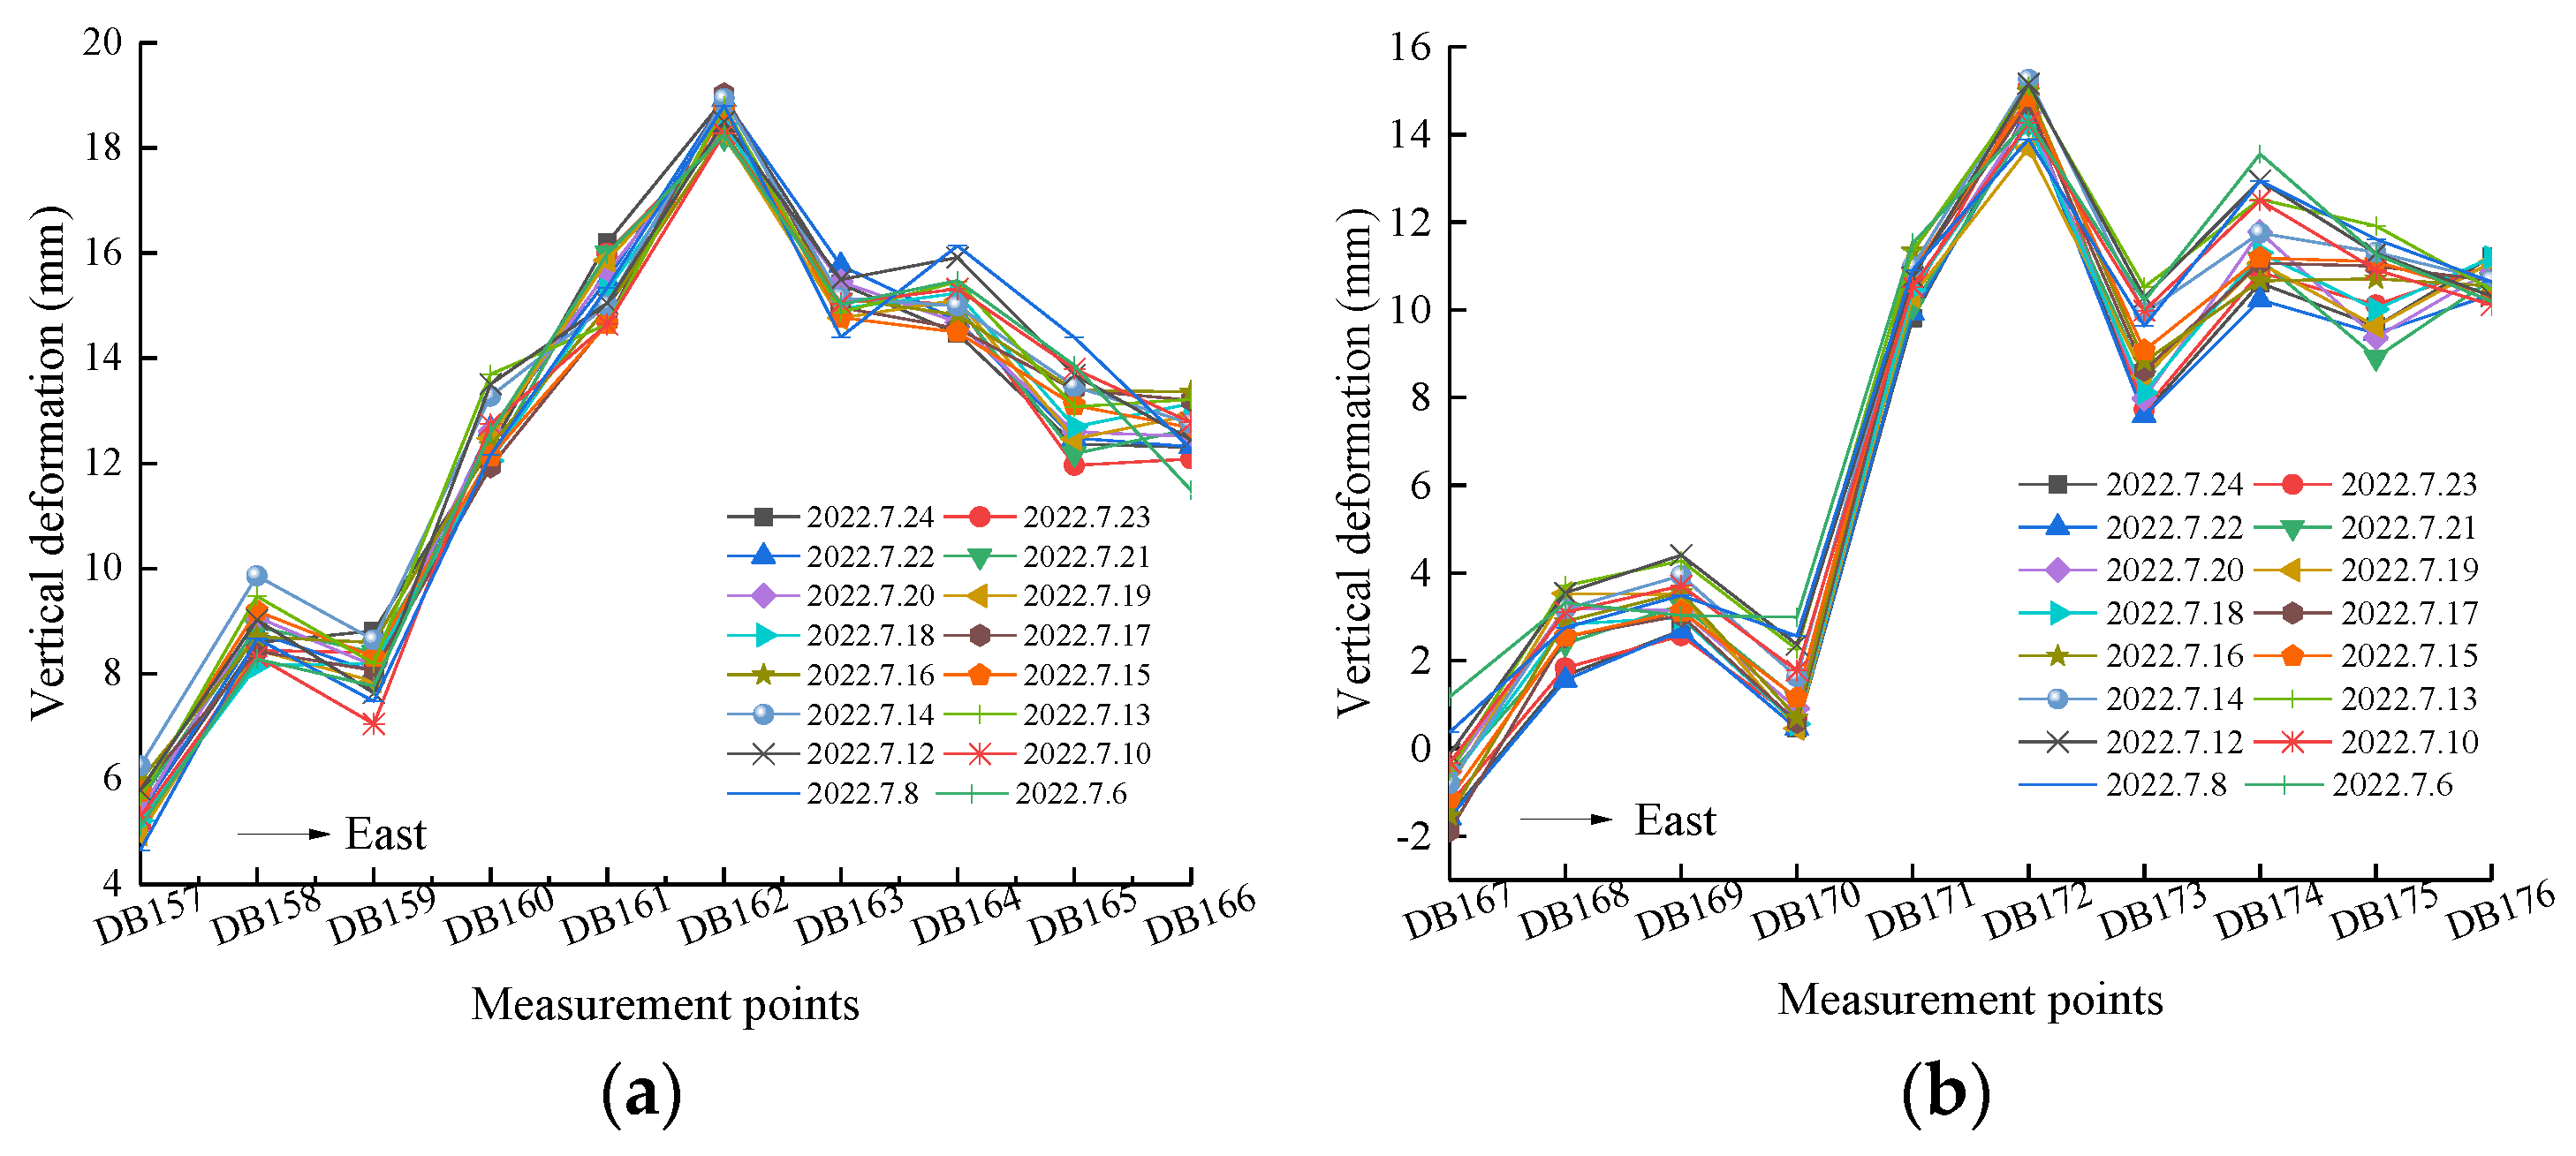
2.3. Monitoring Results and Discussion
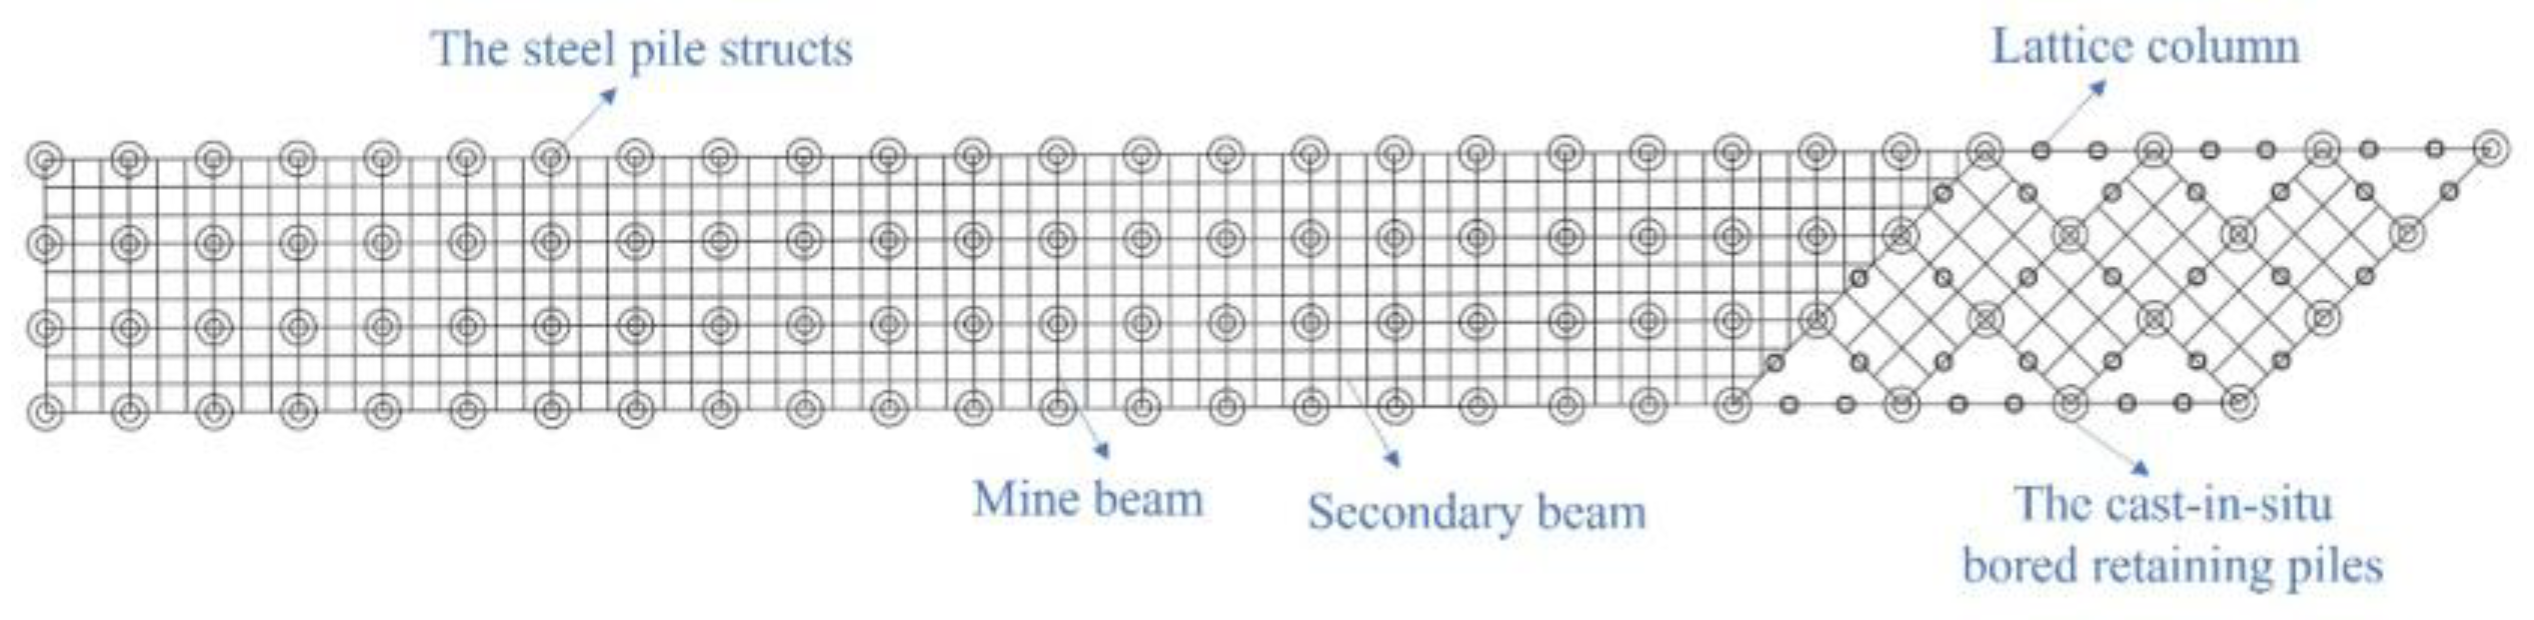
3. Parallel Pit Excavation Scheme
4. FDM Model and Results Discussion
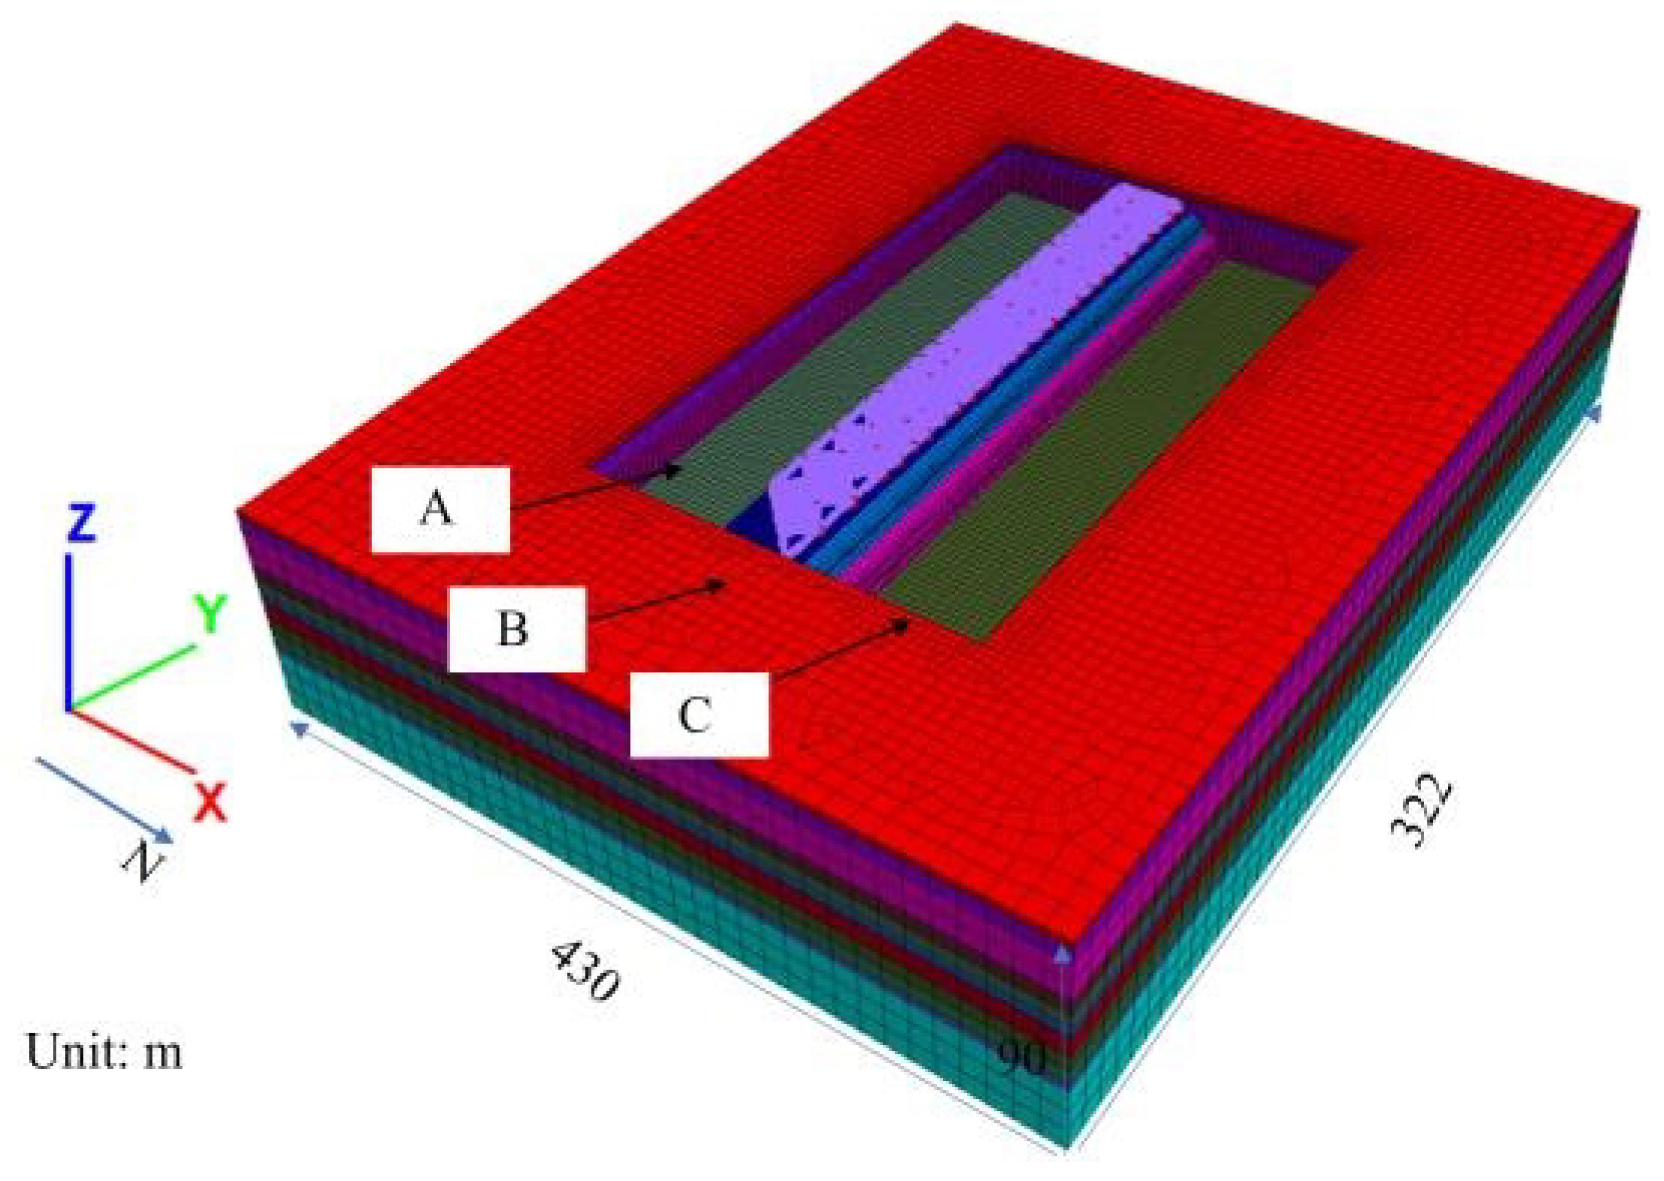
4.1. Numerical Model
4.2. Retaining Wall Deformation
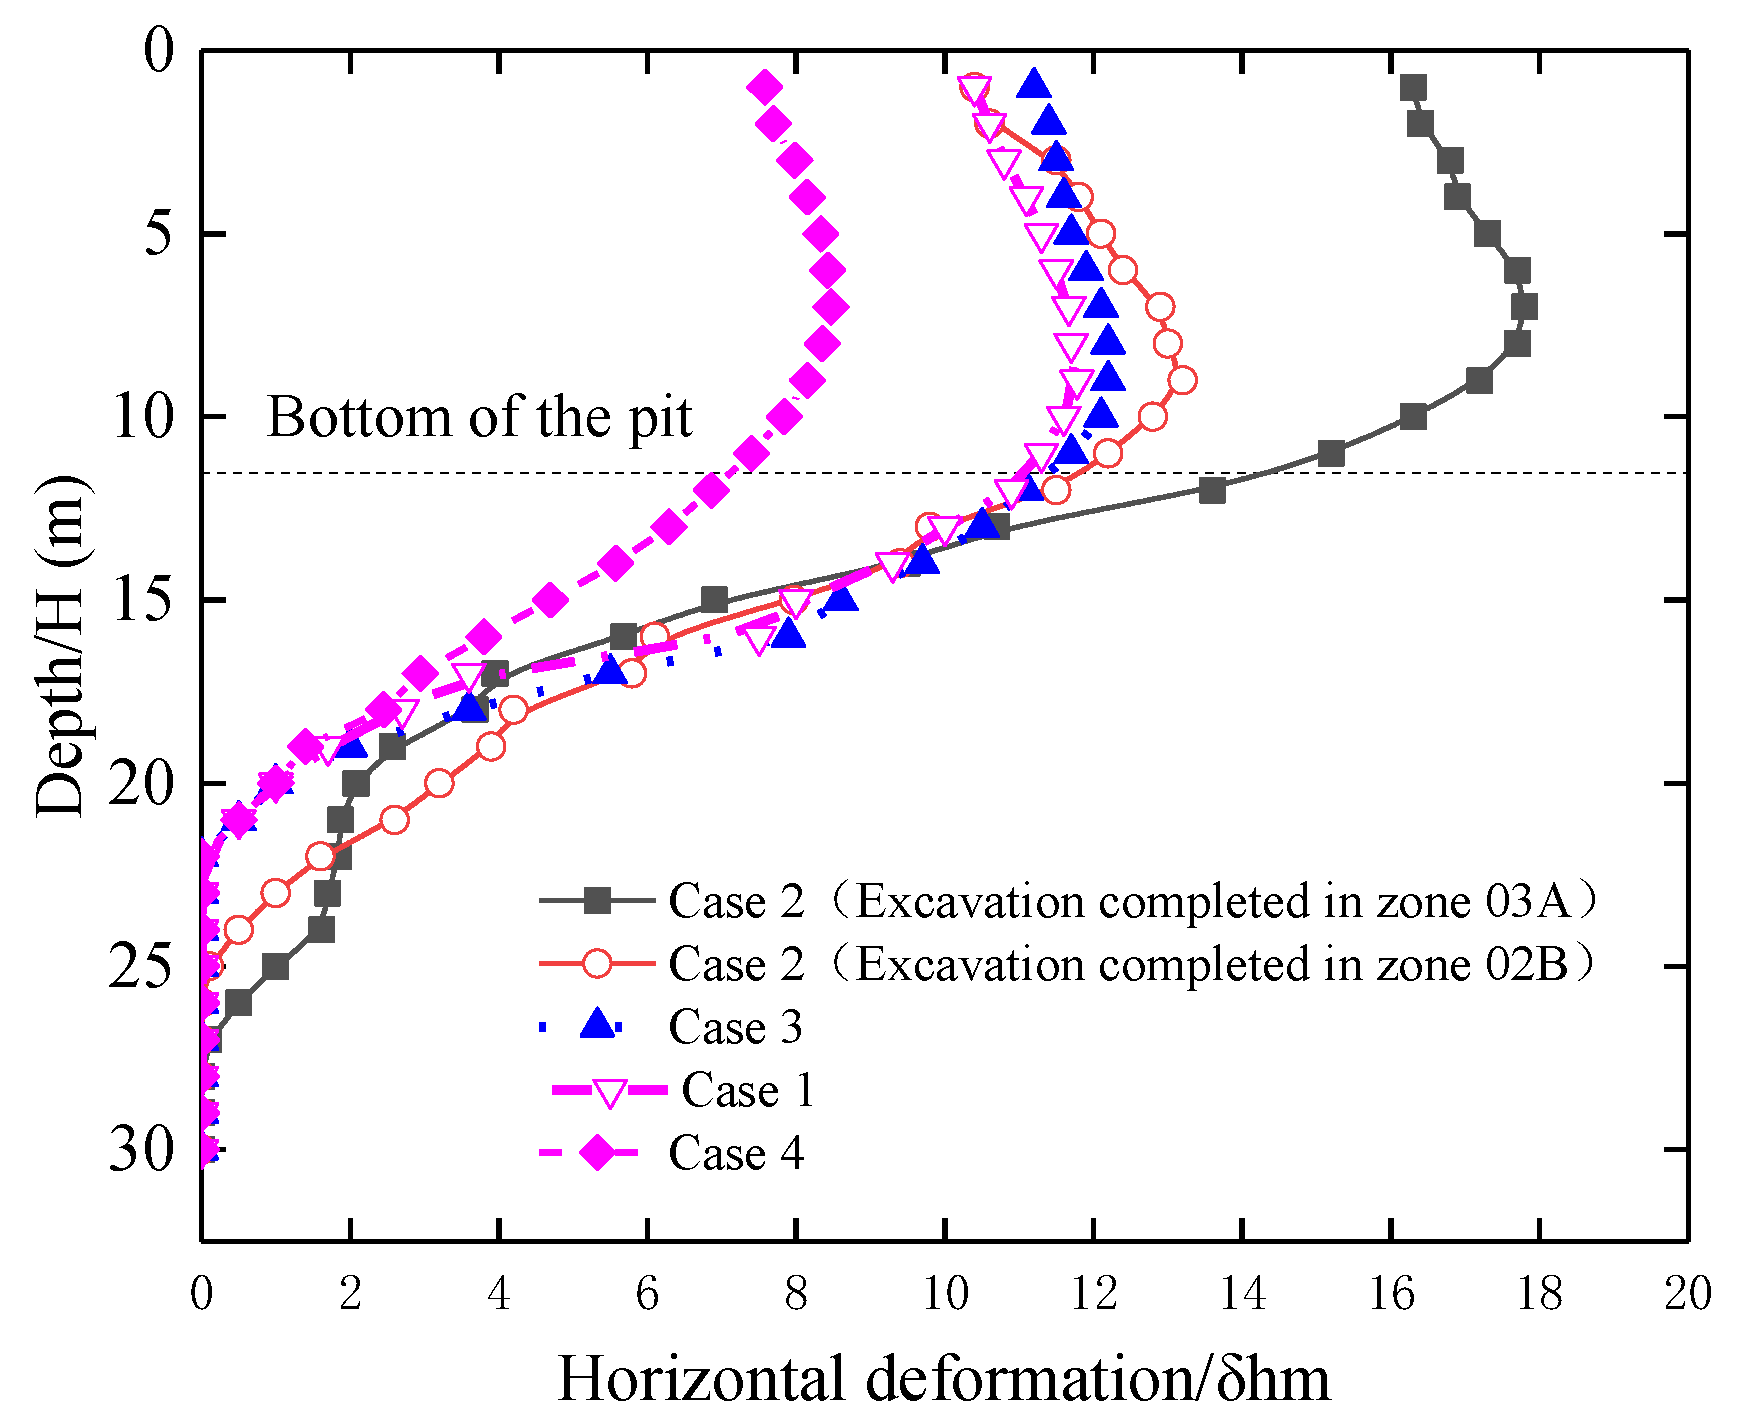
4.2.1. The Diaphragm Wall Deformation
4.2.2. The Steel Pipe Structs’ Vertical Deformation
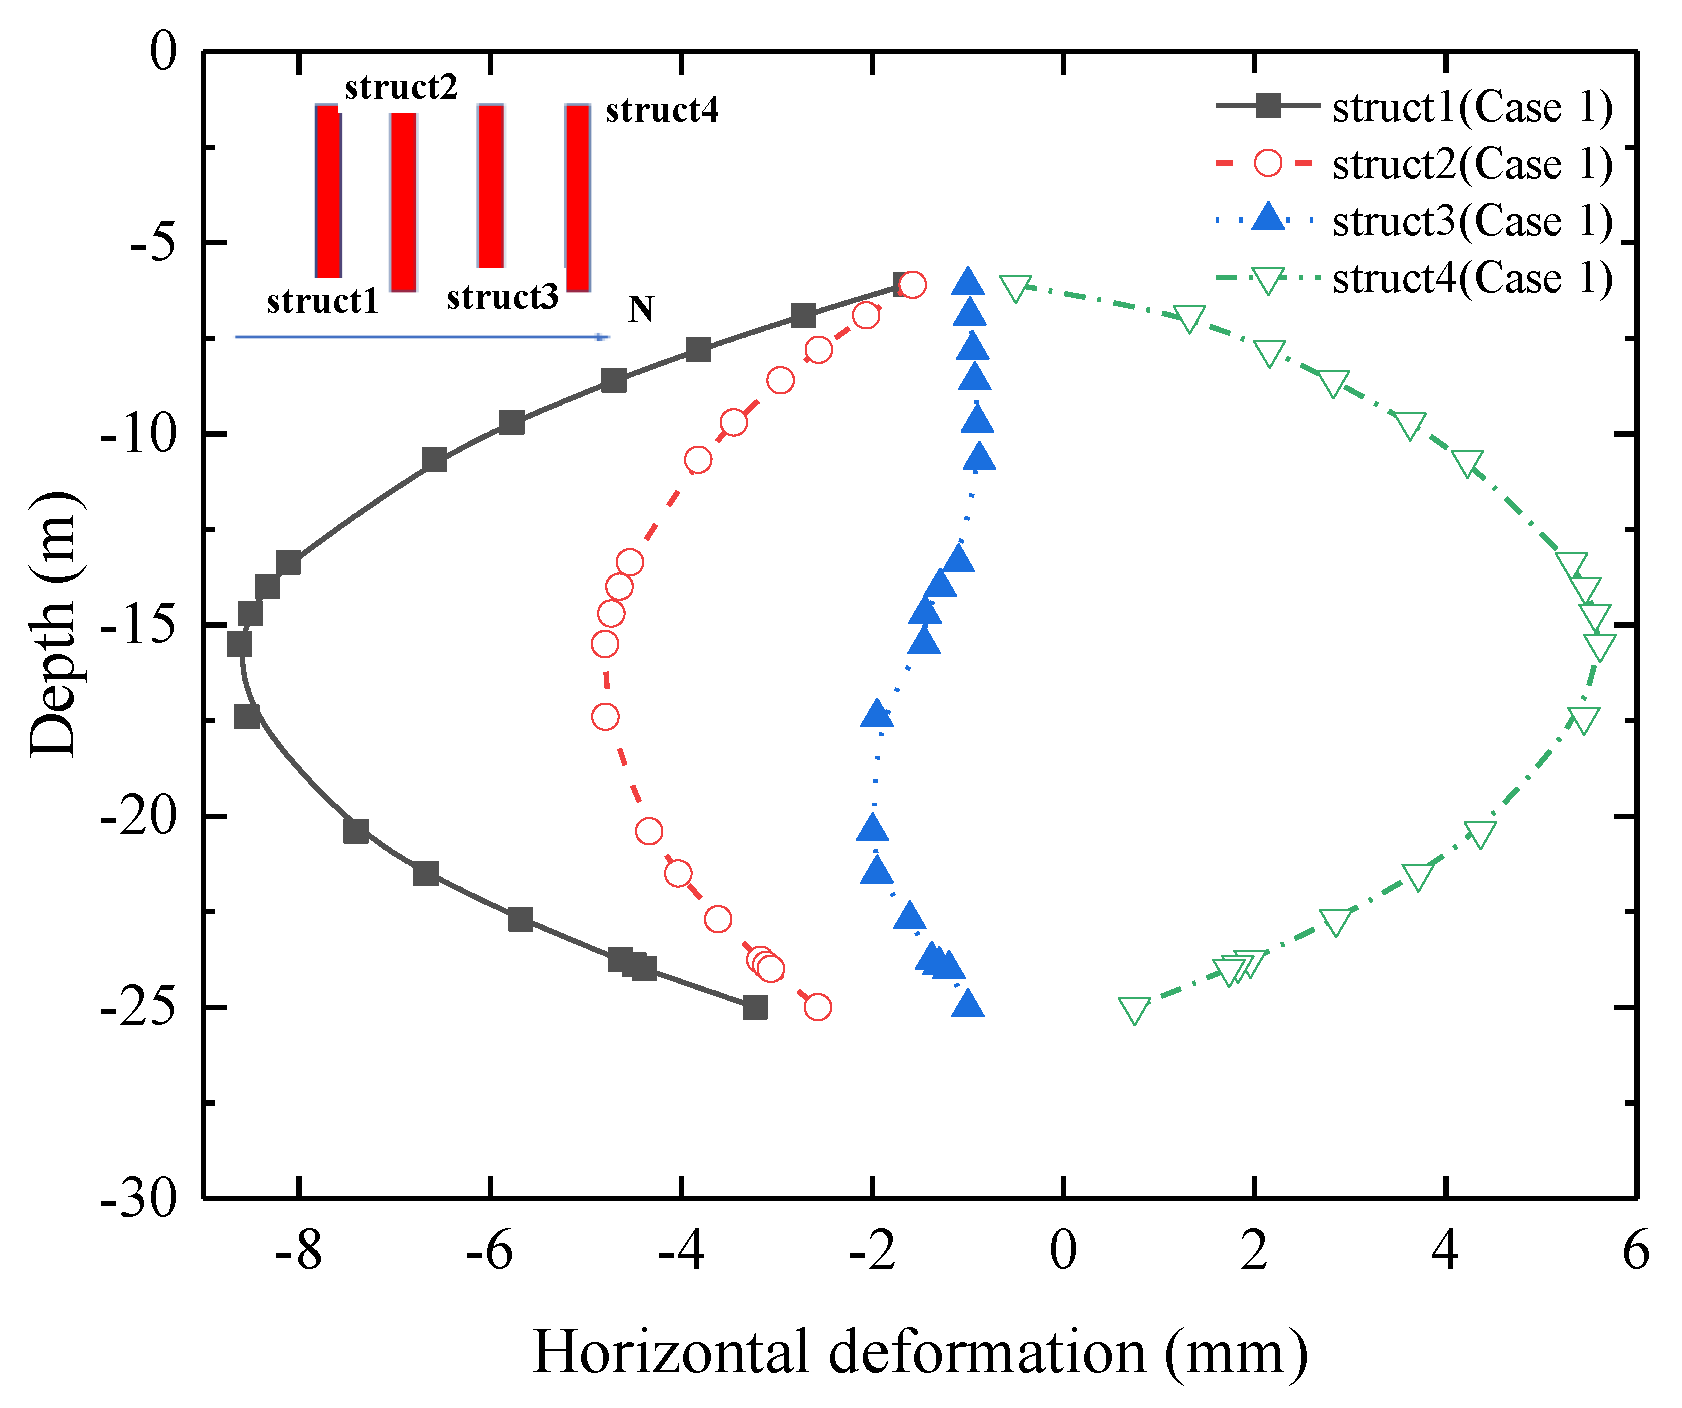
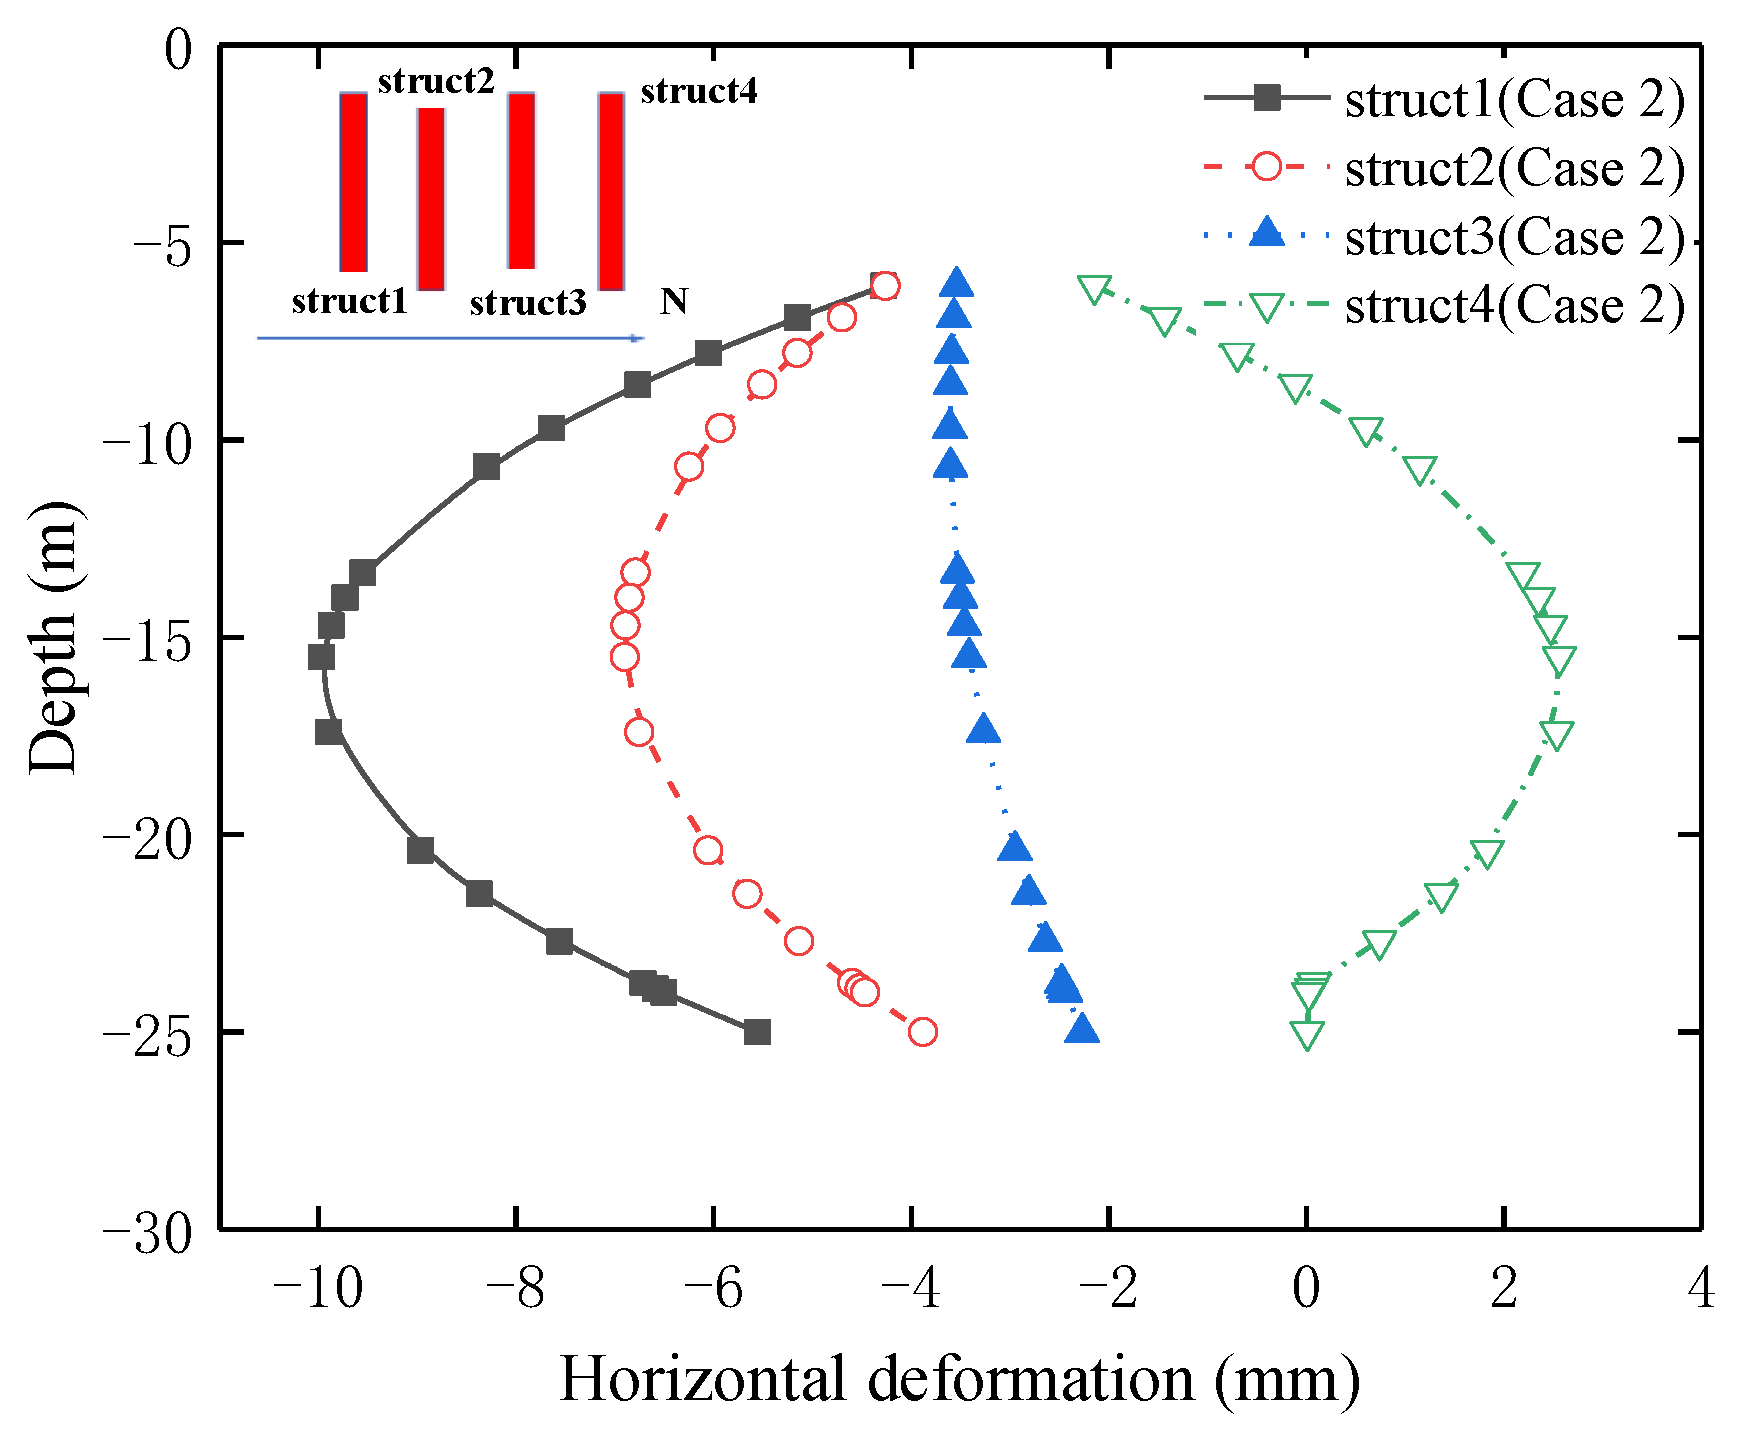
4.2.3. The Steel Pipe Structs’ Horizontal Deformation
- (1)
- Under Case 1 conditions
- (2)
- Under Case 2 conditions
- (3)
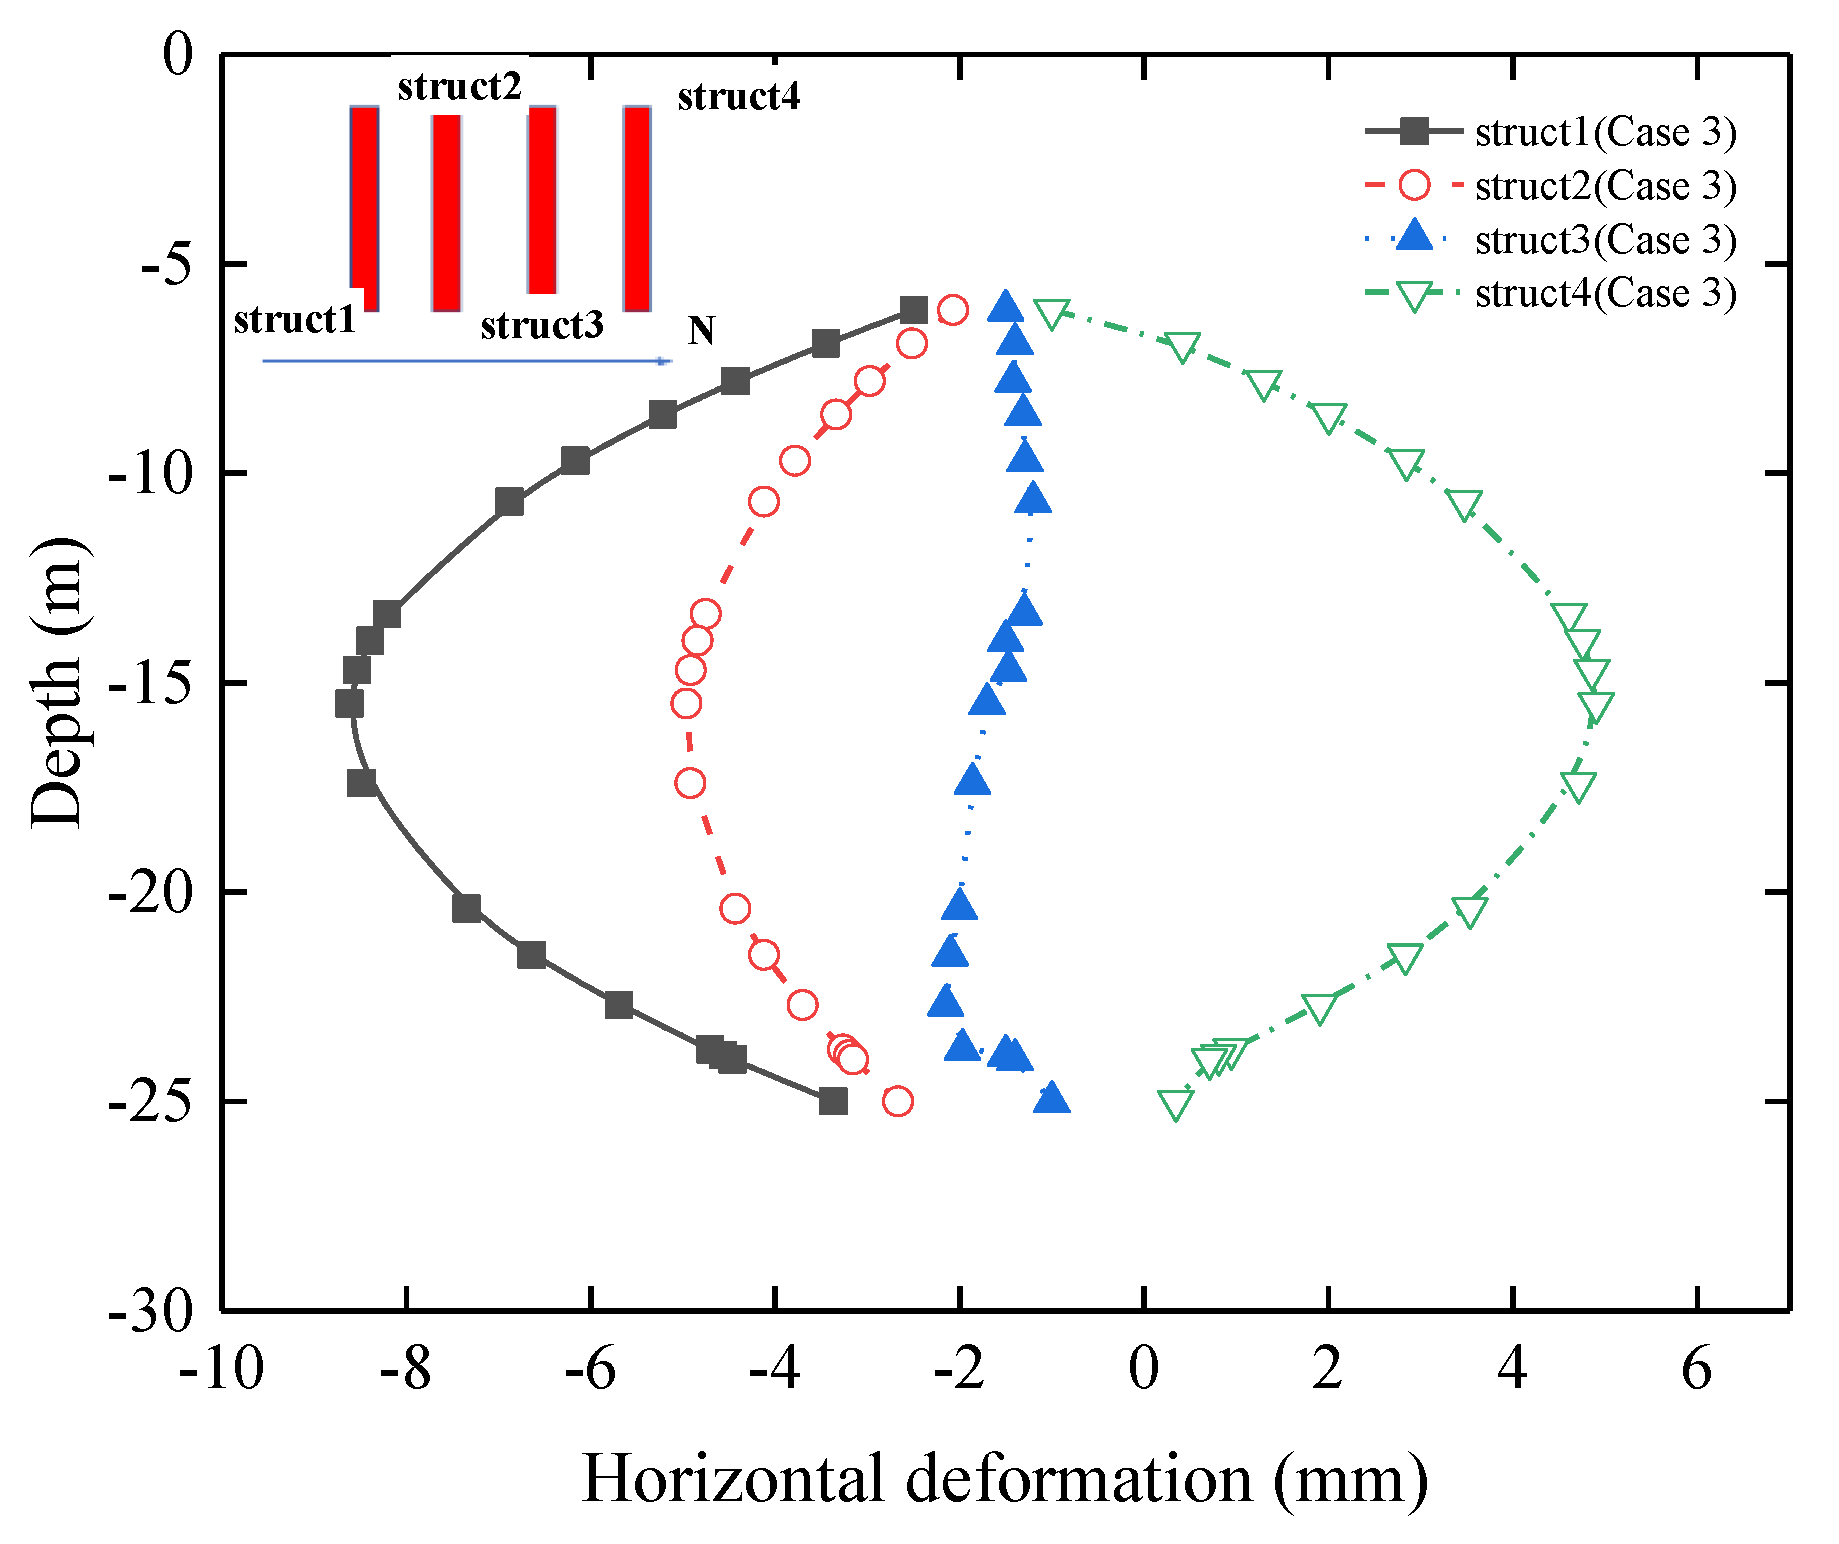
- Under Case 3 conditions
- (4)
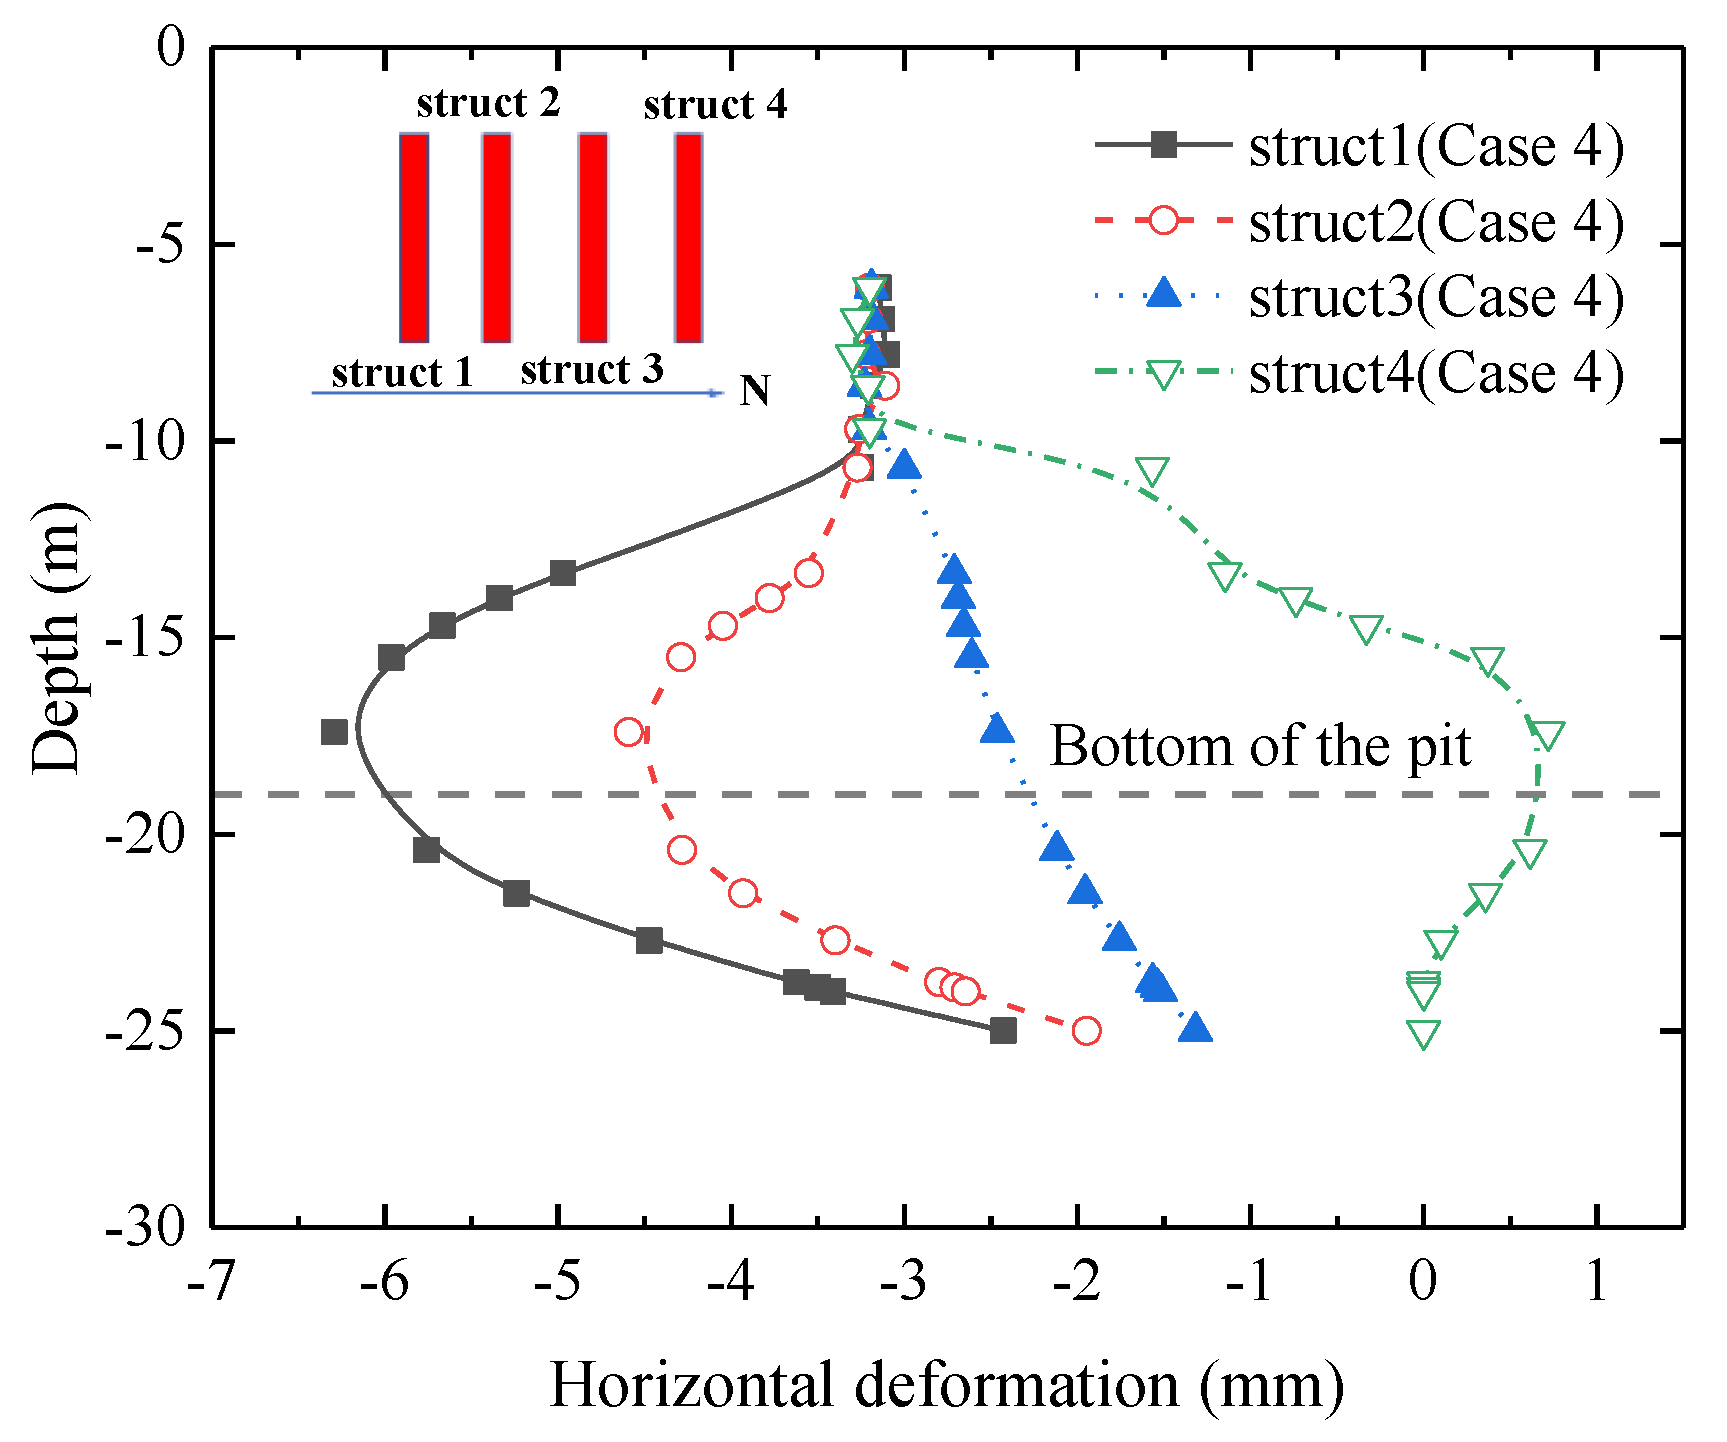
- Under Case 4 conditions
4.3. Discussion
4.3.1. The Additional Deformation Rate
- (1)
- In Case 2, after the excavation of Area A is completed, the value η of the D-walls is 1.5; with the completion of the excavation of Area C in Case 2, the lateral soil pressure decreases, and the value η of the D-walls decreases to 1.1. For Case 3, the excavation of the Areas A and C is staggered, and the staggered distance is only 3 m, and the value η of the D-walls is similar to that of simultaneous excavation, which is 1.02. In Case 4, compared with the above options, after the middle 1 slab cast, the horizontal direction of the steel pipe column is constrained by the top slab and the middle slab, and the value of η of the D-wall is much smaller than that of the synchronous excavation, at only 0.72.
- (2)
- The additional deformation rate of the steel pipe structs in Case 2 > Case 3 > Case 4, which is more similar to the deformation trend of the steel pipe structs for the different excavation options. Different from the above deformation is the fact that the additional deformation rate of Struct 2 and Struct 3 is much larger than that of Struct 1 and Struct 4, mainly because the soil unloading caused less disturbance to Struct 2 and Struct 3, which causes the synchronous excavation to have a smaller δsh, as the value η of the steel pipe structs gets larger.
- (3)
- The value η in Case 3 is more consistent with Case 1, and the smaller excavation spacing in Areas A and C has no obvious effect on the steel pipe structs. The value η in Case 4 is less than 1. The greater the stiffness of the main structure in Area B, the smaller the additional deformation.
4.3.2. Relative Stiffness Coefficient of the Main Structure
4.4. Program Validation
5. Conclusions
- (1)
- The unsynchronized excavation of the pits on both sides of the cover excavation area causes additional deformation of the steel pipe column. The horizontal deformation of the steel pipe column caused by synchronous excavation, and staggered excavation is similar, and the steel pipe column is deformed to the excavation side, respectively. The maximum deformation value is only 8.25 mm, and the maximum additional deformation rate is 1.02; while the sequential excavation makes the steel pipe column as a whole first produce, to the excavation side, a “side-down” deformation; when both sides of the pit excavation is completed, the steel pipe column produces, respectively, the maximum deformation value of only 14.86 mm, with the maximum additional deformation rate of 5.75. Therefore, controlling the excavation spacing of the foundation pit can effectively reduce the excavation-induced additional deformation.
- (2)
- The middle 1 slab cast can effectively control the horizontal deformation of the steel pipe structs and enhance the overall stiffness of the main structure in the cover excavation area. The deformation trend of the steel pipe column above the middle 1 slab is the same, and the steel pipe column below the middle 1 slab is deformed to the excavation side, respectively. The maximum horizontal deformation is only 5.8 mm, which is reduced by 41% compared with the simultaneous excavation of the top slab only. Therefore, the middle 1 slab should be applied as early as possible during the construction process.
- (3)
- The soil–structure’s physical and mechanical parameters, the spatial location relationship, and excavation depth can be reflected by the relative stiffness coefficient; the greater the excavation depth or the closer to the edge of the pit, the more susceptible the structure is to the impact of excavation in the adjacent pit.
- (4)
- The function relationship between the δhm/H of the structure and the relative stiffness coefficient Rd was obtained by fitting, which showed a non-linear growth trend, when the middle 1 slab cast and the maximum control mis-step spacing of the foundation pit excavation on both sides was 4.3 m.
Author Contributions
Funding
Institutional Review Board Statement
Informed Consent Statement
Data Availability Statement
Conflicts of Interest
References
- Yong, W.; Zhang, W.; Nguyen, H.; Bui, X.-N.; Choi, Y.; Nguyen-Thoi, T.; Zhou, J.; Tran, T.T. Analysis and prediction of diaphragm wall deflection induced by deep braced excavations using finite element method and artificial neural network optimized by metaheuristic algorithms. Reliab. Eng. Syst. Saf. 2022, 221, 108335. [Google Scholar] [CrossRef]
- Peng, F.; Ma, S. Analysis of experimental data on the effect of double-line parallel shield tunneling on the deformation of adjacent buildings. Alex. Eng. J. 2021, 60, 3957–3963. [Google Scholar] [CrossRef]
- Meng, G.; Huang, J.; Wu, B.; Zhu, Y.; Xu, S.; Hao, J. Risk Assessment of Deep Foundation Pit Construction Based on Analytic Hierarchy Process and Fuzzy Mathematics. Adv. Civ. Eng. 2020, 2020, 1–12. [Google Scholar] [CrossRef]
- Liu, B.; Zhang, D.; Yang, C.; Zhang, Q.-B. Long-term performance of metro tunnels induced by adjacent large deep excavation and protective measures in Nanjing silty clay. Tunn. Undergr. Space Technol. 2020, 95, 103147. [Google Scholar] [CrossRef]
- Liang, R.; Wu, J.; Sun, L.; Shen, W.; Wu, W. Performances of adjacent metro structures due to zoned excavation of a large-scale basement in soft ground. Tunn. Undergr. Space Technol. 2021, 117, 104123. [Google Scholar] [CrossRef]
- Li, M.-G.; Xiao, X.; Wang, J.-H.; Chen, J.-J. Numerical study on responses of an existing metro line to staged deep excavations. Tunn. Undergr. Space Technol. 2018, 85, 268–281. [Google Scholar] [CrossRef]
- Tan, Y.; Wang, D. Characteristics of A Large-Scale Deep Foundation Pit Excavated by Central-Island Technique in Shanghai Soft Clay. Part II: Top-Down Construction of the Peripheral Rectangular Pit. J. Geotech. Geoenvironmental Eng. 2013, 139, 1894–1910. [Google Scholar] [CrossRef]
- Tan, Y.; Lu, Y.; Xu, C.; Wang, D. Investigation on performance of a large circular pit-in-pit excavation in clay-gravel-cobble mixed strata. Tunn. Undergr. Space Technol. 2018, 79, 356–374. [Google Scholar] [CrossRef]
- Dai, X.; Cai, J.; Diao, Y.; Huo, H.; Xu, G. Influence of tunnelling on the deformation of the overlying excavation bracing system and analysis of countermeasures. Comput. Geotech. 2021, 134, 104089. [Google Scholar] [CrossRef]
- Tan, Y.; Huang, R.; Kang, Z.; Bin, W. Covered Semi-Top-Down Excavation of Subway Station Surrounded by Closely Spaced Buildings in Downtown Shanghai: Building Response. J. Perform. Constr. Facil. 2016, 30, 4016040. [Google Scholar] [CrossRef]
- Li, M.-G.; Zhang, Z.-J.; Chen, J.-J.; Wang, J.-H.; Xu, A.-J. Zoned and staged construction of an underground complex in Shanghai soft clay. Tunn. Undergr. Space Technol. 2017, 67, 187–200. [Google Scholar] [CrossRef]
- Zhou, H.-Z.; Zheng, G.; He, X.-P.; Wang, E.-Y.; Guo, Z.-Y.; Nie, D.-Q.; Ma, S.-K. Numerical modelling of retaining structure displacements in multi-bench retained excavations. Acta Geotech. 2020, 15, 2691–2703. [Google Scholar] [CrossRef]
- Shi, J.; Wei, J.; Ng, C.W.; Lu, H.; Ma, S.; Shi, C.; Li, P. Effects of construction sequence of double basement excavations on an existing floating pile. Tunn. Undergr. Space Technol. 2021, 119, 104230. [Google Scholar] [CrossRef]
- Likitlersuang, S.; Surarak, C.; Wanatowski, D.; Oh, E.; Balasubramaniam, A. Finite element analysis of a deep excavation: A case study from the Bangkok MRT. Soils Found. 2013, 53, 756–773. [Google Scholar] [CrossRef] [Green Version]
- Hsieh, P.; Ou, C. Shape of ground surface settlement profiles caused by excavation. Can. Geotech. J. 1998, 35, 1004–1017. [Google Scholar] [CrossRef]
- Houhou, M.N.; Emeriault, F.; Belounar, A. Three-dimensional numerical back-analysis of a monitored deep excavation retained by strutted diaphragm walls. Tunn. Undergr. Space Technol. 2019, 83, 153–164. [Google Scholar] [CrossRef]
- Clough, G.W.; Smith, E.M.; Sweeney, B.P. Movement Control of Excavation Support Systems by Iterative Design; American Society of Civil Engineers: Reston, VA, USA, 1989; pp. 869–884. [Google Scholar]
- Bryson, L.S.; Zapata-Medina, D.G. Method for Estimating System Stiffness for Excavation Support Walls. J. Geotech. Geoenvironmental Eng. 2012, 138, 1104–1115. [Google Scholar] [CrossRef]
- Ou, C.-Y.; Teng, F.; Li, C.-W. A simplified estimation of excavation-induced ground movements for adjacent building damage potential assessment. Tunn. Undergr. Space Technol. 2020, 106, 103561. [Google Scholar] [CrossRef]
- Obrzud, R.F. On the Use of the Hardening Soil Small Strain Model in Geotechnical Practice. Numerics in Geotechnics & Structures; Elmepress International: Lausanne, Switzerland, 2010. [Google Scholar]
- Teparaksa, W.; Teparaksa, J. Comparison of diaphragm wall movement prediction and field performance for different construction techniques. Undergr. Space 2019, 4, 225–234. [Google Scholar] [CrossRef]
- Schanz, T.; Vermeer, P.; Bonnier, P. The hardening soil model: Formulation and verification. In Beyond 2000 in Computational Geotechnics; Routledge: Abingdon, UK, 2019; pp. 281–296. [Google Scholar]
- Duncan, J.M.; Chang, C.Y. Nonlinear Analysis of Stress and Strain in Soils. Journal of the Soil Mechanics and Foundations Division. ASCE 1970, 96, 1629–1653. [Google Scholar]
- Benz, T.; Vermeer, P.A.; Schwab, R. A small-strain overlay model. Int. J. Numer. Anal. Methods Geomech. 2009, 33, 25–44. [Google Scholar] [CrossRef]
- Atkinson, J.H. Experimental determination of stress-strain -time characteristics in laboratory and-in-situ tests. General report. In Proceedings of the Tenth European Conference on Soil Mechanics & Foundation Engineering, Florence, Italy, 26–30 May 1991; p. 3. [Google Scholar]
- Guo, P.; Gong, X.; Wang, Y. Displacement and force analyses of braced structure of deep excavation considering unsymmetrical surcharge effect. Comput. Geotech. 2019, 113, 103102. [Google Scholar] [CrossRef]
- Li, S. Study on Design of Beijing Subway Station Deep Excavation Based on Deformation Controlling. Ph.D. Thesis, Beijing Jiao Tong University, Beijing, China, 2013. (In Chinese). [Google Scholar]


| Soil | Depth (m) | γ (kN/m3) | Cohesion/c (kPa) | Friction Angle/φ (°) | ||||
|---|---|---|---|---|---|---|---|---|
| (MPa) | (MPa) | (MPa) | (MPa) | |||||
| Fill | 0–3 | 1950 | 8 | 15 | 180 | 15 | 10 | 62 |
| Silty clay | 3–9 | 1760 | 15 | 27 | 185 | 20.8 | 15.8 | 61 |
| Fine medium sand | 9–24 | 1900 | 5 | 28 | 390 | 30 | 25 | 130 |
| Silty clay | 24–30 | 1870 | 35 | 15 | 330 | 25 | 18 | 110 |
| Fine medium sand | 30–36 | 1960 | 5 | 32 | 480 | 39 | 35 | 160 |
| Silty clay | 36–39 | 1960 | 33 | 15 | 450 | 28 | 22 | 150 |
| Fine medium sand | 39–48 | 1980 | 6 | 31 | 750 | 55 | 45 | 255 |
| Silty clay | 48–54 | 1930 | 36 | 15 | 420 | 31 | 28 | 140 |
| Fine medium sand | 54–60 | 2020 | 5 | 34 | 990 | 70 | 65 | 330 |
| Silty clay | 60–63 | 2020 | 47 | 17 | 420 | 31 | 28 | 145 |
| Fine medium sand | 63–90 | 2020 | 6 | 5 | 1350 | 99 | 90 | 450 |
| Name | Structure | Young’s Modulus | Poisson’s Ratio | Diameter | Length | Design Tension | Length of the Free |
|---|---|---|---|---|---|---|---|
| (GPa) | (m) | (m) | (kN) | (m) | |||
| First pre-stressed anchor | Cable element | 200 | 0.25 | 0.2 | 24 | 230 | 10 |
| Second pre-stressed anchor | Cable element | 200 | 0.25 | 0.2 | 24 | 400 | 9 |
| Third pre-stressed anchor | Cable element | 200 | 0.25 | 0.2 | 25 | 640 | 8 |
| Fourth pre-stressed anchor | Cable element | 200 | 0.25 | 0.2 | 28 | 660 | 7 |
| Soil nail | Cable element | 200 | 0.25 | 0.022 | 10/9/8/7 | / | / |
| Pore pile | Pile element | 31.5 | 0.2 | 1/2 | / | / | / |
| beam | Beam element | 31.5 | 0.2 | / | / | / | / |
| The retaining wall | Plate element | 31.5 | 0.2 | / | / | / | / |
| Excavation Schemes | Additional Deformation Rates | ||||
|---|---|---|---|---|---|
| The Retaining Walls | Struct 1 | Struct 2 | Struct 3 | Struct 4 | |
| Case 2—Area A finished | 1.5 | 1.7 | 2.67 | 5.75 | 1.96 |
| Case 2—Area C finished | 1.1 | 1.1 | 1.4 | 3.45 | 0.64 |
| Case 3 | 1 | 1 | 1 | 1 | 0.87 |
| Case 4 | 0.72 | 0.68 | 0.95 | 1.35 | 0.58 |
| Excavation Schemes | Relative Stiffness Coefficient | |||
|---|---|---|---|---|
| Struct 1 | Struct 2 | Struct 3 | Struct 4 | |
| Case 1 | 21 | 7 | 1 | 10 |
| Case 2 (03A finished) | 65 | 50 | 43 | 36 |
| Case 2 (02B finished) | 30 | 15 | 4 | 2 |
| Case 3 | 23 | 8 | 2 | 8 |
| Case 4 | 13 | 7 | 3 | 1 |
Disclaimer/Publisher’s Note: The statements, opinions and data contained in all publications are solely those of the individual author(s) and contributor(s) and not of MDPI and/or the editor(s). MDPI and/or the editor(s) disclaim responsibility for any injury to people or property resulting from any ideas, methods, instructions or products referred to in the content. |
© 2023 by the authors. Licensee MDPI, Basel, Switzerland. This article is an open access article distributed under the terms and conditions of the Creative Commons Attribution (CC BY) license (https://creativecommons.org/licenses/by/4.0/).
Share and Cite
Cui, X.; Li, Z.; Guo, F.; Han, X.; Song, J. Displacement Analyses of Main Structure of Parallel Pit Excavation and Analysis of Countermeasures. Appl. Sci. 2023, 13, 3706. https://doi.org/10.3390/app13063706
Cui X, Li Z, Guo F, Han X, Song J. Displacement Analyses of Main Structure of Parallel Pit Excavation and Analysis of Countermeasures. Applied Sciences. 2023; 13(6):3706. https://doi.org/10.3390/app13063706
Chicago/Turabian StyleCui, Xiangyang, Zhaoping Li, Fei Guo, Xuegang Han, and Jianping Song. 2023. "Displacement Analyses of Main Structure of Parallel Pit Excavation and Analysis of Countermeasures" Applied Sciences 13, no. 6: 3706. https://doi.org/10.3390/app13063706