The reason for choosing the unsupervised algorithm Self-Organizing Map for the anomaly detection on the experimental two-phase plant is that it generates a two-dimensional map, which can be easily comprehended by operators not well versed in artificial neural networks.
The Self-Organizing Map algorithm is employed for clustering and visualizing data, creating a map of artificial neurons that efficiently represent data. In contrast to other algorithms, such as Random Forest (RF) [
38] and Support Vector Machine (SVM) [
39], SOM does not necessitate input data labelling, allowing it to be utilized for analysing unsupervised data. RF and SVM algorithms are primarily used for data classification and regression. These algorithms require input data labelling, meaning that they need training data and a target variable for supervision. Although they can be used to analyse unsupervised data, their effectiveness may be limited. In summary, SOM is useful when working with unlabelled data and seeking to visualize and analyse such data in a compact and organized manner.
3.1. The Experimental Two-Phase Plant
The gas-liquid biphasic system is characterized by the presence of two phases, a gaseous and a liquid one, in thermodynamic equilibrium. Although the gas and liquid are intimately mixed, they maintain their distinct physical properties, such as density, viscosity, and surface tension.
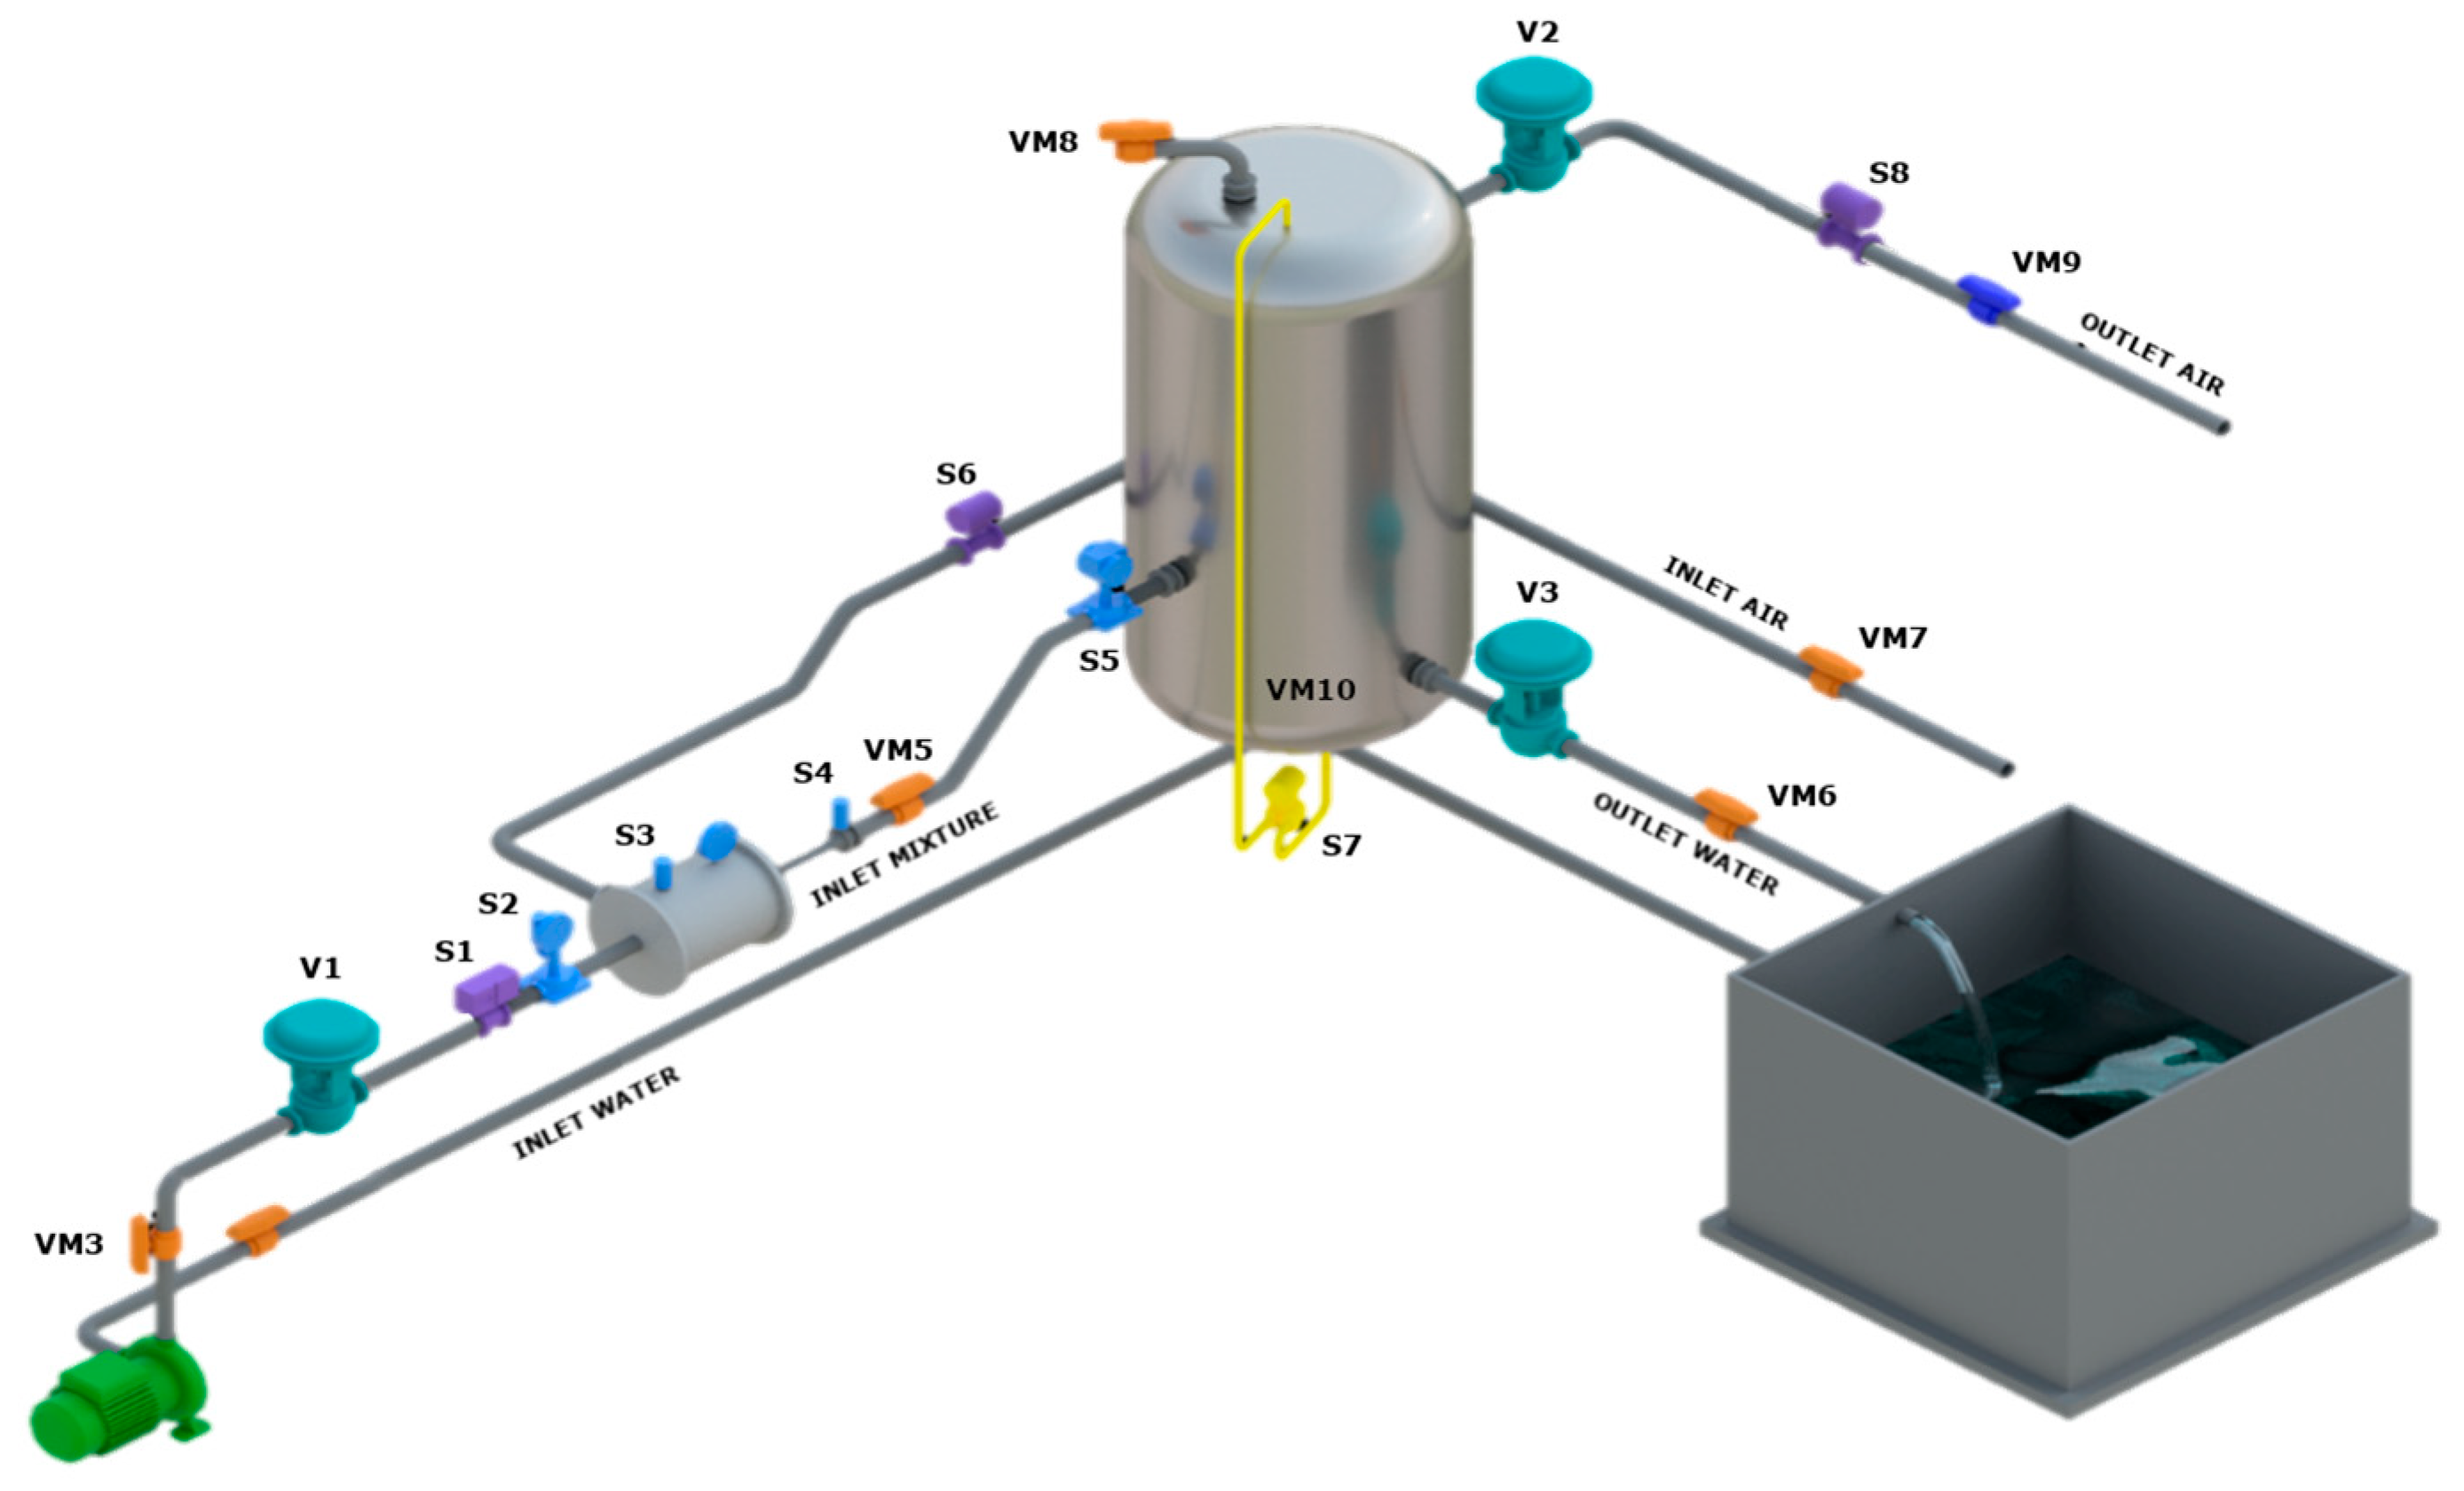
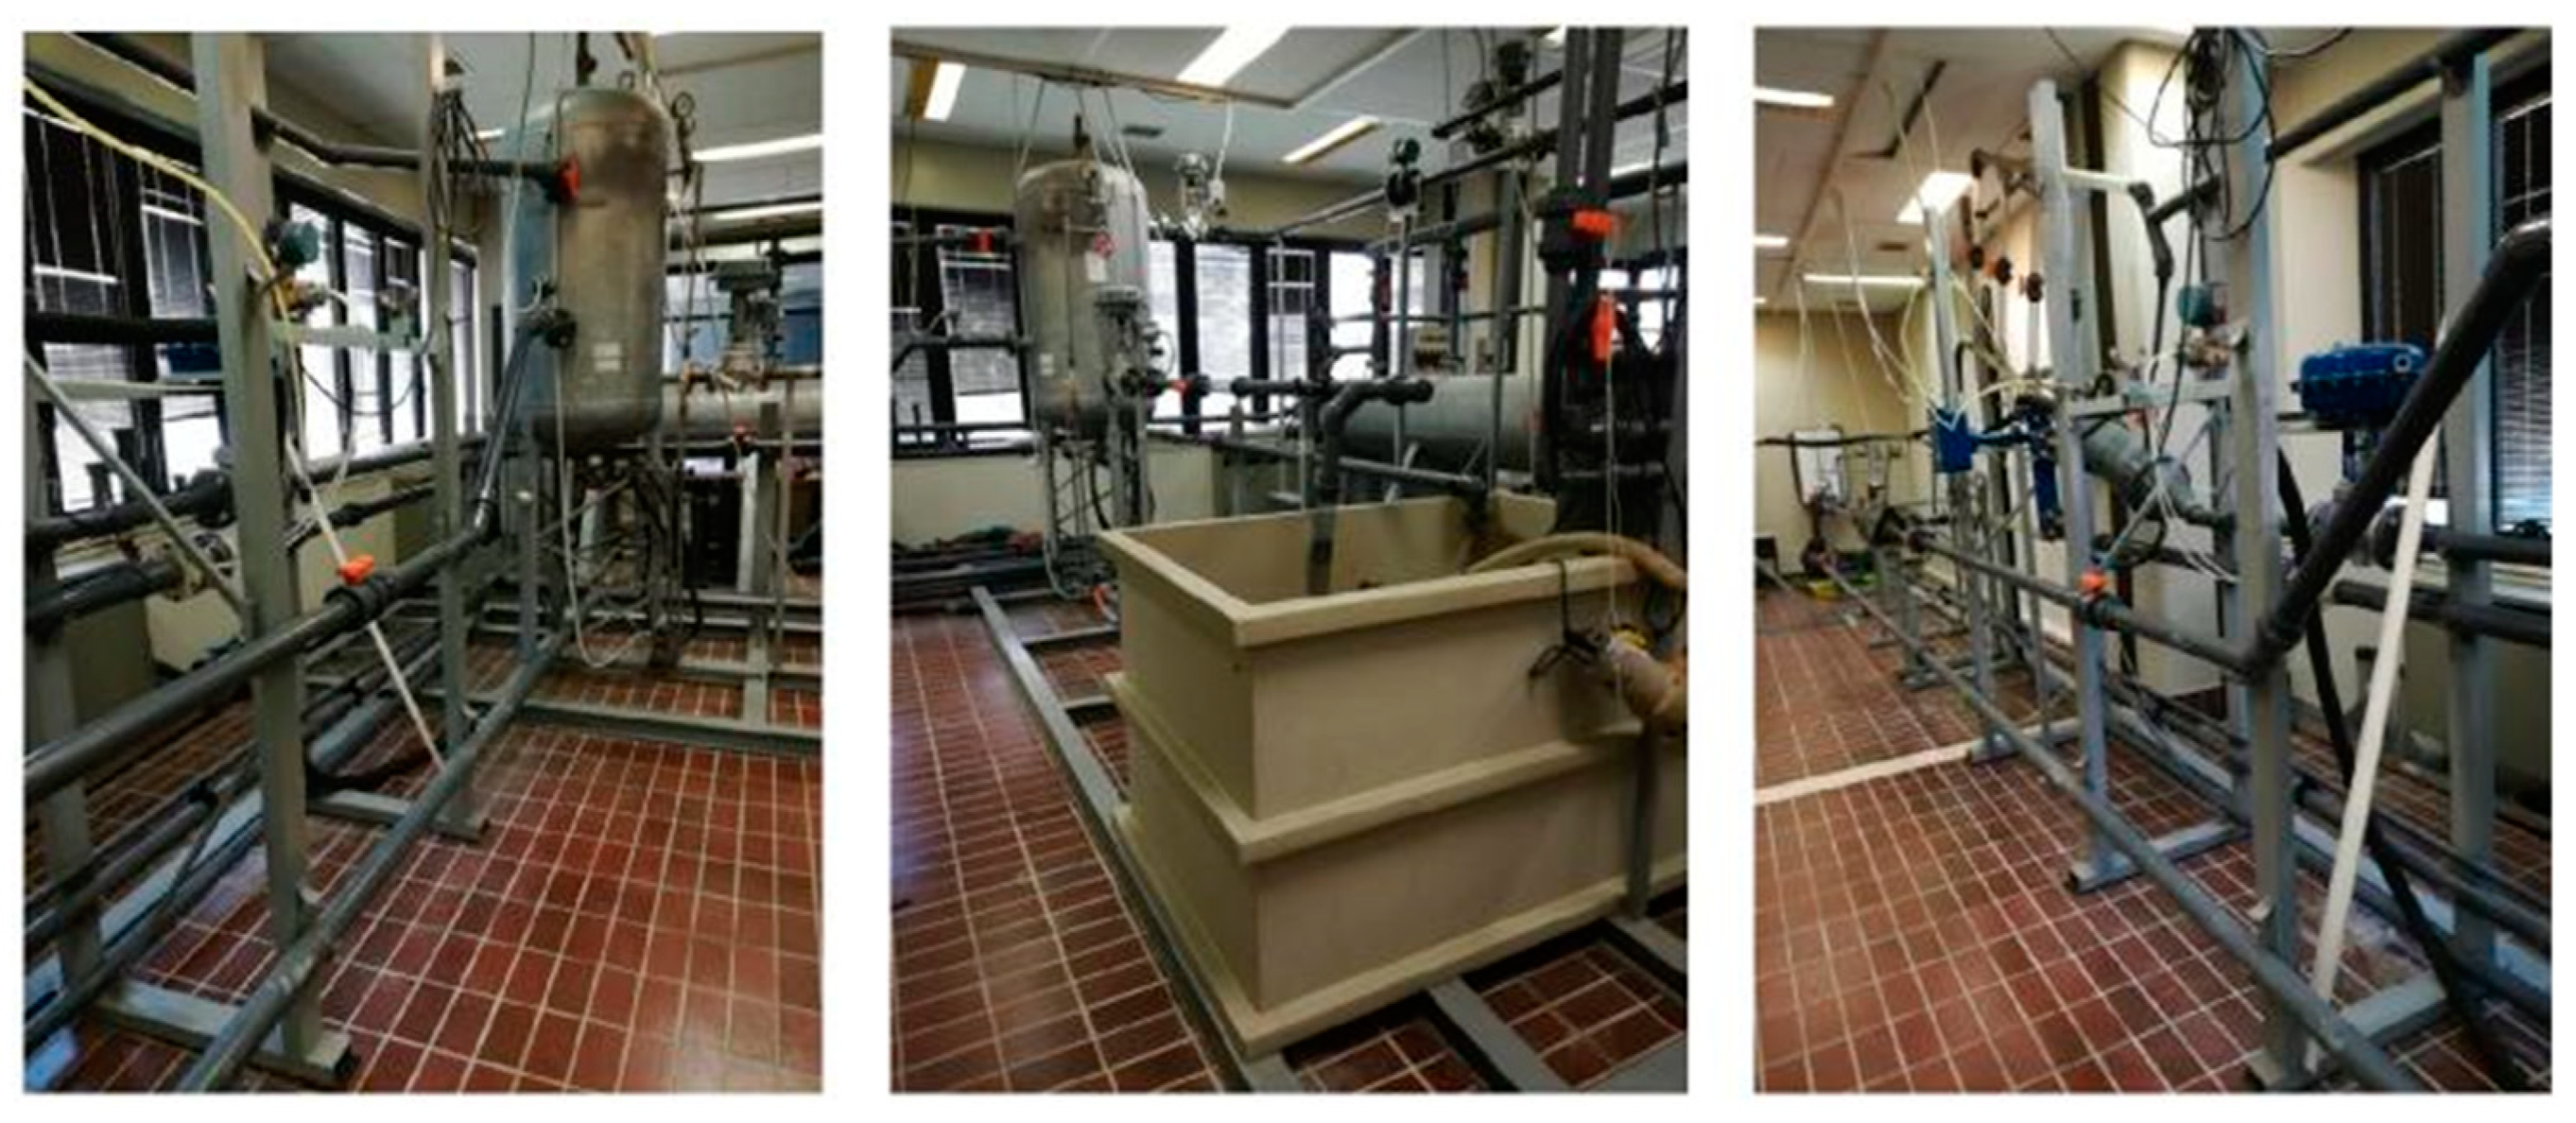
The two-phase experimental plant is located at the Department of Industrial Engineering and Mathematical Sciences (DIISM) of the Università Politecnica delle Marche (Ancona, Italy). The 3D plant model is shown in
Figure 3, and some views of the actual plant are in
Figure 4. It reproduces the extraction of oil and natural gas from depleted wells. Specifically, the useful life of hydrocarbon reservoirs is related to their potential and operating costs. A well is depleted if the water in it is in such quantities that it cannot be extracted or if the volumes of hydrocarbons produced become uneconomic considering the very high operating costs to make them unsustainable if there is little or no production. In such circumstances, the most obvious solution would be installing appropriate pumps located on the surface and at the base of the oil well with a very high cost compared to the produced hydrocarbon volumes. The system under consideration represents an undoubtedly more efficient solution. The extraction from a depleted reservoir is carried out by using the pressure of a hypothetical reservoir at the height of its useful life. Due to its physical characteristics, the latter’s pressure is higher than the transport pressure and, therefore, is able to create suction on the depleted reservoir, which, in contrast, does not have enough pressure for transport on the line.
Gas-liquid ejectors can mix two phases at different pressures (depletion and good wells) and impart the necessary transport energy. While in a realistic situation, the fluids treated are crude oil and natural gas, for safety reasons, water and ambient air are used in the case of the experimental plant. Specifically, water in a tank and a positive displacement pump model pressurized well behaviour, while ambient air simulates natural gas from a depleted reservoir. Pressurized water (“INLET WATER”) enters the ejector, creating a vacuum that draws in a certain amount of air from the environment (“INLET AIR”), thus creating a two-phase mixture (“INLET MIXTURE”). The resulting mixture is directed into a vertical tank that acts as a slug catcher to separate the liquid (“OUTLET WATER”) and gas (“OUTLET AIR”) phases. The plant is equipped with three pneumatic valves: to control the inlet water pressure (V1), regulate the pressure inside the tank (V2), and regulate the water level (V3). All the “VMs” in
Figure 3 represent shut-off valves used to reproduce anomalies in the system.
Table 2 briefly describes the plant equipment characteristics in terms of the monitored variable, the unit of measurement, type of equipment, and finally, the equipment tag code. All the plant sensors and valves are connected to a Revolution Pi device to acquire their status value.
3.2. The Self-Organizing Map
The Self-Organizing Map (SOM) was first theorized by Kohonen [
40]. Based on the similarity of the input information, the algorithm reorders the data in the map by performing a sort of classification. The structure of this artificial neural network consists only of the input and output layers.
The input dataset consists of a samples number equal to D described by n features, with . Each features sample ( with j = 1, 2 … n) is associated with a weight vector in the output map where m is the number of output nodes. The initial weights, randomly initialized, must be close to zero, avoiding the presence of similar weights. This way, no order is imposed on the network during the initialization phase.
The output layer is a low-dimensional representation of the input data. Typically, its nodes are arranged in a two-dimensional architecture organized as a grid with a rectangular or hexagonal topology. Mainly, the number of output nodes denotes the maximum number of clusters and influences the accuracy of the SOM.
The scientific study of Shalaginov and Franke [
41] can be exploited to calculate the number of nodes in the output grid. Considering D samples in the input database, Equation (1) describes the number of output nodes m.
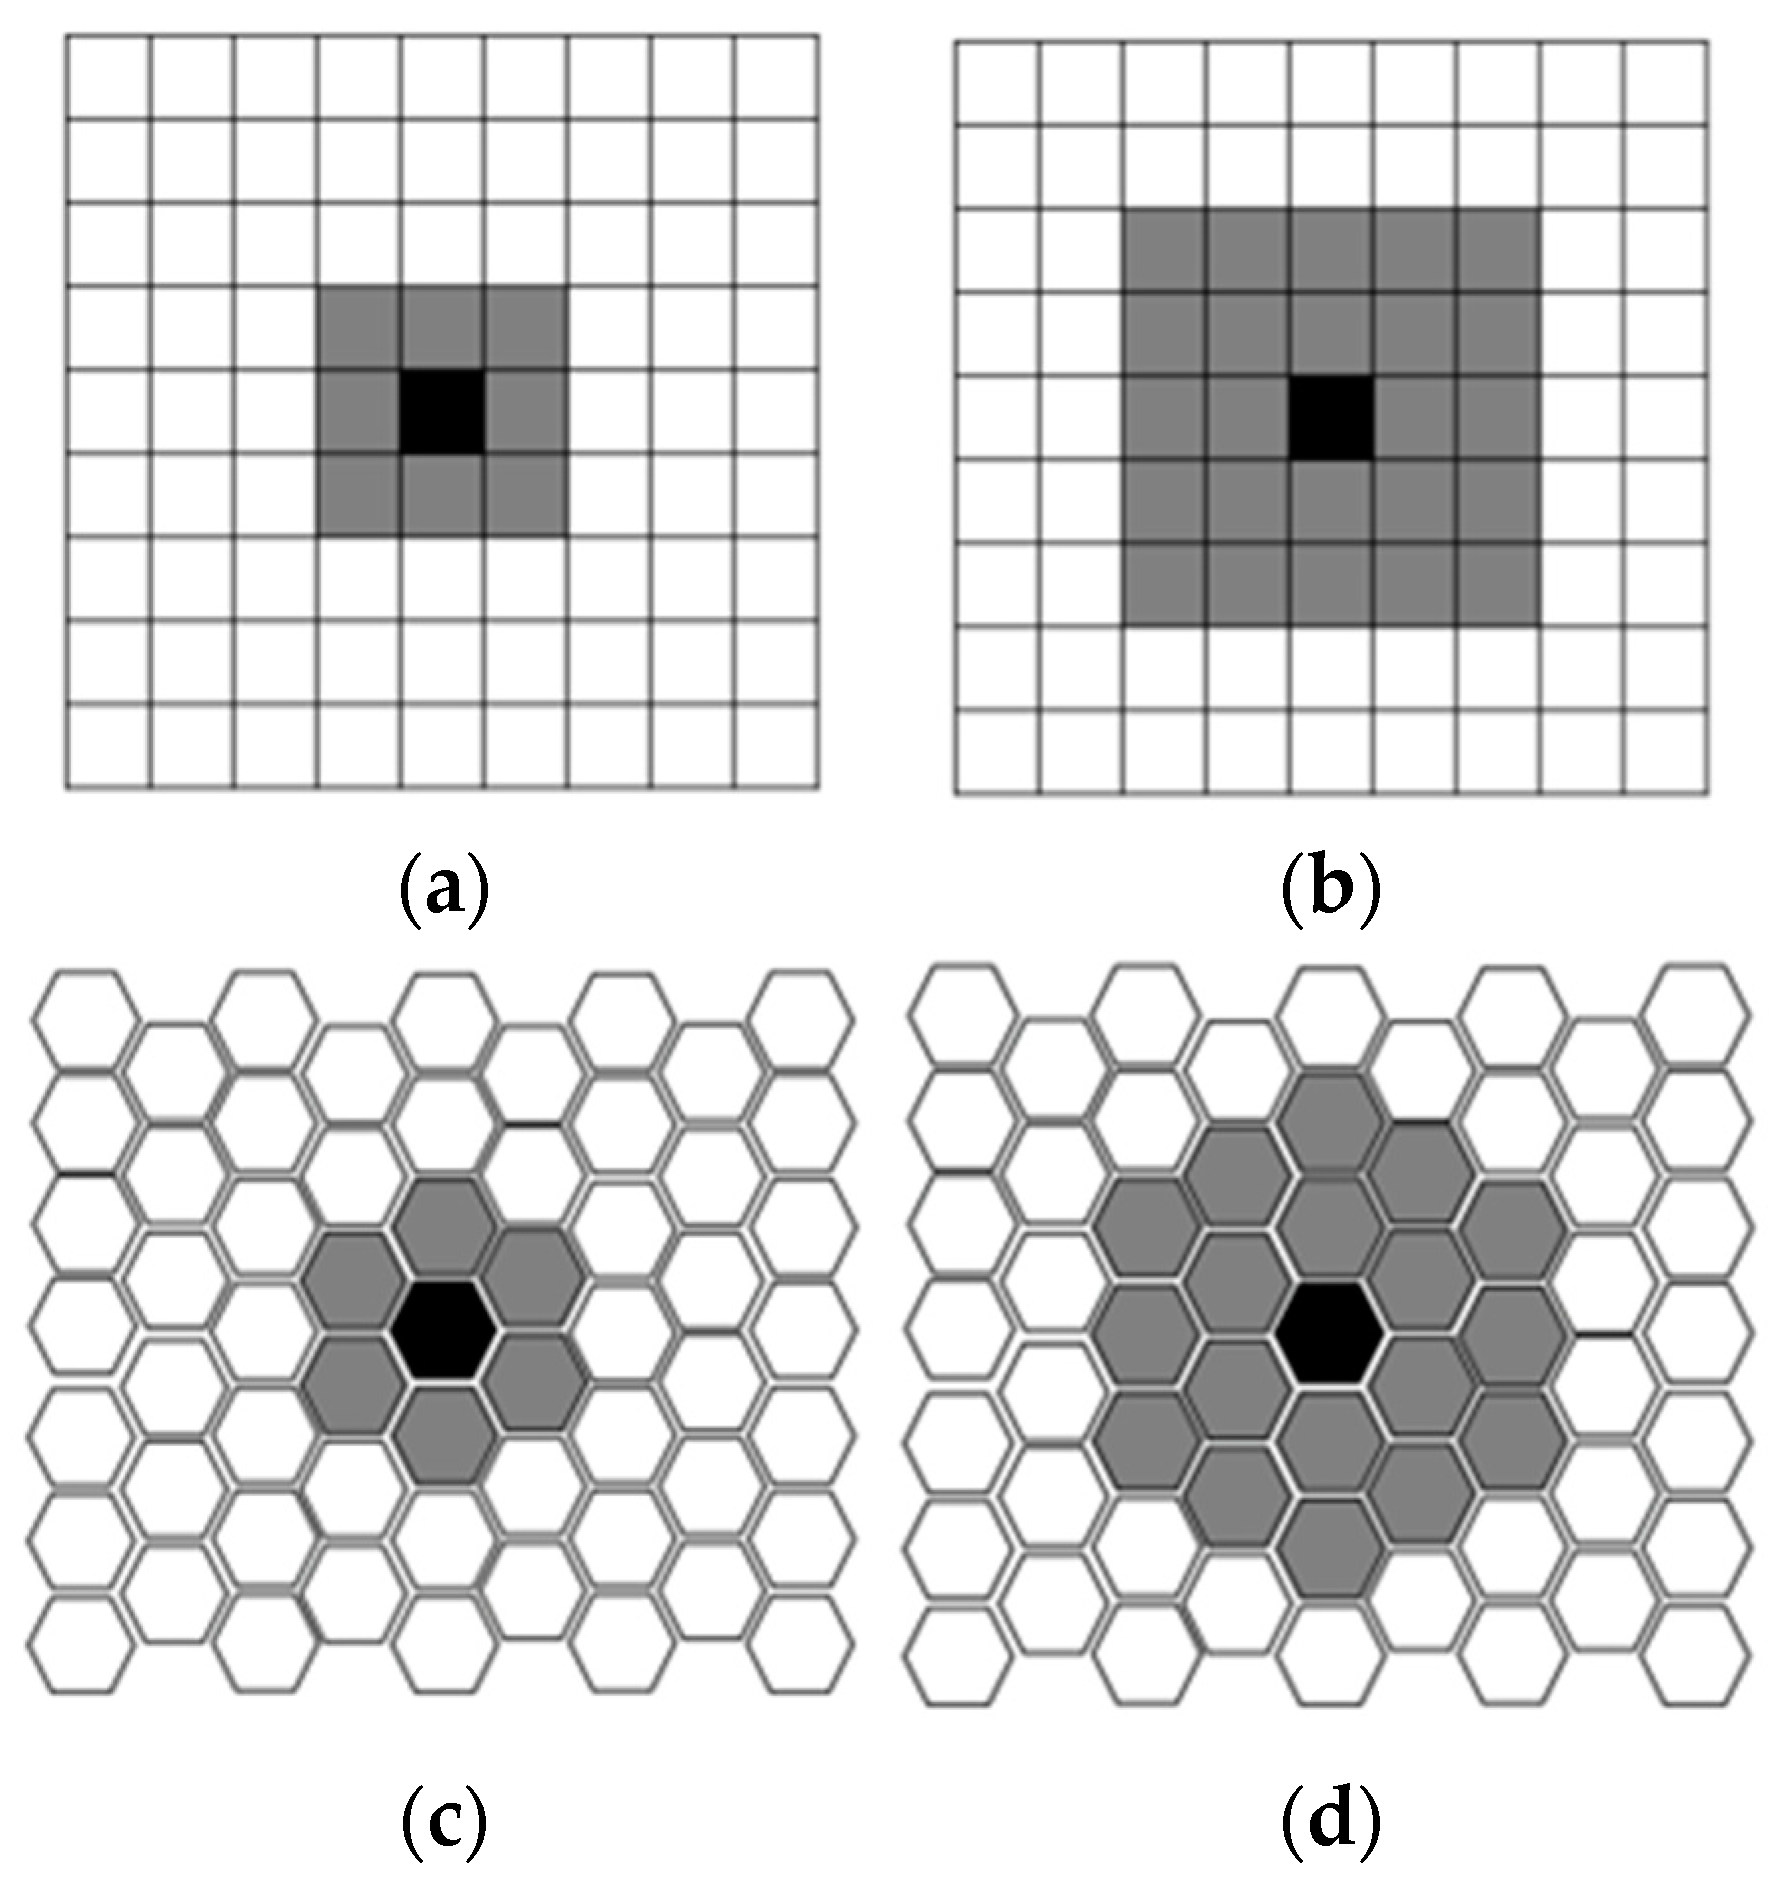
Once the number of output nodes is identified, choosing the proper grid topology is necessary. Indeed, each grid has specific properties: in the rectangular topology, each node has four neighbours, while in the hexagonal one, each node has six neighbours. In general, the hexagonal topology is the most used because of its more significant number of neighbours.
In unsupervised network learning, output nodes compete to be activated. Only the node with the weight closest to the input vector will be activated and declared the Best Matching Unit (BMU). Specifically, for the BMU identification, the distance between an input sample
and all weight vectors
is calculated using measurement methods such as Manhattan, Chebyshev, or Euclidean distance. However, according to Kohonen [
40], the Euclidean distance (see Equation (2)) is the most suitable for a visual representation because a more isotropic visualization of the dataset is achieved.
With i = 1, 2 … D, p = 1, 2 … m, and k = 1, 2 … T, where T is the maximum iterations number. At iteration k, the winning node
of all those considered will be the one that minimizes Equation (2), as shown in Equation (3).
Likewise, human neurons process similar information using neighbouring neurons. The SOM’s topological organization requires that adjacent neurons represent inputs with similar properties in the output space. Therefore, the BMU determines the spatial position of cooperating nodes’ neighbourhoods. These nodes, sharing common characteristics, activate each other to learn something from the same input. This way, the BMU node and the neighbouring nodes weights must be adapted to become more representative and faithful to the input space. Two parameters must be set to achieve this step: the learning rate, α(k), and the neighbourhood size. In particular, the learning rate controls the change rate of the weights and the neighbourhood size at each iteration. Learning rate and neighbourhood size guarantee the algorithm convergence even after a reasonable number of iterations (at least 1000). Thus, the learning rate gradually decreases during network training. As described by Natita et al. [
41], Equations (4)–(6) offer different learning rate formulas.
In particular,
is the value of the learning rate at the first iteration, and k is the current iteration. At this point, using a discrete-time formalism, let
be the weight vector of the winning node at iteration k. Then, at iteration k + 1, it is defined as described in Equation (7).
The topological properties of the initial space are preserved in the final one thanks to the neighbourhood size. The vectors of the nodes close to the BMU (
), indicated with
, have a crucial role in the learning process. The rate of weights adaptation decreases moving away from the winning node, according to a decay function called the neighbourhood function,
, where
indicates the winning node and
. At this point, the weights of all other nodes can be updated according to Equation (8).
Kohonen [
40] claims that different types of neighbourhoods can be distinguished (
Figure 5). A discrete neighbourhood function is defined as a function that defines a set
of elements at the winning node, such as
if
and
if
. The γ(t) value indicates the degree of participation in weight update [
42]. It is also possible to define the neighbourhood using a continuous function. The continuous neighbourhood function is often preferred over the discrete one because it decreases in time and space as the number of iterations increases. Thus, a more homogeneous output that preserves as much as possible the initial topological composition returns. There are several neighbourhood functions in the literature, such as the Bubble Equation (9), Gaussian Equation (10), Cutgass Equation (11), and Epanechikov Equation (12) [
43].
indicates the distance between the BMU and the excited neuron i, 1(k) is the step function: 1(k) = 0 if k < 0 and 1(k) = 1 if k ≥ 0 and
stands for the neighbourhood radius at iteration k. The maximum point of the symmetric Gaussian function is that defined by
. Since it is a monotone decreasing function, Kohonen [
40] suggests starting with a large
value since it has been seen experimentally that starting the training with too small a value does not bring the network to convergence.
3.4. Quality of Self-Organizing Map
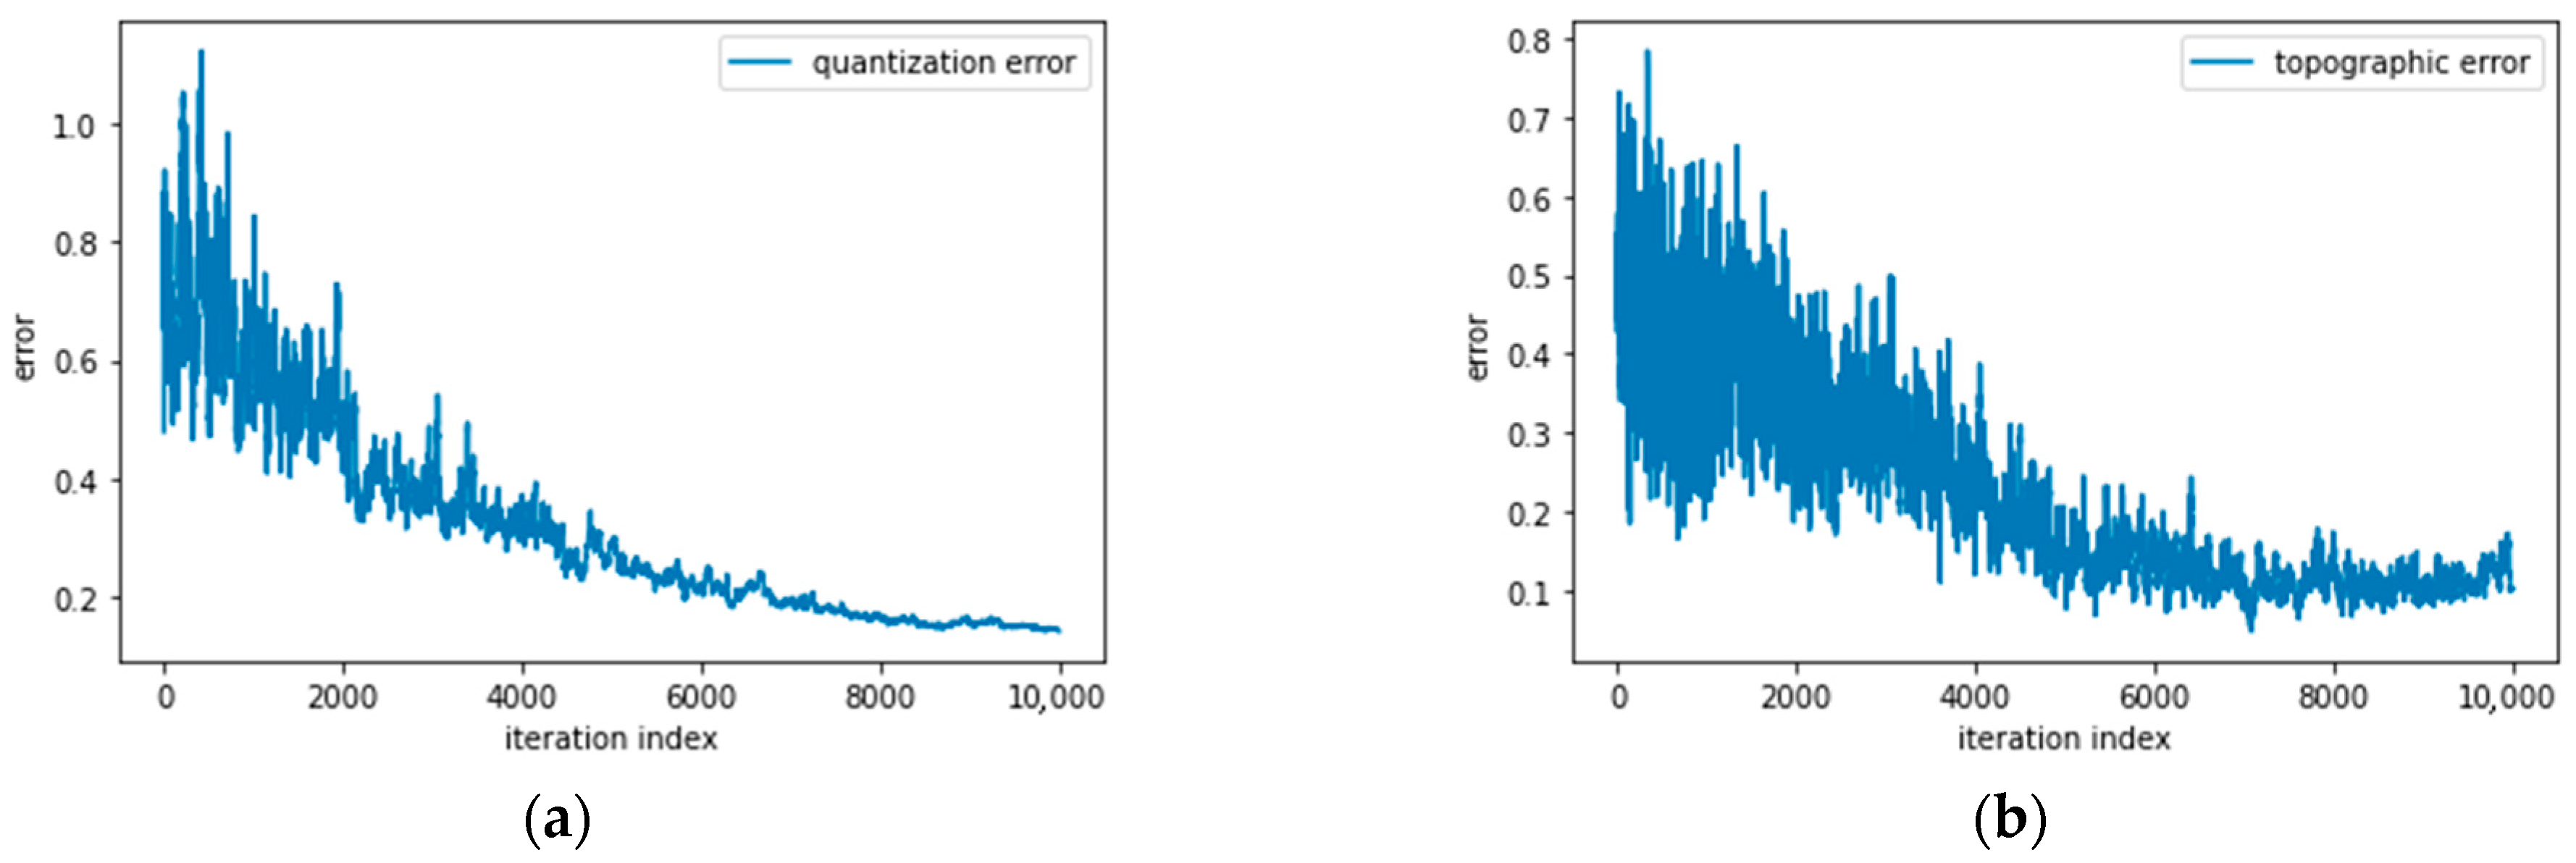
Several methods in the literature are used to validate the quality of the SOM. Pölzlbauer [
47] validates the SOM according to two parameters concerning the quality of the network learning (Quantization Error, QE) and the quality of the projection of the source data onto the output map (Topographic Error, TE). At the end of the learning process, each input data
is assigned to a weight on the output map that best represents it
[
48]. The difference
between the input and its associated weight expresses the quantization error. Through Equation (18), it is possible to calculate the average quantization error, which numerically represents how similar the final map is to the initial dataset.
One way to reduce the value of QE is to increase the number of output nodes to have the samples distributed more sparsely over the map, but in this way, the direct correlation with TE would be lost. The quality of the data projection on the output map is determined by considering the Topographic Error (Equation (19)). This parameter defines the percentage of vectors for which the first and second BMUs are not adjacent. Equation (20) expresses how this value is calculated.
After verifying the method and training the network, the input data are projected onto the output map. The nodes that make up the output grid accommodate only one class type, but sometimes this does not happen. Therefore, an analysis of cluster purity is conducted to uniquely assign a single class to each cell in the map [
49]. Purity is a metric for how much a cluster contains a single class (Equation (21)). First, this parameter is calculated: count the number of data points from each cluster’s most common class type. Then, divide the total data points by the sum of all clusters. Formally, given a collection of clusters
and a set of classes
, both splitting
data points, purity may be defined as:
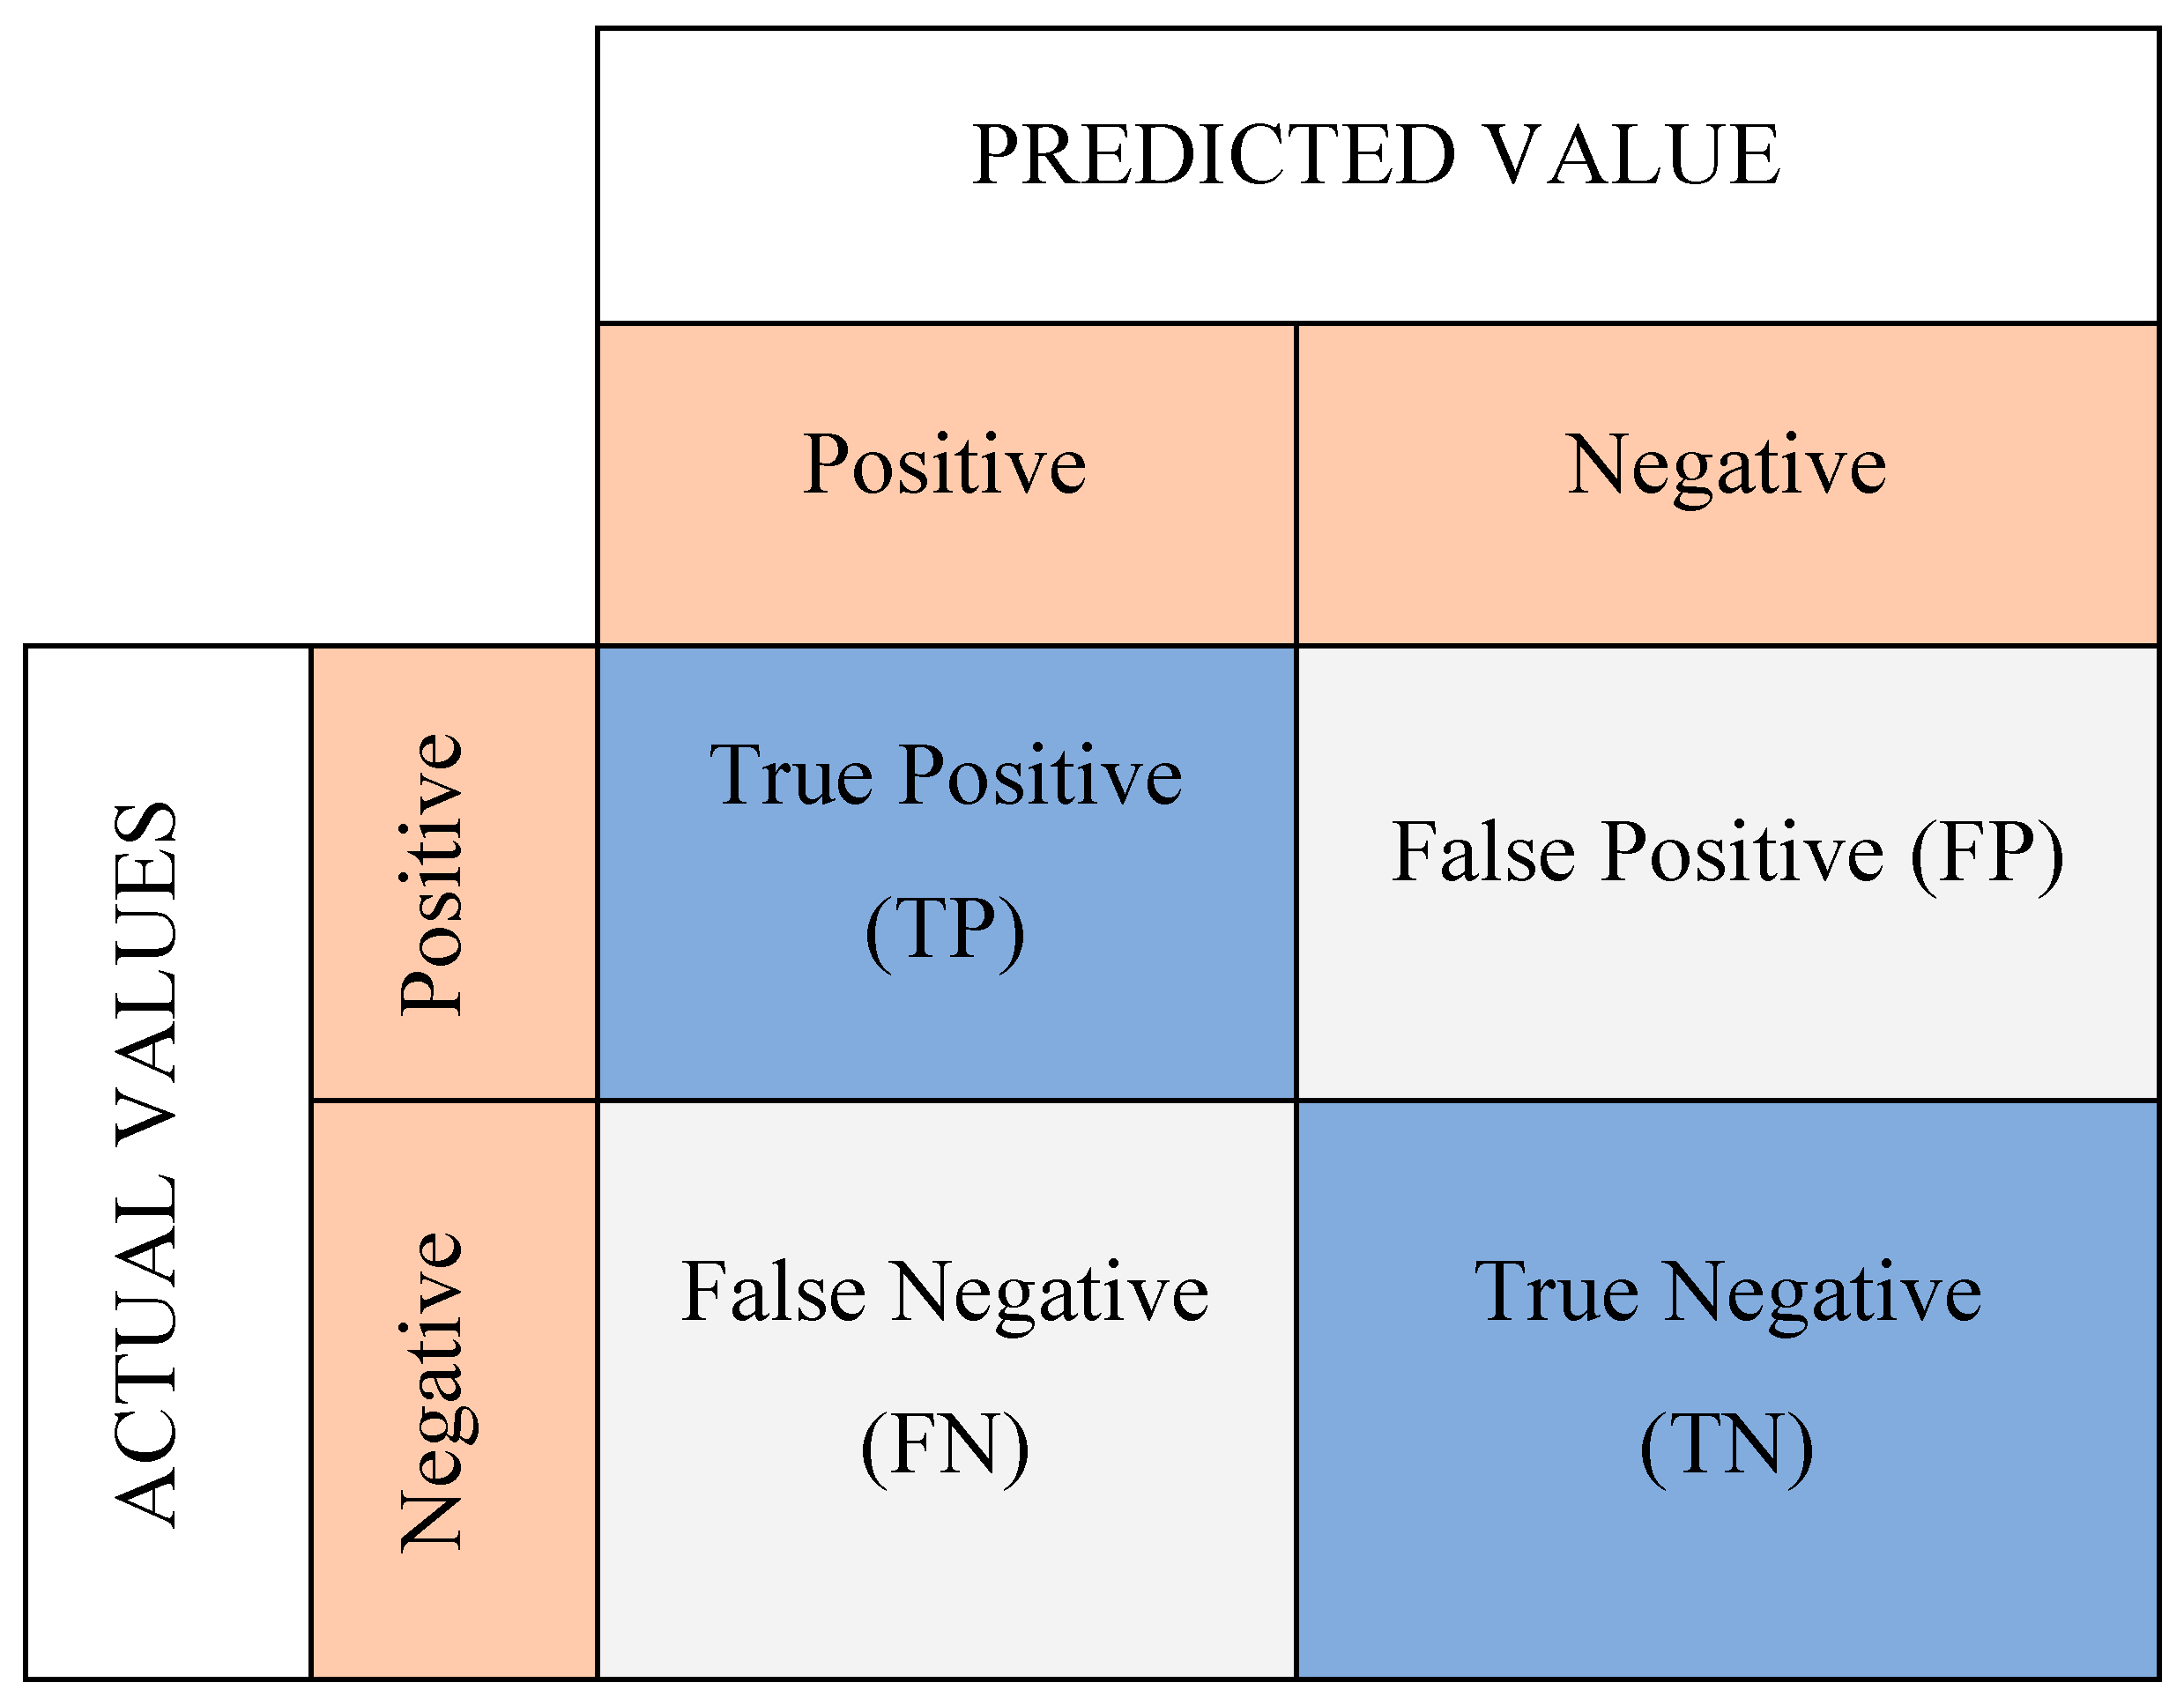
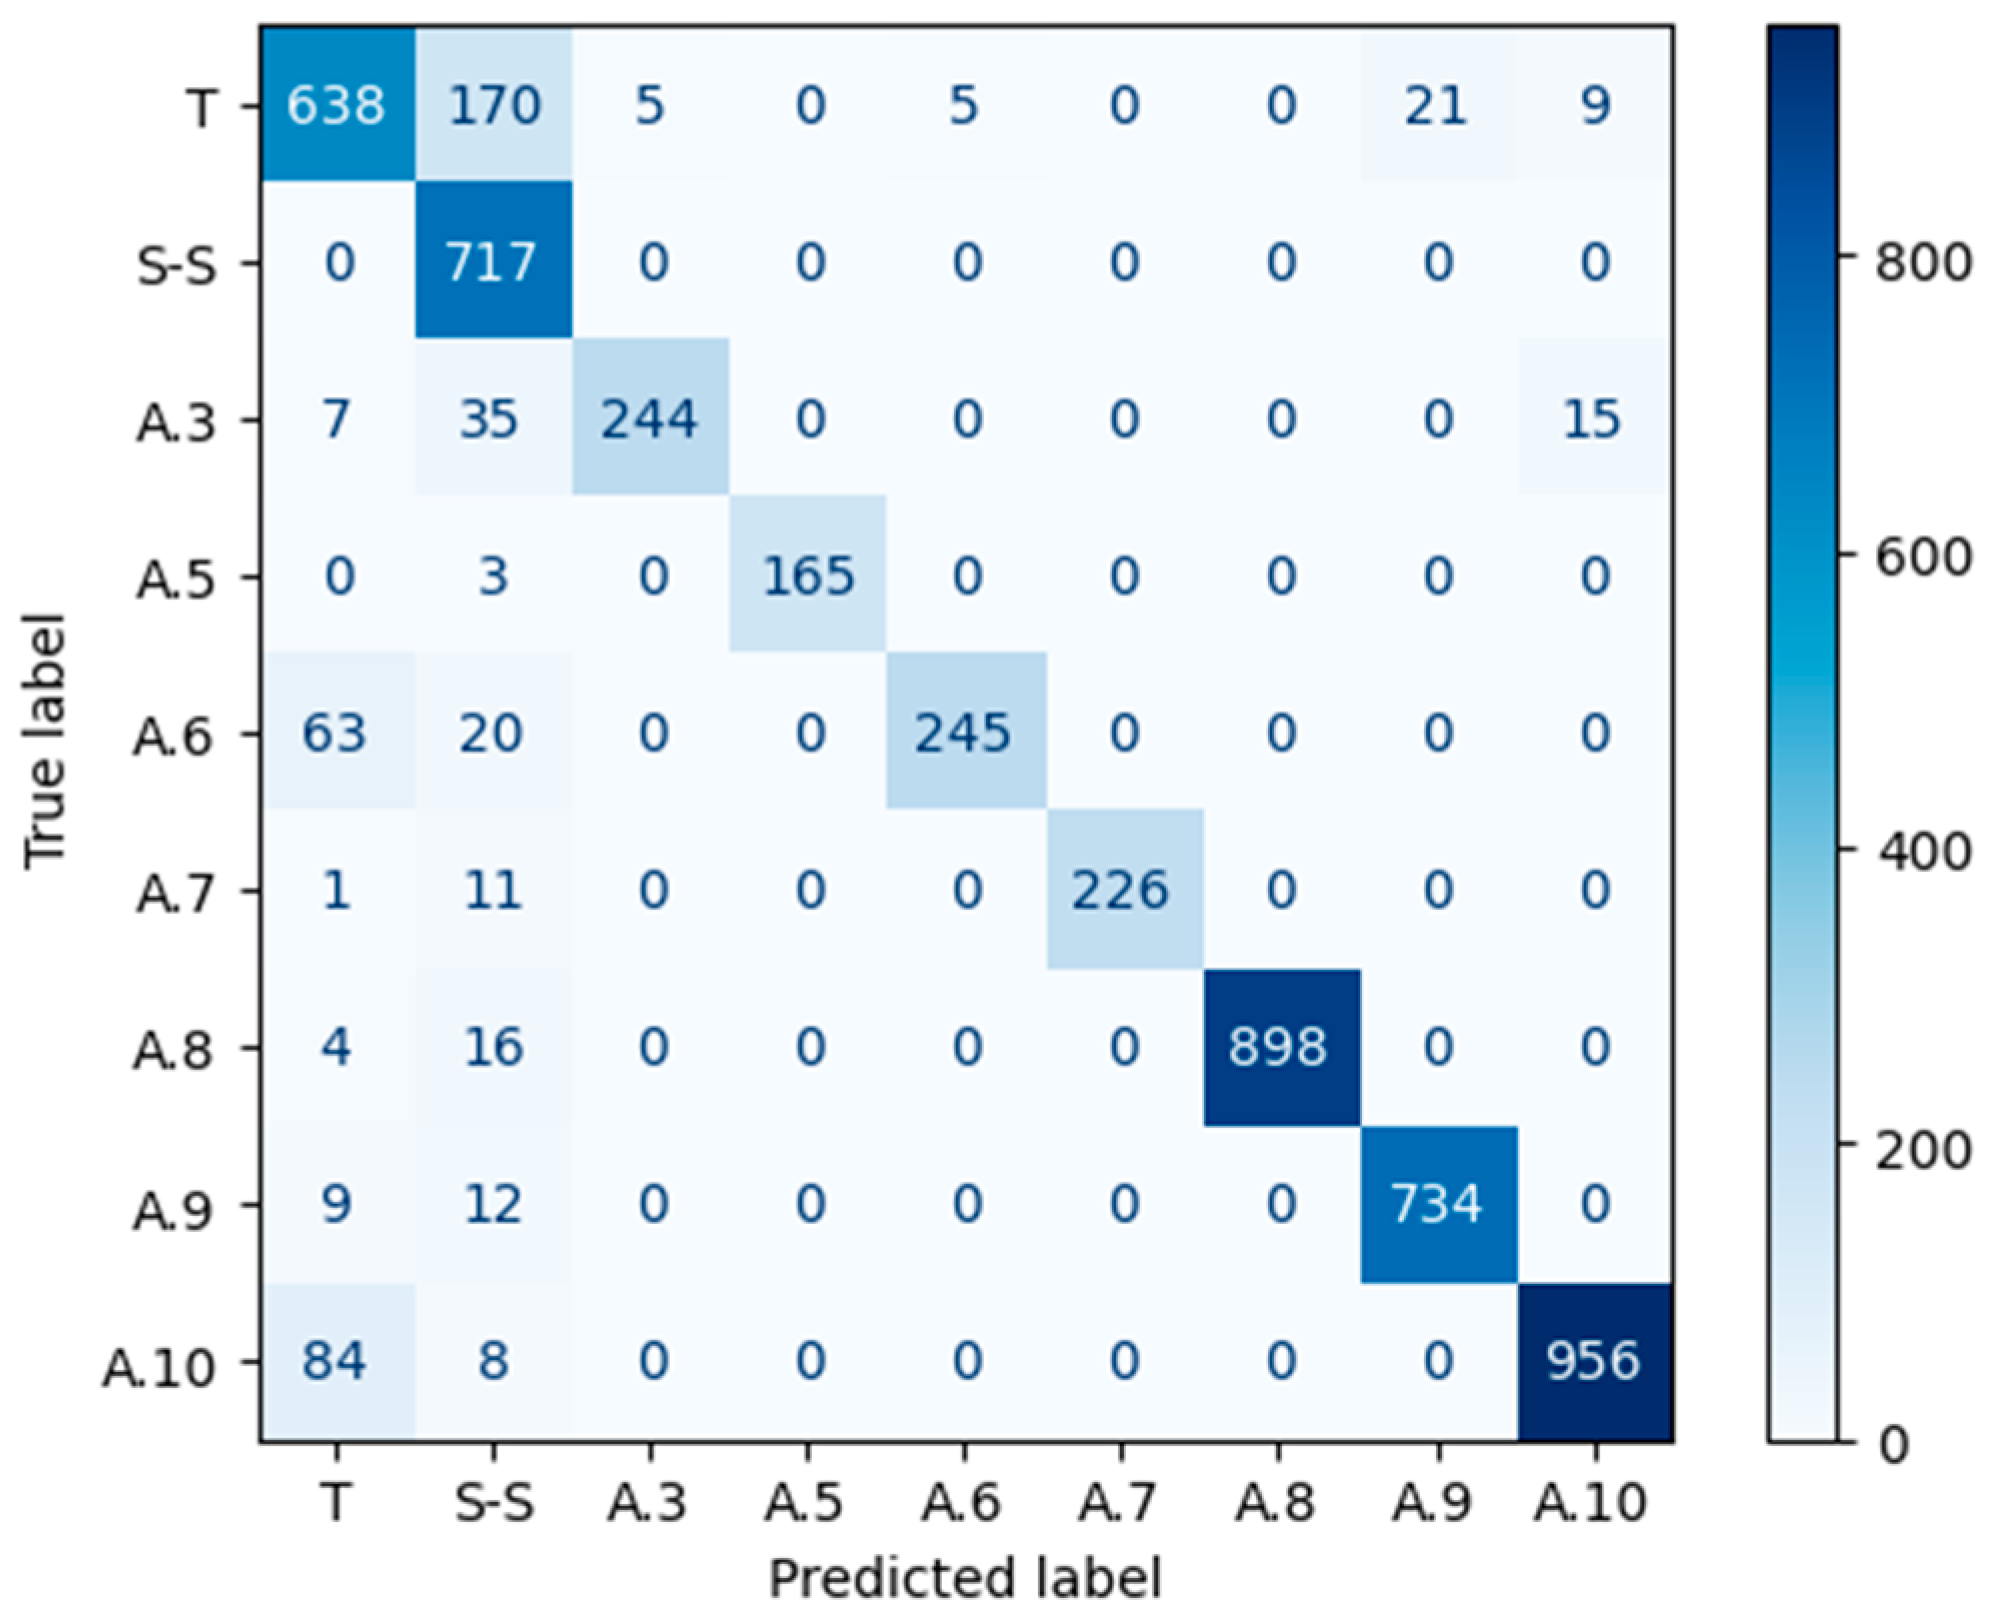
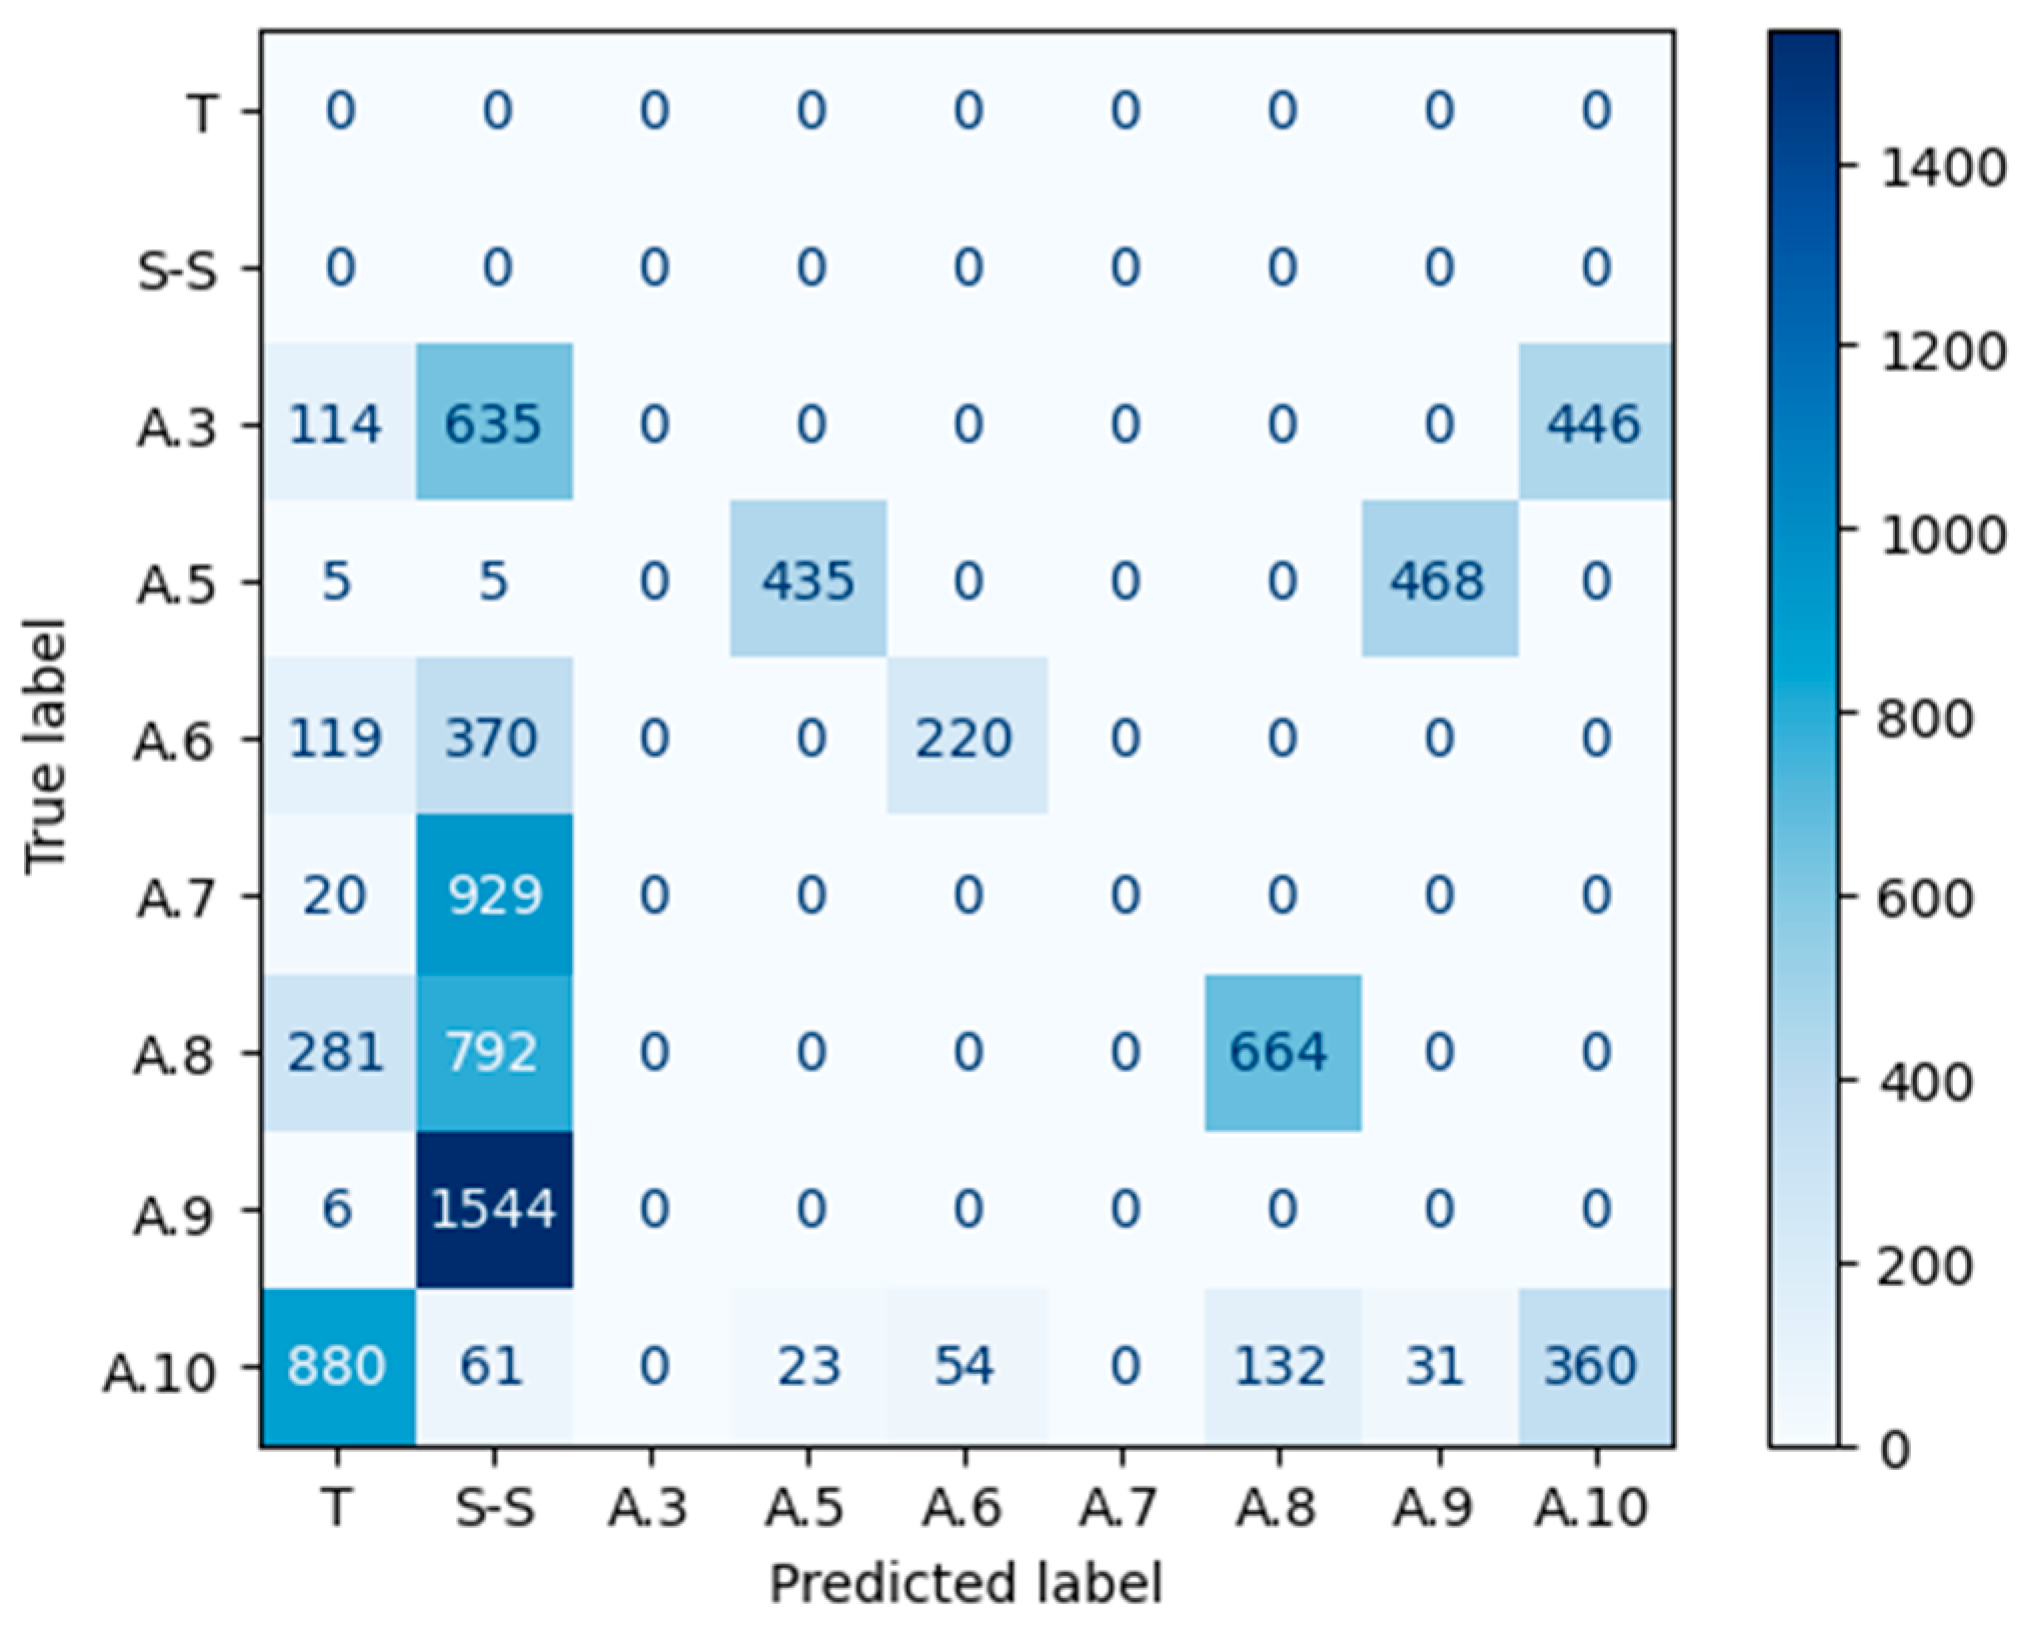
The confusion matrix is another tool to validate the results of the SOM Network [
50]. A confusion matrix is a C × C matrix used to assess the effectiveness of a classification model, where C represents the number of target classes [
51]. The matrix compares the actual goal values to the machine learning model’s predictions (
Figure 6). Thus, this method evaluates a classification model’s performance by computing measures such as accuracy, precision, recall, and F1-score [
34]. The parameters that make up the matrix are:
True positives (TP): the actual value is positive, and the predicted is also positive.
True negatives (TN): the actual value is negative, and the prediction is also negative.
False positives (FP): the actual is negative, but the prediction is positive.
False negatives (FN): the actual is positive, but the prediction is negative.
The following parameters can be exploited to analyse the properties of the confusion matrix:
Accuracy (Equation (22))—is the percentage of samples in the test set that were categorized correctly.
Precision (Equation (23))—out of all the samples, how many belonged to the positive class compared to how many the model projected would.
Recall (Equation (24))—the proportion of samples from the positive class was expected to do so.
F1-Score (Equation (25))—the harmonic mean of the precision and recall scores obtained for the positive class.
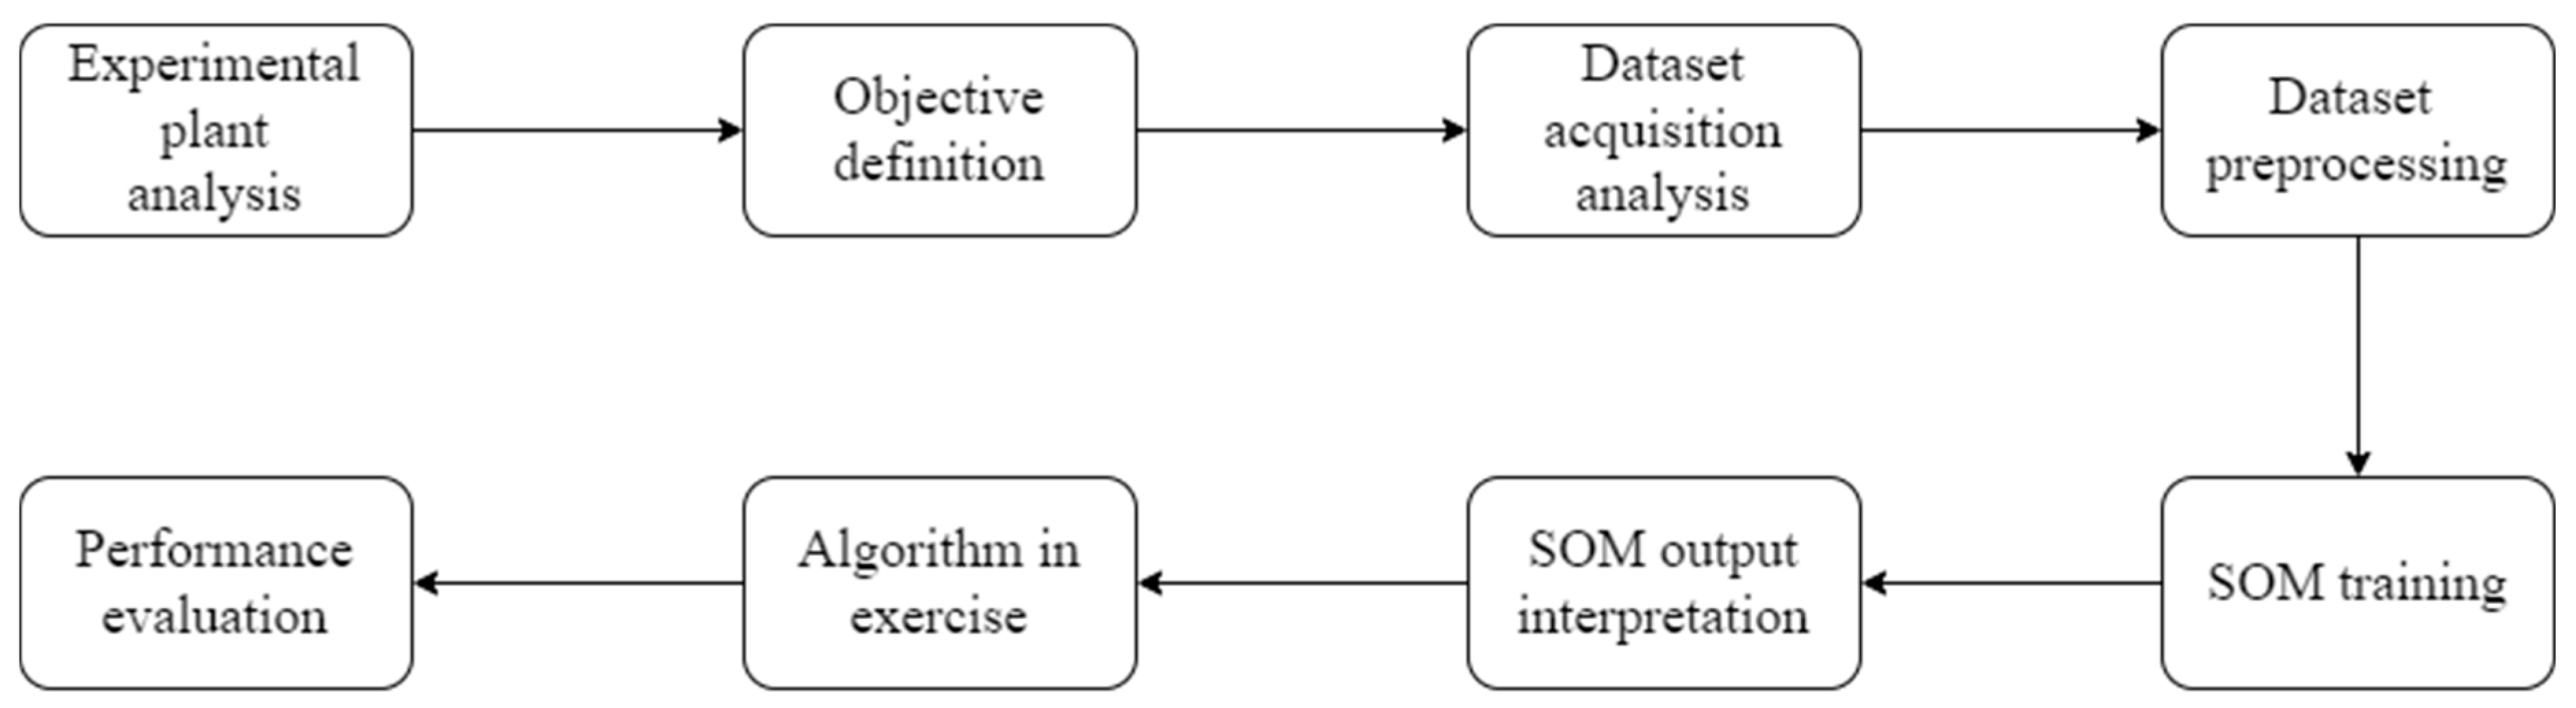
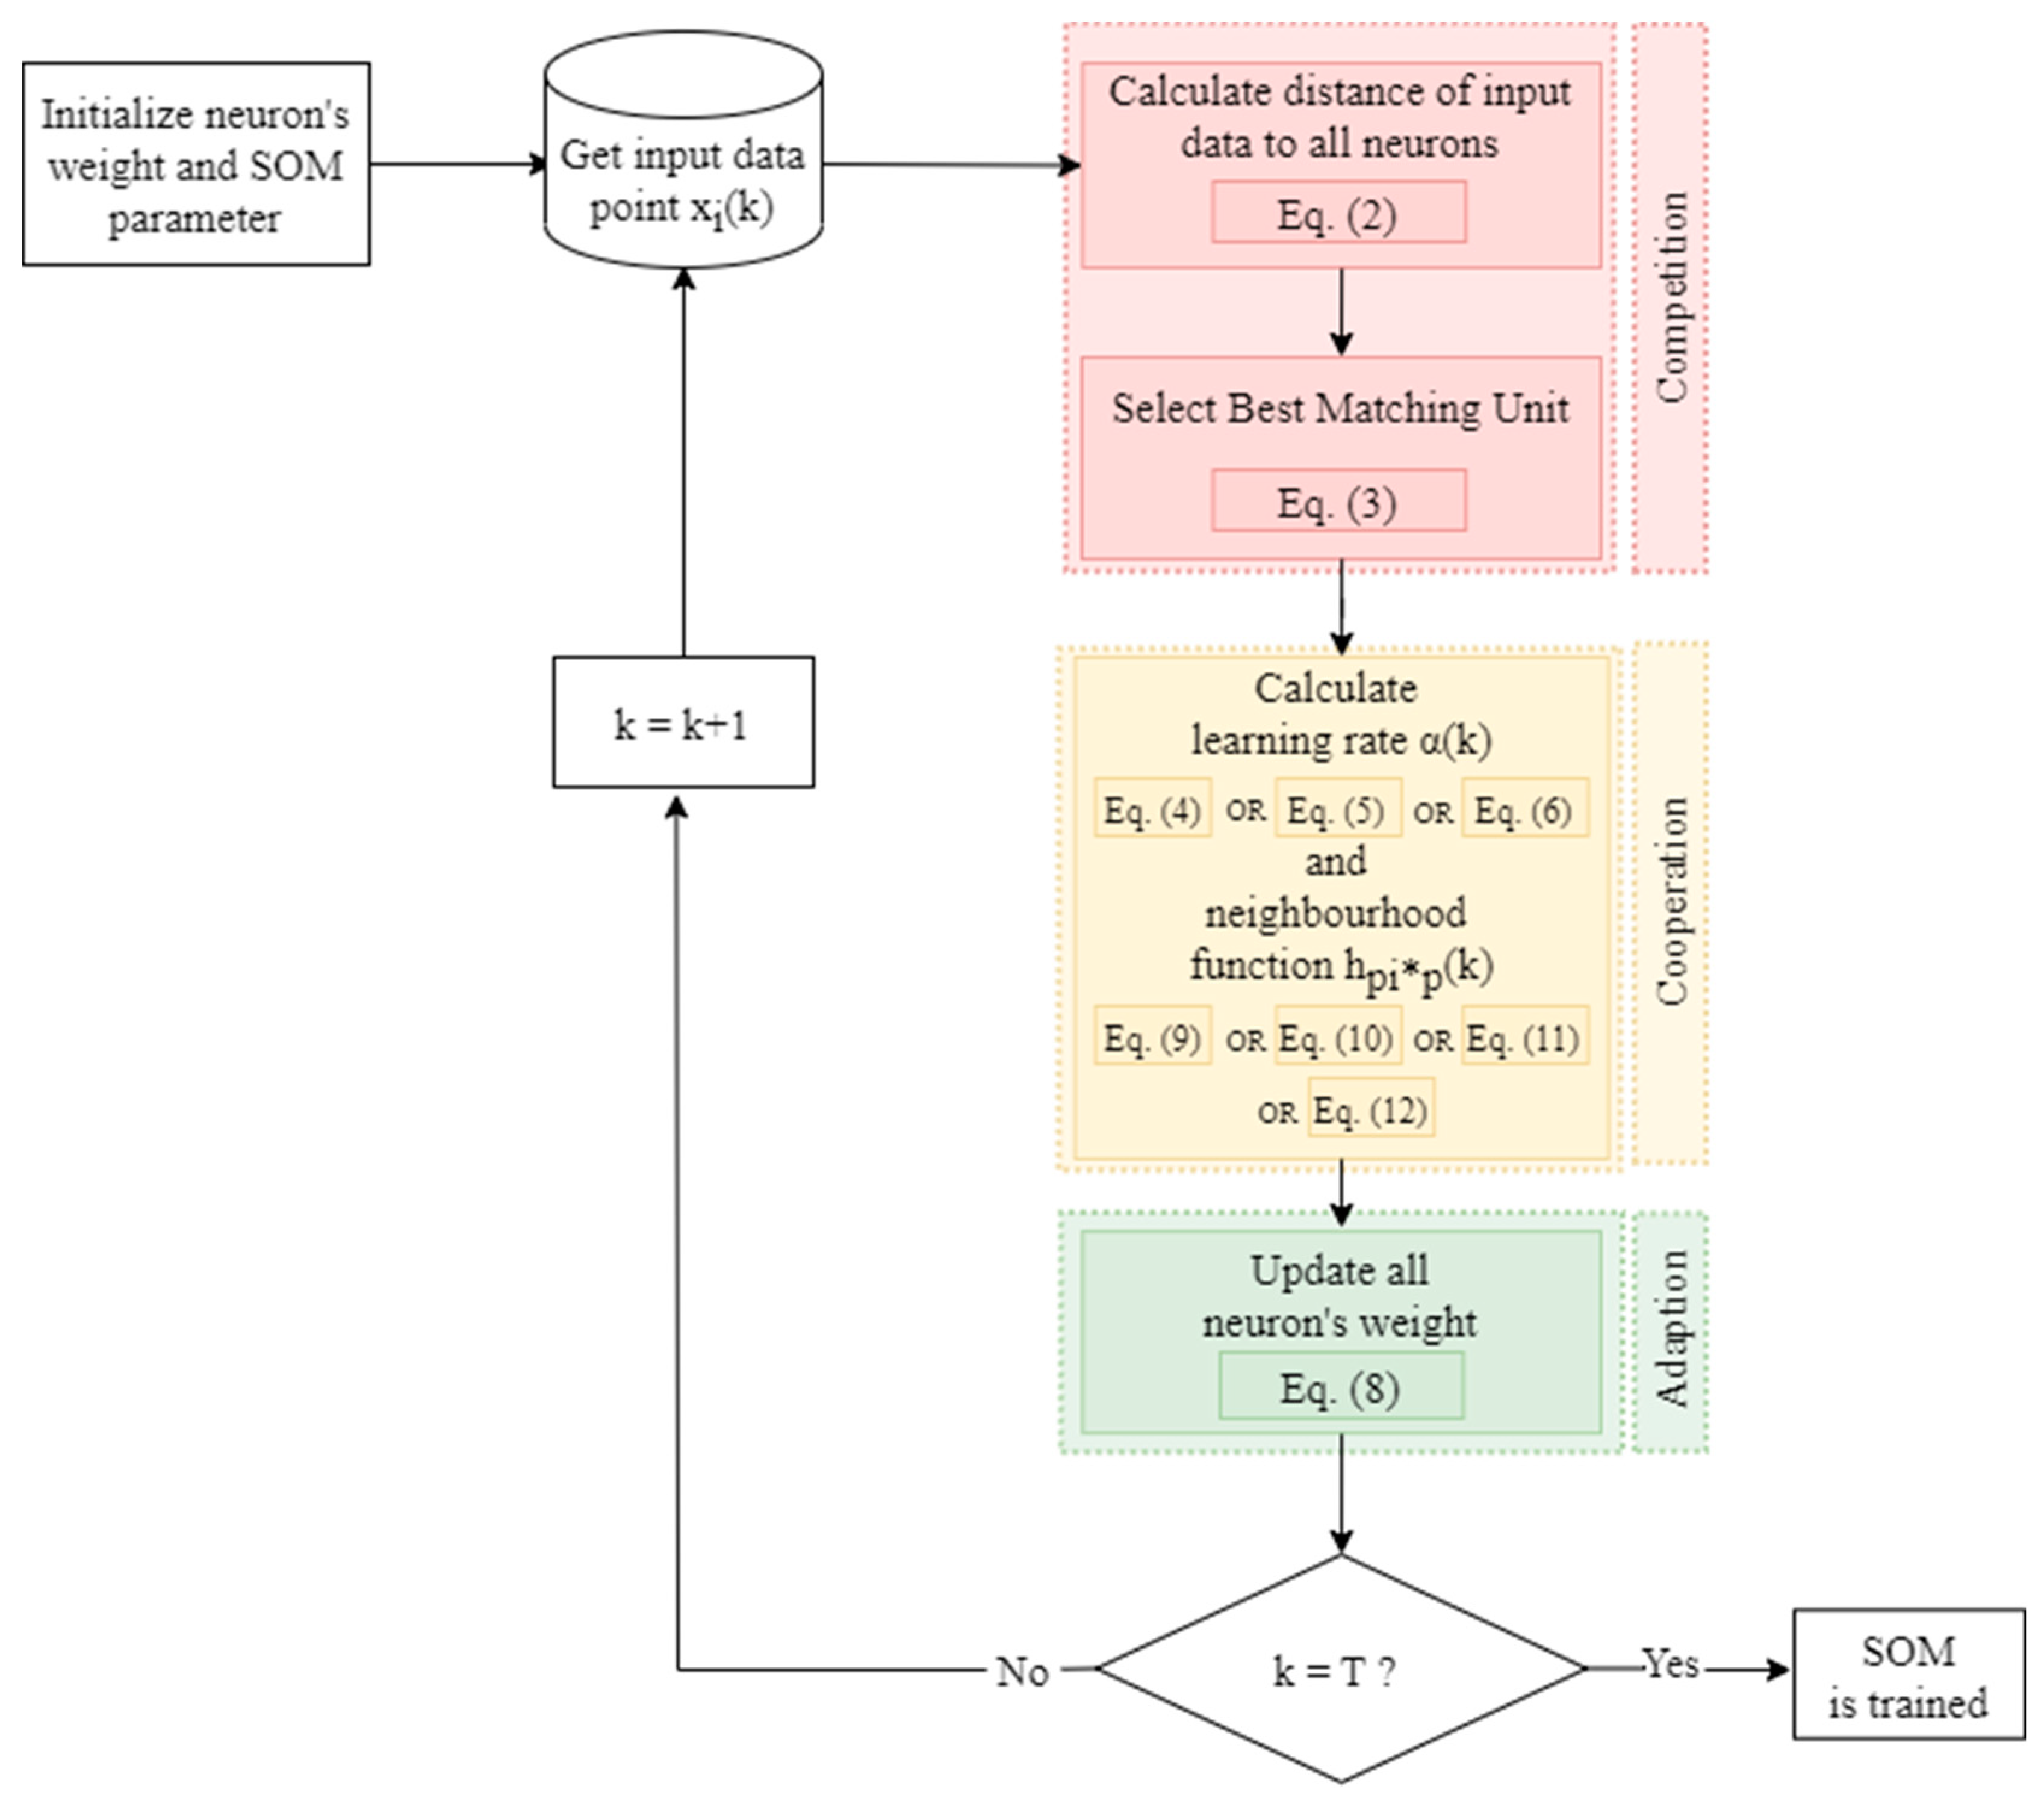
All the steps taken during the SOM algorithm’s training phase are depicted in a flowchart in
Figure 7.


