Abstract
With increasing concerns about urban pollution, electric vehicles (EVs) have offered an alternative mode of transportation that reduces urban pollution levels. Previous studies have sought to identify the various factors influencing EV charging patterns to deploy an appropriate charging infrastructure. However, limited attention has been paid to the investigation of different charging patterns identified in different regions at different phases of the EV program. This study aims to fill this research gap in the literature by developing binary logistic models that account for the factors influencing charging demands in different regions of Korea, i.e., Jeju-do and Gangneung-si. To this end, we collected historical data on EV charging transactions in these study regions and analyzed them to evaluate the difference in charging demands. The developed models suggest that the charging demand varies with charger characteristics and charging time. Moreover, different charging patterns in different regions can be explained by the different travel behaviors of those who use EVs for different trip purposes. These findings provide an important implication suggesting that policymakers should consider a stepwise strategy to construct charging infrastructure at the appropriate scale and configuration, depending on the phase of the EV program.
1. Introduction
With the increase in urban air pollution, electric vehicles (EVs) have offered an alternative mode of transportation that reduces urban pollution levels. The global market share of EVs continues to increase; in 2020, there were 10 million EVs worldwide, with a rapid growth rate in recent years (41% increase in global EV registrations in 2020) [1]. While many researchers see bright prospects for the EV market, others have a different view, indicating that there are some limitations to the continued growth of the EV market. They point out that many people are still reluctant to adopt EVs, and the major obstacles to EV adoption are limited mileage, charging time, high vehicle purchase costs, and insufficient charging infrastructure [2,3]. In particular, the allocation of charging stations at the required location and scale is essential for promoting EVs; therefore, it is essential to understand the travel patterns of EV users for establishing an efficient charging network.
Several studies have focused on understanding the travel behavior of EV users [4,5,6,7]. A major body of research has attempted to investigate the factors that influence EV charging demand at charging stations [8,9,10]. These research efforts have been effective in comprehending EV user charging patterns, suggesting that the charging demand varies with time and space [11,12]. Therefore, the dynamic charging behavior of EV users should be considered to determine the optimal charging locations. Numerous studies conducted in various regions worldwide have accumulated evidence to help understand EV charging patterns. However, limited attention has been paid to the understanding of the heterogeneous charging behavior of EV users in different regions (e.g., a comparative analysis of charging patterns between different regions). A better understanding of the driving factors that influence different charging behaviors across regions can help policymakers construct effective charging infrastructure in regional contexts.
Traditional modeling approaches that attempt to identify the factors influencing EV charging demand can be classified into three broad categories, depending on data availability: (1) statistical modeling based on stated or revealed preference surveys [13,14,15,16,17], (2) theoretical or mathematical simulation modeling [18,19,20,21], and (3) data-driven statistical or machine learning modeling [12,22,23]. Early studies generally adopted a survey-based statistical modeling approach to estimate the charging demand based on reported survey responses. This approach has been effective in identifying the socioeconomic and built-environment factors that affect EV users’ travel behaviors and the consequent charging demand. However, these studies have some limitations, as they relied on survey data based on EV use in hypothetical situations (especially in the stated preference survey), or the surveys typically relied on relatively small sample sizes because of cost and time constraints, which may not reflect the behaviors of the overall population in the study region. Theoretical or mathematical simulation modeling has been effective in investigating EV charging trends under various scenarios; however, the modeling methodologies proposed in the studies have not been fully validated under real-world conditions. Recent studies have attempted to model EV charging demand based on actual charging history data. This modeling approach was able to represent the actual charging patterns and overall showed a good performance in identifying the spatial and temporal variability of charging demand in the study regions. However, the empirical research results accumulated through the data-driven modeling approach are still insufficient, and this approach has limitations in identifying the various factors affecting the charging demand owing to difficulties in collecting related datasets.
This study aims to fill this research gap in the literature by adopting a data-driven modeling approach that accounts for the factors influencing EV charging demand. To this end, we analyzed the historical data of the EV charging transactions of each EV charger at stations in Korea. Subsequently, we developed statistical models that account for the charging demand along with the influencing factors that explain the charging demand. We developed models for two study regions at different phases of the EV program: Jeju-do (maturity phase of the EV program) and Gangneung-si (early phase of the EV program), in Korea (Figure 1a). We also conducted a comparative analysis of the modeling results to identify different charging patterns in the study regions to understand the heterogeneous charging behaviors in regions at different phases of EV programs.
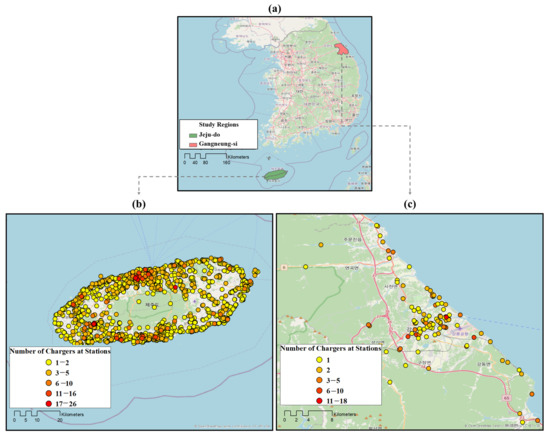
Figure 1.
Geographical distribution of the EV charging stations in the study regions: (a) study areas; (b) stations in Jeju-do; (c) stations in Gangneung-si.
2. Study Areas
The national and local governments in Korea have implemented various policies, e.g., EV purchase incentives, construction of charging infrastructure, free parking, and designated parking spaces for EVs, to promote EVs, resulting in a rapid increase in domestic EV registration (88.1% of annual growth rate, with 2775 EVs registered in 2014 and 231,443 in 2021) [24]. In particular, some regions in Korea, such as Seoul and Jeju-do, are exemplars of successful cases that have promoted EVs with the local government’s massive investments in constructing EV charging infrastructure. In Jeju-do, a total of 1821 charging stations have been installed (including 1672 slow-charging stations and 149 fast-charging stations), and the density of charging stations is estimated to be approximately 0.984 stations/km2 (1821 stations in the Jeju-do area of 1849 km2) (Figure 1b). The density of EV charging stations in Jeju-do is the highest among the regions in Korea. The Jeju-do government’s massive investment in constructing charging infrastructure appears to encourage EV adoption. In 2018, the number of EVs sold in Jeju-do (7185 EVs) accounted for 22.6% of the total domestic sales (31,696 EVs), which is a significantly high rate considering that the population of Jeju-do (around 700 thousand) accounts for only 1.3% of the total population of Korea (around 51.7 million).
EV penetration is relatively low in Korea, except for some successful regions. For example, Gangneung-si, a relatively small city in Korea (with a population of approximately 210,000), is lagging behind in the EV program, compared with other regions. Investments in the construction of charging infrastructure in Gangneung-si also appear to lag behind some successful regions. As of 2021, the density of charging stations in Gangneung-si is only 0.123 stations/km2 (114 slow-charging stations and 14 fast-charging stations; the city area is 1040 km2) (Figure 1c). The low investment in charging infrastructure appears to have led to a low EV penetration rate in Gangneung-si. Unfortunately, information on the number of EVs sold in Gangneung-si has not been reported; however, it is estimated that EV sales in Gangneung-si are significantly lower than those in successful regions in Korea. Gangneugn-si recently announced plans to promote EVs, including EV purchase subsidies and expansion of EV charging infrastructure. However, some obstacles to the promotion of EVs still exist, primarily because of the insufficient budget. Therefore, a strategy for constructing efficient charging infrastructure is required for small cities; in other words, the lessons learned from successful regions may help small cities identify optimal charging locations to cost-effectively construct charging infrastructure. To this end, Jeju-do (maturity phase of the EV program) and Gangneung-si (early phase of the EV program) were selected as case studies, and a comparative analysis of the charging demand in these regions was conducted to investigate the factors driving different charging patterns by region.
3. Methodology
3.1. Data
In this study, we collected the charging transaction data of each EV charger in the study area by utilizing Python web scraping techniques that access the EV charging station information inquiry services managed by the Korea Environment Corporation (KEC) [25]. More specifically, the research team accessed the KEC database via the KEC application program interface (API) to determine whether EVs occupy any EV chargers for charging in the study regions when the data query is executed. Data queries were performed every 30 min for a week from noon on 5 April to noon on 12 April 2021. In this study, April was selected as the study period for data collection because it is believed that April is the month in which normal travel patterns are observed in Korea (not affected by seasonal peaks such as vacations). In this study, it was assumed that a charger would be occupied for charging EVs within 30 min between consecutive inquiry times. It is worth noting that this assumption may lead to a bias, as the EVs could leave earlier than 30 min. However, we decided to adopt a 30 min data query strategy to avoid overloading KEC’s API system by requesting too many queries. The charging status data were aggregated to generate the overall occupancy rate for each charger during the study week, which was calculated by dividing the total time occupied by EVs by the total time during the study week (Table 1).

Table 1.
Frequency of the considered variables and average EV charger occupancy rates.
We also collected information on the characteristics of each charger, such as the facility type, charger type, and type of parking (free/paid). Table 1 summarizes the characteristics of the variables considered. Table 1 shows that the composition of the facility types where chargers are installed has both similarities and differences depending on the study region. In both study regions, a large proportion of chargers were installed in tourism facilities (29.8% in Jeju-do and 36.7% in Gangneung-si) and accommodations (15.2% in Jeju-do and 10.2% in Gangneung-si). It should be noted that both study regions are among the most famous tourist destinations in Korea, and it seems that local governments strategically placed chargers at these facilities for the convenience of tourists using EVs. Meanwhile, when comparing the composition of chargers by facility type, it was found that chargers in Jeju-do tended to be evenly distributed in various facilities, whereas chargers in Gangneung-si tended to be installed intensively in particular facilities (e.g., tourism, public, and accommodation facilities). In terms of the charger type, a dominant portion of chargers was attributed to slow chargers in both study regions (approximately 90% of all chargers). In addition, chargers were strategically installed in free parking facilities for the convenience of EV users in both study regions (around 80% of chargers).
Table 1 also shows the calculated charger occupancy rate, which is the percentage of time that a charger is occupied by EVs for charging out of the total time (the column named “average charger occupancy rates”). In this study, the occupancy rate was considered to be an indicator of the charger being actively used for charging. Table 1 shows that chargers in Jeju-do were more actively used than in Gangneung-si (the average charger occupancy rates were 8.5% and 7.0% in Jeju-do and Gangneung-si, respectively). The results also indicated that the occupancy rates varied by study region and charger characteristics over the selected study period. Overall, government offices were the facilities where chargers were actively used for charging. This is in line with the expectation that the local governments in Korea would replace government vehicles with EVs, and government EVs are generally charged at government offices. Table 1 also shows that tourism facilities were favorable sites for charging in both study regions, suggesting that EVs were actively used for tourism. Interestingly, the chargers located in neighborhood facilities in Jeju-do were actively used; it is conjectured that as Jeju-do entered the maturity phase of the EV program, EVs became widely used for general daily activities (not only for tourism or the government’s business activities).
Figure 2 shows that the charging demand (in our study, occupancy rates) varied depending on the charging time. In particular, the charging demand in Gangneung-si was concentrated around night times, whereas the charging demand in Jeju-do was evenly distributed throughout the time and day of the week. In Gangneung-si, EVs are widely used for tourism, i.e., visitors tend to visit Gangneung-si on weekends. Accordingly, the charging demand appeared to be high on weekends and at night. The trend of charging demand in Jeju-do can be interpreted as EVs being widely used for various travel purposes, including household activities, tourism, and business.
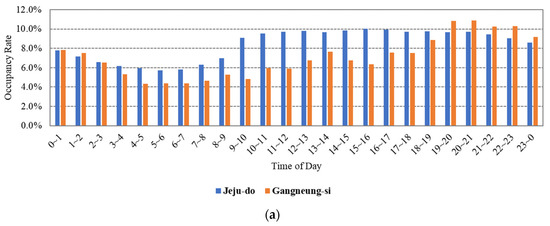
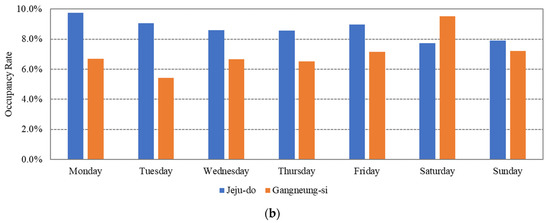
Figure 2.
Distribution of the average charging demand by time and region: (a) charging demand by time of day; (b) charging demand by day of the week.
3.2. Statistical Models
In this study, binary logistic regression models were developed to identify the factors influencing the charging demand for EV chargers. Herein, the dependent variable (charging demand) is a binary variable, with a value of one if a charger is occupied by an EV for charging at the time of data inquiry and zero if otherwise. The dependent variable was chosen to estimate the probability of a charging demand occurring at a specific time and in a specific region. We used several explanatory variables related to the characteristics of each charger to describe the probability of charging.
The typical form of the binary logistic model, with a latent variable Y indicating the level of underlying utility, can be expressed as [26]
where is a vector of explanatory variables, is an intercept, β is a vector of coefficients, and ∊ is the error term, which is assumed to be a standard logistic cumulative distribution function. The probability of the dependent variable Y at is
In this study, two binary logistic regression models were separately developed for Jeju-do and Gangneung-si, by using R statistical analysis program [27], and the beta coefficients for the study regions were compared to investigate whether the beta coefficients for the same variable were significantly different from each other. Statistical significance was calculated using the following formula [28,29]:
where SEβ1 and SEβ2 are the standard errors of coefficient of the Jeju-do model (β1) and the Gangneung-si model (β2).
3.3. Explanatory Variables
The explanatory variables considered in this study fell into two categories: charger characteristics and time-dependent variables. The variables for charger characteristics included the charger type, type of parking, and facility type. The charger-type variable was used to distinguish whether a charger was fast or slow; the variable for free parking was also considered in the models to investigate whether free parking affected the charging demand. Finally, the variable for facility type, where the charger was installed, was included in the models. In this study, facilities were classified into eight categories considering the statistical significance of the estimated coefficients. The classified facility types included “government offices”, “public facilities”, “commercial facilities”, “accommodations”, “tourist facilities”, “neighborhood facilities”, “parking facilities”, and “private offices.” The time-dependent variables were also included in the model. First, the variable for the day of the week was included in the models, with “Sunday” as the reference variable. Second, the variables for the time of day were included in the models. Through a trial-and-error process to obtain the statistical significance of the estimated coefficients, we classified the time of the day into four categories: “morning (6:00 a.m. to 10:59 a.m.)”, “noon (11:00 a.m. to 4:59 p.m.)”, “evening (5:00 p.m. to 10:59 p.m.)”, and “night (11:00 p.m. to 5:59 a.m.)”.
4. Results
4.1. Model Results
Two binary logistic regression models were developed, and the results are shown in Table 2. The goodness of fit of the models shows that the data fit well in the models, as the log-likelihood ratio test statistics were statistically significant at the 1% level for both models. Most of the variables were statistically significant at the 1% level, with the expected signs. The estimated Z-scores indicated significant differences in the estimated coefficients of the same variables for the two study regions, suggesting that the charging demand patterns differed between the study regions. The coefficient of the intercept for the Jeju-do model was significantly higher than that of the Gangneung-si model (the Z-score was significant at the level of 0.01), implying that, overall, the charging demand was higher in Jeju-do than in Gangneung-si.
Table 2.
Logistic regression model results.
The results show that charger characteristics are correlated with the charging demand. The charging demand tended to be higher in facilities with free parking, which was consistent with our expectations. However, the signs of the estimated coefficients for the charger-type variables (whether fast or slow chargers) were not consistent with our expectation that fast chargers would be more actively used for charging. The negative signs of the “charger type” variable indicated that the charging demand tended to be higher on slow chargers than on fast chargers. It is conjectured that as the charging speed of slow chargers is generally slower than that of fast chargers, it is more likely that EVs occupy slow chargers for a longer charging period. However, this can lead to a misunderstanding of the underlying charging patterns; therefore, future research may need to consider not only the occupancy rate (as in this study) but also the number of EVs occupying a charger for charging.
The facility type was also closely associated with the charging demand. Overall, the charging demand was higher in facilities other than private offices (the signs of most coefficients were positive compared with the reference variable “private offices”). More specifically, the charging demand in government offices was significantly higher in both study regions. This may be attributed to the aforementioned fact that the Korean government has replaced government vehicles with EVs. The charging demand for public facilities was also found to be high in both study regions. This may be because public facilities in Korea are generally located in places that have good accessibility and are open to the public; therefore, people are more likely to charge their EVs in public facilities for convenience. The charging demand for tourist facilities and accommodations in Gangneung-si was significantly high. As mentioned earlier, Gangneung-si is a popular tourist destination in Korea, and the strategic deployment of chargers along tourist routes appears to have a positive effect in encouraging EV use for tourism, thereby increasing the charging demand in these facilities. In contrast, no such effect was found in Jeju-do (note that Jeju-do is also one of the popular tourist destinations in Korea). The coefficient values for the variables “tourist facilities” and “accommodations” for the Jeju-do model were not as high as those for the Gangneung-si model. This indicates that, in the maturity phase of the EV program, EVs appear to be used not only for tourism but also for trip purposes in Jeju-do.
The results also suggest that the charging demand varies depending on the charging time. Specifically, from Monday to Wednesday and on Friday, the charging demand in Jeju-do was higher than during any other day of the week, whereas the charging demand in Gangneung-si was particularly higher on weekends. This may be partly explained by the different travel behaviors of the study regions. As mentioned above, EVs are used for various activities in Jeju-do, whereas they are mainly used for tourism in Gangneung-si. Accordingly, the charging demand in Gangneung-si is more likely to be generated on weekends by those who visit Gangneung-si for tourism, whereas the charging demand in Jeju-do may be generated by general EV users operating EVs for various activities. In terms of the time of day, the charging demand was high between noon and evening in both study regions, and the charging demand in Gangneung-si tended to be concentrated in the evening. This appears to be in line with the above interpretations that the charging demand in Gangneung-si is mainly generated by the tourists who visit Gangneung-si for tourism using EVs; thus, the consequent charging demand may be generated in the evening after the daytime tours.
4.2. Discussion
The model results suggest that the charging demand varies with the geographic locations of the chargers and charging time. These findings are similar to those reported in [30]. Specifically, the model results imply that the charging demand tends to be concentrated at a specific time and place. The findings suggest that policymakers should understand the dynamic charging patterns in regional contexts and appropriately manage the charging demand. For example, regions with tourist destinations such as Gangneung-si may consider installing chargers at tourist facilities and accommodations to accommodate the intensive charging demands in these facilities. In a region where the EV program is in a maturity phase, such as Jeju-do, it is necessary to consider expanding the charging network throughout the region to accommodate the dynamic charging demand generated by those who use EVs for various activities.
This study provides crucial findings and suggestions for the success of EV programs. First, we identified several factors influencing the charging demand; for example, the charging demand was associated with various charger characteristics. It is also suggested that policymakers consider implementing proper policy measures (e.g., providing free parking, determining the appropriate charger type between slow and fast chargers considering the temporal and geographic charging demand, and determining proper facilities where chargers need to be installed). Second, this study found that the temporal and geographic charging demands varied with the phases of the EV program; for example, it was found that charging patterns were different between different regions in different phases of the EV program (e.g., Gangneung-si, where the EV program is in the early phase, vs. Jeju-do, where the EV program is in the maturity phase). In the early phase of the EV program, the charging demand tends to be produced by specific activities (e.g., tourism), leading to a concentration of charging demand at a specific time and place. However, in the maturity phase of the EV program, the charging demand tends to be distributed over time and place, as EVs are used for a variety of activities. These findings provide an important implication that policymakers should consider a stepwise strategy to construct charging infrastructure at the appropriate scale and configuration, depending on the phase of the EV program.
5. Conclusions
This study attempted to identify the factors influencing the EV charging demand. To this end, charging status data for each charger installed in two study regions, Jeju-do and Gangneung-si, Korea, were collected. Jeju-do is considered a successful case that promoted the use of EVs by investing heavily in constructing expanded charging infrastructure, whereas Gangneung-si is in a relatively early phase of the EV program. The focus of this study was to investigate the difference in charging patterns between regions within different phases of the EV program; therefore, we analyzed and compared the different charging patterns between these regions.
Through descriptive statistical analysis of the collected charging data, this study revealed that the charging demand varied with charger characteristics over the selected study period. For example, the charging demand tended to be high in some facilities, such as government offices, because of their accessibility to the public. The results also showed that the charging demand for tourist facilities and accommodations tended to be high, particularly in regions with tourist attractions such as Gangneung-si. In addition, free parking appeared to attract more EV users to charge. Moreover, the charging demand was found to vary with the charging time. For example, the charging demand tended to be high between noon and evening in both study regions, and the charging demand was particularly high on weekends in Gangneung-si, potentially owing to the use of EVs for tourism.
In this study, two binary logistic regression models were developed to identify the factors influencing the charging demand with a number of explanatory variables for charger characteristics and charging time. In terms of charger characteristics, people were more likely to charge their EVs at facilities with free parking. The facility type was another important factor influencing the charging demand, showing that the charging demand was high in some facilities such as government offices, where government EVs are operated, and public facilities with good accessibility to the public. The charging demand for tourist facilities and accommodations tended to be high, particularly in Gangneung-si, potentially owing to the use of EVs for tourism. The model results also suggested that the charging demand varied with the charging time. Specifically, the charging demand in Jeju-do was high on weekdays, whereas in Gangneung-si, it was high on weekends. The difference in the charging patterns between these regions may be attributed to the different travel behaviors in them. It is conjectured that EVs are mainly used for tourism in Gangneung-si, whereas EVs are used for a variety of activities in Jeju-do.
This study is expected to add distinctive and comparative findings to the literature, providing a better understanding of EV charging behavior in different regions in different phases of EV programs. Specifically, the Z-score-based comparative analysis was effective in capturing different charging patterns from region to region, and this analytic approach is unique in the field of EV research. The findings of this study provide a meaningful policy implication that the charging demand may be concentrated at a specific time and in specific regions, suggesting that policymakers should implement proper measures to manage the dynamic charging demand. Specifically, the results of this study are expected to improve the understanding of temporal and spatial dynamic charging demand patterns, suggesting that it is necessary to adapt charging infrastructure to charging demands, by identifying the optimal charging locations, determining the appropriate charging equipment, and developing effective strategies for each phase of EV program.
Admittedly, this study has some limitations. We considered the charging demand in terms of the percentage of time that chargers are occupied by EVs for charging, and this approach fails to capture the charging demand in terms of the number of EVs that use the chargers for charging, which makes it difficult to explain the underlying charging behavior. This calls for further research that considers both the number of EVs using chargers and charging occupation time. Advanced data processing for charging transaction data by analyzing the duration of charging sessions can also help to better understand heterogeneous EV users’ charging patterns (e.g., charge point hogging). In addition, the generalization of charging trends solely based on the charging transaction data for a week in April is somewhat weak, which makes it difficult to capture variations in charging demands over time (e.g., daily, seasonal). This requires future research to collect long-term charging demand data to better understand charging demand patterns over time. In terms of the modeling approach, more sophisticated methodologies such as a random parameter or hierarchical modeling approach would be useful for exploring the heterogeneity of EV charging demands with respect to facility characteristics, time, and region. Of course, exploring additional explanatory variables (e.g., the socioeconomic characteristics of EV users) not considered in this study would be helpful for providing insights into the nature of travel behaviors using EVs and their impact on charging behavior.
Author Contributions
Methodology, D.K. (Doyun Kwon); Validation, J.H.; Formal analysis, D.K. (Daejin Kim); Investigation, S.M.L. and S.E.; Writing—original draft, D.K. (Daejin Kim); Writing—review and editing, W.S. All authors have read and agreed to the published version of the manuscript.
Funding
This study was partly supported by 2021 Academic Research Support Program in Gangneung-Wonju National University, partly by INHA UNIVERSITY Research Grant, and partly by the grants (Grant Nos. NRF-2022R1G1A1003881, NRF-2020R1A2C1011060, and NRF-2022K1A3A1A09078712 Data4Transport—Harnessing Big data to improve intersection traffic operation in urban cities) funded by the Korean government.
Institutional Review Board Statement
Not applicable.
Informed Consent Statement
Not applicable.
Data Availability Statement
Data available on request.
Conflicts of Interest
The authors declare no potential conflict of interest with respect to the research, authorship, and/or publication of this article.
References
- International Energy Agency. Global EV Outlook 2021. Available online: https://www.iea.org/reports/global-ev-outlook-2021 (accessed on 3 August 2021).
- Rastogi, A.; Thomas, R.G.; Digalwar, A.K. Identification and analysis of social factors responsible for adoption of electric vehicles in India. Curr. Sci. 2021, 121, 1180. [Google Scholar] [CrossRef]
- Coffman, M.; Bernstein, P.; Wee, S. Electric vehicles revisited: A review of factors that affect adoption. Transp. Rev. 2017, 37, 79–93. [Google Scholar] [CrossRef]
- Hardman, S.; Jenn, A.; Tal, G.; Axsen, J.; Beard, G.; Daina, N.; Figenbaum, E.; Jakobsson, N.; Jochem, P.; Kinnear, N.; et al. A review of consumer preferences of and interactions with electric vehicle charging infrastructure. Transp. Res. Part D Transp. Environ. 2018, 62, 508–523. [Google Scholar] [CrossRef]
- Axsen, J.; Bailey, J.; Castro, M.A. Preference and lifestyle heterogeneity among potential plug-in electric vehicle buyers. Energy Econ. 2015, 50, 190–201. [Google Scholar] [CrossRef]
- Vongurai, R. Factors affecting customer brand preference toward electric vehicle in Bangkok, Thailand. J. Asian Financ. Econ. Bus. 2020, 7, 383–393. [Google Scholar] [CrossRef]
- Ling, Z.; Cherry, C.R.; Wen, Y. Determining the Factors That Influence Electric Vehicle Adoption: A Stated Preference Survey Study in Beijing, China. Sustainability 2021, 13, 11719. [Google Scholar] [CrossRef]
- van der Kam, M.; van Sark, W.; Alkemade, F. Multiple roads ahead: How charging behavior can guide charging infrastructure roll-out policy. Transp. Res. Part D Transp. Environ. 2020, 85, 102452. [Google Scholar] [CrossRef]
- Sadeghianpourhamami, N.; Refa, N.; Strobbe, M.; Develder, C. Quantitive analysis of electric vehicle flexibility: A data-driven approach. Int. J. Electr. Power Energy Syst. 2018, 95, 451–462. [Google Scholar] [CrossRef]
- Moon, H.; Park, S.Y.; Jeong, C.; Lee, J. Forecasting electricity demand of electric vehicles by analyzing consumers’ charging patterns. Transp. Res. Part D Transp. Environ. 2018, 62, 64–79. [Google Scholar] [CrossRef]
- Arias, M.B.; Bae, S. Electric vehicle charging demand forecasting model based on big data technologies. Appl. Energy 2016, 183, 327–339. [Google Scholar] [CrossRef]
- Xydas, E.; Marmaras, C.; Cipcigan, L.M.; Jenkins, N.; Carroll, S.; Barker, M. A data-driven approach for characterising the charging demand of electric vehicles: A UK case study. Appl. Energy 2016, 162, 763–771. [Google Scholar] [CrossRef]
- Lee, J.H.; Chakraborty, D.; Hardman, S.J.; Tal, G. Exploring electric vehicle charging patterns: Mixed usage of charging infrastructure. Transp. Res. Part D Transp. Environ. 2020, 79, 102249. [Google Scholar] [CrossRef]
- Tal, G.; Nicholas, M.A.; Davies, J.; Woodjack, J. Charging behavior impacts on electric vehicle miles traveled: Who is not plugging in? Transp. Res. Rec. 2014, 2454, 53–60. [Google Scholar] [CrossRef]
- Chakraborty, D.; Bunch, D.S.; Lee, J.H.; Tal, G. Demand drivers for charging infrastructure-charging behavior of plug-in electric vehicle commuters. Transp. Res. Part D Transp. Environ. 2019, 76, 255–272. [Google Scholar] [CrossRef]
- Kelly, J.C.; MacDonald, J.S.; Keoleian, G.A. Time-dependent plug-in hybrid electric vehicle charging based on national driving patterns and demographics. Appl. Energy 2012, 94, 395–405. [Google Scholar] [CrossRef]
- Hu, L.; Dong, J.; Lin, Z. Modeling charging behavior of battery electric vehicle drivers: A cumulative prospect theory based approach. Transp. Res. Part C Emerg. Technol. 2019, 102, 474–489. [Google Scholar] [CrossRef]
- Bae, S.; Kwasinski, A. Spatial and temporal model of electric vehicle charging demand. IEEE Trans. Smart Grid 2011, 3, 394–403. [Google Scholar] [CrossRef]
- Tang, D.; Wang, P. Probabilistic modeling of nodal charging demand based on spatial-temporal dynamics of moving electric vehicles. IEEE Trans. Smart Grid 2015, 7, 627–636. [Google Scholar] [CrossRef]
- Chaudhari, K.; Kandasamy, N.K.; Krishnan, A.; Ukil, A.; Gooi, H.B. Agent-based aggregated behavior modeling for electric vehicle charging load. IEEE Trans. Ind. Inform. 2018, 15, 856–868. [Google Scholar] [CrossRef]
- Ko, J.; Kim, D.; Nam, D.; Lee, T. Determining locations of charging stations for electric taxis using taxi operation data. Transp. Plan. Technol. 2017, 40, 420–433. [Google Scholar] [CrossRef]
- Almaghrebi, A.; Aljuheshi, F.; Rafaie, M.; James, K.; Alahmad, M. Data-driven charging demand prediction at public charging stations using supervised machine learning regression methods. Energies 2020, 13, 4231. [Google Scholar] [CrossRef]
- Sun, X.H.; Yamamoto, T.; Morikawa, T. Charge timing choice behavior of battery electric vehicle users. Transp. Res. D Transp. Environ. 2015, 37, 97–107. [Google Scholar] [CrossRef]
- Ministry of Land, Infrastructure and Transport (MOLIT). Report on Electric Vehicle Registration in Korea. Available online: http://www.molit.go.kr/USR/NEWS/m_71/dtl.jsp?lcmspage=1&id=95086498 (accessed on 3 August 2021).
- Korea Environment Corporation (KEC). Electric Vehicle Charging Station Information—OpenAPI. August 2021. Available online: https://www.data.go.kr/data/15076352/openapi.do (accessed on 3 August 2021).
- Greene, W. Econometric Analysis 7/E; Prentice Hall: Upper Saddle River, NJ, USA, 2012. [Google Scholar]
- R Core Team. R: A Language and Environment for Statistical Computing. 2021. Available online: http://www.R-project.Org (accessed on 3 August 2021).
- Brame, R.; Paternoster, R.; Mazerolle, P.; Piquero, A. Testing for the equality of maximum-likelihood regression coefficients between two independent equations. J. Quant. Criminol. 1998, 14, 245–261. [Google Scholar] [CrossRef]
- Paternoster, R.; Brame, R.; Mazerolle, P.; Piquero, A. Using the correct statistical test for the equality of regression coefficients. Criminology 1998, 36, 859–866. [Google Scholar] [CrossRef]
- Park, K.-S.; An, S.-H.; Kim, H.; Joh, C.-H.; Suh, W. Spatial Analysis of Subway Ridership: Rainfall and Ridership. Proc. Eng. Technol. Innov. 2016, 4, 1–3. [Google Scholar]


Disclaimer/Publisher’s Note: The statements, opinions and data contained in all publications are solely those of the individual author(s) and contributor(s) and not of MDPI and/or the editor(s). MDPI and/or the editor(s) disclaim responsibility for any injury to people or property resulting from any ideas, methods, instructions or products referred to in the content. |
© 2023 by the authors. Licensee MDPI, Basel, Switzerland. This article is an open access article distributed under the terms and conditions of the Creative Commons Attribution (CC BY) license (https://creativecommons.org/licenses/by/4.0/).