As the material-dependent input parameters characterizing the fatigue behaviour of the investigated cast steel alloy G12MnMo7-4+QT are now experimentally derived, the linear-elastic SED-framework can be put into operation. The procedure includes the evaluation of a design limit curve based on experimental results of plain and notched specimens as well as the application of the methodology to assess the fatigue strength of defect-afflicted cast steel components.
3.1. Evaluation of the Linear-Elastic Design Limit Curve
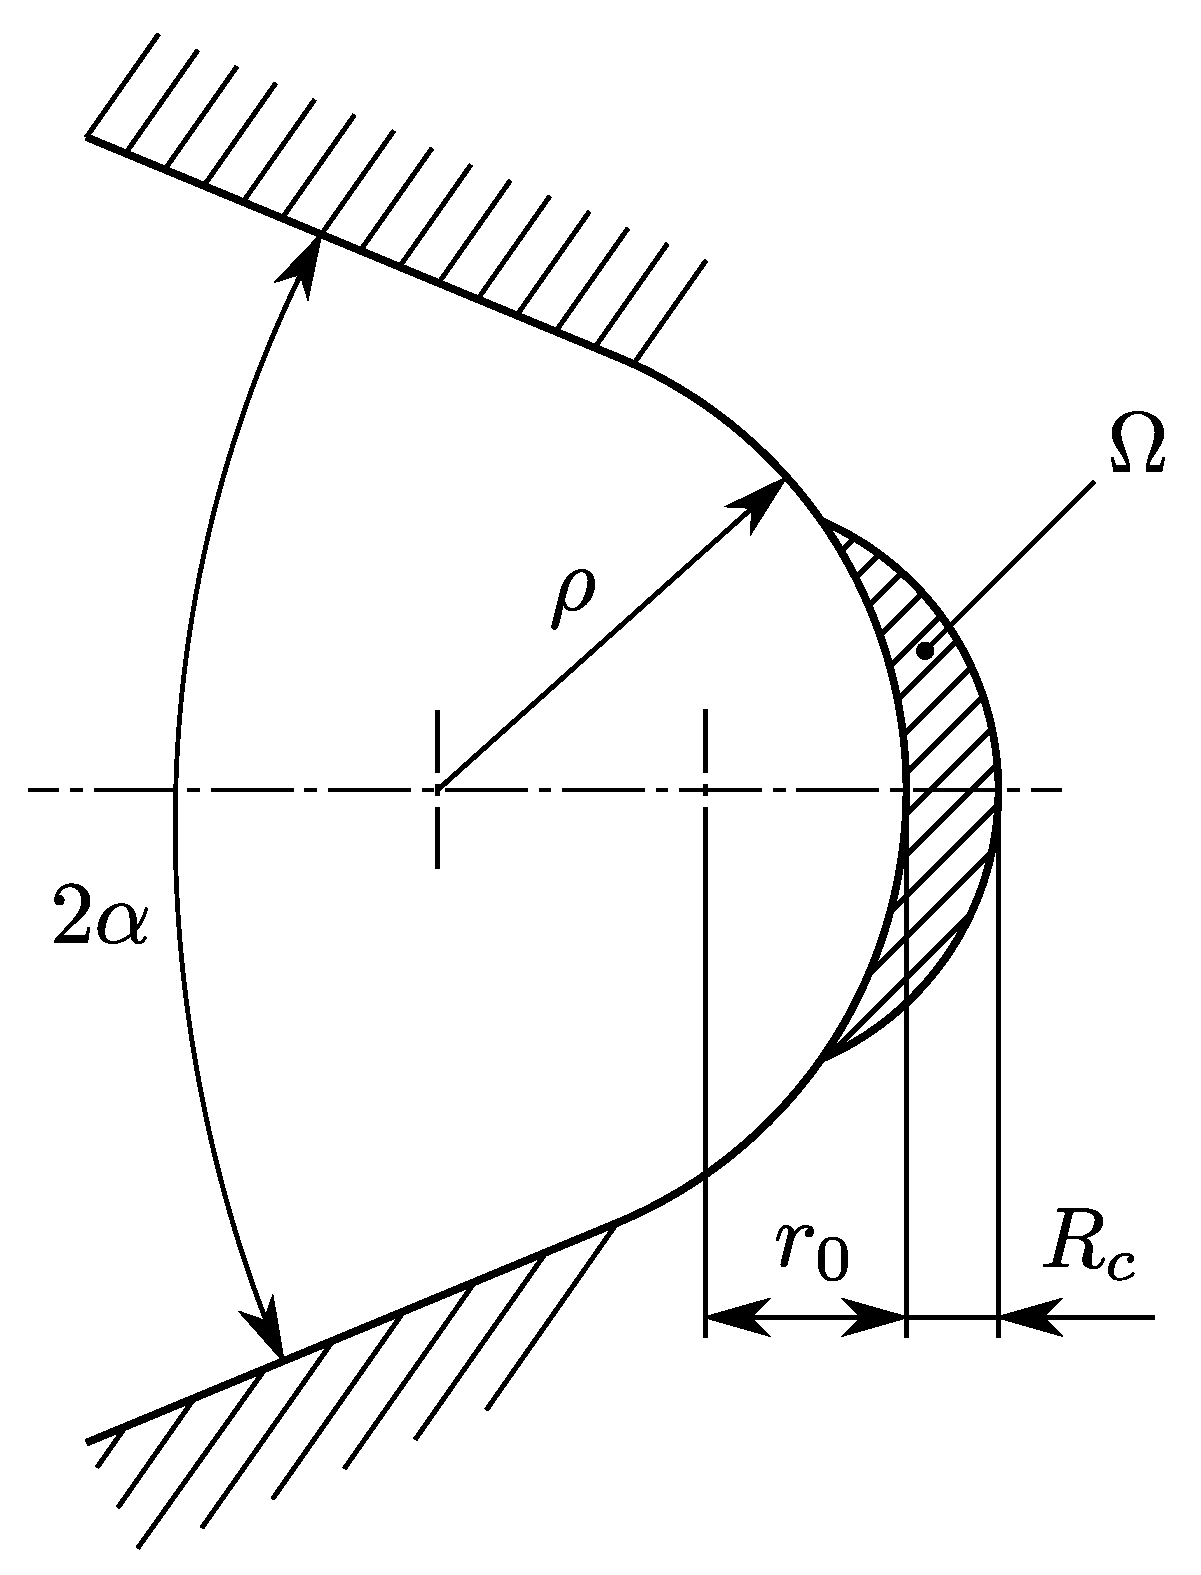
In order to describe the control volume governing the aggregated amount of strain energy during fatigue assessment, the control radius
was evaluated according to Equations (
2) and (
3). Additionally to the dependency of the material parameters
and
on
R, Equation (
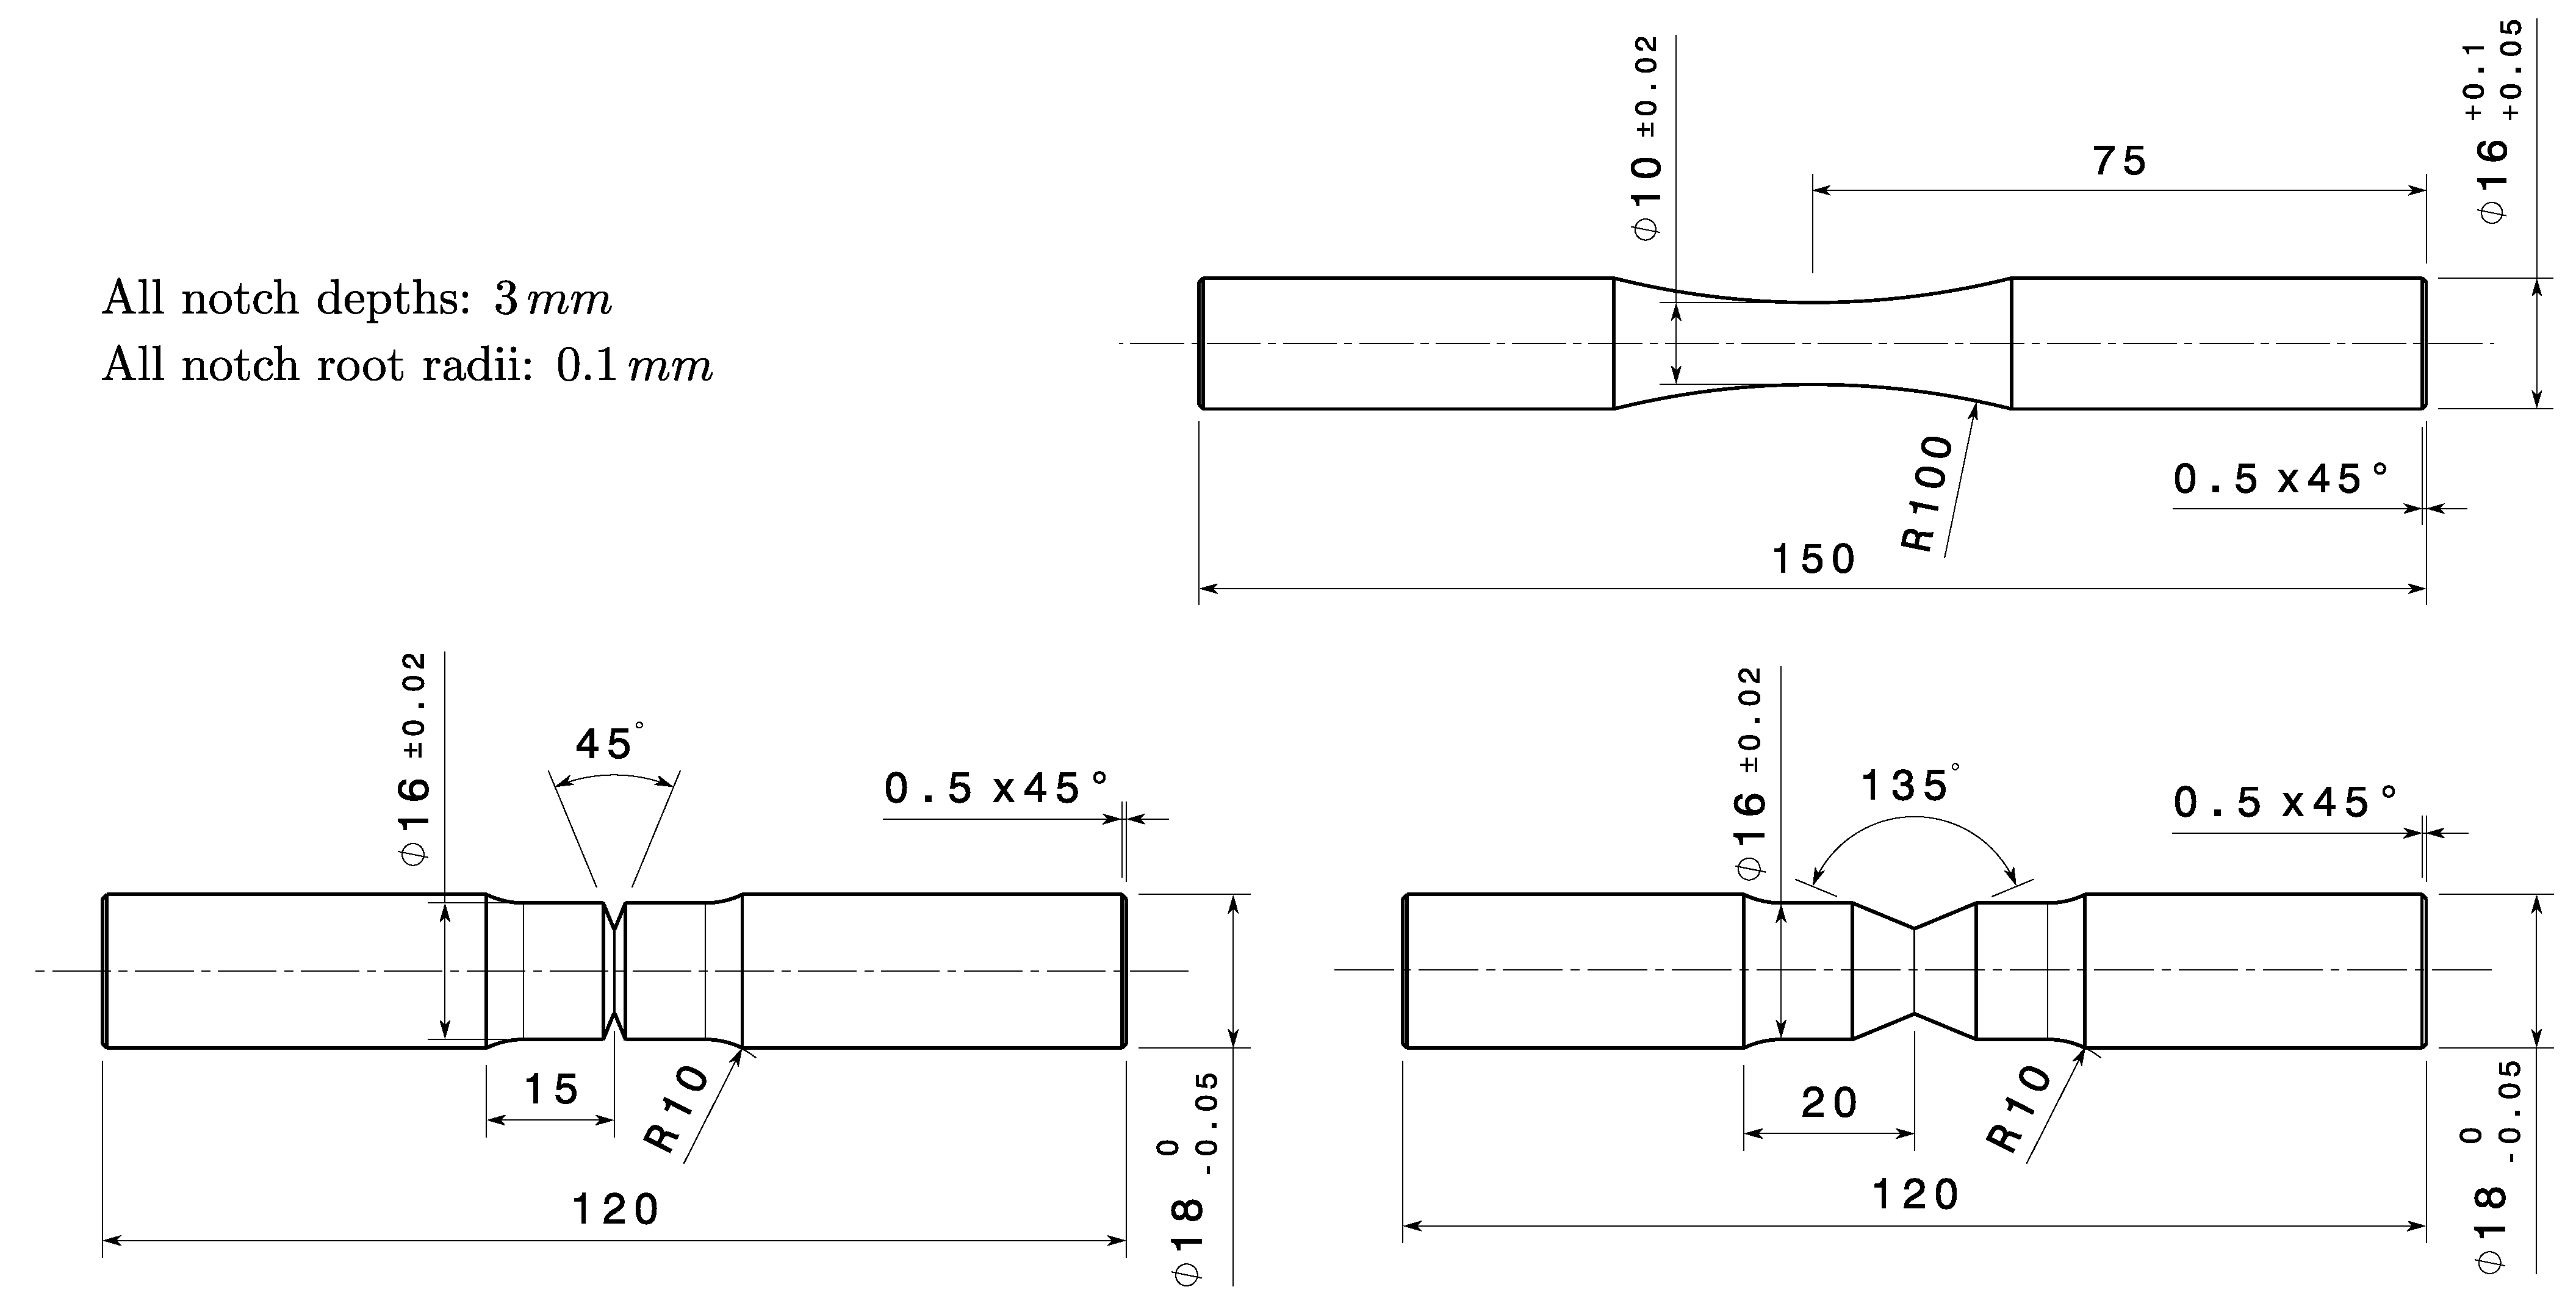
2) also includes parameters that rely on the geometry of the utilized notched specimens. Hence, the long-crack growth threshold stress intensity factor range for V-notched specimens
as well as the geometry parameter
were evaluated for the notch geometries utilized in the experimental small–scale fatigue tests. The resulting values of
are given in
Table 4, alongside the calculated values of
according to Equation (
1).
Regarding the results depicted in
Table 4, the calculations according to Equations (
2) and (
3) result in similar values of the control radius for the investigated stress ratios. Both evaluation methods show decreasing values of
as
R increases. Recalling Equation (
3),
is directly connected to the material intrinsic length
. Hence, the dependency of
upon
R reflects the trend of
as reported in the literature [
56]. However, calculations of the SED incorporating a control radius that depends on the acting stress ratio resulted in significantly enlarged scattering of the analysed experimental fatigue data. A decrease in
resulted in a smaller value of the considered control volume. Due to the stress gradient emanating from the apex of notch-like geometries, a smaller control volume implies an increasing focus on the highly-stressed region in the vicinity of the notch root. Hence, the averaged value of the calculated SED shifts towards higher values, as the size of the control volume decreases. Following this considerations, a larger control volume leads to an underestimation of the calculated averaged SED values. Apart from the variation observed in the calculated SED values, the implementation of a dependency of
upon
R also significantly increases the experimental effort necessary to establish the respective relationship. Hence, an averaged value of
= 0.083 mm was utilized in the present analysis independent of the stress ratio. Considering
Table 4, it should be noted that this average value shows only a small deviation to the evaluated values of
at a stress ratio of
. As
and
are often reported in the literature for
, an appropriate value of the control radius can be conveniently calculated utilizing Equation (
3). However, from a scientific point of view, the study of the relationship between
and
R depicts an interesting topic for future research work.
As an appropriate value of
was defined, the results of the experimental investigations reported in
Section 2.1 were evaluated in terms of the linear-elastic strain energy density range
. Notched specimens were evaluated in accordance to the analytical framework presented by Lazzarin and Berto [
27]. The evaluation of the fatigue test results of the utilized plain specimens was carried out according to Equation (
5). The effect of the stress ratio was accounted for by the implementation of the factor
, given by Equation (
6). Statistical evaluation of the fatigue data was conducted following the standard ASTM E739 [
57] in the finite-life region, where the fatigue limit in the high-cycle fatigue regime was determined according to the
approach [
58].
Figure 8 depicts the assessed fatigue data in terms of the linear-elastic SED.
Figure 8 summarizes the experimentally derived fatigue data into a uniform scatter band, combining the results of three different specimen geometries tested at stress ratios of
and
. The statistically evaluated fatigue limit curve for a probability of survival of
was plotted, alongside the scatter band representing probabilities of survival of
and
. Furthermore, the probability of survival of
was evaluated, serving as a design limit curve in accordance to the commonly utilized guideline FKM [
12]. Concerning the scatter band index of the depicted data points, the linear-elastic fatigue assessment gave a value of
. It should be noted, that the energy-based fatigue assessment implies an increased scatter index of fatigue data compared to stress-based concepts, due to the quadratic relationship between the stress and strain energy density. By calculating the square root of the energy-based scatter index, the scatter index in terms of stresses was computed as a value of
. This comparably high value was mainly caused by the fatigue data evaluated at a stress ratio of
. Regarding
Figure 8, the experimental results at stress ratios of
and 0 revealed an overall match. Only the evaluated SED values of notched specimens tested at
diverged significantly from the remaining data points. As the notched specimens exhibited stress concentration at the notch apex, the high values of maximum stresses during cyclic loading at
resulted in plastic deformation in the vicinity of the notch root. This plastic deformation caused mean stress relaxation [
59,
60], leading to cyclic testing under an effective stress ratio of
, following the initial loading. Hence, as the effect of the stress ratio was implemented in the fatigue assessment by consideration of the factor
given by Equation (
6), the linear-elastic SED was overestimated. This overestimation was traced back to the value of
, which takes a value of 3 at
, implying that the linear-elastic SED is three times larger than the one at
. In order to improve the prediction accuracy even at high stress ratios, the implementation of the elastic-plastic material behaviour should be considered in further work.
3.2. Calculation of the Linear-Elastic Strain Energy Density of Bulk Defects
Following the definition of the linear-elastic design limit curve, the methodology was extended to assess the fatigue strength of defect-afflicted specimens considered in
Section 2.2. Following the considerations of a preceding study [
26], a numerical assessment strategy was formulated. As the evaluation of the fatigue behaviour bases on the geometrical appearance of the inherent imperfections, the two recorded radiographs, denoted as X- and Y-view were digitalized for each imperfect large–scale specimen. Due to the discrete nature of the digital images, a smoothing algorithm [
61] was applied to derive continuous defect contours. Subsequently, geometrical shape parameters of the digitalized defect structures were calculated in order to characterize the depicted imperfections on the assessed radiographs.
Table 5 summarizes the minimum and maximum values of the respective shape parameters derived from the 66 assessed radiographs of the present numerical study.
The numerical calculations were conducted by linear-elastic finite element analyses utilizing the software package Abaqus
® 2021. As the radiographs depict two-dimensional projections of the corresponding imperfection, planar simulation models were utilized, in which the respective defect structures were implemented, respectively. Concerning the angular orientation of the defect contour, the rotation angle reflects the one investigated in the experiments described in
Section 2.2. Plane stress elements with quadratic shape functions of type CPS6/CPS8 were used. It should be noted, that the size of the finite element models as well as the element sizes were proportional to the absolute dimensions of the corresponding defect in order to provide a simulation methodology that was applicable to arbitrary defect structures. The numerical models were loaded under uniaxial tension, evoking a maximum stress of 1 MPa in the gross-section of the model.
Figure 9 depicts the simulation results of selected defect structures. The evaluated stress constitutes the stress concentration factor induced by the respective imperfections.
As the numerical simulations represent static analyses, the SED evoked by the maximum stress of 1 MPa can be interpreted as the cyclic SED induced due to an acting stress range of MPa at a stress ratio of . Due to the linear-elastic material behaviour considered in the numerical analyses, the evaluated strain energy density values can be conveniently scaled to load levels investigated in the corresponding experiments.
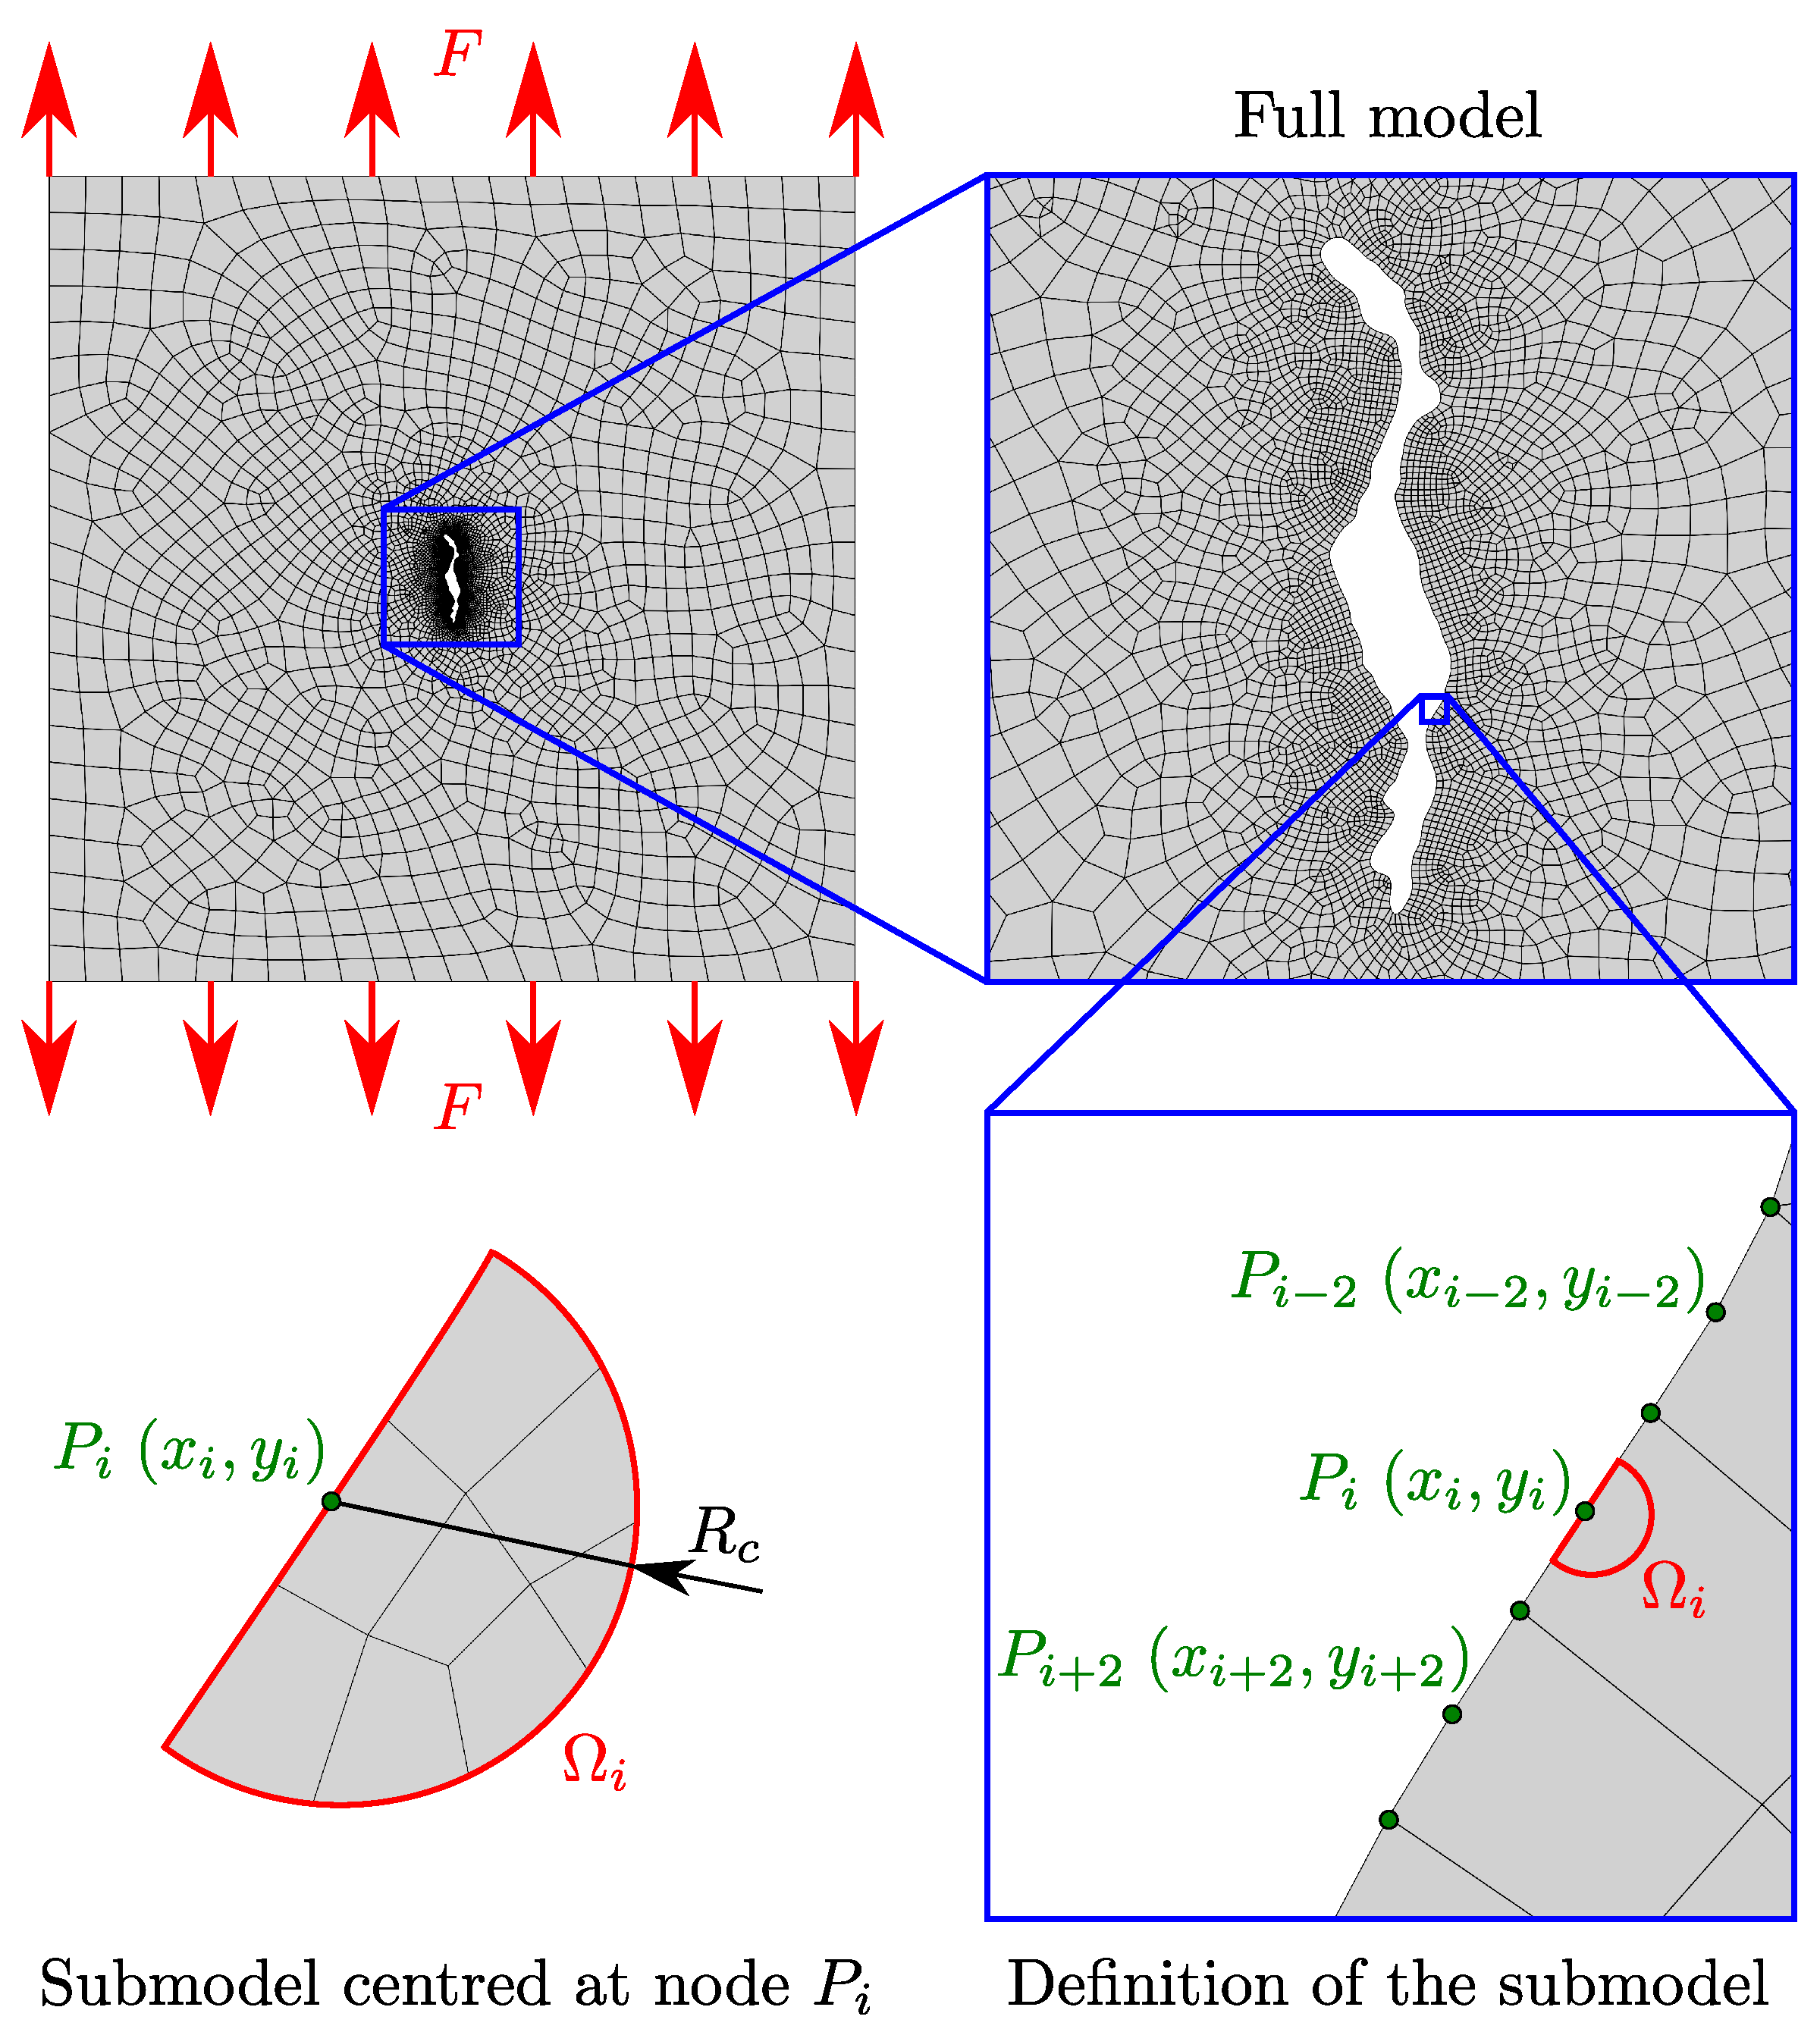
As the spatial imperfections possess an irregular shape, the planar projections also feature an arbitrary contour, which leads to a wide variability in the observed SED values. In order to derive a characteristic assessment parameter that reflects the fatigue behaviour of the defect-afflicted specimens, a statistical evaluation of the SED distribution along the defect contour was conducted. This procedure includes the definition of a control volume, which moves along the nodes of the respective projection contour. In order to provide a numerically efficient assessment methodology, finite element sub-modelling technique was applied.
Figure 10 summarizes the numerical simulation strategy.
At first, the stress field induced by the defect contour was calculated featuring a relatively coarse mesh in the neighbourhood of the imperfection. Subsequently, a sub-model was defined, which represents the control volume
utilized for calculating the linear-elastic SED. In analogy to the definition of the control volume at sharp notches [
28], the utilized control volume was centred in a node
of the respective defect contour, where the size of the control volume was defined by
, evaluated in
Section 3.1. A minimum of three elements were utilized within the control volume, as suggested in [
24,
62]. Compared to stress-based concepts, obtained SED results were not significantly affected by the size of the finite elements. Hence, rather coarse element sizes could be utilized without sacrificing accuracy. After defining the control volume, the sub-model was analysed and the averaged SED
was calculated from the numerical results of the elements defining
. The procedure was then repeated for the next node
along the defect contour, until the whole perimeter of the planar projection was assessed. The representative fatigue parameter
was defined as the SED value, exceeding
of all values along the defect contour.
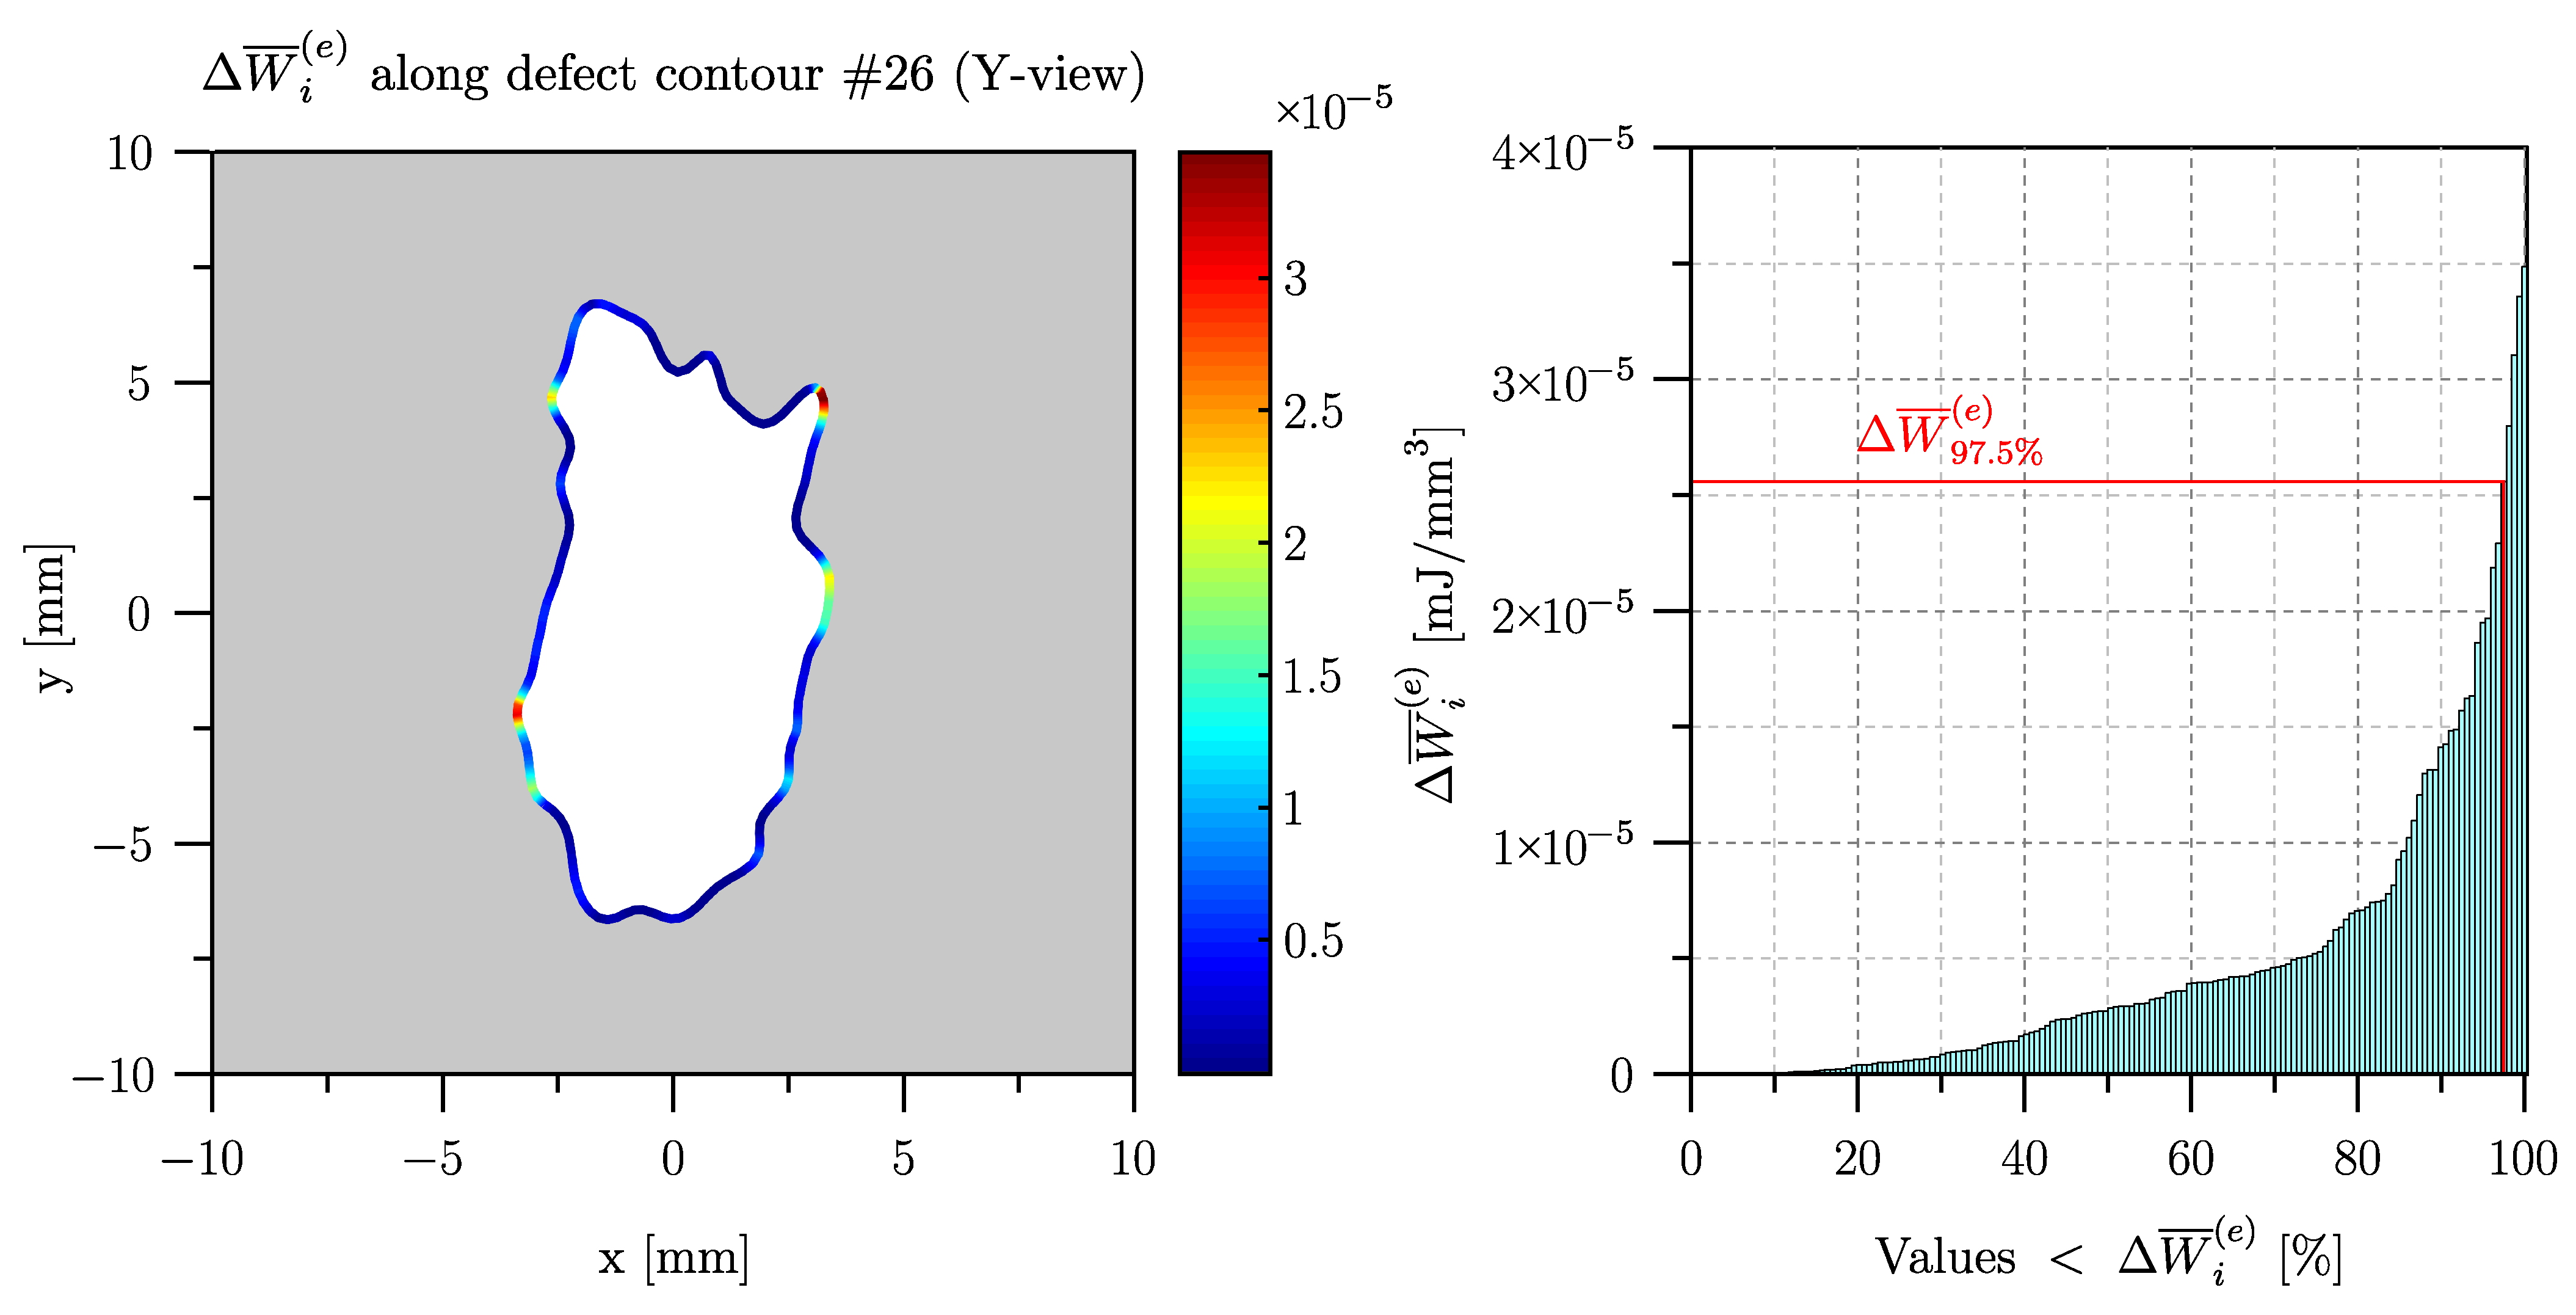
Figure 11 presents the determination of
through the example of the defect contour found on the Y-view of specimen #26. The left-hand side depicts the contour plot of
along the perimeter of the imperfection, while the diagram on the right-hand side shows the evaluation of
based on the discrete numerical results.
It should be emphasized, that
was evaluated utilizing a gross stress of
MPa. Due to the linear-elastic finite element analyses involved in the determination of
, the fatigue strength
of the respective defect-afflicted specimen can be calculated following Equation (
7), where
represents the fatigue strength of the plain material at the stress ratio
R to be assessed.
3.3. Validation of the Calculated Fatigue Strength Results
Validation of the proposed fatigue assessment methodology was conducted utilizing the results of the high-cycle fatigue experiments presented in
Section 2.2. The fatigue strength of corresponding specimens was evaluated according to the procedure described in
Section 3.2 and compared to the load levels investigated in the experiments.
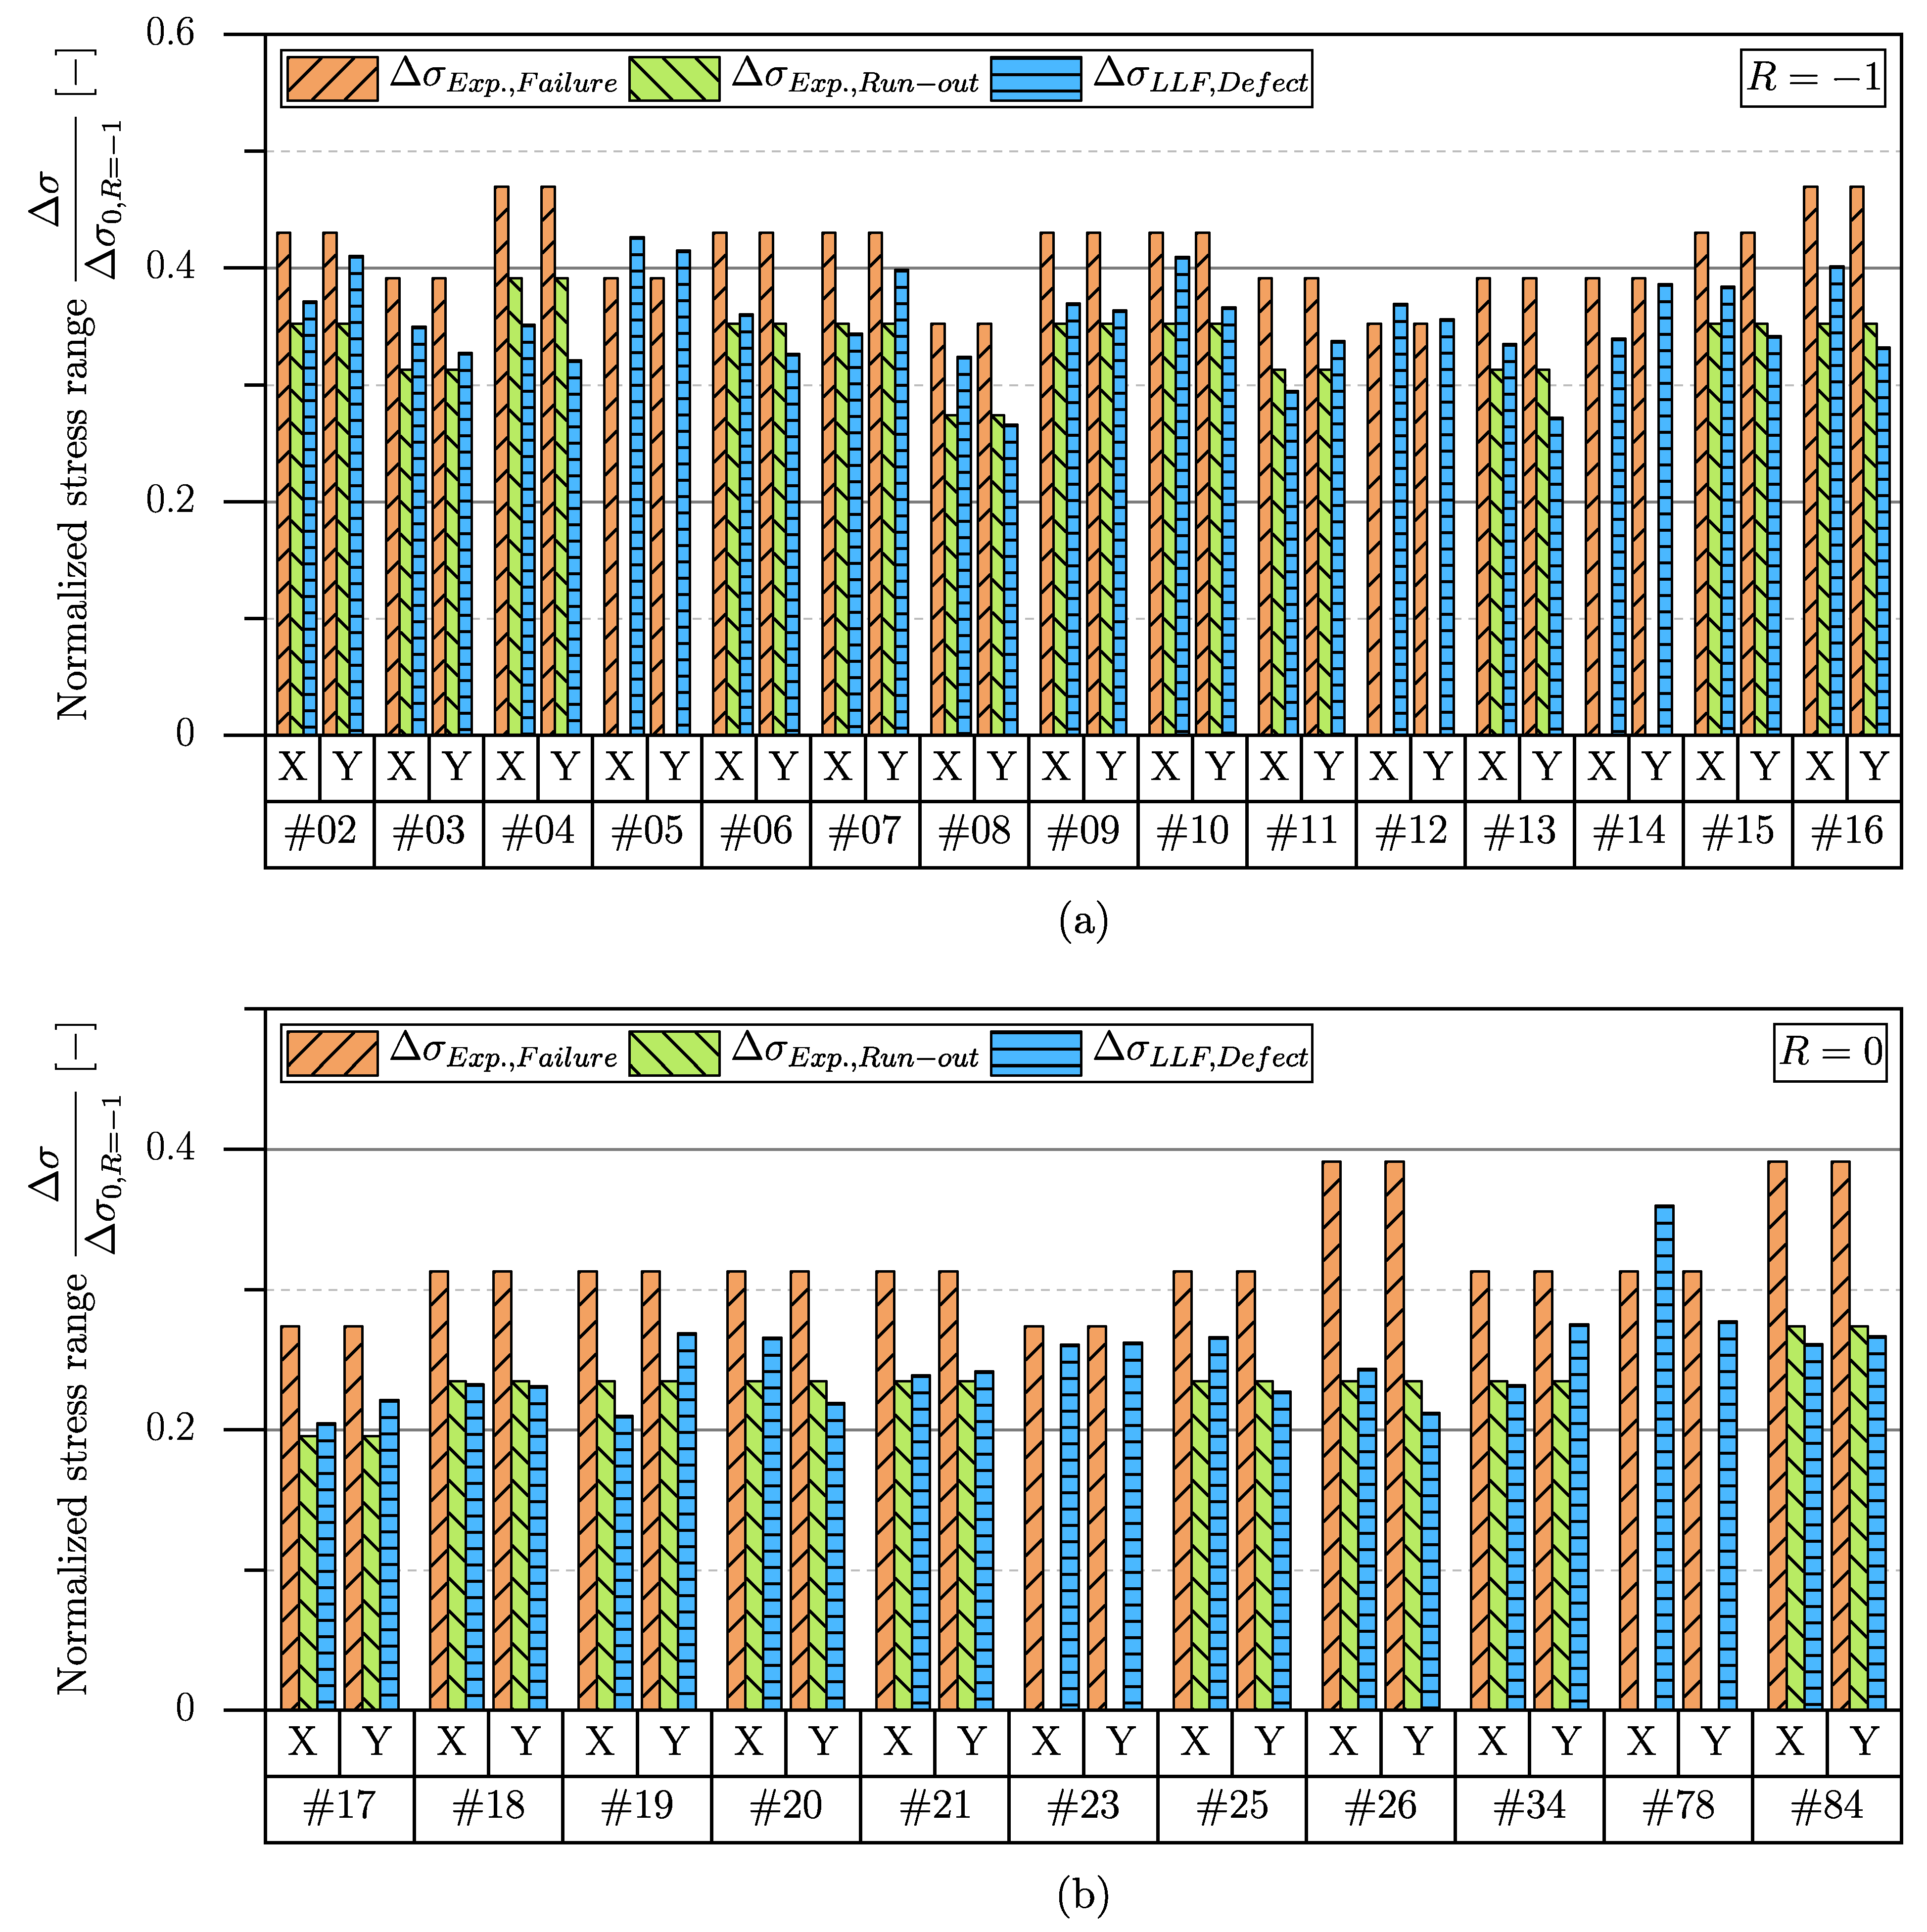
Figure 12 summarizes the validation results for stress ratios of
and 0, respectively.
Herein, the abscissa depicts the individual specimens in terms of the utilized radiographs denoted as X- and Y-view, which were assessed by the presented methodology. The parameter
represents the stress range, which led to burst failure in the corresponding experiment.
depicts the stress range, where a run-out of the respective specimen at ten million load cycles was achieved.
represents the assessed fatigue strength of the defect-afflicted specimen, evaluated by the established SED-framework. All depicted stress ranges were normalized with respect to the fatigue strength
of the parent material at a stress ratio of
. Considering the depicted results, the presented energy-based fatigue assessment methodology leads to a sound agreement of estimated fatigue strength values and experimental results, as
is either smaller than
or takes a value between
and
. Regarding the second case, it should be noted, that the depicted values of
are not necessarily the highest possible load levels to achieve a run-out of the corresponding specimens, as the specimens were re-inserted to provoke burst failure after a run-out was observed. Hence, values of
that lie in between
and
depict plausible fatigue strength estimations of the respective specimens. Taking a closer look at
Figure 12, one obtains a few specimens, where no run-out was achieved. These supposedly non-conservative assessment results are also reported in
Table 6.
Regarding specimens #05, #12 and #23, the achieved numbers of cycles where burst failure occurred were quite close to ten million cycles, which serves as a criterion of a run-out. As the deviations between and were quite small, the presented values of depict plausible estimations of the fatigue strength. Considering specimens #14 and #78, the numbers of cycles to failure show values of approximately and and therefore a higher divergence to the run-out criterion. However, the depicted values of regarding the X-view of specimen #14 as well as the Y-view of specimen #78 propose a fatigue strength, that is quite below the observed stress range at burst failure. Hence, the presented values of also depict reasonable fatigue strength estimations, as experiments utilizing a stress range of could have achieved run-outs of the respective specimens.
As exemplified by specimens #14 and #78, the fatigue strength simulation results based on the X- and Y-view of the corresponding specimens differ from each other in some cases. Hence, the derived values of
can be classified in two groups, namely, lower and higher predictions of the fatigue strength.
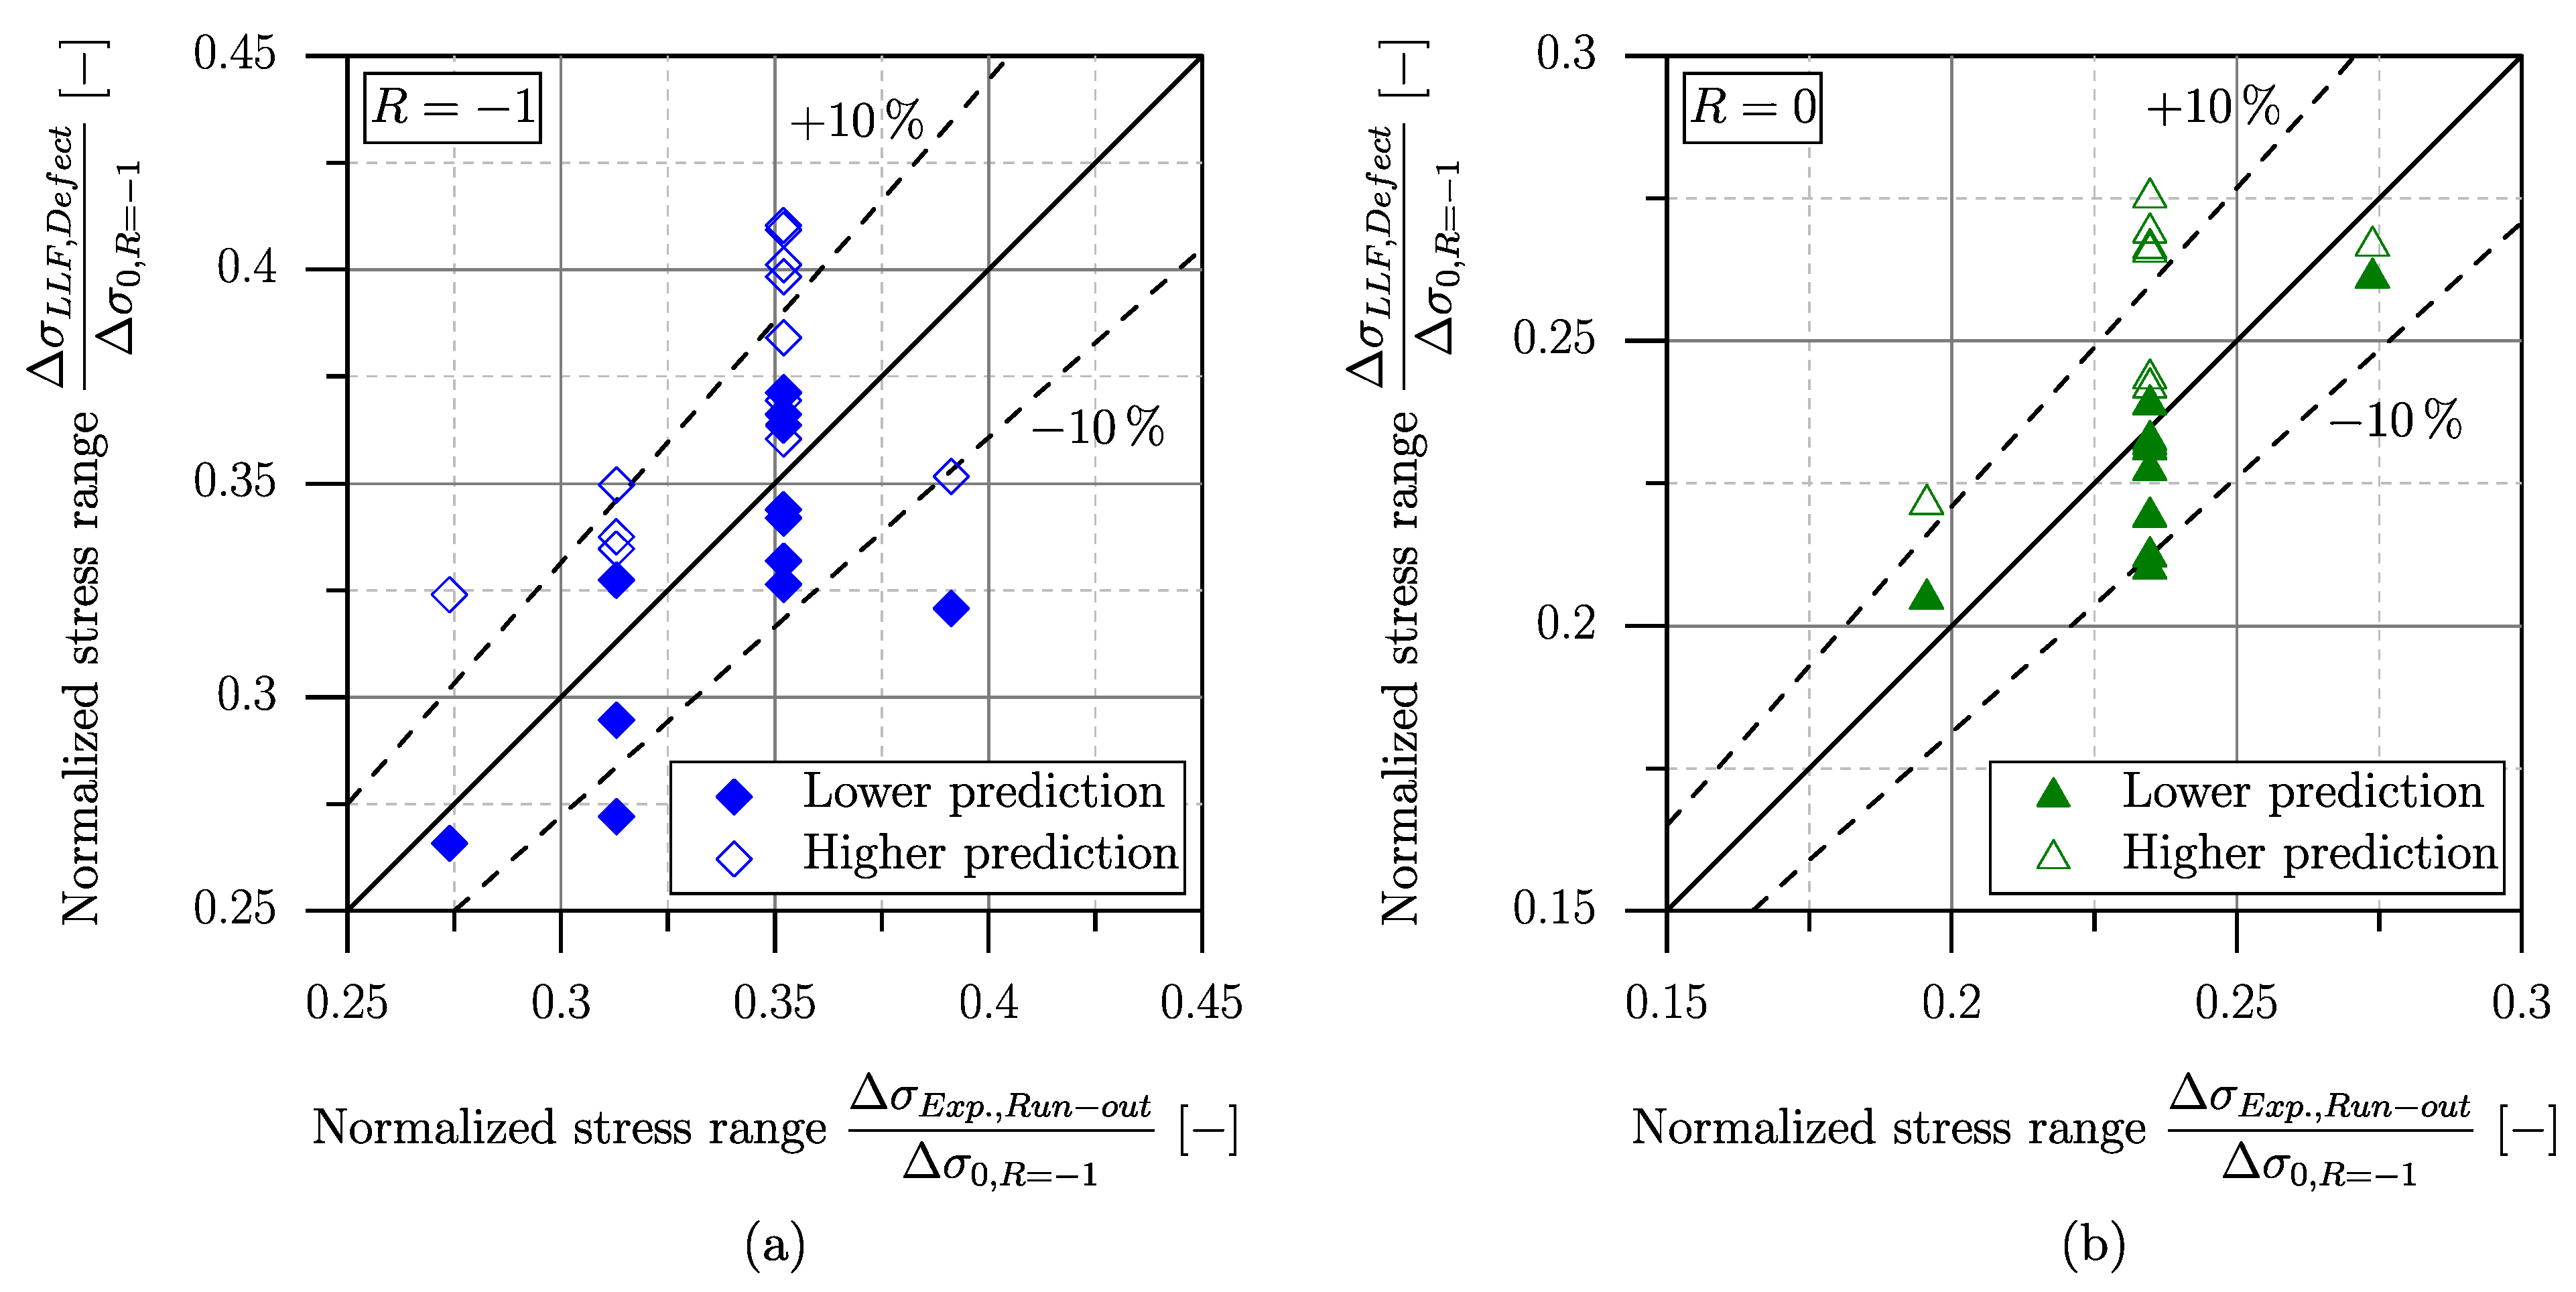
Figure 13 presents these two groups for the investigated stress ratios of
and 0. It should be noted, that only these numerical results are depicted, where a run-out was achieved in the corresponding experiments.
Figure 13 shows a comparison between the numerically predicted fatigue strength and the stress range, which led to a run-out of the respective specimen. Herein, data points on the right-hand side of the diagonal line represent conservative estimations. Additionally, a scatter band of
and
was evaluated. As the majority of derived data points fall within the respective scatter band, the depicted results confirm the sound applicability of the presented methodology to assess the fatigue strength of defect-afflicted cast steel components.
Furthermore, the methodology presented in a preceding study [
26] was applied, to assess the fatigue strength of the investigated defect-afflicted specimens based on the theory of critical distances. Utilizing the values of
reported in
Table 4, the fatigue strength
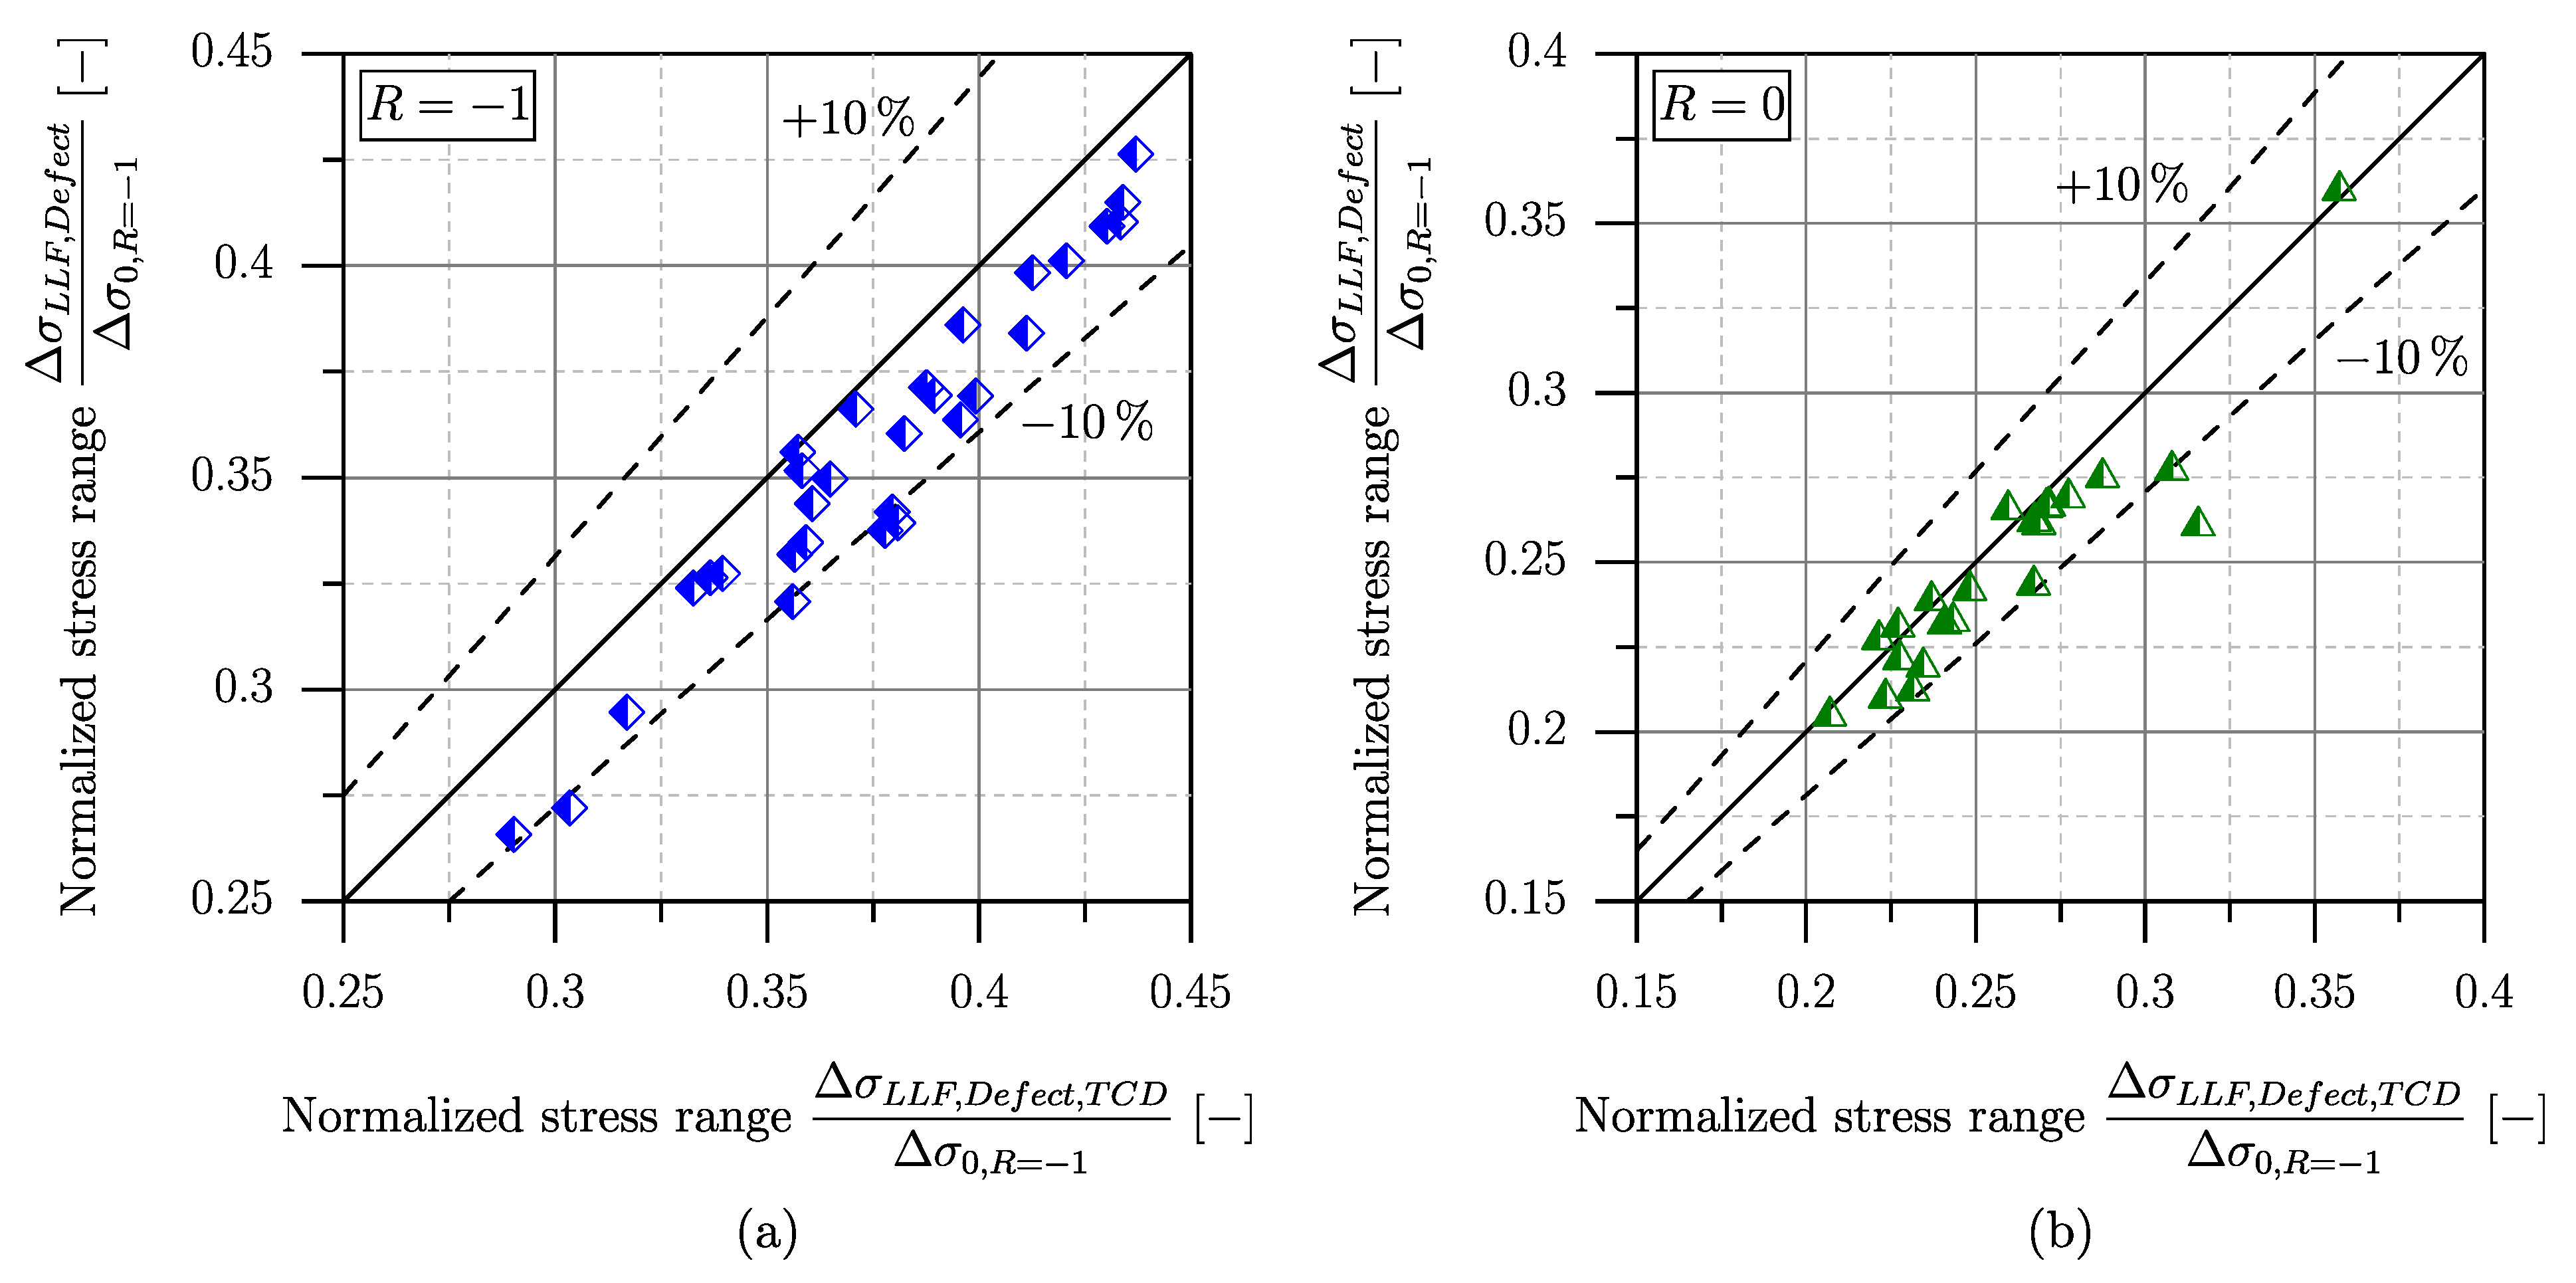
was evaluated by the TCD-framework. A comparison between the SED- and TCD-based assessment results is depicted in
Figure 14. In contrast to
Figure 13, the results of specimens where no run-out was achieved in the experiments are also depicted.
Regarding
Figure 14, the SED-framework yields slightly reduced values of the predicted fatigue strength compared to the ones derived by the TCD-based methodology, indicating a higher degree of conservatism when utilizing the SED-framework. In order to quantify the pictured tendencies, the average unsigned deviation
and signed deviation
between the numerically and experimentally derived results were evaluated according to Equations (
8) and (
9), respectively.
Table 7 summarizes the resulting deviations obtained by the SED- and TCD-based fatigue assessment methodologies.
Regarding
Table 7, both applied methodologies led to similar values of
. As the maximum unsigned deviation takes a value of only
, the reported results emphasize the sound capability of the applied assessment concepts in predicting reasonable fatigue strength values of defect-afflicted cast steel components. Regarding the depicted values of
, both concepts lead to positive deviations, which represent an average overestimation of experimentally derived run-out load levels. However, an improved prediction accuracy of the presented SED-based assessment methodology was observed, as the depicted values of
are significantly smaller than those derived by the TCD-framework. This improved accuracy may be the result of the averaging procedure over a finite volume when applying the SED concept. Rather than assessing the fatigue life based on a single stress value at a dedicated point, as conducted in terms of the TCD, the SED-framework also considers the strains present in the control volume, yielding an improved contribution regarding size-effect. This increase in accuracy also justifies the slightly enhanced numerical effort of the sub-model-based SED-framework compared to the utilization of the TCD.
Concerning fatigue assessment in the finite-life region, the application of the SED depicts a more straight-forward approach compared to the TCD. Susmel and Taylor presented an extension of the TCD to facilitate the fatigue assessment of notched components in the medium-cycle regime, introducing a relationship between the critical distance and the number of cycles to failure [
63]. This dependency is described by a power law, where the corresponding parameters are dependent on the material and the investigated load ratio. Hence, application of this methodology requires a calibration procedure in order to evaluate the corresponding material parameters. The subsequent fatigue assessment of defect-afflicted components is based on an iterative loop which increases numerical effort when dealing with arbitrarily shaped spatial imperfections. Considering the SED concept, the fatigue assessment in the finite-life regime takes advantage of the design limit curve evaluated in
Section 3.1. Utilizing the derived parameter
, the corresponding defect structure loaded under an arbitrary stress range
can be assessed following Equation (
10).
In order to also validate the presented methodology in the finite-life region, the stress ranges of all conducted experiments reported in
Section 2.2 were considered according to Equation (
10), yielding corresponding values for the linear-elastic SED range
.
Figure 15 depicts the numerical assessment results of the defect-afflicted cast steel specimens, where the data points from
Figure 8 are plotted as a reference.
Regarding the results of the defect-afflicted specimens, it should be mentioned, that there are two data points reported for each value of
N, constituting the results based on the X- and Y-view of the corresponding specimen, respectively. As nearly all evaluated SED values fall within the derived scatter band, the depicted data points in
Figure 15 exhibit satisfying fatigue assessment results. Looking closely in the region of
, four data points can be observed, that are clearly outside the depicted scatter band. These data points represent the assessment results of specimens #04 tested at
and #26 tested at
, while the fatigue strength of both specimens was accurately predicted by the presented methodology, the assessment of the respective stress ranges
underestimates the SED value suggested by the evaluated scatter band. A possible explanation for the observed deviation could be a geometrical feature, representing a notch-like shape of high acuity, not visible on the two perpendicularly assessed radiographs. The utilization of three-dimensional finite element analyses could possibly improve the prediction accuracy, while simultaneously increasing the computational effort and associated costs. However, keeping in mind that the derived results solely rely upon linear-elastic simulations based on two planar projections of complex-shaped spatial imperfections per evaluated large–scale specimen, the presented methodology constitutes a well-applicable engineering-feasible tool for the fatigue assessment of defect-afflicted cast steel components.


