
Impact of LGE-MRI in Arrhythmia Ablation
Abstract
:1. Introduction
2. Use of LGE-MRI for the Detection of Fibrosis
2.1. Principles of LGE
2.2. Protocol of Image Acquisition and LGE Analysis
2.3. Image Acquisition for Patients with Cardiac Devices
3. Image Post-Processing (Pre-Procedural)
3.1. Image Processing: Segmentation and Fibrosis Detection
- Segmentation of anatomical structures
- II.
- Detection of fibrotic tissue
3.2. Deep Learning-Based Methods
4. Use of the Processed LGE-MRI for Ablation Procedures
4.1. Determination of the Optimal Access Approach
4.2. Exclusion of Intracardiac Thrombus
4.3. Integration of LGE-MRI and Electroanatomical Map (EAM) during Ablation
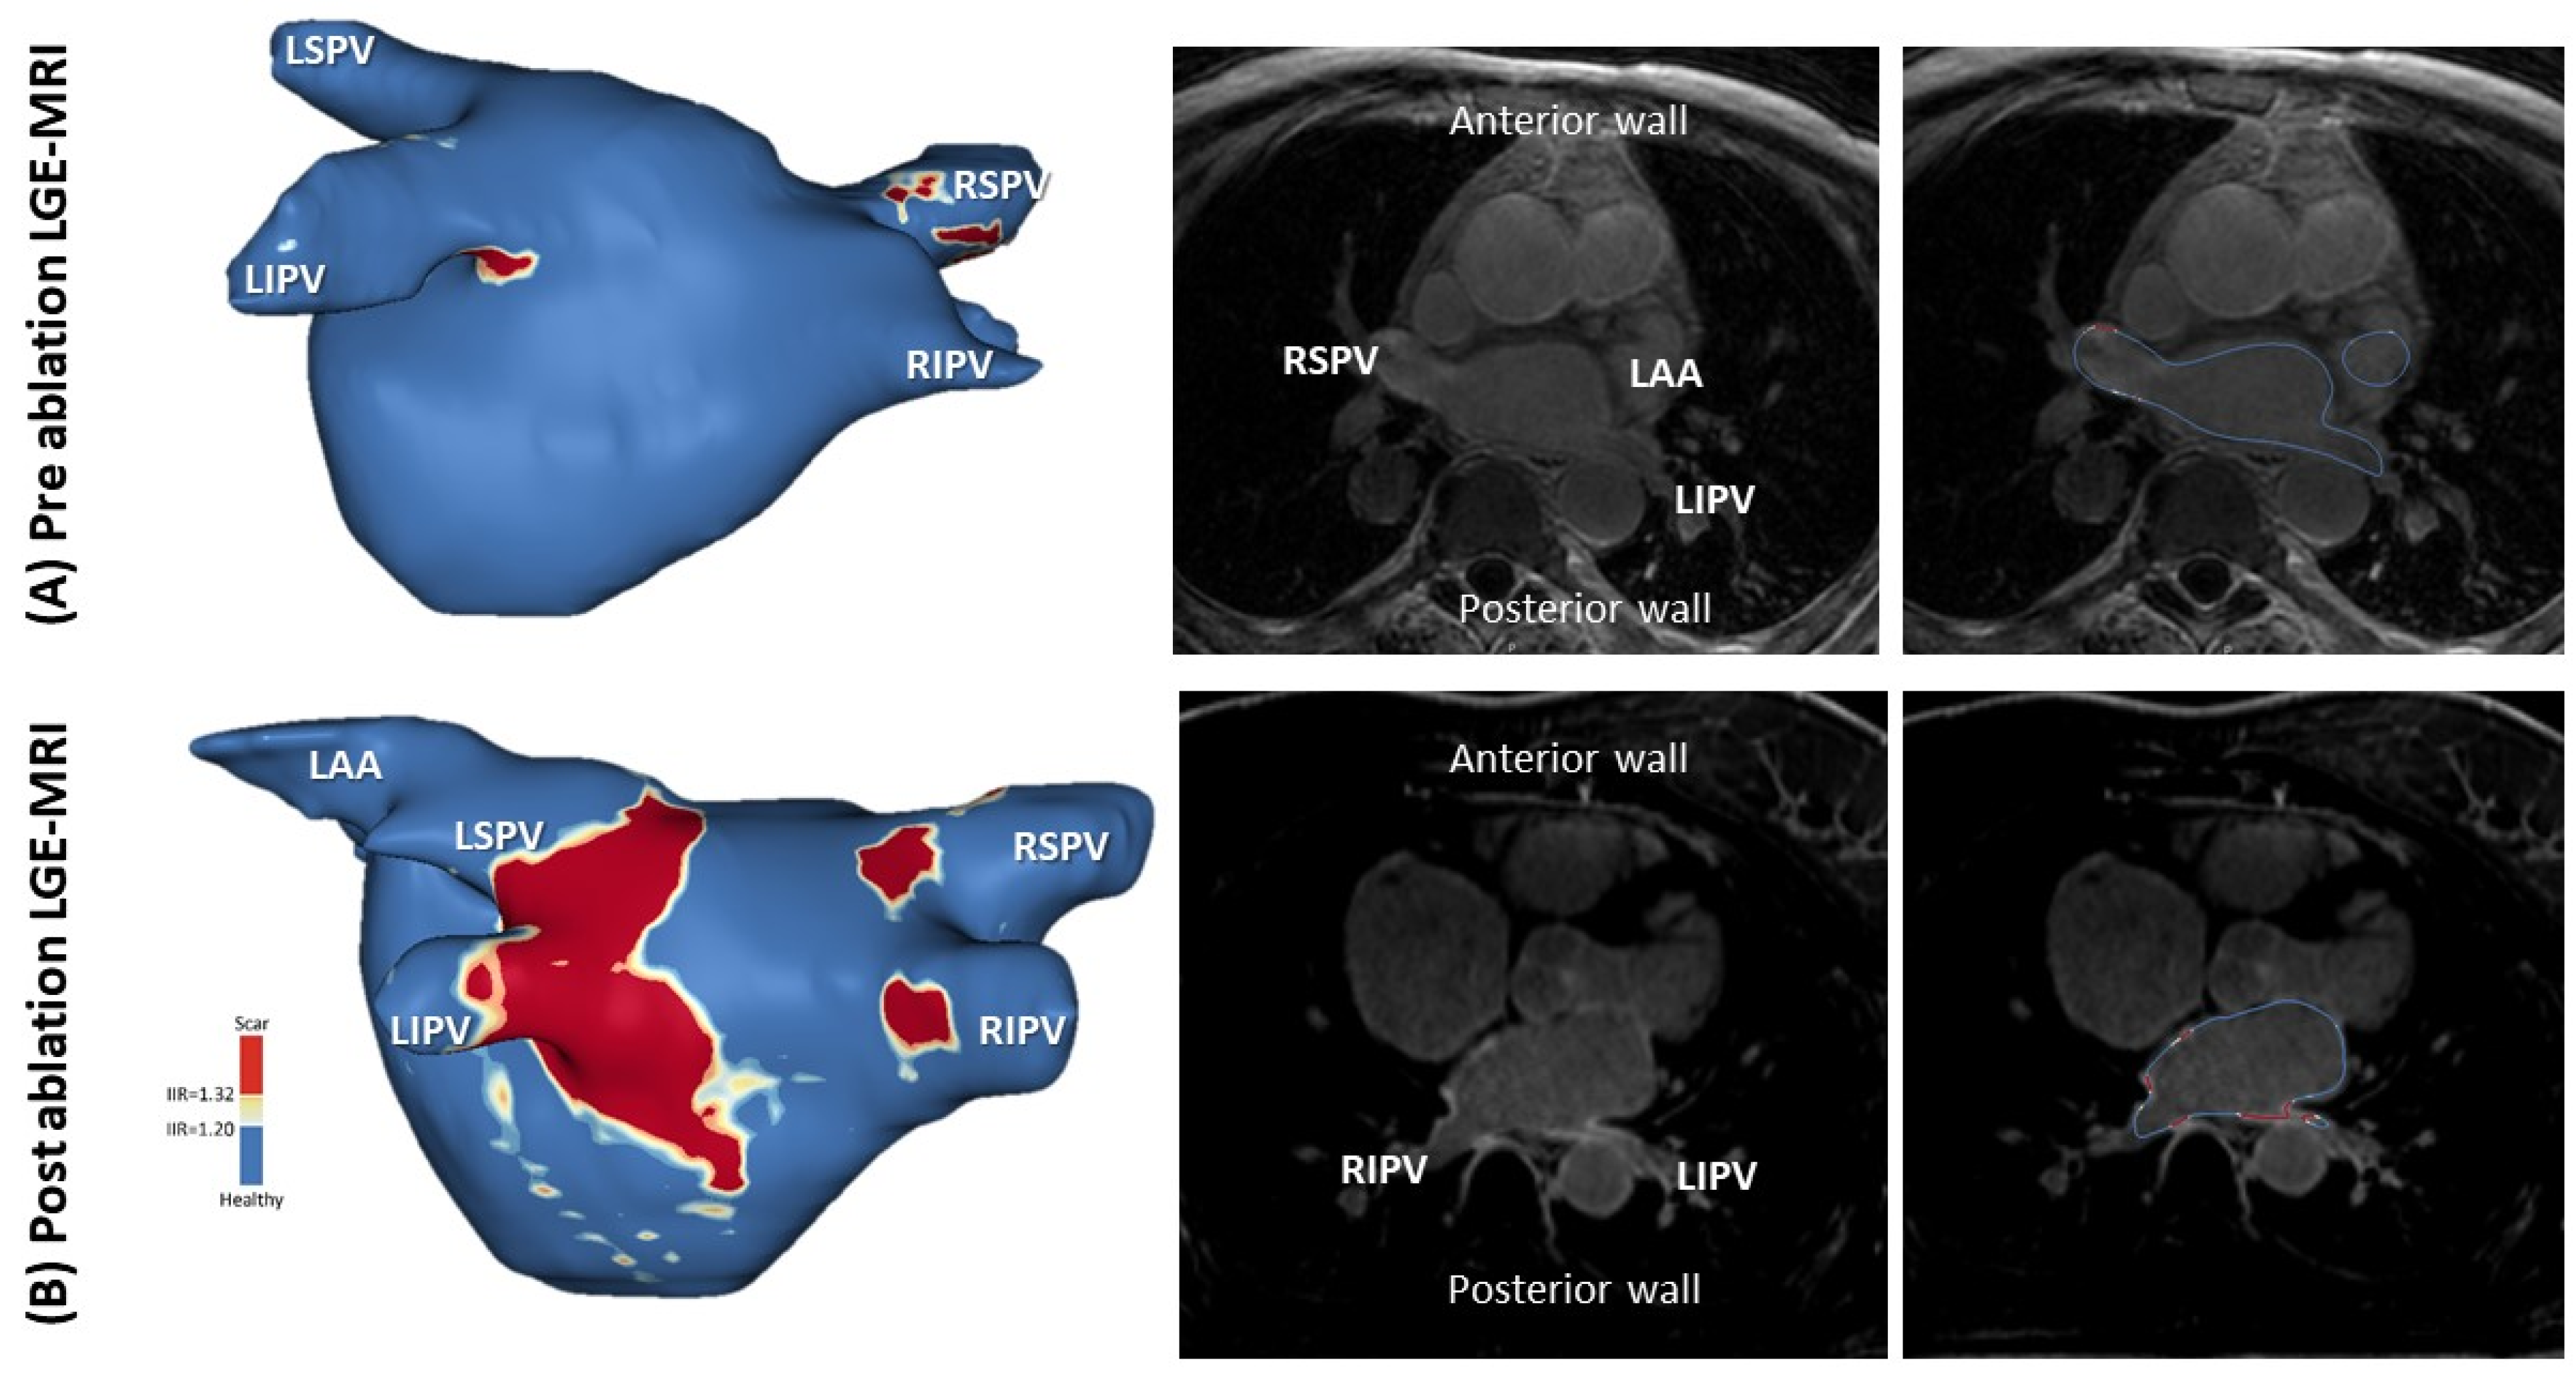
4.4. LGE-MRI for AF Ablation
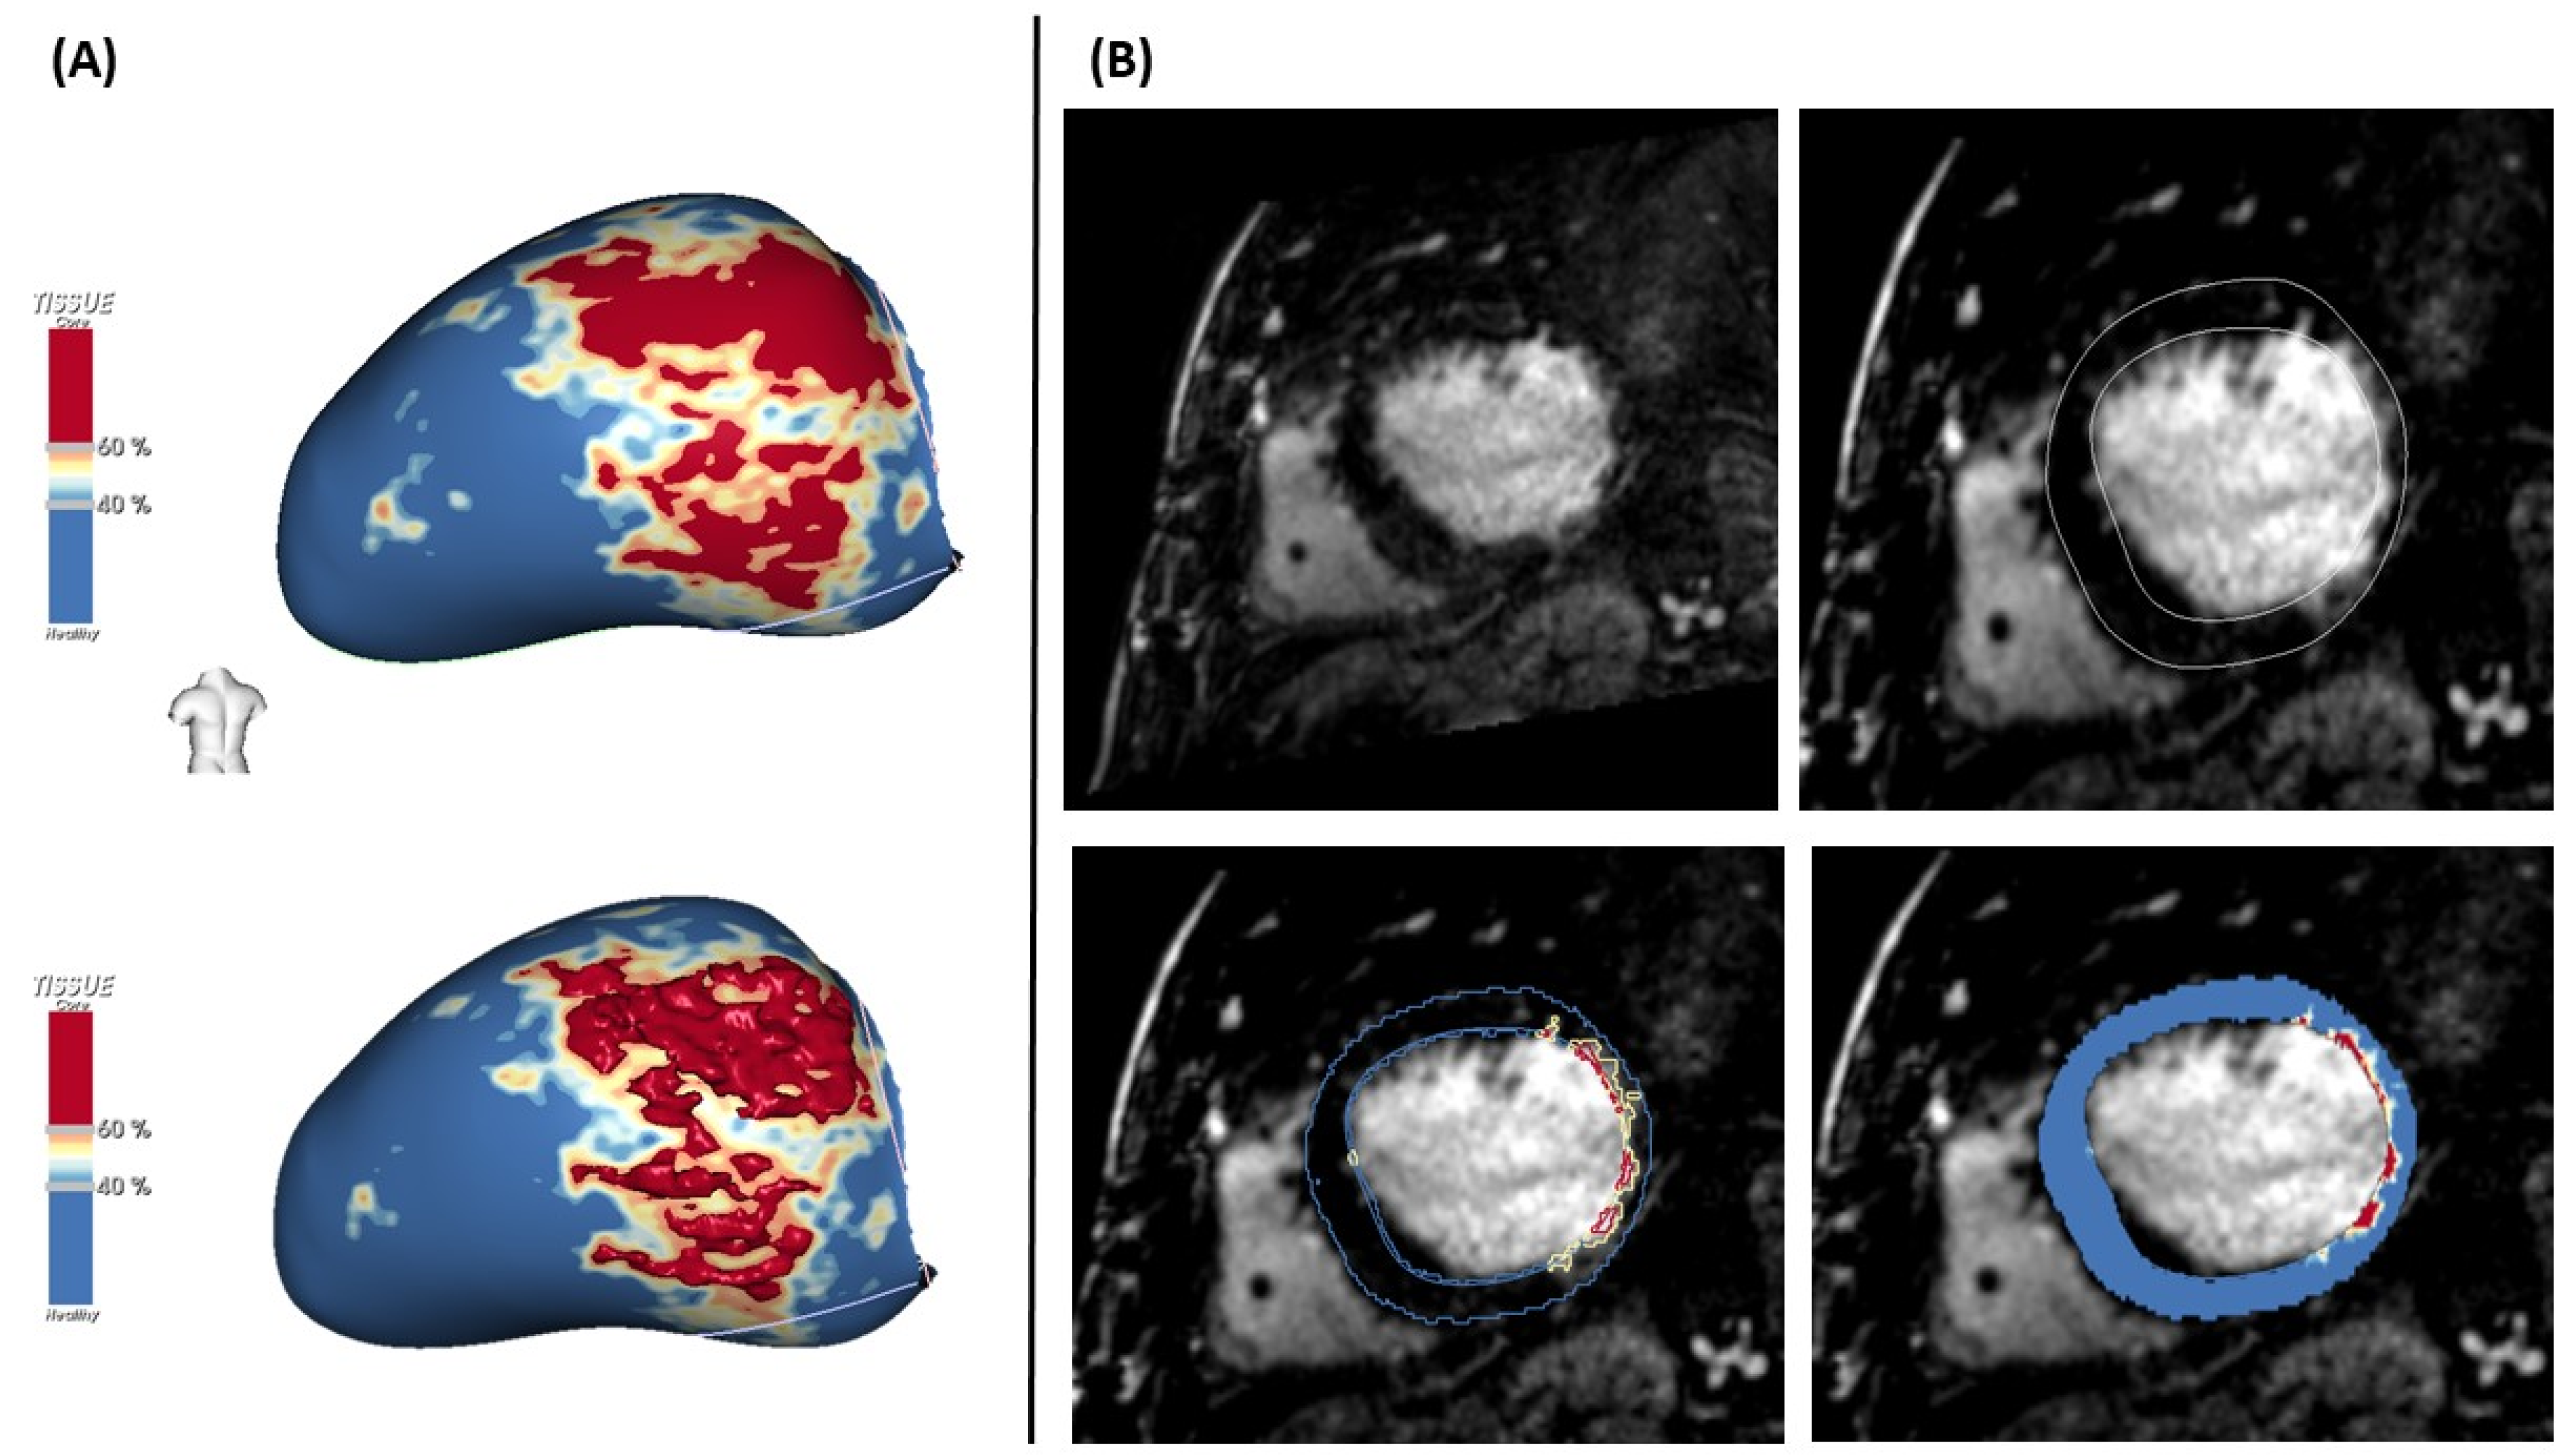
4.5. LGE-MRI for VT Ablation
5. Conclusions
6. Limitations
Author Contributions
Funding
Institutional Review Board Statement
Informed Consent Statement
Data Availability Statement
Conflicts of Interest
References
- Kim, H.W.; Farzaneh-Far, A.; Kim, R.J. Cardiovascular magnetic resonance in patients with myocardial infarction. J. Am. Coll. Cardiol. 2009, 55, 1–16. [Google Scholar] [CrossRef] [PubMed] [Green Version]
- Pontecorboli, G.; Figueras i Ventura, R.M.; Carlosena, A.; Benito, E.; Prat-Gonzales, S.; Padeletti, L.; Mont, L. Use of delayed-enhancement magnetic resonance imaging for fibrosis detection in the atria: A review. Europace 2017, 19, 180–189. [Google Scholar] [CrossRef] [PubMed]
- Hindricks, G.; Potpara, T.; Dagres, N.; Arbelo, E.; Bax, J.J.; Blomstrom-Lundqvist, C.; Boriani, G.; Castella, M.; Dan, G.A.; Dilaveris, P.E.; et al. ESC guidelines for the diagnosis and management of atrial fibrillation developed in collaboration with the European Association of Cardio-Thoracic Surgery (EACTS). Eur. Heart J. 2021, 42, 373–498. [Google Scholar] [CrossRef] [PubMed]
- Cronin, E.M.; Bogun, F.M.; Maury, P.; Peichl, P.; Chen, M.; Namboodiri, N.; Aguinaga, L.; Leite, L.R.; Al-Khatib, S.; Anter, E.; et al. 2019 HRS/EHRA/APHRS/LAHRS expert consensus statement on catheter ablation of ventricular arrhythmias: Executive summary. Europace 2020, 22, 450–495. [Google Scholar] [CrossRef]
- Berruezo, A.; Penela, D.; Jáuregui, B.; Soto-Iglesias, D. The role of imaging in catheter ablation of ventricular arrhythmias. Pacing Clin. Electrophysiol. 2021, 44, 1115–1125. [Google Scholar] [CrossRef]
- Bisbal, F.; Guiu, E.; Cabanas-Grandío, P.; Berruezo, A.; Prat-Gonzalez, S.; Vidal, B.; Garrido, C.; Andreu, D.; Fernandez-Armenta, J.; Tolosana, J.M.; et al. CMR-guided approach to localize and ablate gaps in repeat AF ablation procedure. JACC Cardiovasc. Imaging 2014, 7, 653–663. [Google Scholar] [CrossRef] [Green Version]
- Feinberg, W.M.; Blackshear, J.L.; Laupacis, A.; Kronmal, R.; Hart, R.G. Prevalence, age distribution and gender of patients with atrial fibrillation: Analysis and implications. Arch. Intern. Med. 1995, 155, 469–473. [Google Scholar] [CrossRef]
- January, C.T.; Wann, L.; Alpert, J.S.; Calkins, H.; Cigarroa, J.E.; Cleveland, J.C., Jr.; Conti, J.B.; Ellinor, P.T.; Ezekowitz, M.D.; Field, M.E.; et al. AHA/ACC/HRS guideline for the management of patients with atrial fibrillation: Executive summary: A report of the American College of Cardiology/American Heart Association Task Force on Practice Guidelines and the Heart Rhythm Society. J. Am. Coll. Cardiol. 2014, 64, 2246–2280. [Google Scholar] [CrossRef] [Green Version]
- Calkins, H.; Kuck, K.H.; Cappato, R.; Brugada, J.; Camm, A.J.; Chen, S.A. 2012 HRS/EHRA/ECAS expert consensus statement on catheter and surgical ablation of atrial fibrillation: Recommendations for patient selection, procedural techniques, patient management and follow-up, definitions, endpoints, and research trial design. Europace 2012, 14, 528–606. [Google Scholar] [CrossRef]
- John, R.M.; Tedrow, U.B.; Koplan, B.A.; Albert, C.M.; Epstein, L.M.; Sweeney, M.O.; Miller, A.L.; Michaud, G.; Stevenson, W. Ventricular arrhythmias and sudden cardiac death. Lancet 2012, 380, 1520–1529. [Google Scholar] [CrossRef]
- Tung, R.; Vaseghi, M.; Frankel, D.S.; Vergara, P.; Di Biase, L.; Nagashima, K.; Yu, R.; Vangala, S.; Tseng, C.-H.; Choi, E.-K.; et al. Freedom from recurrent ventricular tachycardia after catheter ablation is associated with improved survival in patients with structural heart disease: An International VT Ablation Center Collaborative Group study. Heart Rhythm 2015, 12, 1997–2007. [Google Scholar] [CrossRef] [Green Version]
- Dukkipati, S.R.; Koruth, J.S.; Chouddry, S.; Miller, M.A.; Whang, W.; Reddy, V.Y. Catheter ablation of ventricular. J. Am. Coll. Cardiol. 2017, 70, 2924–2941. [Google Scholar] [CrossRef]
- De Bakker, J.M.T.; Van Capelle, F.J.L.; Janse, M.J.; Wilde, A.A.M.; Coronel, R.; Becker, A.E.; Dingemans, K.P.; van Hemel, N.M.; Hauer, R.N. Reentry as a cause of ventricular tachycardia in patients with chronic ischemic heart disease: Electrophysiologic and anatomic correlation. Circulation 1988, 77, 589–606. [Google Scholar] [CrossRef] [Green Version]
- Harada, T.; Stevenson, W.G.; Kocovic, D.Z.; Friedman, P.L. Catheter ablation of ventricular tachycardia after myocardial infarction: Relation of endocardial sinus rhythm late potentials to the reentry circuit. J. Am. Coll. Cardiol. 1997, 30, 1015–1023. [Google Scholar] [CrossRef] [Green Version]
- Mountantonakis, S.E.; Park, R.E.; Frankel, D.S.; Hutchinson, M.D.; Dixit, S.; Cooper, J.; Callans, D.; Marchlinski, F.E.; Gerstenfeld, E.P. Relationship between voltage map “channels” and the location of critical isthmus sites in patients with post-infarction cardiomyopathy and ventricular tachycardia. J. Am. Coll. Cardiol. 2013, 61, 2088–2095. [Google Scholar] [CrossRef] [Green Version]
- Bogun, F.; Marine, J.E.; Oral, H.; Pelosi, F.; Morady, F. Relative timing of isolated potentials during post-infarction ventricular tachycardia and sinus rhythm. J. Interv. Card. Electrophysiol. 2004, 10, 65–72. [Google Scholar] [CrossRef]
- Arenal, A.; Glez-Torrecilla, E.; Ortiz, M.; Villacastín, J.; Fdez-Portales, J.; Sousa, E.; del Castillo, S.; de Isla, L.P.; Jimenez, J.; Almendral, J. Ablation of electrograms with an isolated, delayed component as treatment of unmappable monomorphic ventricular tachycardias in patients with structural heart disease. J. Am. Coll. Cardiol. 2003, 41, 81–92. [Google Scholar] [CrossRef] [Green Version]
- Bogun, F.; Good, E.; Reich, S.; Elmouchi, D.; Igic, P.; Lemola, K.; Tschopp, D.; Jongnarangsin, K.; Oral, H.; Chugh, A.; et al. Isolated potentials during sinus rhythm and pace-mapping within scars as guides for ablation of post-infarction ventricular tachycardia. J. Am. Coll. Cardiol. 2006, 47, 2013–2019. [Google Scholar] [CrossRef] [Green Version]
- Bertozzi, G.; Cafarelli, F.P.; Ferrara, M.; Di Fazio, N.; Guglielmi, G.; Cipolloni, L.; Manetti, F.; La Russa, R.; Fineschi, V. Sudden Cardiac Death and Ex-Situ Post-Mortem Cardiac Magnetic Resonance Imaging: A Morphological Study Based on Diagnostic Correlation Methodology. Diagnostics 2022, 12, 218. [Google Scholar] [CrossRef]
- Aziz, Z.; Shatz, D.; Raiman, M.; Upadhyay, G.A.; Beaser, A.D.; Besser, S.A. Targeted ablation of ventricular tachycardia guided by wavefront discontinuities during sinus rhythm: A new functional substrate mapping strategy. Circulation 2019, 140, 1383–1397. [Google Scholar] [CrossRef]
- Willems, S.; Tilz, R.R.; Steven, D.; Kääb, S.; Wegscheider, K.; Gellér, L.; Meyer, C.; Heeger, C.-H.; Metzner, A.; Sinner, M.F.; et al. Preventive or deferred ablation of ventricular tachycardia in patients with ischemic cardiomyopathy and implantable defibrillator (Berlin VT): A multicenter randomized trial. Circulation 2020, 2020, 1057–1067. [Google Scholar] [CrossRef] [PubMed]
- Hadjis, A.; Frontera, A.; Rosario, L.; Bisceglia, C.; Bognoni, L.; Foppoli, L.; Lipartiti, F.; Paglino, G.; Radinovic, A.; Tsitsinakis, G.; et al. Complete electroanatomic imaging of the diastolic pathway is associated with improved. Circ. Arrhythm. Electrophysiol. 2020, 2020, 927–937. [Google Scholar] [CrossRef]
- Quinto, L.; Sanchez-Somonte, P.; Alarcón, F.; Garre, P.; Castillo, À.; San Antonio, R. Ventricular tachycardia burden reduction after substrate ablation: Predictors of recurrence. Heart Rhythm 2021, 18, 896–904. [Google Scholar] [CrossRef] [PubMed]
- Kim, R.J.; Fieno, D.S.; Parrish, T.B.; Harris, K.; Chen, E.-L.; Simonetti, O.; Bundy, J.; Finn, J.P.; Klocke, F.J.; Judd, R.M. Relationship of MRI delayed contrast enhancement to irreversible injury, infarct age, and contractile function. Circulation 1999, 100, 1992–2002. [Google Scholar] [CrossRef] [Green Version]
- Bing, R.; Dweck, M.R. Myocardial fibrosis: Why image, how to image and clinical implications. Heart 2019, 105, 1832–1840. [Google Scholar] [CrossRef] [Green Version]
- Mewton, N.; Liu, C.Y.; Croisille, P. Assessment of myocardial fibrosis with cardiovascular magnetic resonance. J. Am. Coll. Cardiol. 2011, 57, 891–903. [Google Scholar] [CrossRef] [Green Version]
- Kiuchi, K.; Fukuzawa, K.; Nogami, M.; Watanabe, Y.; Takami, M.; Izawa, Y.; Negi, N.; Kyotani, K.; Mori, S.; Hirata, K.-I. Visualization of intensive atrial inflammation and fibrosis after cryoballoon ablation: PET/MRI and LGE-MRI analysis. J. Arrhythm. 2021, 37, 52–59. [Google Scholar] [CrossRef]
- Dickfeld, T.; Kato, R.; Zviman, M.; Lai, S.; Meininger, G.; Lardo, A.C.; Roguin, A.; Blumke, D.; Berger, R.; Calkins, H.; et al. Characterization of radiofrequency ablation lesions with gadolinium-enhanced cardiovascular magnetic resonance imaging. J. Am. Coll. Cardiol. 2006, 47, 370–378. [Google Scholar] [CrossRef] [Green Version]
- Benito, E.M.; Carlosena-Remirez, A.; Guasch, E. Left atrial fibrosis quantification by late gadolinium-enhanced magnetic resonance: A new method to standardize the thresholds for reproducibility. Europace 2017, 19, 1272–1279. [Google Scholar] [CrossRef]
- Oakes, R.S.; Badger, T.J.; Kholmovski, E.G. Detection and quantification of left atrial structural remodeling with delayed-enhancement magnetic resonance imaging in patients with atrial fibrillation. Circulation 2009, 119, 1758–1767. [Google Scholar] [CrossRef] [Green Version]
- Peters, D.C.; Wylie, J.V.; Hauser, T.H.; Kissinger, K.V.; Botnar, R.M.; Essebag, V.; Josephson, M.E.; Manning, W.J. Detection of pulmonary vein and left atrial scar after catheter ablation with three-dimensional navigator-gated delayed enhancement MR imaging: Initial experience. Radiology 2007, 243, 690–695. [Google Scholar] [CrossRef]
- Vijayakumar, S.; Kholmovski, E.; McGann, C.; Marrouche, N.F. Dependence of contrast to noise ratio between ablation scar and other tissues on patient heart rate and flip angle for late gadolinium enhancement imaging of the left atrium. J. Cardiovasc. Magn. Reson. 2012, 14 (Suppl. S1), O107. [Google Scholar] [CrossRef] [Green Version]
- Do, D.H.; Eyvazian, V.; Bayoneta, A.J.; Hu, P.; Finn, J.P.; Bradfield, J.S. Cardiac magnetic resonance imaging using wideband sequences in patients with non-conditional cardiac implanted electronic devices. Heart Rhythm 2018, 15, 218–225. [Google Scholar] [CrossRef]
- Seewoster, T.; Lobe, S.; Hilbert, S.; Bollmann, A.; Sommer, P.; Lindemann, F.; Bacevičius, J.; Schöne, K.; Richter, S.; Döring, M.; et al. Cardiovascular magnetic resonance imaging in patients with cardiac implantable electronic devices: Best practice and real-world experience. Europace 2019, 19, 818–823. [Google Scholar] [CrossRef]
- Flett, A.S.; Hasleton, J.; Cook, C.; Hausenloy, D.; Quarta, G.; Ariti, C.; Muthurangu, V.; Moon, J.C. Evaluation of techniques for the quantification of myocardial scar of differing etiology using cardiac magnetic resonance. JACC Cardiovasc. Imaging 2011, 4, 150–156. [Google Scholar] [CrossRef] [Green Version]
- Dickfeld, T.; Tian, J.; Ahmad, G.; Jimenez, A.; Turgeman, A.; Kuk, R.; Peters, M.; Saliaris, A.; Saba, M.; Shorofsky, S.; et al. MRI-guided ventricular tachycardia ablation: Integration of late gadoliniumenhanced 3D scar in patients with implantable cardioverterdefibrillators. Circ. Arrhythm. Electrophysiol. 2011, 4, 172–184. [Google Scholar] [CrossRef]
- Sasaki, T.; Hansford, R.; Zviman, M.M. Quantitative assessment of artifacts on cardiac magnetic resonance imaging of patients with pacemakers and implantable cardioverter-defibrillators. Circ. Cardiovasc. Imaging 2011, 4, 662–670. [Google Scholar] [CrossRef] [Green Version]
- Rashid, S.; Rapacchi, S.; Shivkumar, K.; Plotnik, A.; Finn, J.P.; Hu, P. Modified wideband three-dimensional late gadolinium enhancement MRI for patients with implantable cardiac devices. Magn. Reson. Med. 2016, 75, 572–584. [Google Scholar] [CrossRef] [Green Version]
- Rashid, S.; Rapacchi, S.; Vaseghi, M. Improved late gadolinium enhancement MR imaging for patients with implanted cardiac devices. Radiology 2014, 270, 269–274. [Google Scholar] [CrossRef]
- Bhuva, A.N.; Kellman, P.; Graham, A.; Ramlall, M.; Boubertakh, R.; Feuchter, P.; Hawkins, A.; Lowe, M.; Lambiase, P.D.; Sekhri, N.; et al. Clinical impact of cardiovascular magnetic resonance with optimized myocardial scar detection in patients with cardiac implantable devices. Int. J. Cardiol. 2019, 15, 72–78. [Google Scholar] [CrossRef] [Green Version]
- Hilbert, S.; Weber, A.; Nehrke, K.; Bornert, P.; Schnackenburg, B.; Oebel, S. Artefact-free late gadolinium enhancement imaging in patients with implanted cardiac devices using a modified broadband sequence: Current strategies and results from a real-world patient cohort. Europace 2018, 20, 801–807. [Google Scholar] [CrossRef] [PubMed]
- Roca-Luque, I.; Van Breukelen, A.; Alarcon, F.; Garre, P.; Tolosana, J.M.; Borras, R. Ventricular scar channel entrances identified by new wideband cardiac magnetic resonance sequence to guide ventricular tachycardia ablation in patients with cardiac defibrillators. Europace 2020, 22, 598–606. [Google Scholar] [CrossRef] [PubMed]
- James, L.H.; Henrik, K.J.; Sarah, A.P.; Amedeo, C.; Anne, K.G.; Lars, Ø.B.; Steen, F.; Pedersen, J.F.; Bentzon, C.K.; Rashed, K.; et al. Cardiac magnetic resonance and electroanatomical mapping of acute and chronic atrial ablation injury: A histological validation study. Eur. Heart J. 2014, 35, 1486–1495. [Google Scholar] [CrossRef] [Green Version]
- Harrison, J.L.; Sohns, C.; Linton, N.W.; Karim, R.; Williams, S.E.; Rhode, K.S.; Gill, J.; Cooklin, M.; Rinaldi, C.A.; Wright, M.; et al. Repeat left atrial catheter ablation: Cardiac magnetic resonance prediction of endocardial voltage and gaps in ablation lesion sets. Circ. Arrhythm. Electrophysiol. 2015, 8, 270–278. [Google Scholar] [CrossRef] [PubMed] [Green Version]
- Kurose, J.; Kiuchi, K.; Fukuzawa, K. Lesion characteristics between cryoballoon ablation and radiofrequency ablation with a contact-force sensing catheter: Late-gadolinium enhancement magnetic resonance imaging assessment. J. Cardiovasc. Electrophysiol. 2020, 31, 2572–2581. [Google Scholar] [CrossRef]
- Dewire, J.; Khurram, I.M.; Pashakhanloo, F.; Spragg, D.; Marine, J.E.; Berger, R.D. The association of pre-existing left atrial fibrosis with clinical variables in patients referred for catheter ablation of atrial fibrillation. Clin. Med. Insights Cardiol. 2014, 8 (Suppl. S1), 25–30. [Google Scholar] [CrossRef] [Green Version]
- Khurram, I.M.; Beinart, R.; Zipunnikov, V.; Dewire, J.; Yarmohammadi, H.; Sasaki, T.; Spragg, D.D.; Marine, J.E.; Berger, R.D.; Halperin, H.R.; et al. Magnetic resonance image intensity ratio, a normalized measure to enable interpatient comparability of left atrial fibrosis. Heart Rhythm 2014, 11, 85–92. [Google Scholar] [CrossRef] [Green Version]
- Quinto, L.; Cozzari, J.; Benito, E.; Alarcón, F.; Bisbal, F.; Trotta, O.; Caixal, G.; Antonio, R.S.; Garre, P.; Prat-Gonzalez, S.; et al. Magnetic resonance guided re-ablation for atrial fibrillation is associated with a lower recurrence rate: A case-control study. Europace 2020, 22, 1805–1811. [Google Scholar] [CrossRef]
- Fochler, F.; Yamaguchi, T.; Kheirkahan, M. Late gadolinium enhancement magnetic resonance imaging guided treatment of post atrial fibrillation ablation recurrent arrhythmia. Circ. Arrhythm. Electrophysiol. 2019, 12, e007174. [Google Scholar] [CrossRef]
- Amado, L.; Gerber, B.; Gupta, S.; Rettmann, D.; Szarf, G.; Schock, R.; Nasir, K.; Kraitchman, D.; Lima, J. Accurate and objective infarct sizing by contrastenhanced magnetic resonance imaging in a canine myocardial infarction model. J. Am. Coll. Cardiol. 2004, 44, 2383–2389. [Google Scholar] [CrossRef] [Green Version]
- Yan, A.T.; Shayne, A.J.; Brown, K.A.; Gupta, S.N.; Chan, C.W.; Luu, T.M.; Di Carli, M.F.; Reynolds, H.G.; Stevenson, W.G.; Kwong, R.Y. Characterization of the peri-infarct zone by contrast-enhanced cardiac magnetic resonance imaging is a powerful predictor of postmyocardial infarction mortality. Circulation 2006, 114, 32–39. [Google Scholar] [CrossRef] [Green Version]
- Andreu, D.; Berruezo, A.; Ortiz-Pérez, J.T.; Silva, E.; Mont, L.; Borràs, R.; de Caralt, T.M.; Perea, R.J.; Fernández-Armenta, J.; Zeljko, H.; et al. Integration of 3D electroanatomic maps and magnetic resonance scar characterization into the navigation system to guide ventricular tachycardia ablation. Circ. Arrhythm. Electrophysiol. 2011, 4, 674–683. [Google Scholar] [CrossRef] [Green Version]
- Fernandez-Armenta, J.; Berruezo, A.; Andreu, D. Threedimensional architecture of scar and conducting channels based on high resolution ce-CMR: Insights for ventricular tachycardia ablation. Circ. Arrhythm. Electrophysiol. 2013, 6, 528–537. [Google Scholar] [CrossRef] [Green Version]
- Cochet, H.; Komatsu, Y.; Sacher, F. Integration of merged delayed-enhanced magnetic resonance imaging and multidetector computed tomography for the guidance of ventricular tachycardia ablation: A pilot study. J. Cardiovasc. Electrophysiol. 2013, 24, 419–426. [Google Scholar] [CrossRef]
- Roca-Luque, I.; Rivas-Gándara, N.; Francisco-Pascual, J.; Rodriguez-Sanchez, J.; Cuellar-Calabria, H.; Rodriguez-Palomares, J.; García-Del Blanco, B.; Pérez-Rodon, J.; Santos-Ortega, A.; Rosés-Noguer, F.; et al. Preprocedural imaging to guide transcoronary ethanol ablation for refractory septal ventricular tachycardia. J. Cardiovasc. Electrophysiol. 2019, 30, 448–456. [Google Scholar] [CrossRef]
- Ronneberger, O.; Fischer, P.; Brox, T. U-Net: Convolutional networks for biomedical image segmentation. In Medical Image Computing and Computer-Assisted Intervention—MICCAI 2015; Lecture Notes in Computer Science; Navab, N., Hornegger, J., Wells, W., Frangi, A., Eds.; Springer: Cham, Switzerland, 2015; Volume 9351, pp. 234–241. [Google Scholar] [CrossRef] [Green Version]
- Goodfellow, I.; Bengio, Y.; Courville, A. Deep Learning; MIT Press: Cambridge, MA, USA, 2016. [Google Scholar]
- Gupta, S.; Desjardins, B.; Baman, T.; Ilg, K.; Good, E.; Crawford, T.; Oral, H.; Pelosi, F.; Chugh, A.; Morady, F.; et al. Delayed-enhanced MR scar imaging and intraprocedural registration into an electroanatomical mapping system in post-infarction patients. JACC Cardiovasc. Imaging 2012, 5, 207–210. [Google Scholar] [CrossRef] [Green Version]
- Bogun, F.M.; Desjardins, B.; Good, E.; Gupta, S.; Crawford, T.; Oral, H.; Ebinger, M.; Pelosi, F.; Chugh, A.; Jongnarangsin, K.; et al. Delayed-enhanced magnetic resonance imaging in nonischemic cardiomyopathy: Utility for identifying the ventricular arrhythmia substrate. J. Am. Coll. Cardiol. 2009, 53, 1138–1145. [Google Scholar] [CrossRef] [Green Version]
- Takigawa, M.; Relan, J.; Martin, R.; Kim, S.; Kitamura, T.; Frontera, A.; Cheniti, G.; Vlachos, K.; Massoullié, G.; Martin, C.A.; et al. Effect of bipolar electrode orientation on local electrogram properties. Heart Rhythm 2018, 15, 1853–1861. [Google Scholar] [CrossRef]
- Kumar, S.; Tedrow, U.B.; Stevenson, W.G. Adjunctive interventional techniques when percutaneous catheter ablation for drug refractory ventricular arrhythmias fail: A contemporary review. Circ. Arrhythm. Electrophysiol. 2017, 10, e003676. [Google Scholar] [CrossRef]
- Weinsaft, J.W.; Kim, H.W.; Shah, D.J.; Klem, I.; Crowley, A.L.; Brosnan, R.; James, O.G.; Patel, M.R.; Heitner, J.; Parker, M.; et al. Detection of left ventricular thrombus by delayed-enhancement cardiovascular magnetic resonance prevalence and markers in patients with systolic dysfunction. J. Am. Coll. Cardiol. 2008, 52, 148–157. [Google Scholar] [CrossRef] [Green Version]
- Weinsaft, J.W.; Kim, R.J.; Ross, M.; Krauser, D.; Manoushagian, S.; LaBounty, T.M.; Cham, M.D.; Min, J.K.; Healy, K.; Wang, Y.; et al. Contrast-enhanced anatomic imaging as compared to contrast enhanced tissue characterization for detection of left ventricular thrombus. JACC Cardiovasc. Imaging 2009, 2, 969–979. [Google Scholar] [CrossRef] [PubMed] [Green Version]
- Stevenson, W.G.; Delacretaz, E.; Friedman, P.L. Identification and ablation of macroreentrant ventricular tachycardia with the CARTO electroanatomical mapping system. Pacing Clin. Electrophysiol. 1998, 21, 1448. [Google Scholar] [CrossRef] [PubMed]
- Marchlinski, F.E.; Callans, D.J.; Gottlieb, C.D.; Zado, E. Linear ablation lesions for control of un-mappable ventricular tachycardia in patients with ischemic and nonischemic cardiomyopathy. Circulation 2000, 101, 1288. [Google Scholar] [CrossRef] [PubMed] [Green Version]
- Wijnmaalen, A.P.; van der Geest, R.J.; van Huls van Taxis, C.F.B.; Siebelink, H.M.J.; Kroft, L.J.M.; Bax, J.J.; Reiber, J.H.; Schalij, M.J.; Zeppenfeld, K. Head-to-head comparison of contrast-enhanced magnetic resonance imaging and electroanatomical voltage mapping to assess post-infarct scar characteristics in patients with ventricular tachycardias: Real-time image integration and reversed registration. Eur. Heart J. 2011, 32, 104–114. [Google Scholar] [CrossRef] [Green Version]
- Vázquez-Calvo, S.; Garre, P.; Sánchez-Somonte, P. Orthogonal high density mapping with VT isthmus analysis vs. pure substrate VT ablation: A case-control study. Front. Cardiovasc. Med. 2022, 9, 912335. [Google Scholar] [CrossRef]
- Yamashita, S.; Sacher, F.; Mahida, S.; Berte, B.; Lim, H.S.; Komatsu, Y.; Amraoui, S.; Denis, A.; Derval, N.; Laurent, F.; et al. Role of high-resolution image integration to visualize left phrenic nerve and coronary arteries during epicardial ventricular tachycardia ablation. Circ. Arrhythm. Electrophysiol. 2015, 8, 371–380. [Google Scholar] [CrossRef] [Green Version]
- Linhart, M.; Alarcon, F.; Borras, R. Delayed gadolinium enhancement magnetic resonance imaging detected anatomic gap length in wide circumferential pulmonary vein ablation lesions is associated with recurrence of atrial fibrillation. Circ. Arrhythm. Electrophysiol. 2018, 11, e006659. [Google Scholar] [CrossRef]
- Chelu, M.G.; King, J.B.; Kholmovski, E.G.; Ma, J.; Gal, P.; Marashly, Q.; AlJuaid, M.A.; Kaur, G.; Silver, M.A.; Johnson, K.A.; et al. Atrial fibrosis by late gadolinium enhancement magnetic resonance imaging and catheter ablation of atrial fibrillation: 5-year follow-up data. J. Am. Heart Assoc. 2018, 7, e006313. [Google Scholar] [CrossRef] [Green Version]
- Khurram, I.M.; Habibi, M.; Gucuk Ipek, E.; Chrispin, J.; Yang, E.; Fukumoto, K.; Dewire, J.; Spragg, D.D.; Marine, J.E.; Berger, R.D.; et al. Left atrial LGE and arrhythmia recurrence following pulmonary vein isolation for paroxysmal and persistent AF. JACC Cardiovasc. Imaging 2016, 9, 142–148. [Google Scholar] [CrossRef]
- Marrouche, N.F.; Wilber, D.; Hindricks, G.; Jais, P.; Akoum, N.; Marchlinski, F.; Kholmovski, E.; Burgon, N.; Hu, N.; Mont, L.; et al. Association of atrial tissue fibrosis identified by delayed enhancement MRI and atrial fibrillation catheter ablation: The DECAAF study. JAMA 2014, 311, 498–506. [Google Scholar] [CrossRef]
- Marrouche, N.F.; Wazni, O.; McGann, C.; Greene, T.; Dean, J.M.; Dagher, L.; Kholmovski, E.; Mansour, M.; Marchlinski, F.; Wilber, D.; et al. Effect of MRI-Guided Fibrosis Ablation vs Conventional Catheter Ablation on Atrial Arrhythmia Recurrence in Patients with Persistent Atrial Fibrillation: The DECAAF II Randomized Clinical Trial. JAMA 2022, 327, 2296–2305. [Google Scholar] [CrossRef]
- Bisbal, F.; Benito, E.; Teis, A.; Alarcón, F.; Sarrias, A.; Caixal, G.; Villuendas, R.; Garre, P.; Soto, N.; Cozzari, J.; et al. Magnetic Resonance Imaging-Guided Fibrosis Ablation for the Treatment of Atrial Fibrillation: The ALICIA Trial. Circ. Arrhythm. Electrophysiol. 2020, 13, e008707. [Google Scholar] [CrossRef]
- Badger, T.J.; Daccarett, M.; Akoum, N.W. Evaluation of left atrial lesions after initial and repeat atrial fibrillation ablation: Lessons learned from delayed-enhancement MRI in repeat ablation procedures. Circ. Arrhythm. Electrophysiol. 2010, 3, 249–259. [Google Scholar] [CrossRef] [Green Version]
- Chubb, H.; Aziz, S.; Karim, R. Optimization of late gadolinium enhancement cardiovascular magnetic resonance imaging of post-ablation atrial scar: A cross-over study. J. Cardiovasc. Magn. Reson. 2018, 20, 30. [Google Scholar] [CrossRef] [Green Version]
- Desjardins, B.; Crawford, T.; Good, E.; Oral, H.; Chugh, A.; Pelosi, F.; Morady, F.; Bogun, F. Infarct architecture and characteristics on delayed enhanced magnetic resonance imaging and electroanatomic mapping in patients with postinfarction ventricular arrhythmia. Heart Rhythm 2009, 6, 644–651. [Google Scholar] [CrossRef] [Green Version]
- Piers, S.R.D.; Tao, Q.; De Riva Silva, M.; Siebelink, H.M.; Schalij, M.J.; Van Der Geest, R.J.; Zeppenfeld, K. CMR-based identification of critical isthmus sites of ischemic and nonischemic ventricular tachycardia. JACC Cardiovasc. Imaging 2014, 7, 774–784. [Google Scholar] [CrossRef] [Green Version]
- Andreu, D.; Ortiz-Perez, J.T.; Boussy, T.; Fernandez-Armenta, J.; Caralt, T.M.; Perea, R.J. Usefulness of contrast-enhanced cardiac magnetic resonance in identifying the ventricular arrhythmia substrate and the approach needed for ablation. Eur. Heart. J. 2014, 35, 1316–1326. [Google Scholar] [CrossRef] [Green Version]
- Acosta, J.; Fernández-Armenta, J.; Penela, D.; Andreu, D.; Borras, R.; Vassanelli, F.; Korshunov, V.; Perea, R.J.; de Caralt, T.M.; Ortiz, J.T.; et al. Infarct transmurality as a criterion for first-line endo-epicardial substrate-guided ventricular tachycardia ablation in ischemic cardiomyopathy. Heart Rhythm 2016, 13, 85–95. [Google Scholar] [CrossRef] [Green Version]
- Quinto, L.; Sanchez, P.; Alarco, F.; Garre, P.; Zaraket, F.; Prat-gonzalez, S. Cardiac magnetic resonance to predict recurrences after ventricular tachycardia ablation: Septal involvement, transmural channels, and left ventricular mass. Europace 2021, 23, 1437–1445. [Google Scholar] [CrossRef]
- Ávila, P.; Pérez-David, E.; Izquierdo, M.; Rojas-González, A.; Sánchez-Gómez, J.M.; Ledesma-Carbayo, M.J. Scar extension measured by magnetic resonancebased nal intensity mapping predicts ventricular tachycardia recurrence after substrate ablation in patients with previous myocardial infarction. JACC Clin. Electrophysiol. 2015, 1, 353–365. [Google Scholar] [CrossRef]
- Nishimura, T.; Patel, H.N.; Wang, S.; Upadhyay, G.A.; Smith, H.L.; Ozcan, C. Prognostic value of cardiac magnetic resonance septal late gadolinium enhancement patterns for periaortic ventricular tachycardia ablation: Heterogeneity of the anteroseptal substrate in nonischemic cardiomyopathy. Heart Rhythm 2021, 18, 579–588. [Google Scholar] [CrossRef] [PubMed]
- Ghafoori, E.; Kholmovski, E.; Thomas, S.; Silvernagel, J.; Nathan, A.; Nan, H. Characterization of gadolinium contrast enhancement of radiofrequency ablation lesions in predicting edema and chronic lesion size. Circ. Arrhythm. Electrophysiol. 2017, 10, e005599. [Google Scholar] [CrossRef] [PubMed]
- Dabbagh, G.S.; Ghannam, M.; Siontis, K.C.; Attili, A.; Cochet, H.; Jais, P.; Eng, M.J.; Latchamsetty, R.; Jongnarangsin, K.; Morady, F.; et al. Magnetic resonance mapping of cathter ablation lesions after postinfarction ventricular tachycardia ablation. JACC Cardiovasc. Imaging 2021, 14, 588–598. [Google Scholar] [CrossRef]


| Reference | Model | n | Reference for Normalization | Defined Thresholds | |
|---|---|---|---|---|---|
| Atrial Fibrosis | Peters et al., 2007 [31] | Human | 23 | LA blood pool signal intensity | “Minimum threshold which eliminates most left atrial blood pool pixels” |
| Oakes et al., 2009 [30] | Human | 81 | Normal tissue | Mean signal intensity (normal tissue) + (2–4) SD | |
| Khurram et al., 2014 [47] | Human | 75 | Mean LA blood pool signal intensity | Fixed IIR threshold: upper limit of normal > 0.97 and dense scar > 1.6 | |
| Harrison et al., 2014 [43] | Animal | 16 | Mean LA blood pool signal intensity | “2.3 SD for LGE post ablation and 3.3 SD for LGE chronically” | |
| Dewire et al., 2014 [46] | Human | 60 | Mean LA blood pool signal intensity | Universal threshold (abnormal myocardium: IIR > 0.97 and <1.61; dense scar: IIR > 1.61) | |
| Harrison et al., 2015 [44] | Human | 20 | Mean LA blood pool signal intensity | No universal threshold. Visualization of signal intensities in SD from reference | |
| Benito el al., 2017 [29] | Human | 40 | Mean LA blood pool signal intensity | Fixed IIR threshold: upper limit of normal = 1.2 and dense scar > 1.32 | |
| Kurose et al., 2020 [45] | Human | 30 | Healthy atrial wall | >2 SDs above the mean of healthy left atrium wall | |
| LV Fibrosis | Amado et al., 2004 [50] | Animal | 13 | Healthy myocardial segment | Mean signal intensity (noninfarcted myocardium region) + (1–6 SD) |
| Yan et al., 2006 [51] | Human | 144 | Healthy myocardial segment | BZ: 2–3 SDs and scar > 3 SDs above remote myocardium | |
| Andreu et al., 2011 [52] | Human | 12 | Maximal myocardial signal | Scar > 60% of maximal signal intensity | |
| Fernandez-Armenta et al., 2013 [53] | Human | 21 | Maximal myocardial signal | Healthy tissue < 40%, BZ: 40–60% and scar > 60% of maximal signal intensity | |
| Cochet et al., 2013 [54] | Human | 9 | Maximal myocardial signal | BZ: 35–50% and scar > 50% of maximal signal intensity |
Disclaimer/Publisher’s Note: The statements, opinions and data contained in all publications are solely those of the individual author(s) and contributor(s) and not of MDPI and/or the editor(s). MDPI and/or the editor(s) disclaim responsibility for any injury to people or property resulting from any ideas, methods, instructions or products referred to in the content. |
© 2023 by the authors. Licensee MDPI, Basel, Switzerland. This article is an open access article distributed under the terms and conditions of the Creative Commons Attribution (CC BY) license (https://creativecommons.org/licenses/by/4.0/).
Share and Cite
Garre, P.; Vázquez-Calvo, S.; Ferro, E.; Althoff, T.; Roca-Luque, I. Impact of LGE-MRI in Arrhythmia Ablation. Appl. Sci. 2023, 13, 3862. https://doi.org/10.3390/app13063862
Garre P, Vázquez-Calvo S, Ferro E, Althoff T, Roca-Luque I. Impact of LGE-MRI in Arrhythmia Ablation. Applied Sciences. 2023; 13(6):3862. https://doi.org/10.3390/app13063862
Chicago/Turabian StyleGarre, Paz, Sara Vázquez-Calvo, Elisenda Ferro, Till Althoff, and Ivo Roca-Luque. 2023. "Impact of LGE-MRI in Arrhythmia Ablation" Applied Sciences 13, no. 6: 3862. https://doi.org/10.3390/app13063862