
Theoretical Prediction of Impact Force Acting on Derailment Containment Provisions (DCPs)


Abstract
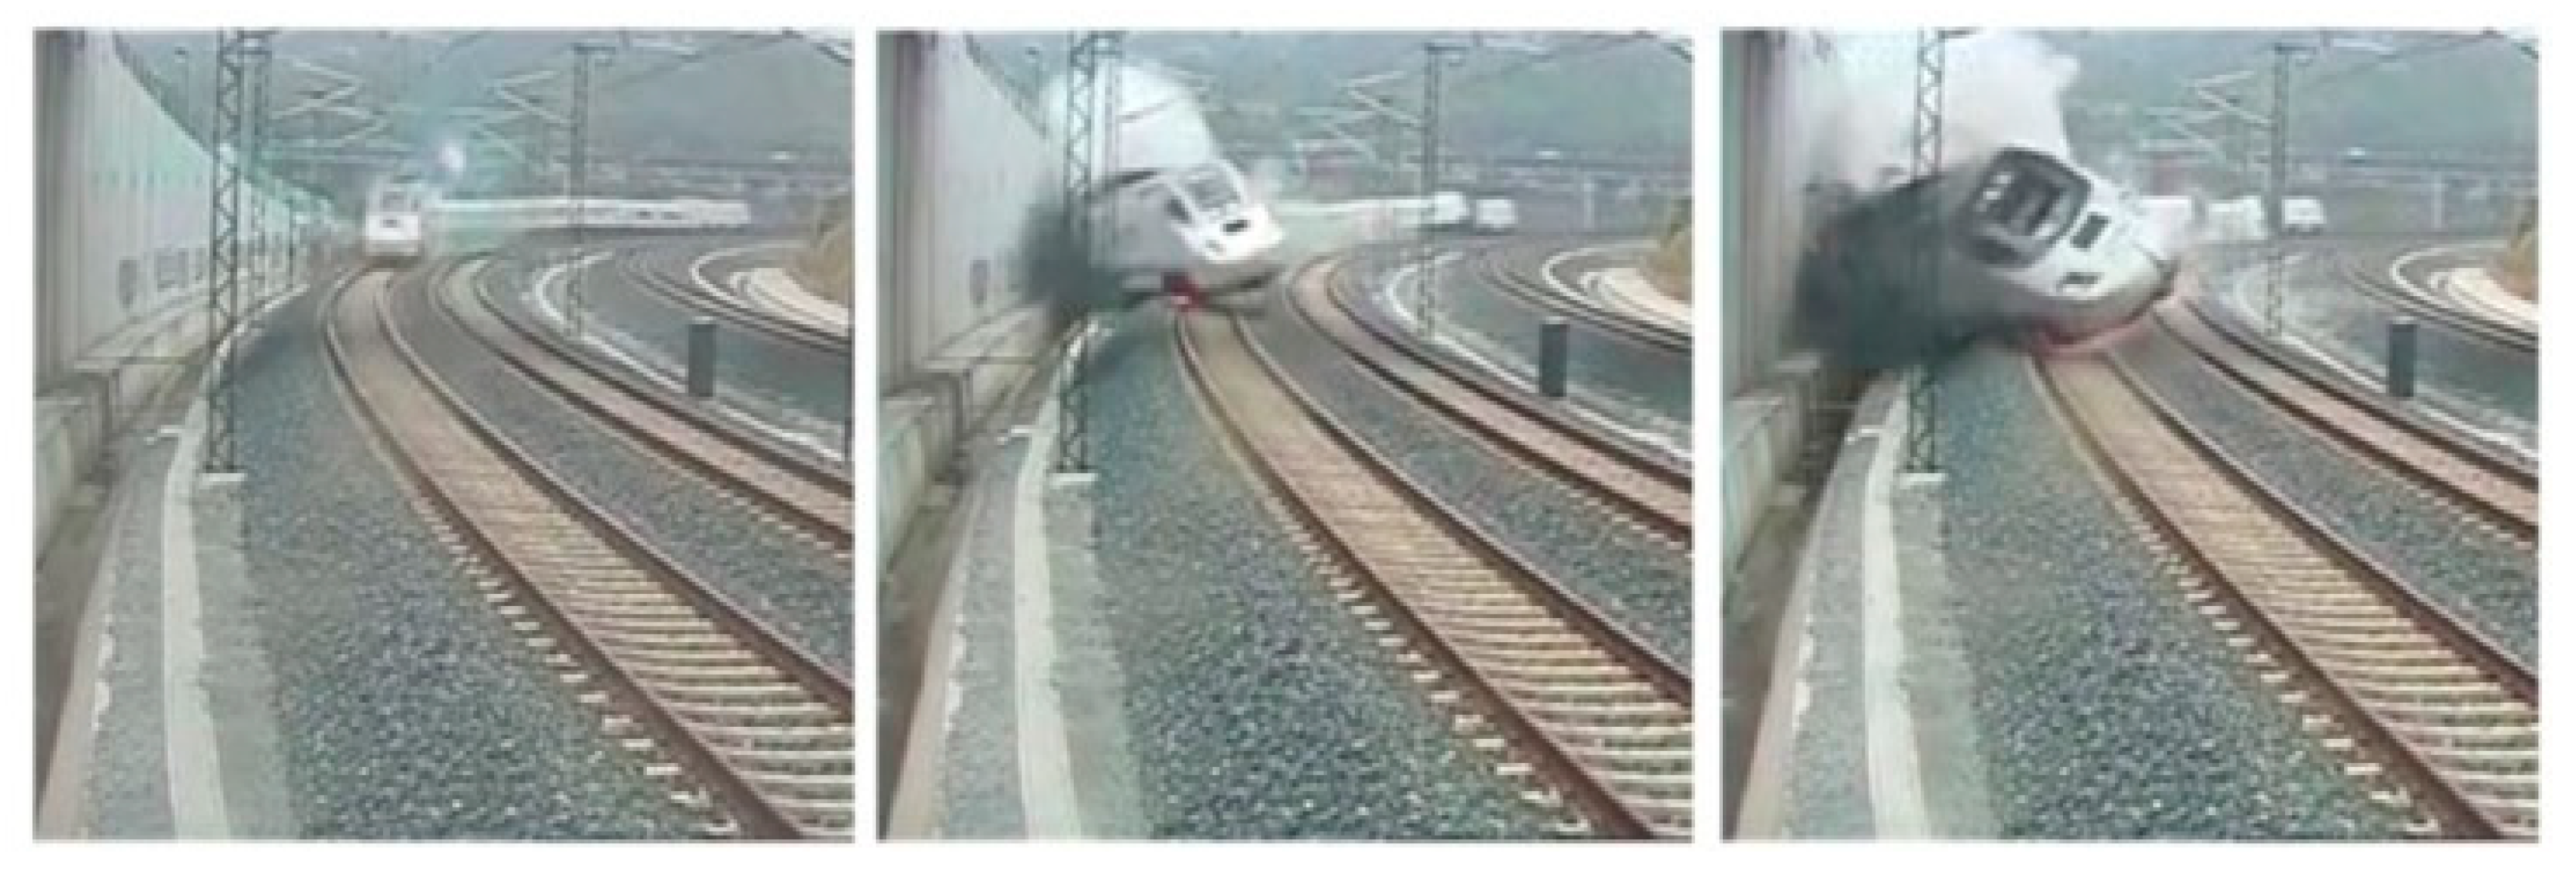
:1. Introduction
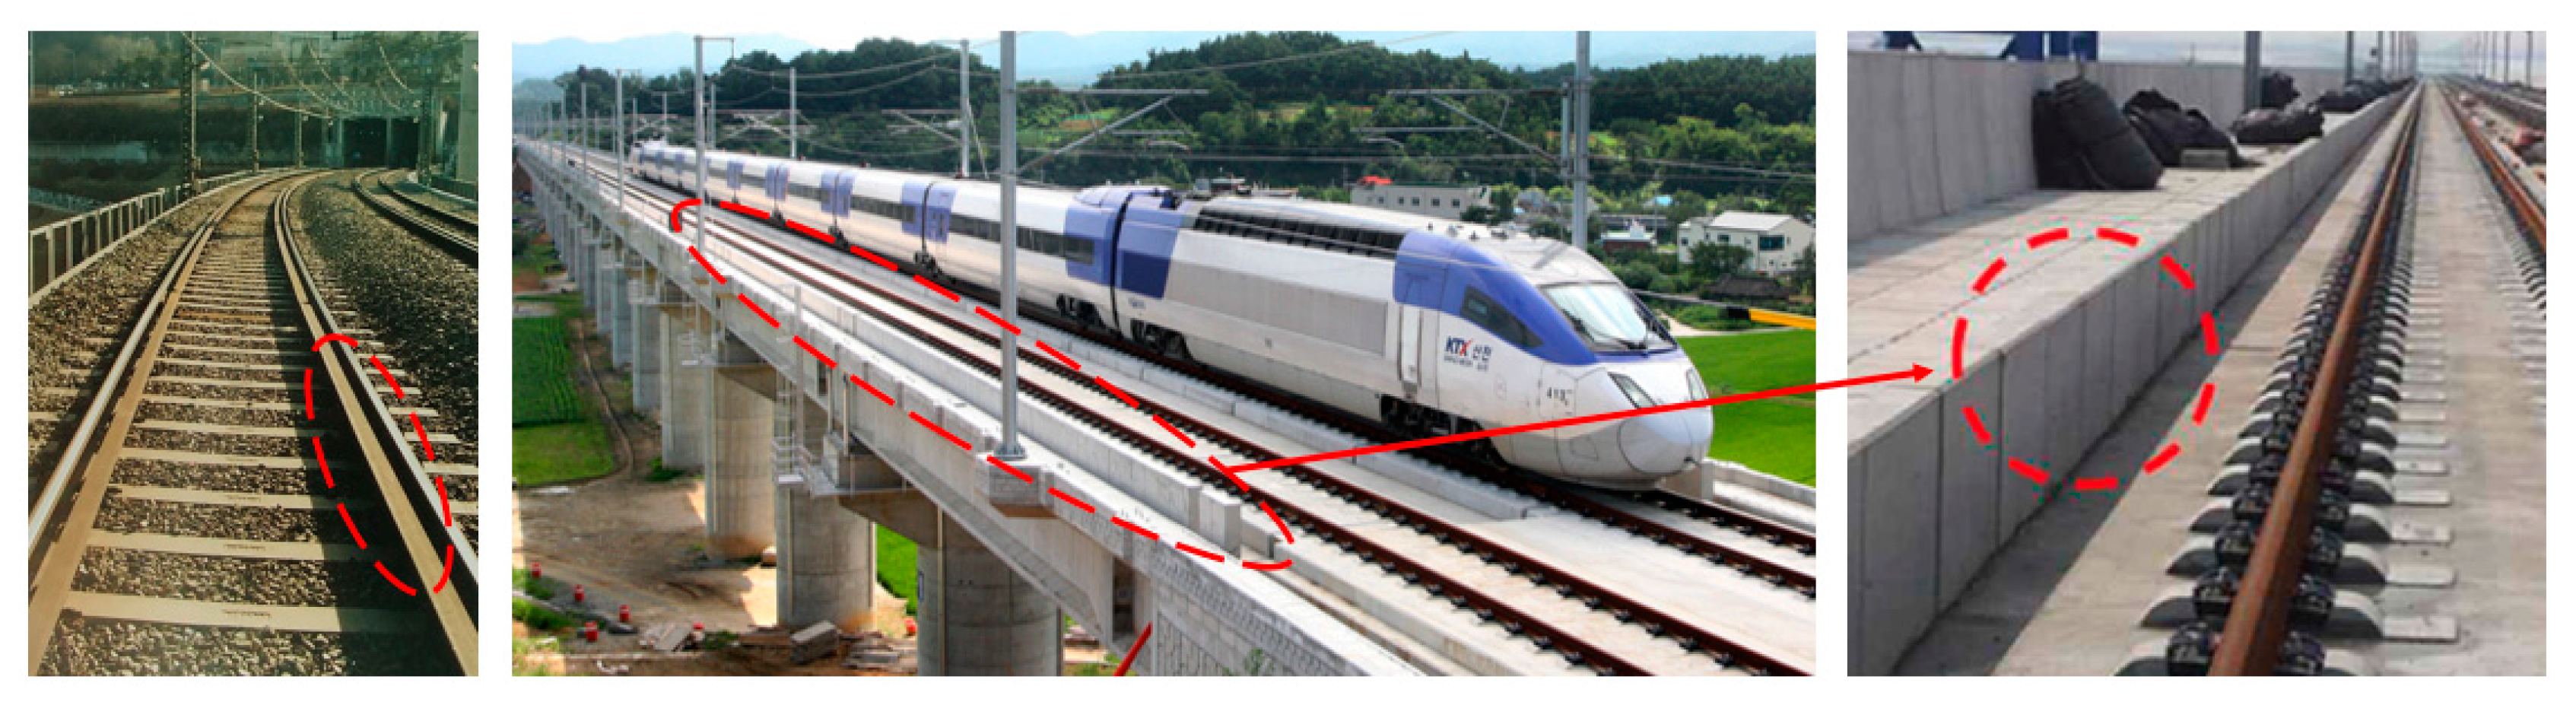
2. Introduction to DCPs
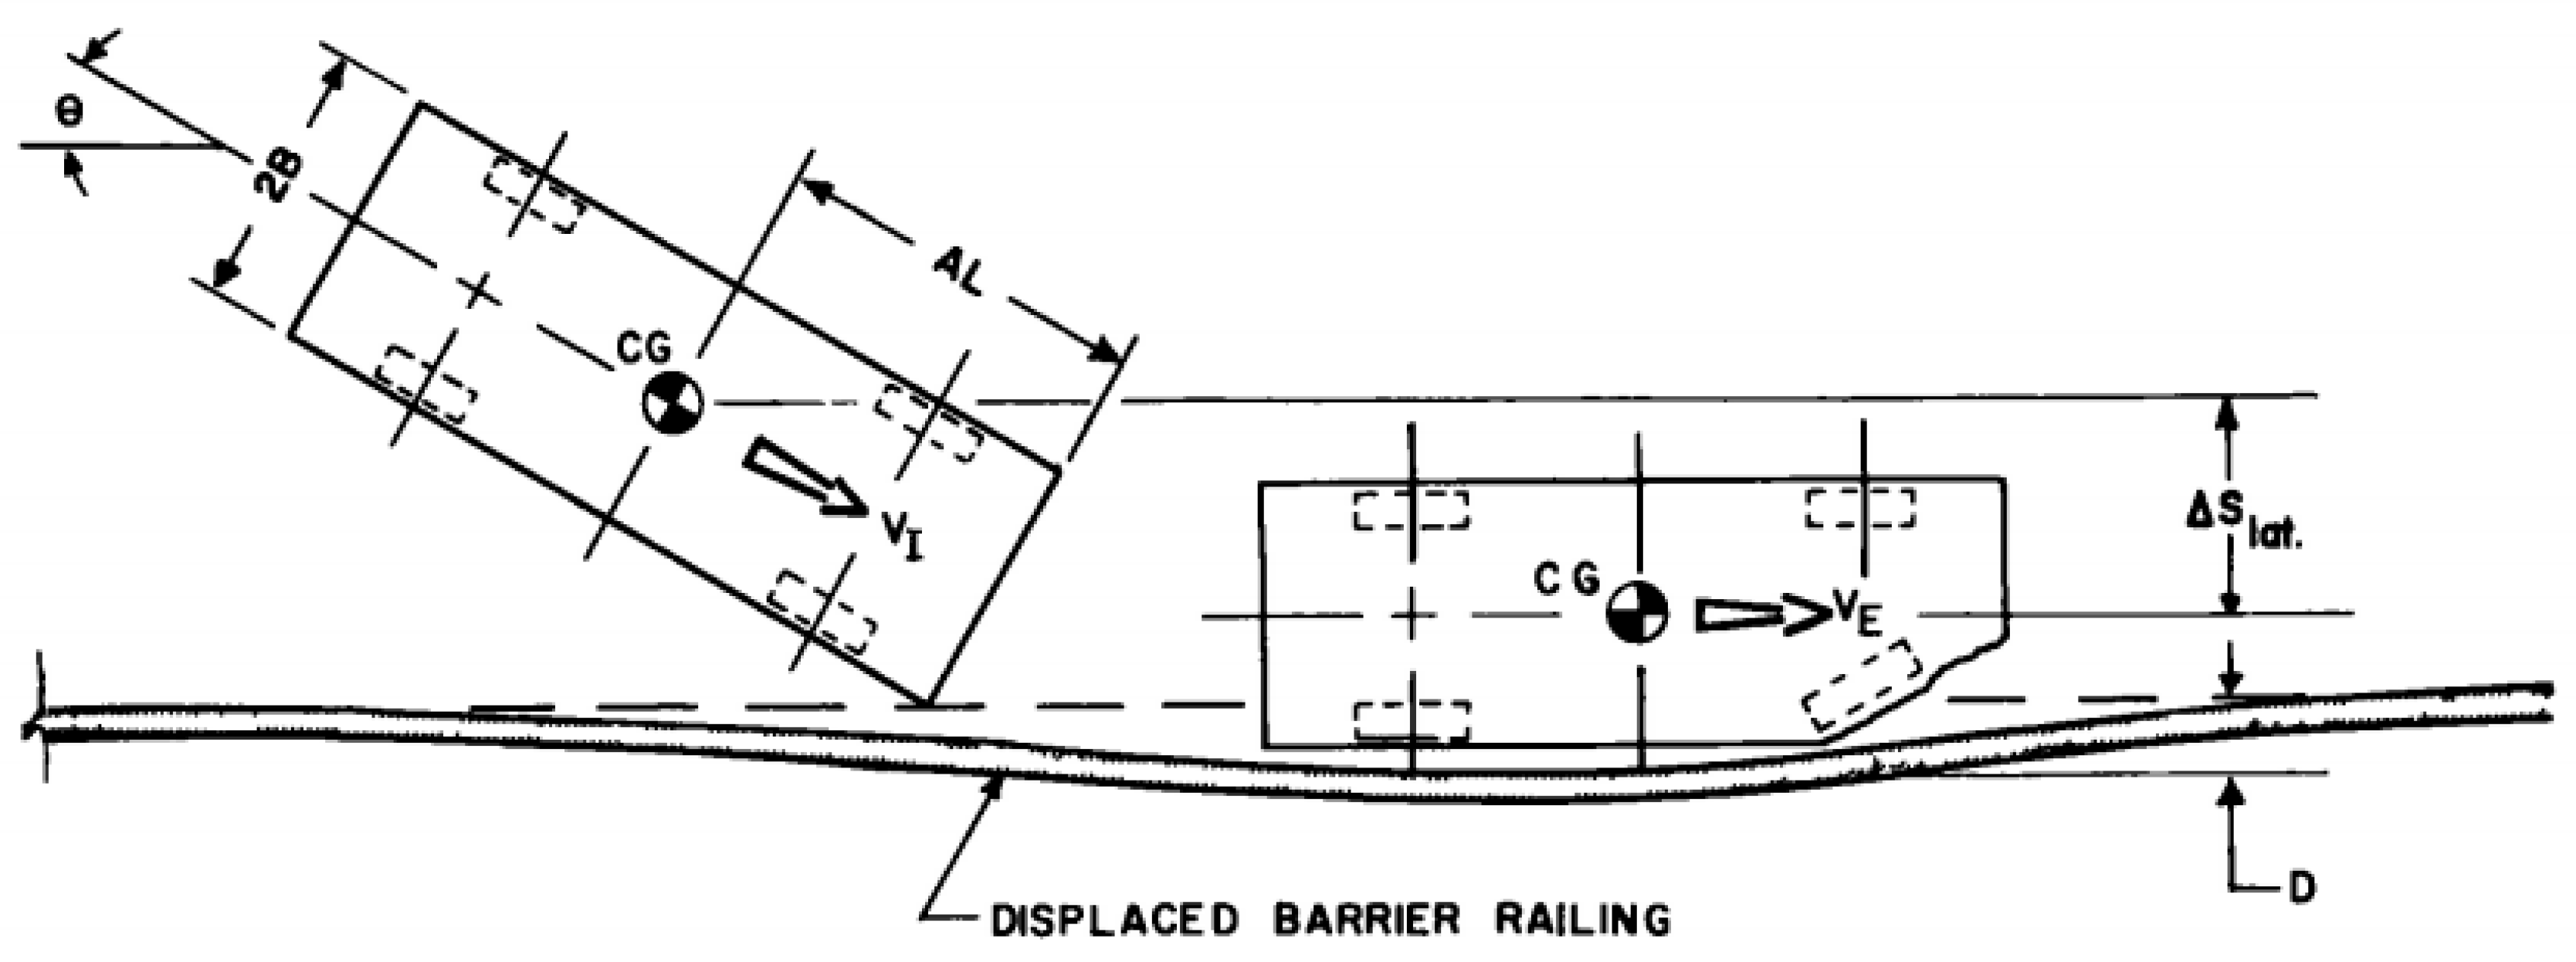
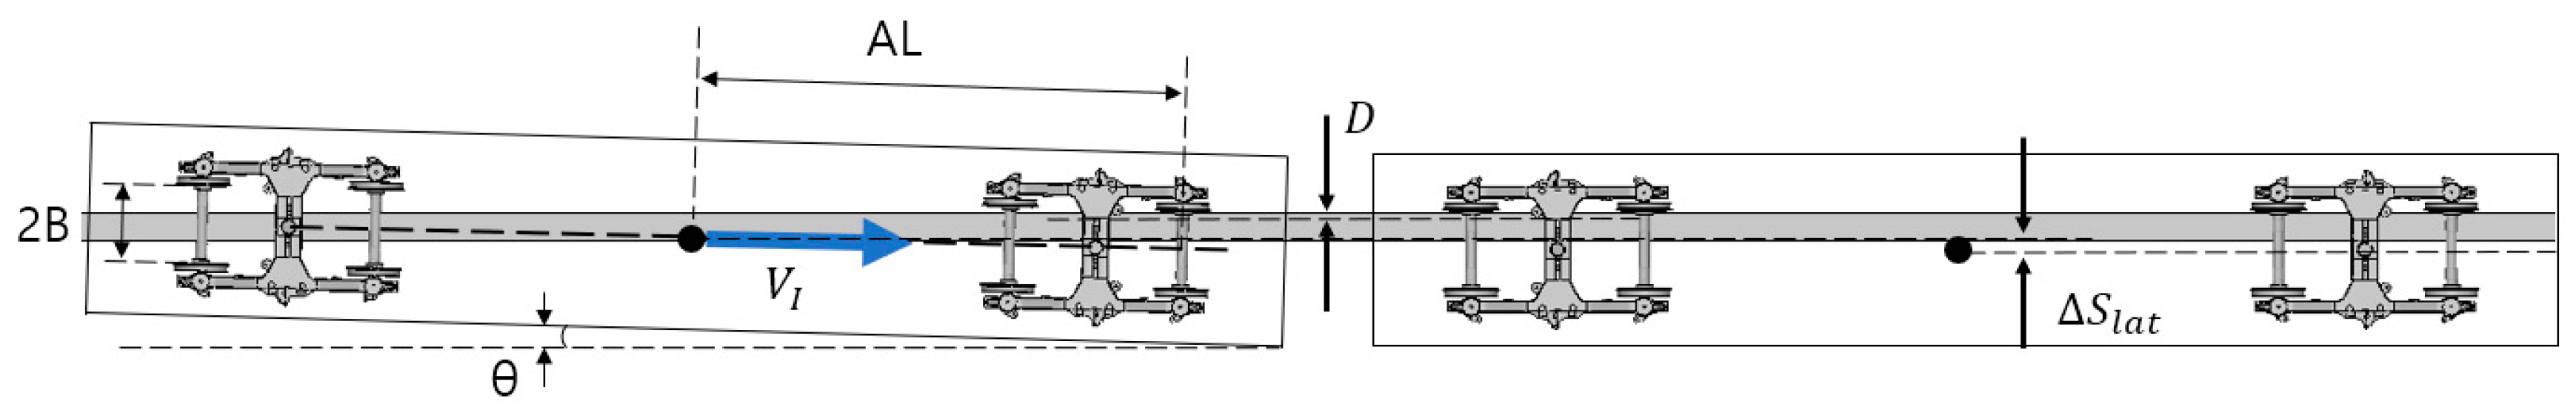
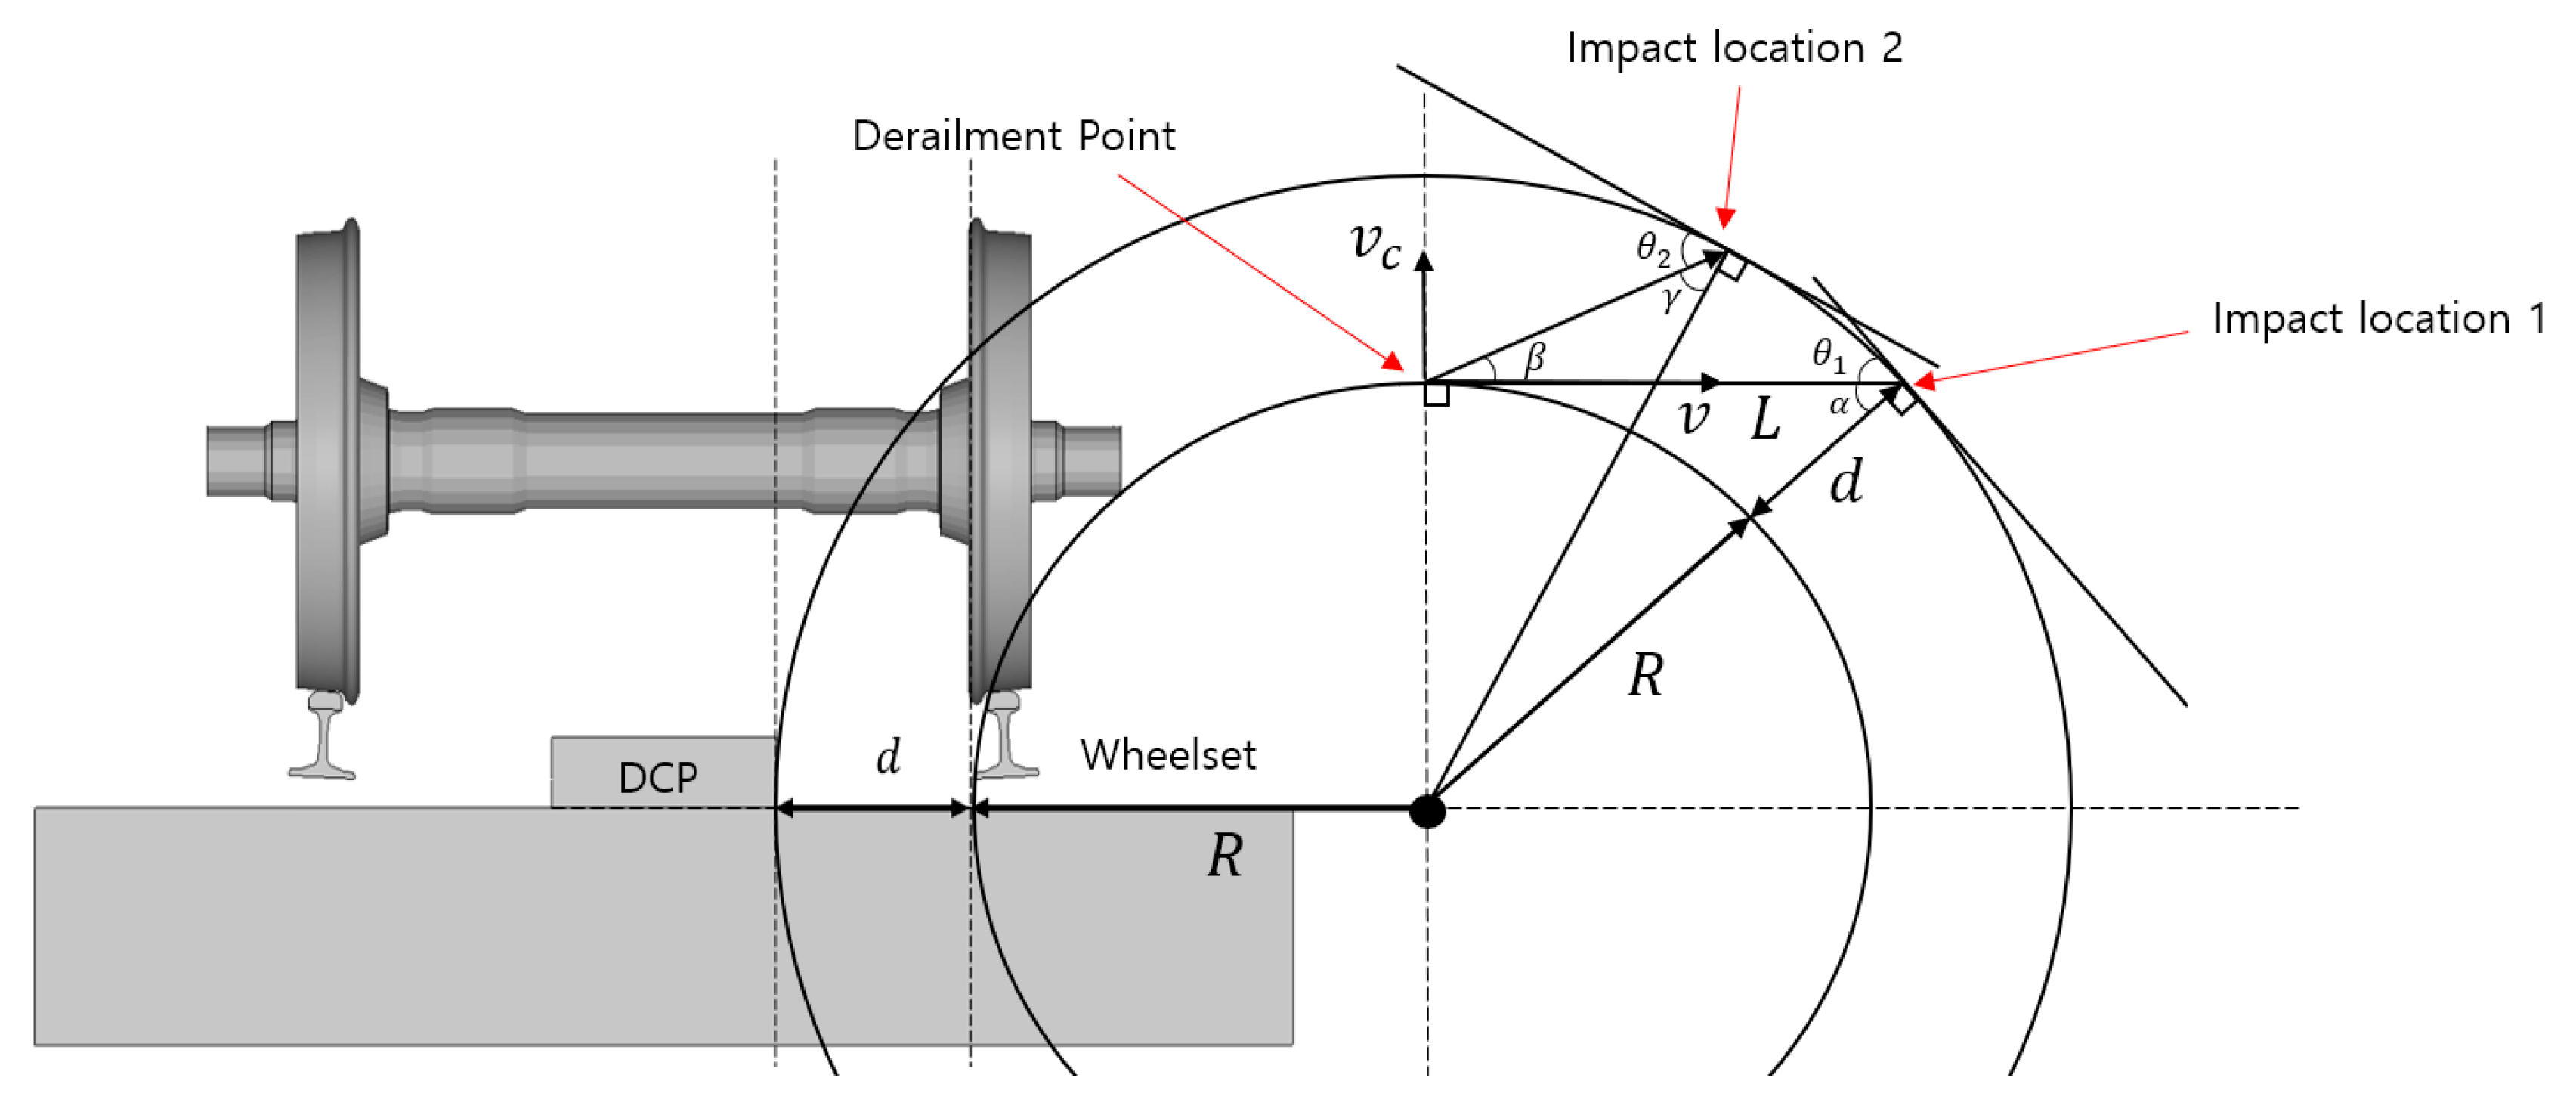
3. Olson Model
- : Average lateral vehicle deceleration ratio to g
- : Vehicle impact velocity
- : Time interval of lateral movement of vehicle
- : Acceleration due to gravity
- : Lateral movement of vehicle
- : Distance from vehicle;s front end to center of mass
- : Vehicle width
- : Lateral displacement of barrier railing
- : Vehicle impact angle
- : Average lateral impact force
- : Maximum lateral impact force
- : Vehicle weight
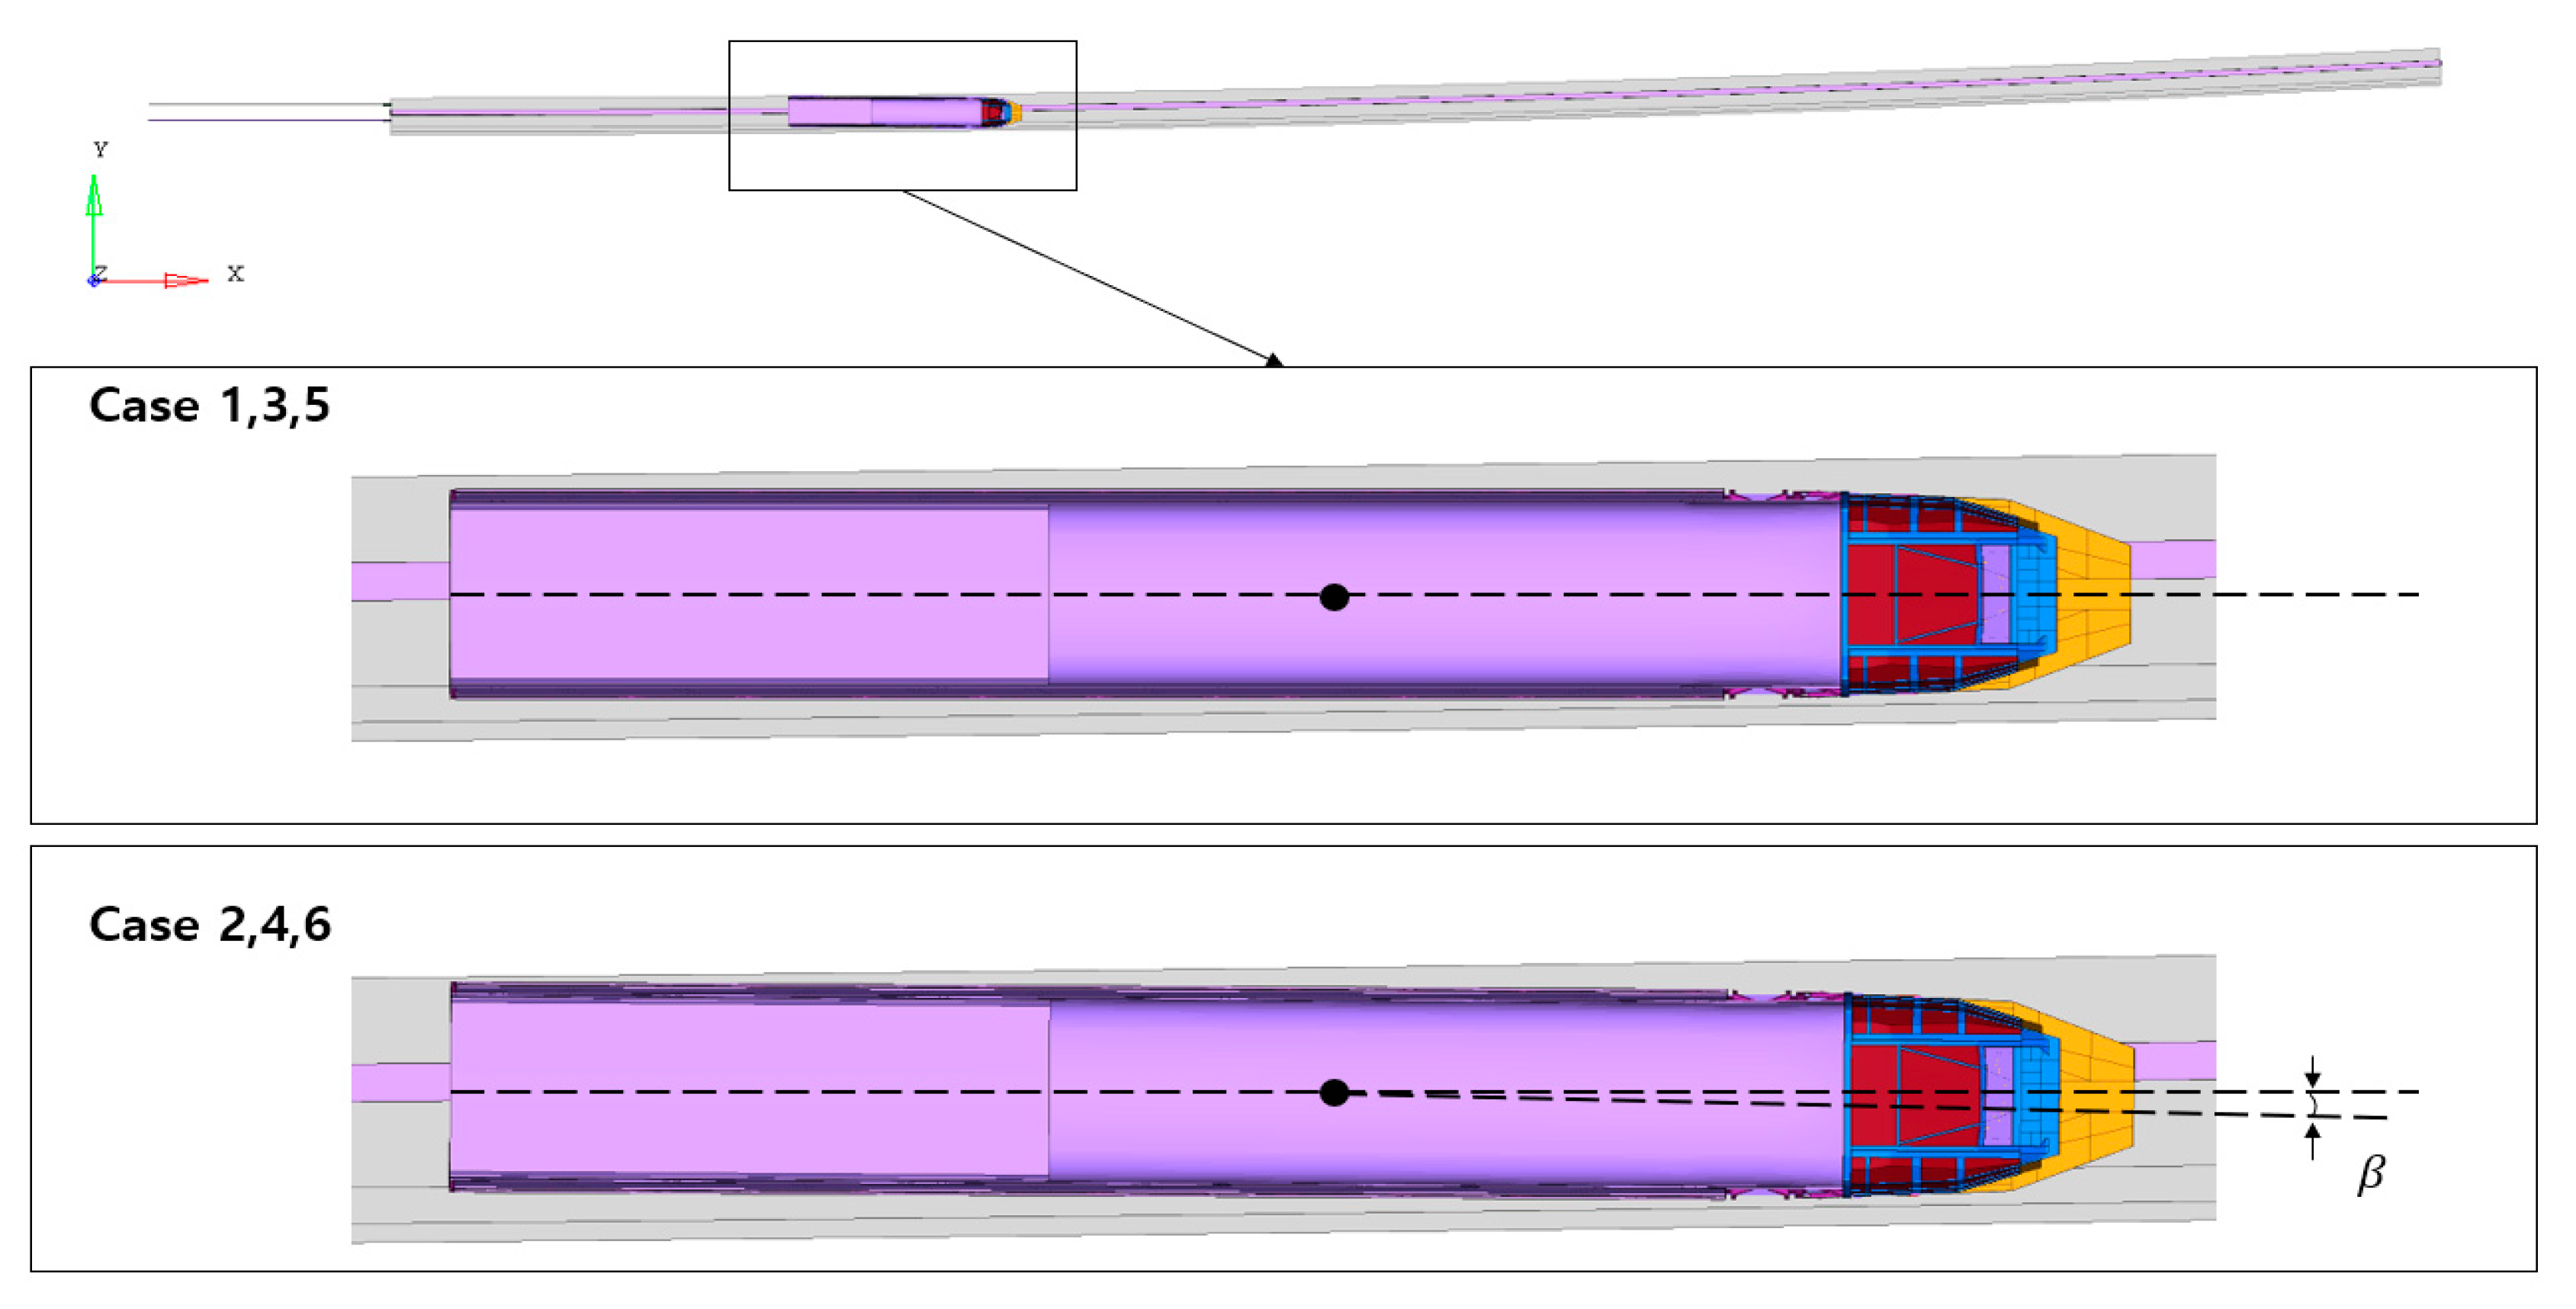
4. Estimation of Impact Angle
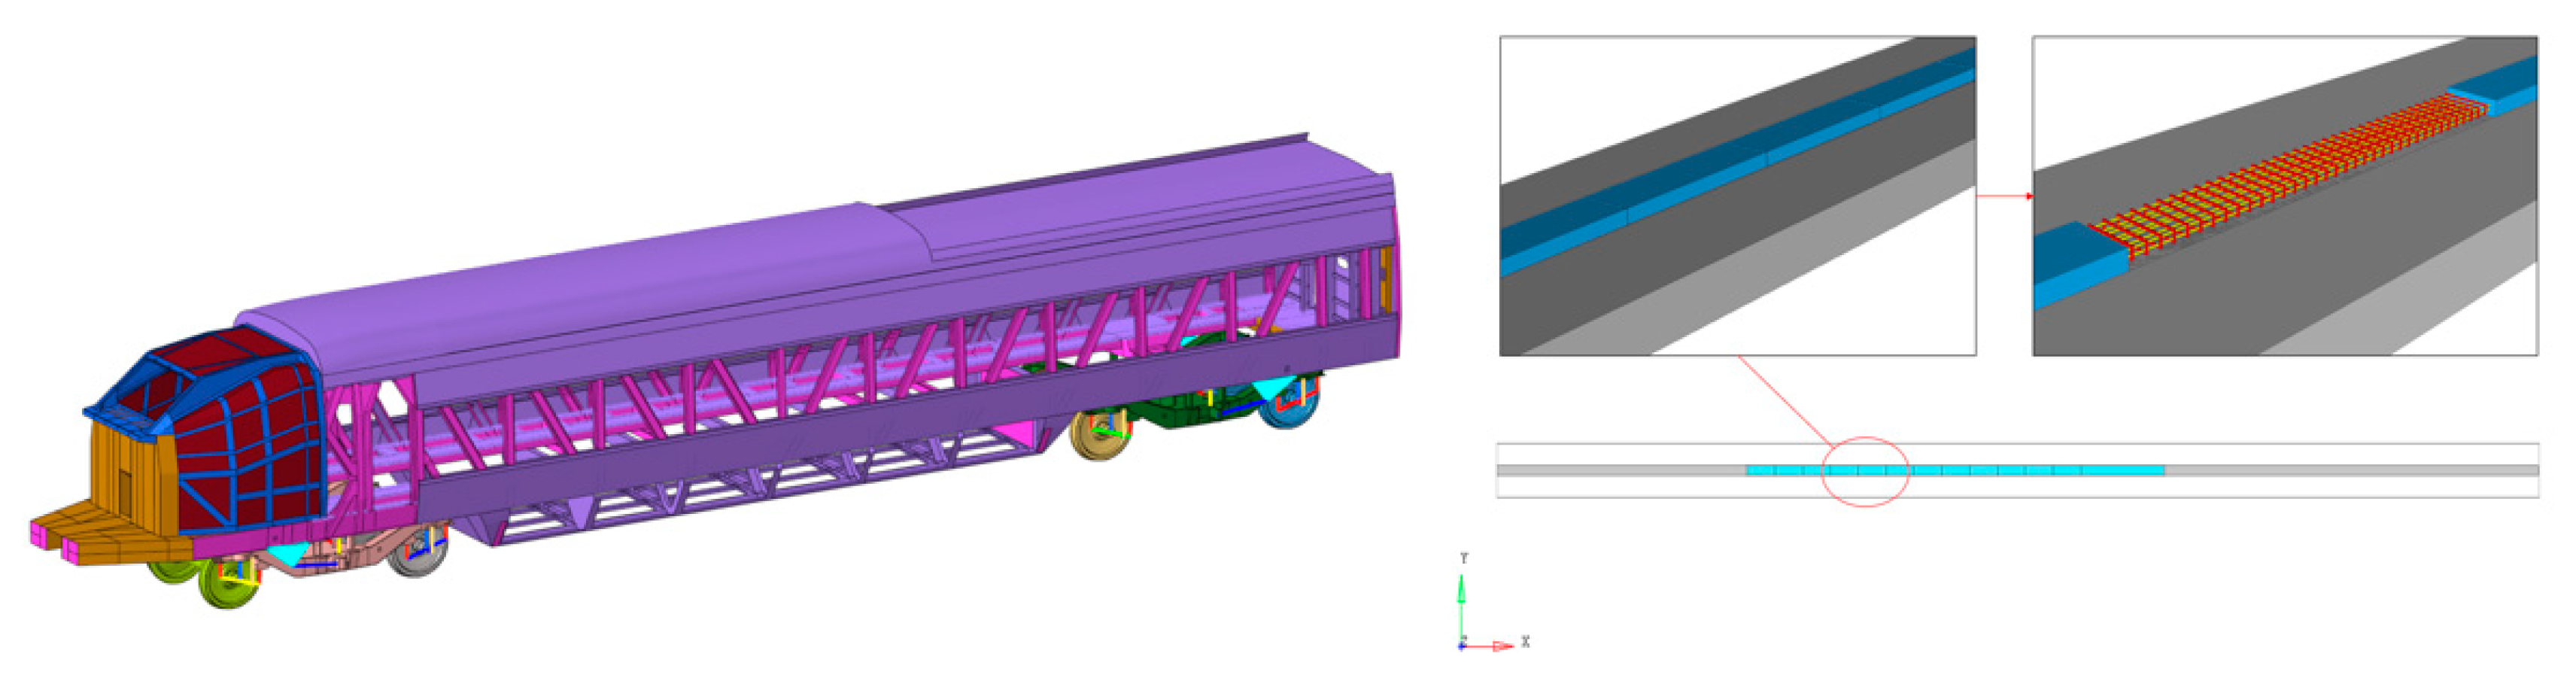
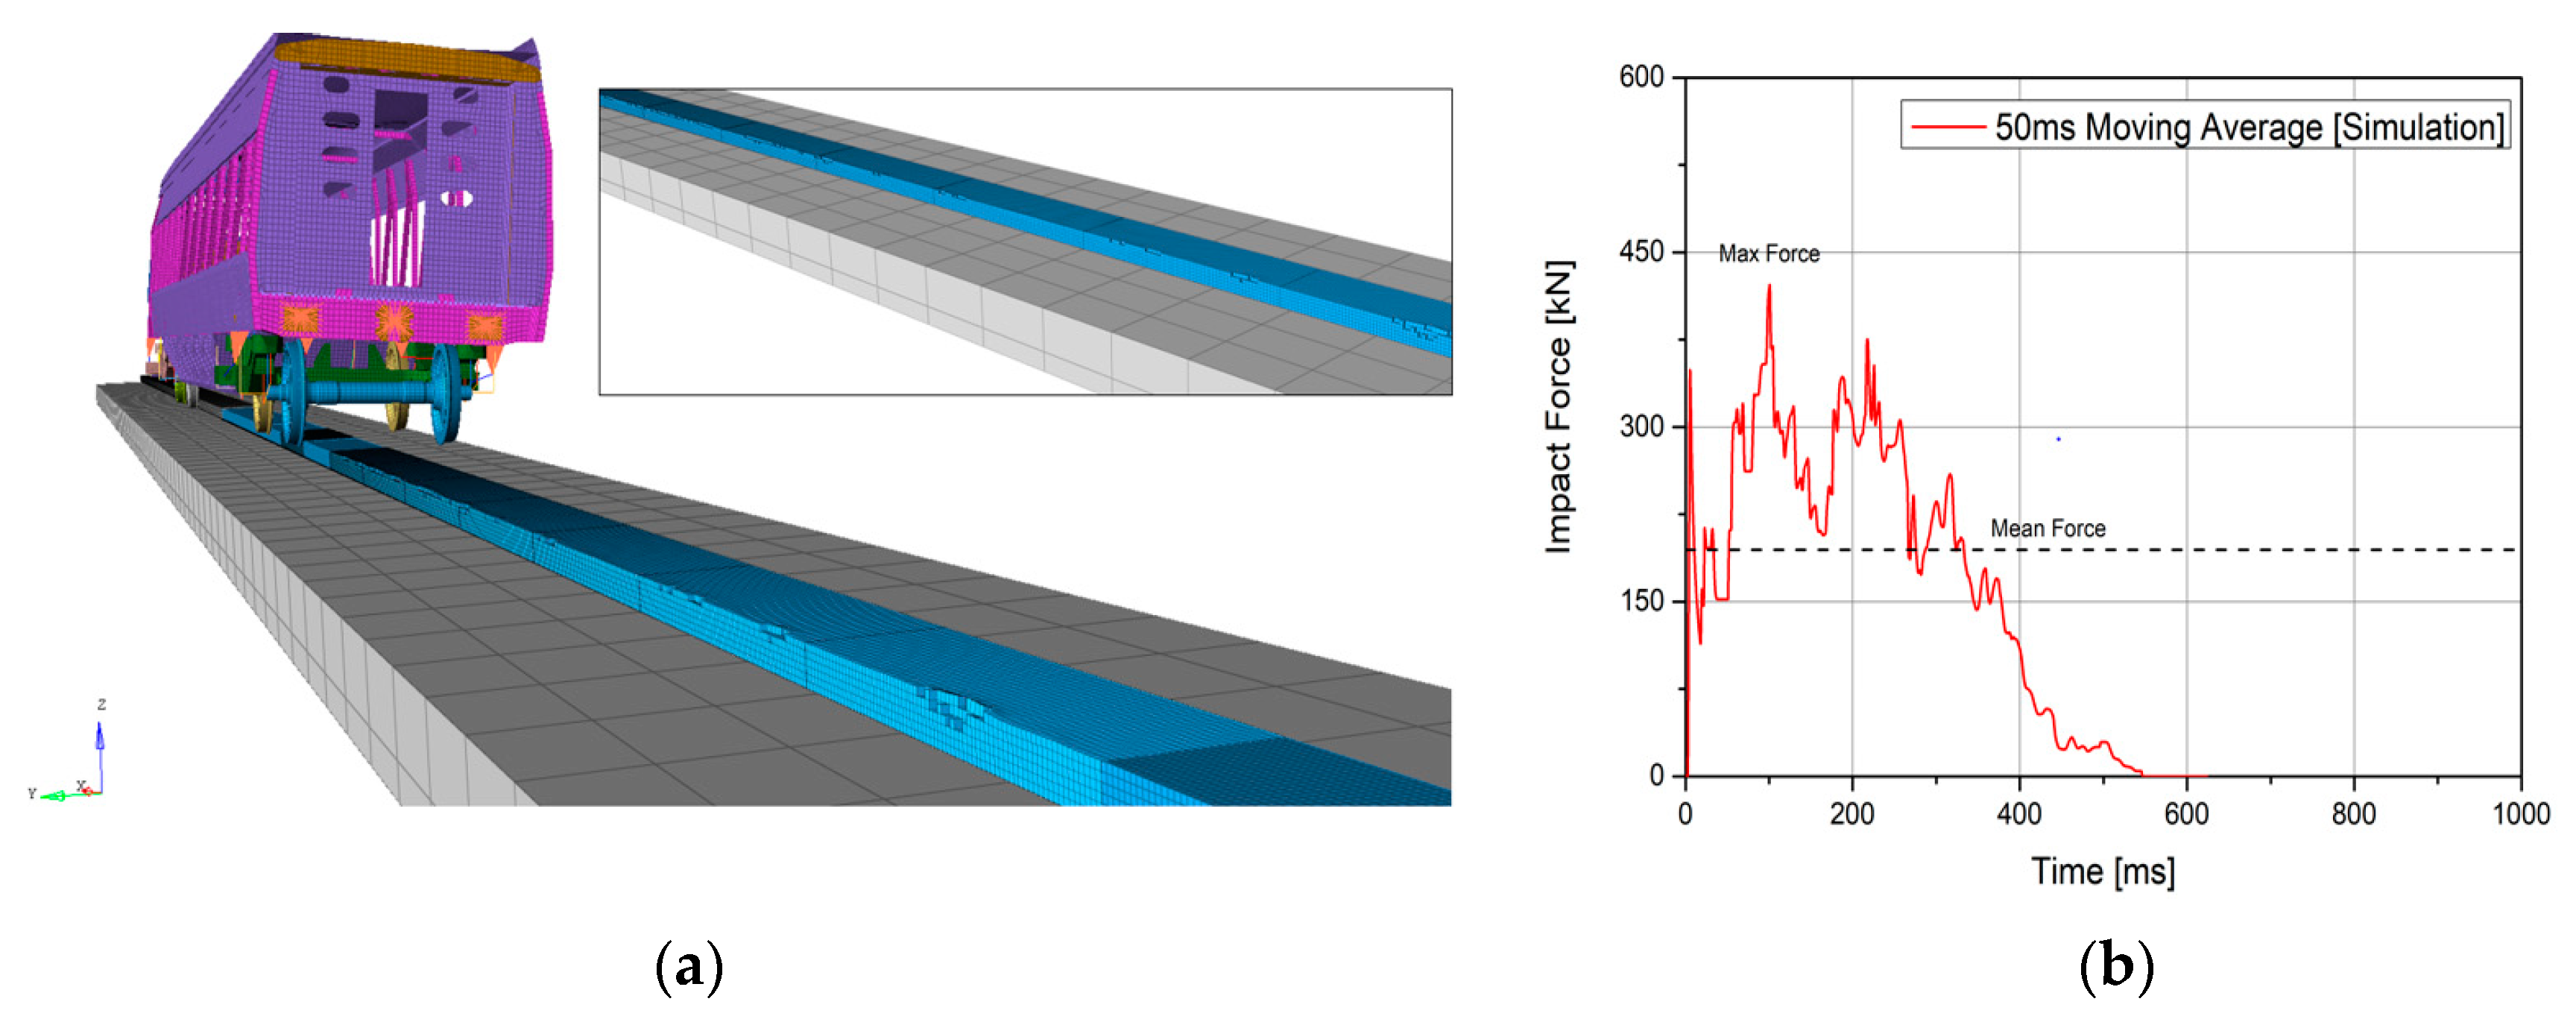
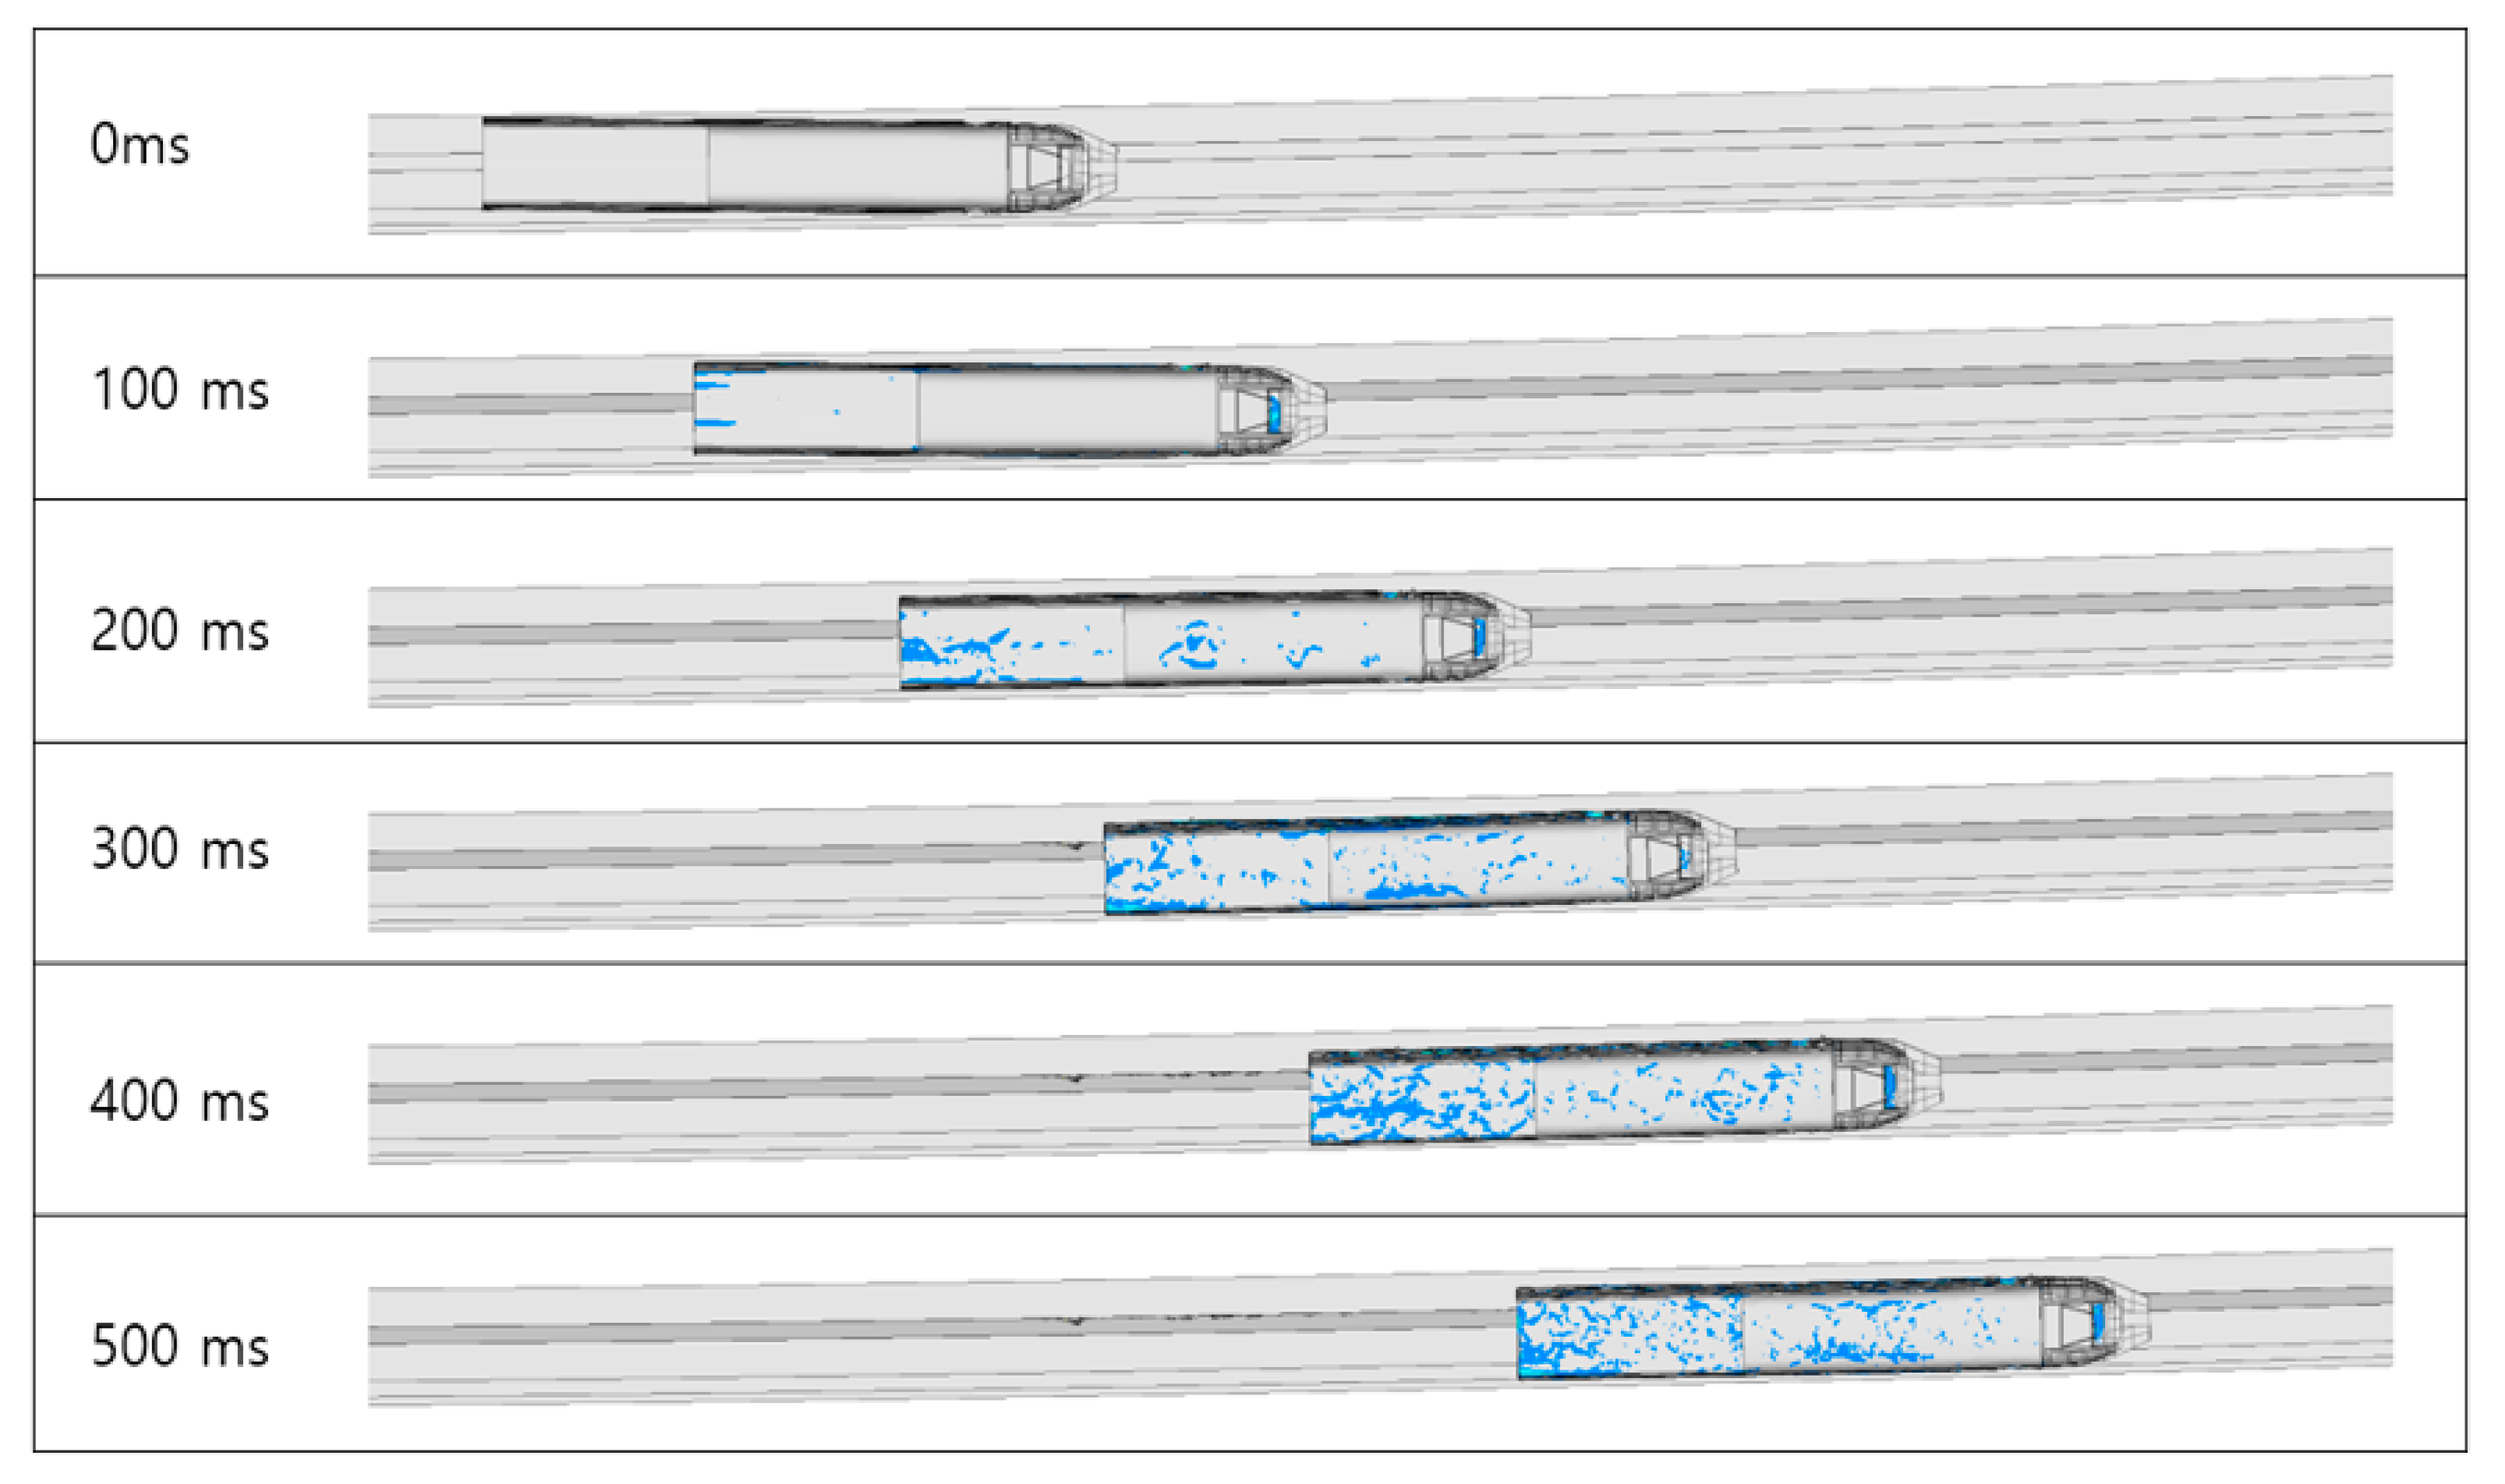
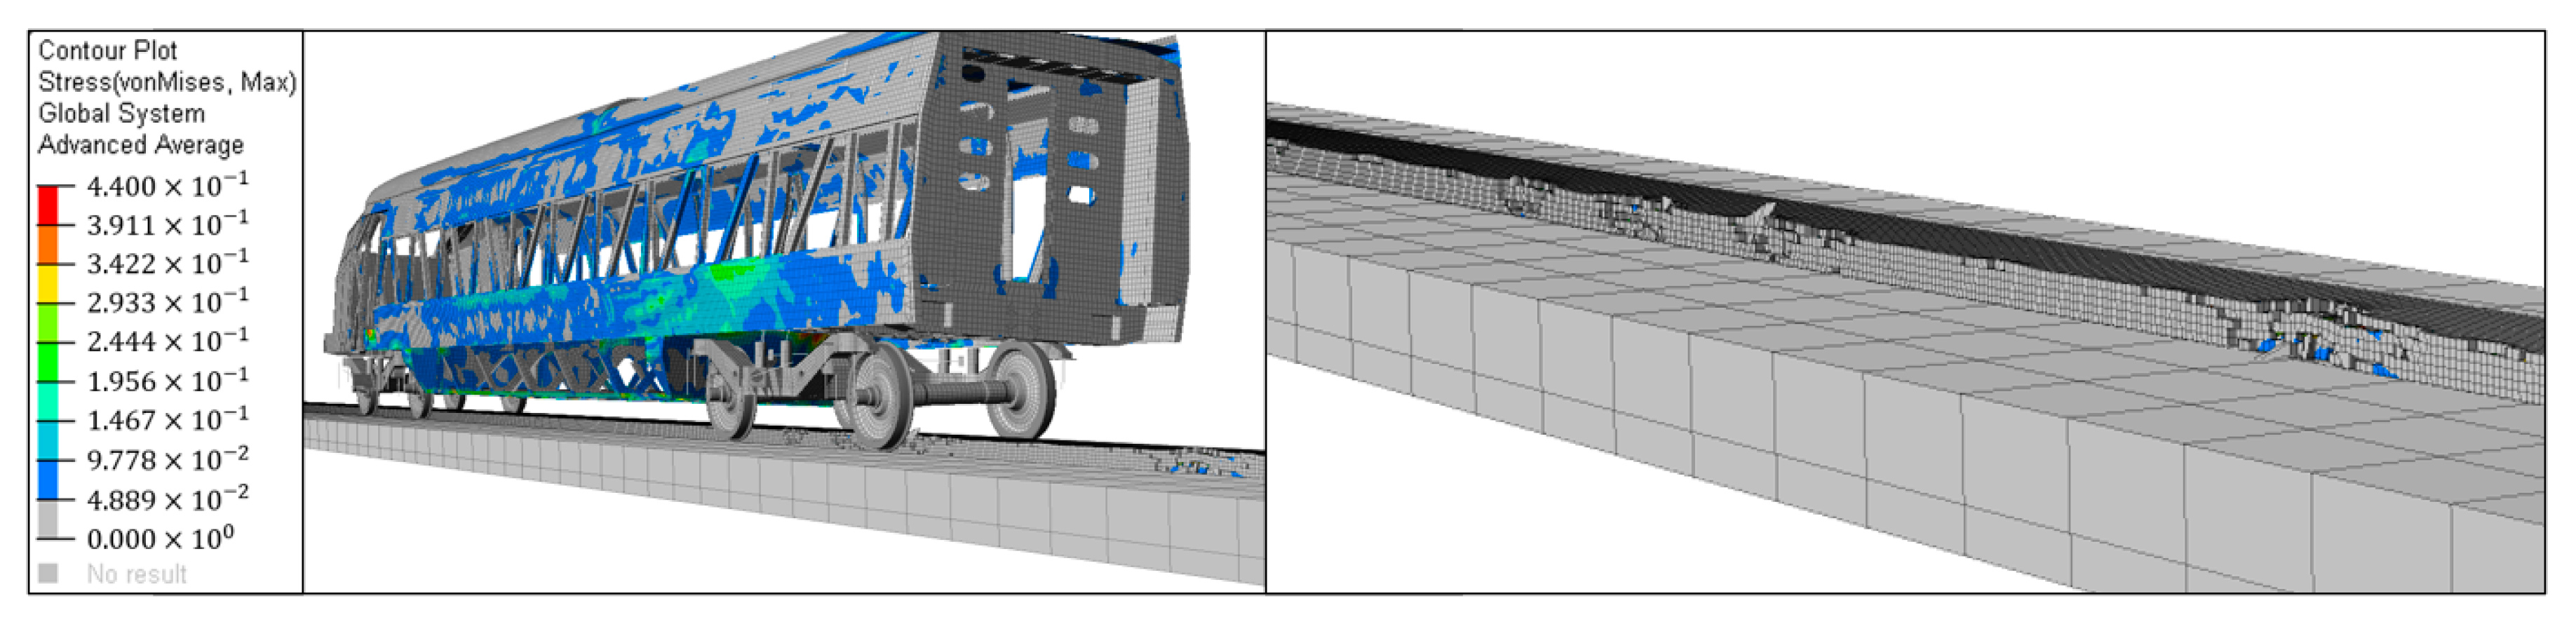
5. Comparison with Impact Simulation
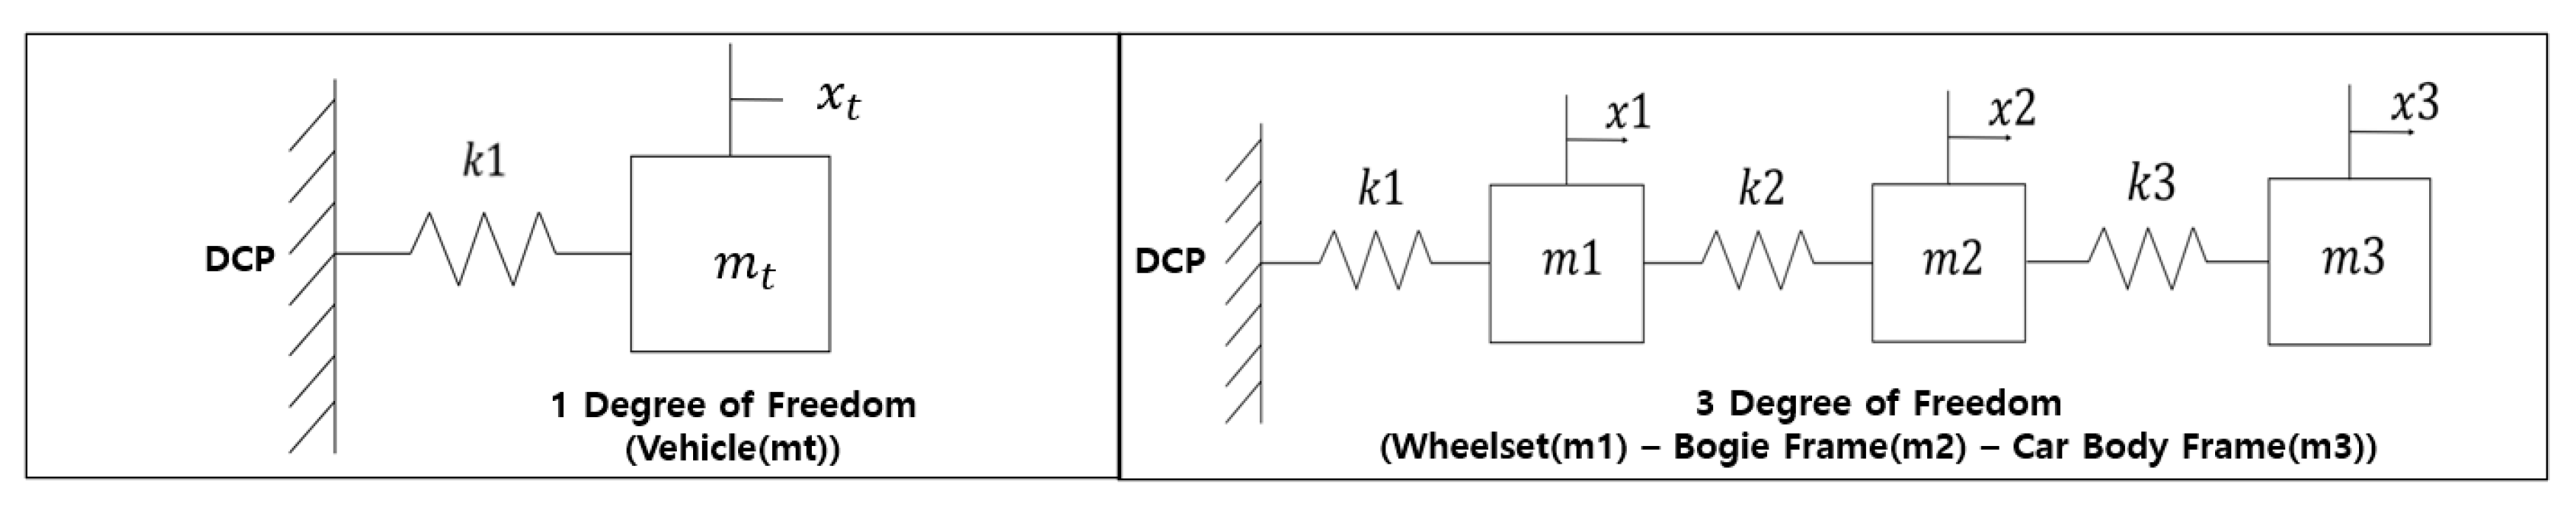
6. Dynamic Effect of Vehicle Suspensions
- (1)
- 1 Degree of Freedom
- (2)
- 3 Degrees of Freedom
7. Theoretical Impact Forces of the DCP Type 1 by the KTX Power Car
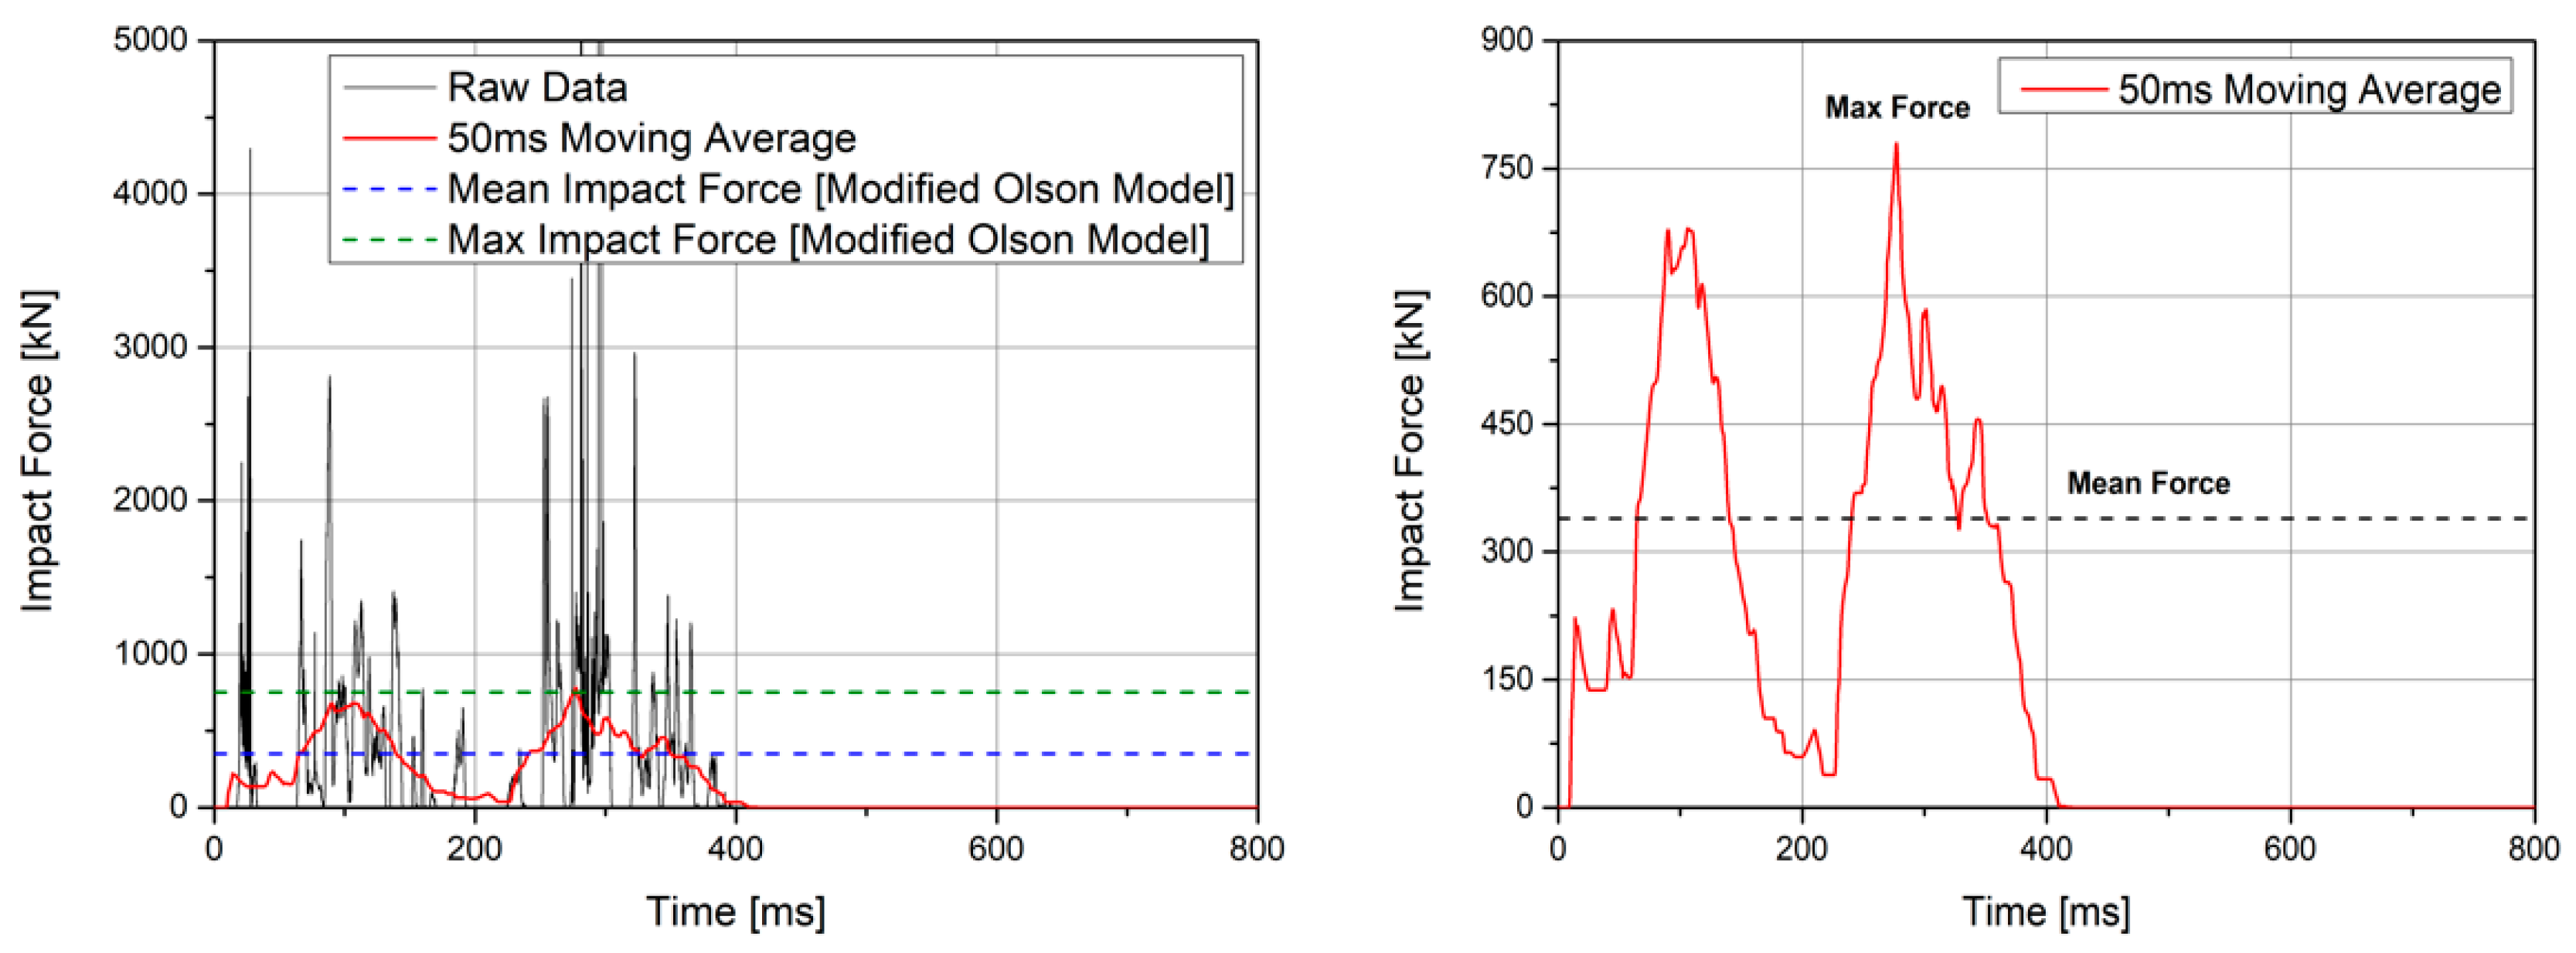
8. Verification of Theoretical Impact Forces
9. Conclusions
- The Olson model did not consider the lateral stiffness of suspension, resulting in a large difference between the theoretical impact force and the simulated impact force when estimating the impact force of DCP Type 1 installed between the rails.
- To estimate the load transmitted to the DCP, the lateral stiffnesses were considered as a spring–mass model using the wheelset, bogie frame, and bodies of a vehicle. The impact forces were estimated by solving the equations of motion. The calculated response of the dynamic equations showed that the average impact force was 55% of the original Olson model, and the maximum impact force was 75%.
- To verify the theoretical impact forces estimated by the equations of motion, impact simulations were performed on the R3500, R5000, and R7000 of the curved tracks using the KTX. Two conditions were considered: the first is to derail along the tangential direction of the curve after derailment, and the second is to derail with additional angle due to the centrifugal effect. All simulation results showed relative deviations of less than 8%, confirming that the proposed method considering suspension stiffnesses in the Olson model can predict the impact force acting on the DCP well.
Author Contributions
Funding
Institutional Review Board Statement
Informed Consent Statement
Data Availability Statement
Conflicts of Interest
References
- The Guardian. Available online: https://www.theguardian.com/world/2013/jul/25/santiago-train-derailment-speed-safety (accessed on 12 March 2023).
- Railexpress. Available online: https://www.railexpress.com.au/seven-people-in-cabin-prior-to-tgv-derailment-report/ (accessed on 12 March 2023).
- Kazuhiko, N.; Yoshiaki, T.; Tsutomu, M. Using Full Scale Experiments to Verify a Simulation Used to Analyze the Safety of Rail Vehicles During Large Earthquakes. J. Comput. Nonlinear Dyn. 2015, 10, 031013. [Google Scholar]
- Guo, L.; Wang, K.; Lin, J.; Zhang, B.; Chen, Z.; Song, X.; Du, G. Study of the post-derailment safety measures on low-speed derailment test. Int. J. Veh. Mech. Mobil. 2016, 54, 943–962. [Google Scholar] [CrossRef]
- Liang, L.; Manicka, D.; David, P.T. A Passive road-rail crossing design to minimize wheel-rail contact failure risk inder frontal collision of trains onto stuck trucks. Eng. Fail. Anal. 2017, 80, 403–415. [Google Scholar] [CrossRef]
- Kajitani, Y.; Kato, H.; Asano, K. Development of an L-shaped guide to prevent deviation from rails. JR-EAST Tech. Rev. 2010, 15, 53–56. [Google Scholar]
- Sunami, H.; Morimura, T.; Ishikawa, S.; Adachi, M.; Sakanoue, K.; Minami, Y.; Watanabe, Y.; Soda, Y. Experiment on test track for preventing the derailed vehicle from veering off the track. Trans. Jpn. Soc. Mech. Eng. 2010, 76, 2462–2463. [Google Scholar] [CrossRef] [Green Version]
- Sunami, H.; Morimura, T.; Terumichi, Y.; Adachi, M. Model for analysis of bogie frame motion under derailment conditions based on full-scale running tests. Multibody Syst. Dyn. 2012, 27, 321–349. [Google Scholar] [CrossRef]
- Wu, X.; Chi, M.; Gao, H.; Zhang, D.; Zeng, J.; Wu, P.; Zhu, M. The study of post-derailment measures to limit the extent of a derailment. Proc. Inst. Mech. Eng. Part F J. Rail Rapid Transit 2016, 230, 64–76. [Google Scholar] [CrossRef]
- Pu, W.; Shuguo, W.; Zhenhua, Z. Mechanism of Derailment at the Guardrail Position of Turnout and a Reasonable Guardrail Interval Limit. Appl. Sci. 2022, 12, 8496. [Google Scholar]
- Lai, J.; Xu, J.; Wang, P.; Chen, J.; Fang, J.; Ma, D.; Chen, R. Numerical investigation on the dynamic behaviour of derailed railway vehicles protected by guard rail. Veh. Syst. Dyn. 2021, 59, 1803–1824. [Google Scholar] [CrossRef]
- Zhu, X.; Lu, X.Z.; Cheng, Q.L.; Li, Y. Simulation of the running attitude of a train after derailment. Int. J. Crashworthiness 2020, 25, 213–219. [Google Scholar] [CrossRef]
- Lai, J.; Xu, J.; Liao, T.; Zheng, Z.; Chen, R.; Wang, P. Investigation on train dynamic derailment in railway turnouts caused by track failure. Eng. Fail. Anal. 2022, 134, 106050. [Google Scholar] [CrossRef]
- Xiao, X.; Xu, P.; Yao, S.; Li, B.; Guo, W.; Zhao, H. Numerical Investigation of the U-Steel Guard Rail Used in Train-to-Train Collision Tests. Machines 2022, 10, 666. [Google Scholar] [CrossRef]
- Antonio, J.S.; Jesus, F.; Juan de, D.S.; Jaime, G. New Anti-Derailment System in Railway Crossings. Machines 2022, 10, 1224. [Google Scholar]
- Hirsch, T.J.; Harris, W.J.; James, R.W.; Lamkin, J.; Zhang, H. Analysis and Design of Metrorail—Railroad Barrier System; Texas Transportation Institute, Texas A&M University: College station, TX, USA, 1989.
- U.S. Department of Transportation. Safety of High Speed Guided Ground Transportation Systems; Federal Railroad Administration: Washington, DC, USA, 1994.
- Gaylene, L. Development of Crash wall Design Loads from Theoretical Train Impact; AREMA: Chicago, IL, USA, 2014. [Google Scholar]
- Bae, H.U.; Yun, K.M.; Lim, N.H. Containment capacity and estimation of crashworthiness of derailment containment walls against high-speed trains. J. Rail Rapid Transit 2016, 232, 680–696. [Google Scholar] [CrossRef]
- Lin, C.Y.; Saat, M.R.; Barkan, C.P. Semi-quantitative risk assessment of adjacent track accidents on shared-use rail corridors. J. Rail Transp. Plan. Manag. 2022, 24, 100355. [Google Scholar] [CrossRef]
- Bae, H.U.; Moon, J.H.; Kim, J.J.; Lim, N.H. Concept of Derailment Containment Provisions for Minimizing Expansion of Damage by Train Derailment. Korean Soc. Steel Constr. 2015, 27, 42–46. [Google Scholar]
- Bae, H.U.; Yun, K.M.; Moon, J.; Lim, N.H. Impact Force Evaluation of the Derailment Containment Wall for High-Speed Train through a Collision Simulation. Adv. Civ. Eng. 2018, 2018, 2626905. [Google Scholar] [CrossRef] [Green Version]
- Song, I.H.; Kim, J.W.; Koo, J.S.; HU Bae Lim, N.H. Simplified Vehicle Modeling Technique for Design of Derailment Containment Provisions (DCP). J. Korean Soc. Railw. 2019, 22, 527–537. [Google Scholar] [CrossRef]
- Song, I.H.; Kim, J.W.; Koo, J.S.; Lim, N.H. Modeling and Simulation of Collision-Causing Derailment to Design the Derailment Containment Provision Using a Simplified Vehicle Model. Appl. Sci. 2020, 10, 118. [Google Scholar] [CrossRef] [Green Version]
- Lim, N.H. A Study on the Development of Facilities and Performance Standards for Preventing Deviation of Railway Vehicles, Final Report; Ministry of Land, Infrastructure, and Transport: Sejong City, Republic of Korea, 2020.
- Bae, H.U.; Kim, K.J.; Park, S.Y.; Han, J.J.; Park, J.C.; Lim, N.H. Functionality Analysis of Derailment Containment Provisions through Full-Scale Testing—I: Collision Load and Change in the Center of Gravity. Appl. Sci. 2022, 12, 11297. [Google Scholar] [CrossRef]
- Olson, R.M.; Post, E.R.; McFarland, W.F. NCHRP Report 86: Tentative Service Requirements for Bridge Rail Systems; HRB, National Research Council: Washington, DC, USA, 1970. [Google Scholar]
- Booz, A. Hamilton Report on the Findings of: Current Practice and Effectiveness of Derailment Containment Provisions on High Speed Lines; HSL-Zuid Organisation: Zoetermeer, The Netherlands, 2004. [Google Scholar]
- Bae, H.U.; Moon, J.H.; Lim, S.J.; Park, J.C.; Lim, N.H. Full-Scale Train Derailment Testing and Analysis of Post-Derailment Behavior of Casting Bogie. Appl. Sci. 2020, 10, 59. [Google Scholar] [CrossRef] [Green Version]
- Kim, S.R.; Koo, J.S.; Kwon, T.S.; Han, H.H. The Development of Virtual Testing Model for Korea High Speed Train. Eng. Semantic Scholar. 2008. Available online: https://docplayer.net/8397103-The-development-of-virtual-testing-model-for-korea-high-speed-train.html (accessed on 12 March 2023).
- Livermore Software Technology Corporation (LSTC). LS-DYNA Keyword User’s Manual. vols. 1–3, Revision Bae et al. 695 2645, January 2013; Livermore Software Technology Corporation: Livermore, CA, USA, 2013. [Google Scholar]
- Kim, J.C.; Kang, B.B.; Koo, D.H.; Lee, C.W.; Seo, J.W. A Study on Running Performance for KTX; Korea Railroad Research Institute Report: 2002. Available online: https://www.codil.or.kr/viewDtlConRpt.do?gubun=rpt&pMetaCode=OTKRRK050872 (accessed on 12 March 2023).
- Murray, Y.D. Users Manual for LS-DYNA Concrete Material Model 159. Final Report. FHWA-HRT-05-062, May 2007; Volpe National Transportation Systems Center: Cambridge, MA, USA, 2007. [Google Scholar]
- Murray, Y.D.; Abu-Odeh, A.; Bligh, R. Evaluation of LS-DYNA Concrete Material Model 159. Final Report, FHWA-HRT-05-063, May 2007; Volpe National Transportation Systems Center: Cambridge, MA, USA, 2007. [Google Scholar]
- Murray, Y.D. Conference-theory and evaluation of concrete material model 159. In Proceedings of the 8th European LS-DYNA User Conference, Strasbourg, France, 23–24 May 2011; Livermore Software Technology Corporation: Livermore, CA, USA, 2011. [Google Scholar]
- Beason, W.L.; Hirsch, T.J.; Campise, W.L. Measurement of Heavy Vehicle Impact Forces and Inertia Properties. Final Report; FHWA/RD-89/120; Texas Transportation Institute: College Station, TX, USA, 1989.
- Song, I.H. A Study on the Evaluation of the Impact Force acting on the Derailment Containment Provisions (DCP) in the Event of a Train Derailment Accident. Ph.D. Thesis, Seoul National University of Science and Technology, Seoul, Republic of Korea, 2022. [Google Scholar]


| Curve Radius (m) | Wheel Distance from DCP (m) | Cant (mm) | Impact Angle (°) | Impact Angle (°) |
|---|---|---|---|---|
| R400 | 0.425 | 0 | 2.640 | 3.732 |
| R1600 | 1.320 | 1.867 | ||
| R2400 | 1.078 | 1.525 | ||
| R3500 | 0.893 | 1.262 | ||
| R5000 | 0.747 | 1.056 | ||
| R7000 | 0.631 | 0.893 |
| Component | Weight (ton) |
|---|---|
| Car Body | 54.96 |
| Each Bogie Frame | 2.42 |
| Each Wheelset | 2.048 |
| Part | Beam Element | Shell Element | Solid Element | Ls-Dyna Material |
|---|---|---|---|---|
| Car Body | - | 143,428 | - | Mat 3 |
| Bogie Frame | - | 31,414 | - | Mat 20 |
| Suspension | 64 | - | - | Mat 119 |
| Wheelset | - | - | 301,120 | Mat 20 |
| DCP | - | - | 196,734 | Mat 20/Mat 159 |
| Curve Radius (m) | Impact Angle | Mean Impact Force | Maximum Impact Force |
|---|---|---|---|
| Olson Model [Theory] | 0.85° | 428 kN | 672.94 kN |
| Simulation | 194 kN | 422.3 kN | |
| Relative deviations | 54.6% | 37.2% |
| Variable | Value |
|---|---|
| 8.194 ton | |
| 4.839 ton | |
| 54.9 ton | |
| Initial Displacement | 0 m |
| Initial Displacement | 0 m |
| Initial Displacement | 0 m |
| Initial Velocity | −1.23623 m/s |
| Initial Velocity | −1.23623 m/s |
| Initial Velocity | −1.23623 m/s |
| Curve Radius [m] | Mean Impact Forces [kN] | Maximum Impact Forces [kN] | ||
|---|---|---|---|---|
| Impact Angle (°) | Impact Angle (°) | Impact Angle (°) | Impact Angle (°) | |
| R400 | 733.49 | 1038.26 | 1571.1 | 2223.96 |
| R1600 | 366.27 | 518.30 | 784.54 | 1110.20 |
| R2400 | 298.97 | 423.03 | 640.39 | 906.13 |
| R3500 | 247.51 | 350.20 | 530.18 | 750.12 |
| R5000 | 207.05 | 292.93 | 443.50 | 627.44 |
| R7000 | 174.96 | 247.52 | 374.77 | 530.18 |
| Case | Curve Radius (m) | Velocity (km/h) | (°) |
|---|---|---|---|
| 1 | 3500 | 300 | 0 |
| 2 | 0.893 | ||
| 3 | 5000 | 300 | 0 |
| 4 | 0.747 | ||
| 5 | 7000 | 300 | 0 |
| 6 | 0.631 |
| Curve Radius | Mean Impact Force | Maximum Impact Force | |
|---|---|---|---|
| Olson model [Theory] | R3500 | 350.20 kN | 750.12 kN |
| Simulation | 339.2 kN | 779.7 kN | |
| Relative deviations | 3.14% | 3.94% |
| Curve Radius | Additional Angle (°) | Olson Model Mean | Simulation Mean | Relative Deviations (%) | Olson Model Maximum | Simulation Maximum | Relative Deviations (%) |
|---|---|---|---|---|---|---|---|
| R3500 | 0 | 247.5 | 247.8 | 0.12 | 530.18 | 551.8 | 4.08 |
| 0.893 | 350.2 | 339.2 | 3.14 | 750.12 | 779.7 | 3.94 | |
| R5000 | 0 | 207.1 | 191.6 | 7.46 | 443.5 | 444.4 | 0.21 |
| 0.747 | 292.9 | 271.3 | 7.89 | 627.4 | 578.0 | 7.87 | |
| R7000 | 0 | 175 | 170.2 | 2.72 | 374.8 | 376.1 | 0.36 |
| 0.631 | 247.5 | 232.3 | 6.13 | 530.2 | 493.4 | 6.93 |
Disclaimer/Publisher’s Note: The statements, opinions and data contained in all publications are solely those of the individual author(s) and contributor(s) and not of MDPI and/or the editor(s). MDPI and/or the editor(s) disclaim responsibility for any injury to people or property resulting from any ideas, methods, instructions or products referred to in the content. |
© 2023 by the authors. Licensee MDPI, Basel, Switzerland. This article is an open access article distributed under the terms and conditions of the Creative Commons Attribution (CC BY) license (https://creativecommons.org/licenses/by/4.0/).
Share and Cite
Song, I.-H.; Koo, J.-S.; Shim, J.-S.; Bae, H.-U.; Lim, N.-H. Theoretical Prediction of Impact Force Acting on Derailment Containment Provisions (DCPs). Appl. Sci. 2023, 13, 3899. https://doi.org/10.3390/app13063899
Song I-H, Koo J-S, Shim J-S, Bae H-U, Lim N-H. Theoretical Prediction of Impact Force Acting on Derailment Containment Provisions (DCPs). Applied Sciences. 2023; 13(6):3899. https://doi.org/10.3390/app13063899
Chicago/Turabian StyleSong, In-Ho, Jeong-Seo Koo, Jae-Seok Shim, Hyun-Ung Bae, and Nam-Hyoung Lim. 2023. "Theoretical Prediction of Impact Force Acting on Derailment Containment Provisions (DCPs)" Applied Sciences 13, no. 6: 3899. https://doi.org/10.3390/app13063899