Abstract
The majority of BIA parameters have been investigated in relation to post-stroke recovery, except for body cell mass (BCM), which measures the body’s cellular components involved in oxygen consumption and nutritional status. The aim of this longitudinal prospective study was to investigate in a cohort of subacute post-stroke patients undergoing rehabilitation the body composition parameters from BIA and the relationship between these parameters, in particular BCM, with both the performance in activity of daily living (ADL), measured by Barthel’s Index at admission (BI T0), and the recovery in ADL, measured by change in BI from baseline (ΔBI). We analyzed 66 patients, before and after a six-week rehabilitation program and we found that patients’ body composition after the rehabilitation protocol did not change. All lean mass and muscle quality parameters measured by BIA are positively correlated with BI T0. Moreover, patients with better recovery had higher values of BCM, such as other lean mass parameters and their related height-adjusted indices. Furthermore, BCM was independently associated both with ADL performance at admission, and most notably with recovery. These results suggest that assessing BCM at admission not only would improve the valuation of the nutritional status in post-stroke patients but would also potentially predict their recovery.
1. Introduction
Stroke is one of the principal causes of death, morbidity, and disability worldwide [1] and the role of rehabilitation is critical for recovering after the stroke insult [2,3]. The clinical spectrum of stroke patients is extremely varied, with inconsistent and frequently inadequate recovery of motor function in response to rehabilitation treatment [4]. In fact, 30 to 60% of patients have functional deficits in the paretic arm even after rehabilitation treatment, resulting in compromised activities of daily living [5]. In addition, impaired nutritional status and malnutrition are prevalent throughout all phases of stroke care [6]. Malnutrition has been shown to negatively impact clinical outcomes, mortality, and overall healthcare expenditures among stroke survivors [6,7,8,9,10]. To date, however, there are no standardized methods for assessing the risk of malnutrition in post-stroke patients, and there is a lack of nutritional care best practices [11].
Body composition assessment allows to detect nutritional or skeletal muscle disorders among stroke survivors, such as overweight, obesity, sarcopenia, and sarcopenic obesity [12,13]. Body composition changes with age and can be affected by physical activity [14] and pathological conditions such as stroke. In particular, even though there have been inconsistent findings about changes in fat mass following strokes [15], it has been suggested that lean and muscle mass are important for stroke survival and management. In fact, neurological disorders, inflammation, and immobility related to stroke could lead to progressive muscle atrophy [12,16]. This condition, known as “stroke-related sarcopenia”, could contribute to worse recovery after rehabilitation [17,18,19], whereas an improvement corresponds to a better functional outcome [20].
There are several methods to assess body composition: among them, computed tomography (CT) and dual-energy X-ray absorptiometry (DEXA) are considered the gold standard. However, these devices are expensive, are not transportable, and need highly qualified personnel for the analysis, and they also expose patients to ionizing radiation of diverse intensities [21]. On the other hand, bioelectrical impedance analysis (BIA) is commonly used to analyze body mass compartments due to its low cost, simplicity, safety, and non-invasiveness. BIA measures the electrical properties of the tissues and indirectly evaluates the body composition compartments [22]. Different body composition parameters can then be estimated by means of predictive equations including BIA variables, sex, age, stature, and weight.
Recently, there has been a rapid increase of studies on body composition in terms of the BIA parameters in relation to functional and clinical outcomes after stroke [17,23,24,25,26,27,28,29,30]. In particular, muscle mass and muscle quality parameters have been shown to be associated with functional independence measure at discharge [24,30], modified ranking score at discharge [17], and the Fugl–Meyer of upper limb at discharge [25]. In addition, the results of a recent retrospective multiple linear regression analysis demonstrated that the phase angle (PhA) and muscle mass were independently associated with better recovery after acute stroke [27].
Moreover, the skeletal muscle index (SMI) estimated with BIA together with muscle-strength assessment is employed for sarcopenia diagnosis according to the revised European Consensus, from the European Working Group of Sarcopenia in Older People 2 (EWGSOP2) [31].
In this context, the study of body composition appears essential to better characterize the general health status of patients admitted to a rehabilitation unit after a stroke injury.
Noteworthy, some BIA-derived parameters were not sufficiently explored in post-stroke patients, especially in relationship to recovery outcome after a rehabilitation treatment. To our knowledge, body cell mass (BCM), has not yet been studied in post-stroke patients undergoing rehabilitation. BCM represents the metabolically active portion of fat-free mass and indicates the cellular components of the body involved in oxygen consumption and resting metabolism [22,32] and has been suggested as a marker of malnutrition [33]. Because of that, BCM might be related to stroke clinical conditions that could influence patients’ recovery.
Given the above, in addition to other body composition parameters often analyzed, it is important to investigate BCM. A more comprehensive analysis of body composition could support a tailored rehabilitation intervention, including nutritional implementation and dietary modification.
This study aims to investigate, in a cohort of subacute post-stroke patients hospitalized for rehabilitation treatment: (i) body composition parameters assessed by BIA at admission and at discharge; and (ii) the relationship between these parameters and the functional mobility and independence recovery, focusing on BCM.
2. Materials and Methods
2.1. Study Design and Participants
This observational longitudinal study is still ongoing (NCT04923165). We analyzed the preliminary data based on a cohort of post-stroke patients, admitted to our rehabilitation unit between June 2021 and September 2022. Patients were sequentially enrolled and evaluated at admission (T0) and after a 6-week rehabilitation program (T1).
The following inclusion criteria were applied: (i) first ischemic or hemorrhagic stroke, diagnosed by magnetic resonance imaging (MRI) or computed tomography (CT); (ii) age range between 18 and 85 years; (iii) time from stroke onset less than six months; (iv) adequate cognitive and language skills to sign the informed consent and to understand the advice for the administration of the assessment scales.
The following exclusion criteria were applied: (i) a prior stroke; (ii) cognitive and behavioral disorder, decreased compliance, preventing doing active therapy or understanding and signing informed consent; (iii) presence of pacemakers, which can interfere with bioelectrical impedance analysis. The Ethical Committee of Don Carlo Gnocchi Foundation, Milan, Italy approved the study protocol on 14 October 2020 (FDG_6_14/10/20). All patients analyzed gave their written informed consent after a detailed explanation of the study’s aims and rehabilitation treatment.
2.2. Rehabilitation Treatment
Patients were placed through a rehabilitation program that included traditional physical therapy, executed for 45 min a day, for six days a week. Rehabilitation treatment included passive, active-assisted, and active mobilizations, exercises for muscle-strength recovery, stretching, sensorimotor stimulation, functional and task-oriented training, postural passages and transfers, proprioceptive exercises, motor-coordination and balance training, walking training, sitting and standing training, and activities of daily living recovery training. They also performed task-oriented exercises such as reaching and grasping movements (e.g., reaching and picking up a glass or other objects), activities of daily living (e.g., transfers, dressing, brushing/combing hair, depending on subject’s ability), to increase the subject’s participation in order to promote neuroplasticity and improve upper limb motor recovery.
Additionally, each patient used a set of robotic devices for robotic therapy of the upper limb, five times per week, each session lasting 45 min. Four robotic devices were employed in the robotic treatment: (i) Motore (Humanware, Pisa, Italy), a robotic device that allows passive, active, and active-assistive planar shoulder and elbow joints movements; (ii) Amadeo (Tyromotion, Graz, Austria) a robotic device for passive, active, and active-assistive finger flexion and extension movements; (iii) Pablo (Tyromotion, Graz, Austria) a sensor-based system that enables unsupported 3-dimensional movements of shoulder, elbow, and wrist joint, both unimanual and bimanual; and (iv) Diego (Tyromotion, Graz, Austria) a robotic system that enables 3-dimensional, unimanual and bimanual, movements of the shoulder joint, with arm weight support. Patients who underwent upper-limb robotic therapy carried out both physical and cognitive activities; the robotic equipment assisted them by providing visual and audible feedback [34,35].
2.3. Clinical Assessment and Anthropometric Measurements
On admission (T0), demographic, anamnestic, and clinical information were documented. Disease burden was assessed by means of the 56-point Cumulative Illness Rating Scale (CIRS) [36]. Dysphagia, without indicating severity, was registered at T0.
Body weight and height assessments were included in the anthropometric measurements. Body weight was measured weekly for monitoring any consistent weight changes and it was recorded at T0 and T1. A calibrated balance scale (Seca 750, Seca Hamburg, Germany) was used to measure the weight of autonomous patients, while a chair weighing scale (Wunder DE5, Wunder Sa.Bi. srl; Milan, Italy) was employed for nonautonomous ones. After an overnight fast, measurements were obtained early in the morning. Height was recorded at T0 for each patient who could stand, reporting data in meters (m), accurate to the nearest 0.1 cm. The height of those unable to stand was measured and checked with the knee height [37]. Then, we assessed the body mass index (BMI, kg/m2) at T0 and T1.
2.4. Bioelectrical Impedance Analysis
The use of a tetrapolar whole-body bioelectrical impedance analysis (BIA) device (101 anniversary sport edition, Akern, Florence, Italy) was utilized to perform bioelectrical impedance analysis (BIA) in order to evaluate the subject’s body composition at both time points T0 and T1.
This apparatus is a bioelectrical impedance analyzer that operates at a single frequency and generates a sinusoidal current operating at 50 kHz. Before beginning measurements, operators were given instructions to ensure that data acquisition was carried out appropriately, to minimize estimation errors as much as possible.
Specifically, patients should lie supine for at least 2 min before testing to allow for even distribution of body fluids. Following that, certified electrodes were placed on the foot (metatarsus region) and hand (metacarpus region) of the hemisoma without hemiparesis, with a distance of 5 cm between the two electrodes. To prevent alterations in measurements, the skin at the contact point must be clean and not greasy, dry, or wet. In the final step, we ensured that the four limbs did not adhered to the body and were evenly spaced. Because of the possible alteration of bioelectric resistance due to body temperature, patients with fever or hypothermia were not analyzed. In addition, the absence of pacemakers was ascertained.
The bioimpedance analysis measures the bioelectrical impedance (Z) of biological tissues. Z is a complex quantity composed of resistance (Rz), which represents the resistance of electrolytes to the flow of an electric current, and reactance (Xc) which is affected by the capacitance of the cell membrane. Body composition parameters can then be estimated by means of a predictive equation, using regression analysis including several variables such as Rz, Xc, sex, age, stature, and weight [33,38].
In order to analyze body composition, lean mass, fat mass, and muscle quality parameters are measured in this study.
Total fat-free mass (FFM), appendicular skeletal muscle mass (ASMM), and body cell mass (BCM) were measured for body lean mass assessment. The fat-free mass index (FFMI), skeletal muscle mass index (SMI), and body cell mass index (BCMI) were then calculated by dividing the FFM, ASMM, and BCM measures for the height squared of each patient.
Total fat mass (FM) was included along with its index (fat mass index, FMI), which was calculated as described previously for the body lean mass assessment.
The BIA-derived PhA, calculated from Rz and Xc obtained from the BIA analysis and expressed in degrees, was also included for muscle quality assessment. The manufacturer recommends a normal range from 5° to 7°, and the variation may be influenced by age, gender, ethnicity, body composition, amount of physical activity, and body fat [39].
All the parameters were valued from proprietary manufacturer algorithms using Bodygram Plus software (Akern, Florence, Italy).
2.5. Functional Mobility Assessment: Performance in Activity of Daily Living
Patients at T0 and T1 were assess their performance in activity of daily living (ADL), by means of the modified Barthel index (BI). Modified BI is a measure of physical disability used to evaluate how patients with disabling conditions, including stroke, behave when engaging in daily living activities. It measures, in a 20 min questionnaire, what patients do in practice, evaluating the following items: feeding, personal hygiene, dressing, bathing, bladder control, bowel control, toilet transfers, stair climbing, ambulation/wheelchair, ambulation, chair/bed transfer. Each item has a specific score, and the total of all items can range from 0 to 100. Higher scores indicate better functional independence, while lower scores indicate a greater degree of mobility and self-care disability [40].
2.6. Statistical Analysis
Patients’ demographic and clinical features were reported using descriptive statistics, where numerical data were expressed as the mean and SD, and categorical data were presented as counts and percentages.
Moreover, to compare the body composition variables between admission (T0) and discharge (T1), we used the Wilcoxon signed rank test.
The correlation of the body composition parameters from BIA analysis with the functional status, as measured by the modified BI at T0, was investigated using the Spearman’s rank correlation coefficients. We also performed bivariate analyses to verify the possible effect of age, sex, BMI, type of stroke, paresis in the dominant art, smoking, comorbidities, CIRS, and time from stroke onset; Spearman’s rho correlation test, or Mann–Whitney U test, was used as appropriate. We then performed a multiple linear regression analysis with BI at T0 as the dependent variable and BIA parameters adjusting for confounding variables that turned out to have a significant association in the bivariate analyses.
After treatment, patients were classified as responders if the change from baseline of the modified Barthel Index (ΔBI = BIT1 − BIT0) was higher than 10 points; otherwise, they were classified as non-responders. This threshold was detected in our sample, using the approach suggested by Castiglia et al. [41]. Then, we compared the body composition variables at baseline between patients with better or worse recovery, using the Mann–Whitney U test.
In addition, to further examine the potential association between BIA parameters and recovery, we first analyzed the effect of previously mentioned confounding variables and BI at T0 with bivariate analyses using the Pearson chi-squared or the Mann–Whitney U test as appropriate. Variables significantly different between responders and non-responders in the bivariate analysis were entered into a multivariable logistic regression, together with the BIA parameters for predicting the probability of response. A p-value lower than 0.05 was deemed significant. Statistical analysis was performed using SPSS version 28 (BM Corp., Armonk, NY, USA).
3. Results
3.1. Participants and Baseline Characteristics
We screened 120 patients and 66 were enrolled and evaluated (women n = 37; mean age 69 ± 12 years), according to the inclusion criteria.
The baseline characteristics (demographic and clinical features, disability assessment, and anthropometric measurements) of the enrolled sample are reported in Table 1. Dysphagia was calculated without considering its severity; none of the patients required enteral nutrition (e.g., gastrostomy, nasogastric tube) or parenteral nutrition.

Table 1.
Baseline characteristics of the sample (n = 66). Data are reported in mean ± standard deviation or number (percentage).
3.2. Change in Body Composition
Table 2 reports the BIA parameters for the sample group. We included both total and height-adjusted measurements. In our sample, body composition in terms of the body fat mass parameters, body lean mass parameters, including BCM, and PhA did not change significantly after the six-week rehabilitation program. Moreover, PhA values measured at T0 and T1, were below the normal range from 5° to 7°.
Table 2.
Bioelectrical impedance analysis parameters at baseline (T0) and at discharge (T1) of patients enrolled (n = 66).
3.3. Body Composition and Performance in ADL
We first examined which BIA’s parameters were associated with the Barthel Index at admission. The Spearman’s correlation test (Table 3) showed a significant correlation with all the body lean mass parameters; in particular, BCM showed the higher value of Spearman’s rho correlation coefficient. In contrast, no significant correlations were found for the body fat mass composition parameters. Finally, muscle quality, as measured using the PhA, was also positively correlated with the Barthel Index.
Table 3.
Correlations between Barthel Index and body composition parameters measured by bioelectrical impedance analysis (BIA) at admission (T0).
3.4. Body Composition and Recovery
When comparing the body composition BIA parameters at baseline in patients with a worse recovery (n = 34) or with a better recovery (n = 32) (Figure 1), we detected a significant difference in the lean mass parameters. Patients with a better recovery showed higher values of FFM (54.1 ± 9.8 vs. 47.5 ± 9.5, p = 0.011), FFMI (19.0 ± 2.5 vs. 17.5 ± 2.8, p = 0.031), ASMM (20.5 ± 4.8 vs. 17.3 ± 5.1, p = 0.010), SMI (7.2 ± 1.2 vs. 6.3 ± 1.5, p = 0.007), BCM (25.6 ± 6.7 vs. 21.1 ± 6.9, p = 0.013) and BCMI (9.0 ± 2.2 vs. 7.8 ± 2.3, p = 0.022) with respect to the patients with worse recovery. On the contrary, no significant differences were found in the body fat mass parameters. Finally, even if not significantly, PhA values appeared higher in patients with better recovery, with respect to those with worse recovery (4.9 ± 1.1 vs. 4.4 ± 1.0, p = 0.078).
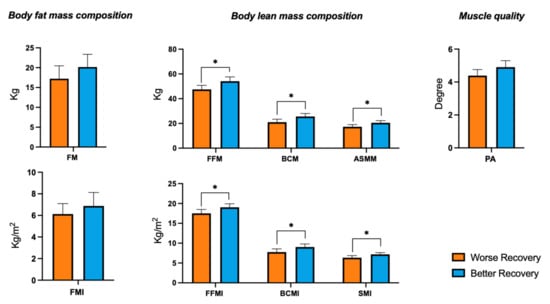
Figure 1.
Analysis of body composition parameters at admission and rehabilitation recovery. Comparison of BIA parameters at baseline between patients with better recovery (ΔBI > 10) or with worse recovery, (ΔBI ≤ 10). FM, fat mass; FMI, fat mass index; FFM, fat-free mass; FFMI, fat-free mass index; ASMM, appendicular skeletal muscle mass; SMI, skeletal muscle Index; BCM, body cell mass; BCMI, body cell mass index; PhA, phase angle. Mean bars and 95% of CI are reported. * refers to the statistically significant difference (p < 0.05), according to the Mann–Whitney U test.
3.5. The Role of BCM
Focusing on BCM, we first investigated its association with performance in ADL measured by BI T0. The linear regression analysis showed a significant association between BI T0 and BCM, even adjusting for sex and age as confounders (Table 4).
Table 4.
Linear regression results for Barthel index at baseline (BI T0).
Finally, from the logistic regression analysis (Table 5), we found that BCM at T0 was positively associated with a better recovery, regardless of BI at T0, sex, and the presence of paresis on the dominant arm.
Table 5.
Multiple logistic regression analysis for recovery in ADL.
4. Discussion
The results presented herein confirmed the well-known relationship between muscle mass and muscle quality parameters measured by BIA with rehabilitation outcome in post-stroke patients. Additionally, we found that BCM measured at admission may be a novel biomarker for the evaluation of post-stroke rehabilitation treatment. In fact, BCM T0 is not only positively correlated with baseline ADL performance, but it is also positively associated with patients’ recovery, regardless of their performance at admission.
After a stroke insult, there could be an impairment in body composition [12], so the BIA analysis may be helpful in determining the proper rehabilitation and nutrition management in post-stroke patients [13]. As recently published, lean body mass at admission, especially muscular tissue, plays a role in surviving from stroke [13]. A muscle healthy condition is crucial for the recovery: muscle mass deficit, in terms of lower value of skeletal muscle index (SMI), has been proven to be an independent poor outcome predictor in acute stroke patients [17]. Moreover, stroke-related sarcopenia, which is a condition characterized by loss of muscle strength, mass, and function, had a negative effect on functional recovery [19,23], whereas its improvement corresponds to a better functional outcome [20]. Another commonly measured BIA-derived parameter is PhA, which it is associated with cell membrane integrity, cells function, and hydration [39]. Recent research examined the importance of PhA as a biomarker for the evaluation for the diagnosis of malnutrition/undernutrition [42] and of the effectiveness of rehabilitation treatment in post-stroke patients [24,26,27].
Our study confirmed the actual link between lean and muscle mass and muscle quality and functional status at baseline in subacute post-stroke patients admitted to rehabilitation. In fact, the FFM, ASMM, and their relative indices (height-squared-adjusted: FFMI, SMI), as well as PhA were positively correlated with the ADL at baseline. On the other hand, there was no correlation between the baseline ADL and any of the fat mass-related measurements. Even though PhA between two groups is not significantly different, it is important to note that the PhA mean values in both groups were under the normal range, indicating a muscle quality impairment.
From our results, besides the above-discussed BIA parameters, BCM also appears to play a role in the evaluation of post-stroke recovery. BCM had the higher correlation with the baseline ADL. Moreover, higher values of BCM and BCMI at admission were seen in patients with a better recovery. These results could be connected with the known link between BCM and nutritional status. BCM evaluation identifies the metabolically active part of FFM, in contrast to bone and extracellular water. Hence, it reflects the body’s cellular components involved in oxygen consumption and resting metabolism [22,32]. BCM is associated with the resting energy expenditure (REE), which represents energy consumption to maintain essential life functions while at rest [32]. It has also been suggested that measuring BCM is important for the nutritional screening and management of critically ill patients. In fact, low values of BCM reflect a malnutrition status for such serious subjects [33].
As found in our logistic regression analysis, BCM was independently associated with better recovery of post-stroke patients. Notably, the performance in ADL at baseline, sex, and paresis in the dominant arm did not influence this association. The sample size of this study was insufficient to verify the effect of more confounders as independent variables in the regression analysis. We are planning to verify if BCM may effectively predict the recovery in post-stroke patients on a larger sample.
Another result is that, in our study, we found no differences in patients’ body composition parameters after six weeks of rehabilitation treatment. The literature on this topic is very poor, and in disagreement. One study reported that muscle mass did not differ in post-stroke patients after a four weeks of rehabilitation treatment [43], while another one found a loss of lean and fat mass and an increase in muscle mass after a five-week rehabilitation program [44]. In addition, this study showed that in post-stroke patients, SMI increased with rehabilitation of 1–6 months and that the increase was independently associated with length of hospital stays [45].
In our opinion, the intervention time is too short to observe a positive change in body composition. In fact, elderly patients with strokes may suffer from a decline in muscle mass related to aging and immobility [12], and they should be treated with a specific rehabilitation protocol that considers adequate nutritional intervention and exercise training. In fact, it has been shown that a specific exercise training program [46] together with adequate supplementation [47] could ameliorate the body composition of post-stroke patients.
The preliminary results presented herein deserve future study on a bigger sample in order to confirm the data. In fact, one limitation of this study is due to a limited sample recruited only in a single rehabilitation facility. A multicentered study planned in the near future will deal with this restriction and will increase the sample size.
5. Conclusions
An analysis of the patient’s body composition is important to determine the general health status of subacute post-stroke patients undergoing a rehabilitation treatment. Moreover, BCM is a BIA parameter that should be assessed at admission not only to improve the valuation of the nutritional status in post-stroke patients, but also to potentially predict their recovery.
Examining and monitoring the body composition and the nutritional status of stroke patients hospitalized in a rehabilitation unit are critical in order to guide and prepare for prompt nutritional assistance as well as dietary intervention.
Author Contributions
Conceptualization, A.G., M.S. (Mariacristina Siotto) and I.A.; methodology, A.G., M.G., M.S. (Mariacristina Siotto); software, M.G.; validation, M.S. (Mariacristina Siotto), M.G.; formal analysis, A.G.; investigation, A.G., M.S. (Mariacristina Siotto), M.G., M.S. (Mirko Schirru), A.P., V.C., S.I.; data curation, A.G., M.S. (Mariacristina Siotto) and M.G.; writing—original draft preparation, A.G.; writing—review and editing, A.G., M.S. (Mariacristina Siotto), M.G. and I.A.; visualization, M.S. (Mirko Schirru), A.P., V.C., S.I. and I.A.; supervision: I.A. All authors have read and agreed to the published version of the manuscript.
Funding
This study was partially supported and funded by the Italian Ministry of Health (Ricerca Corrente).
Institutional Review Board Statement
The study was conducted in accordance with the Declaration of Helsinki and approved by the Comitato Etico della Sezione “IRCCS Fondazione Don Carlo Gnocchi” del Comitato Etico IRCCS Regione Lombardia.
Informed Consent Statement
After a detailed explanation of the study’s aims and rehabilitation protocols, all patients involved in the study signed the informed consent.
Data Availability Statement
The data supporting the results of this study are accessible from the corresponding author upon reasonable request.
Conflicts of Interest
The authors declare no conflict of interest.
References
- Kim, J.; Thayabaranathan, T.; Donnan, G.A.; Howard, G.; Howard, V.J.; Rothwell, P.M.; Feigin, V.; Norrving, B.; Owolabi, M.; Pandian, J.; et al. Global Stroke Statistics 2019. Int. J. Stroke 2020, 15, 819–838. [Google Scholar] [CrossRef] [PubMed]
- Liu, K.; Yin, M.; Cai, Z. Research and Application Advances in Rehabilitation Assessment of Stroke. J. Zhejiang Univ. Sci. B 2022, 23, 625–641. [Google Scholar] [CrossRef] [PubMed]
- Skidmore, E.R.; Shih, M. Stroke Rehabilitation: Recent Progress and Future Promise. OTJR 2022, 42, 175–181. [Google Scholar] [CrossRef] [PubMed]
- Prabhakaran, S.; Zarahn, E.; Riley, C.; Speizer, A.; Chong, J.Y.; Lazar, R.M.; Marshall, R.S.; Krakauer, J.W. Inter-Individual Variability in the Capacity for Motor Recovery after Ischemic Stroke. Neurorehabil. Neural Repair 2008, 22, 64–71. [Google Scholar] [CrossRef]
- Kwakkel, G.; Wagenaar, R.C.; Kollen, B.J.; Lankhorst, G.J. Predicting Disability in Stroke—A Critical Review of the Literature. Age Ageing 1996, 25, 479–489. [Google Scholar] [CrossRef]
- Huppertz, V.; Guida, S.; Holdoway, A.; Strilciuc, S.; Baijens, L.; Schols, J.M.G.A.; van Helvoort, A.; Lansink, M.; Muresanu, D.F. Impaired Nutritional Condition After Stroke From the Hyperacute to the Chronic Phase: A Systematic Review and Meta-Analysis. Front. Neurol. 2021, 12, 780080. [Google Scholar] [CrossRef]
- Lee, Y.-C.; Chiu, E.-C. Nutritional Status as a Predictor of Comprehensive Activities of Daily Living Function and Quality of Life in Patients with Stroke. NeuroRehabilitation 2021, 48, 337–343. [Google Scholar] [CrossRef]
- Nishioka, S.; Wakabayashi, H.; Nishioka, E.; Yoshida, T.; Mori, N.; Watanabe, R. Nutritional Improvement Correlates with Recovery of Activities of Daily Living among Malnourished Elderly Stroke Patients in the Convalescent Stage: A Cross-Sectional Study. J. Acad. Nutr. Diet. 2016, 116, 837–843. [Google Scholar] [CrossRef]
- Shimazu, S.; Yoshimura, Y.; Kudo, M.; Nagano, F.; Bise, T.; Shiraishi, A.; Sunahara, T. Frequent and Personalized Nutritional Support Leads to Improved Nutritional Status, Activities of Daily Living, and Dysphagia after Stroke. Nutrition 2021, 83, 111091. [Google Scholar] [CrossRef]
- Sabbouh, T.; Torbey, M.T. Malnutrition in Stroke Patients: Risk Factors, Assessment, and Management. Neurocrit. Care 2018, 29, 374–384. [Google Scholar] [CrossRef]
- Di Vincenzo, O.; Luisi, M.L.E.; Alicante, P.; Ballarin, G.; Biffi, B.; Gheri, C.F.; Scalfi, L. The Assessment of the Risk of Malnutrition (Undernutrition) in Stroke Patients. Nutrients 2023, 15, 683. [Google Scholar] [CrossRef] [PubMed]
- Scherbakov, N.; von Haehling, S.; Anker, S.D.; Dirnagl, U.; Doehner, W. Stroke Induced Sarcopenia: Muscle Wasting and Disability after Stroke. Int. J. Cardiol. 2013, 170, 89–94. [Google Scholar] [CrossRef] [PubMed]
- Nakanishi, N.; Okura, K.; Okamura, M.; Nawata, K.; Shinohara, A.; Tanaka, K.; Katayama, S. Measuring and Monitoring Skeletal Muscle Mass after Stroke: A Review of Current Methods and Clinical Applications. J. Stroke Cerebrovasc. Dis. 2021, 30, 105736. [Google Scholar] [CrossRef]
- Kim, S.; Won, C.W. Sex-Different Changes of Body Composition in Aging: A Systemic Review. Arch. Gerontol. Geriatr. 2022, 102, 104711. [Google Scholar] [CrossRef]
- English, C.; Thoirs, K.; Coates, A.; Ryan, A.; Bernhardt, J. Changes in Fat Mass in Stroke Survivors: A Systematic Review. Int. J. Stroke 2012, 7, 491–498. [Google Scholar] [CrossRef] [PubMed]
- Scherbakov, N.; Sandek, A.; Doehner, W. Stroke-Related Sarcopenia: Specific Characteristics. J. Am. Med. Dir. Assoc. 2015, 16, 272–276. [Google Scholar] [CrossRef] [PubMed]
- Ohyama, K.; Watanabe, M.; Nosaki, Y.; Hara, T.; Iwai, K.; Mokuno, K. Correlation Between Skeletal Muscle Mass Deficit and Poor Functional Outcome in Patients with Acute Ischemic Stroke. J. Stroke Cerebrovasc. Dis. 2020, 29, 104623. [Google Scholar] [CrossRef] [PubMed]
- Matsushita, T.; Nishioka, S.; Taguchi, S.; Yamanouchi, A. Sarcopenia as a Predictor of Activities of Daily Living Capability in Stroke Patients Undergoing Rehabilitation. Geriatr. Gerontol. Int. 2019, 19, 1124–1128. [Google Scholar] [CrossRef]
- Siotto, M.; Germanotta, M.; Guerrini, A.; Pascali, S.; Cipollini, V.; Cortellini, L.; Ruco, E.; Khazrai, Y.M.; De Gara, L.; Aprile, I. Relationship between Nutritional Status, Food Consumption and Sarcopenia in Post-Stroke Rehabilitation: Preliminary Data. Nutrients 2022, 14, 4825. [Google Scholar] [CrossRef]
- Matsushita, T.; Nishioka, S.; Taguchi, S.; Yamanouchi, A.; Okazaki, Y.; Oishi, K.; Nakashima, R.; Fujii, T.; Tokunaga, Y.; Onizuka, S. Effect of Improvement in Sarcopenia on Functional and Discharge Outcomes in Stroke Rehabilitation Patients. Nutrients 2021, 13, 2192. [Google Scholar] [CrossRef]
- Borga, M.; West, J.; Bell, J.D.; Harvey, N.C.; Romu, T.; Heymsfield, S.B.; Dahlqvist Leinhard, O. Advanced Body Composition Assessment: From Body Mass Index to Body Composition Profiling. J. Investig. Med. 2018, 66, 1–9. [Google Scholar] [CrossRef] [PubMed]
- Kyle, U.G.; Bosaeus, I.; De Lorenzo, A.D.; Deurenberg, P.; Elia, M.; Gómez, J.M.; Heitmann, B.L.; Kent-Smith, L.; Melchior, J.-C.; Pirlich, M.; et al. Bioelectrical Impedance Analysis—Part I: Review of Principles and Methods. Clin. Nutr. 2004, 23, 1226–1243. [Google Scholar] [CrossRef] [PubMed]
- Park, J.G.; Lee, K.W.; Kim, S.B.; Lee, J.H.; Kim, Y.H. Effect of Decreased Skeletal Muscle Index and Hand Grip Strength on Functional Recovery in Subacute Ambulatory Stroke Patients. Ann. Rehabil. Med. 2019, 43, 535–543. [Google Scholar] [CrossRef] [PubMed]
- Irisawa, H.; Mizushima, T. Correlation of Body Composition and Nutritional Status with Functional Recovery in Stroke Rehabilitation Patients. Nutrients 2020, 12, 1923. [Google Scholar] [CrossRef]
- Park, S.; Kim, J.; Kim, Y.; Kim, M.-W. Correlation of Body Composition via Bioelectrical Impedance Analysis and Motor Function and Recovery of Upper Extremity in Patients Undergoing Stroke Rehabilitation. Brain Neurorehabil. 2022, 15, e20. [Google Scholar] [CrossRef]
- Bise, T.; Yoshimura, Y.; Wakabayashi, H.; Nagano, F.; Kido, Y.; Shimazu, S.; Shiraishi, A.; Matsumoto, A. Association between BIA-Derived Phase Angle and Sarcopenia and Improvement in Activities of Daily Living and Dysphagia in Patients Undergoing Post-Stroke Rehabilitation. J. Nutr. Health Aging 2022, 26, 590–597. [Google Scholar] [CrossRef]
- Abe, T.; Yoshimua, Y.; Imai, R.; Sato, Y. A Combined Assessment Method of Phase Angle and Skeletal Muscle Index to Better Predict Functional Recovery after Acute Stroke. J. Nutr. Health Aging 2022, 26, 445–451. [Google Scholar] [CrossRef]
- Abe, T.; Yoshimura, Y.; Imai, R.; Yoneoka, Y.; Tsubaki, A.; Sato, Y. Impact of Phase Angle on Physical Function in Patients with Acute Stroke. J. Stroke Cerebrovasc. Dis. 2021, 30, 105941. [Google Scholar] [CrossRef]
- Matsushita, T.; Nishioka, S.; Yamanouchi, A.; Okazaki, Y.; Oishi, K.; Nakashima, R.; Tokunaga, Y.; Onizuka, S. Predictive Ability of Hand-Grip Strength and Muscle Mass on Functional Prognosis in Patients Rehabilitating from Stroke. Nutrition 2022, 102, 111724. [Google Scholar] [CrossRef]
- Yoshimura, Y.; Wakabayashi, H.; Bise, T.; Tanoue, M. Prevalence of Sarcopenia and Its Association with Activities of Daily Living and Dysphagia in Convalescent Rehabilitation Ward Inpatients. Clin. Nutr. 2018, 37, 2022–2028. [Google Scholar] [CrossRef]
- Cruz-Jentoft, A.J.; Bahat, G.; Bauer, J.; Boirie, Y.; Bruyère, O.; Cederholm, T.; Cooper, C.; Landi, F.; Rolland, Y.; Sayer, A.A.; et al. Sarcopenia: Revised European Consensus on Definition and Diagnosis. Age Ageing 2019, 48, 16–31. [Google Scholar] [CrossRef]
- Savalle, M.; Gillaizeau, F.; Maruani, G.; Puymirat, E.; Bellenfant, F.; Houillier, P.; Fagon, J.-Y.; Faisy, C. Assessment of Body Cell Mass at Bedside in Critically Ill Patients. Am. J. Physiol.-Endocrinol. Metab. 2012, 303, E389–E396. [Google Scholar] [CrossRef] [PubMed]
- Moonen, H.P.F.X.; Van Zanten, A.R.H. Bioelectric Impedance Analysis for Body Composition Measurement and Other Potential Clinical Applications in Critical Illness. Curr. Opin. Crit. Care 2021, 27, 344–353. [Google Scholar] [CrossRef] [PubMed]
- Aprile, I.; Cruciani, A.; Germanotta, M.; Gower, V.; Pecchioli, C.; Cattaneo, D.; Vannetti, F.; Padua, L.; Gramatica, F. Upper Limb Robotics in Rehabilitation: An Approach to Select the Devices, Based on Rehabilitation Aims, and Their Evaluation in a Feasibility Study. Appl. Sci. 2019, 9, 3920. [Google Scholar] [CrossRef]
- Aprile, I.; Germanotta, M.; Cruciani, A.; Loreti, S.; Pecchioli, C.; Cecchi, F.; Montesano, A.; Galeri, S.; Diverio, M.; Falsini, C.; et al. Upper Limb Robotic Rehabilitation After Stroke: A Multicenter, Randomized Clinical Trial. J. Neurol. Phys. Ther. 2020, 44, 3–14. [Google Scholar] [CrossRef]
- Hudon, C.; Fortin, M.; Vanasse, A. Cumulative Illness Rating Scale Was a Reliable and Valid Index in a Family Practice Context. J. Clin. Epidemiol. 2005, 58, 603–608. [Google Scholar] [CrossRef]
- Chumlea, W.C.; Roche, A.F.; Steinbaugh, M.L. Estimating Stature from Knee Height for Persons 60 to 90 Years of Age. J. Am. Geriatr. Soc. 1985, 33, 116–120. [Google Scholar] [CrossRef]
- Khalil, S.F.; Mohktar, M.S.; Ibrahim, F. The Theory and Fundamentals of Bioimpedance Analysis in Clinical Status Monitoring and Diagnosis of Diseases. Sensors 2014, 14, 10895–10928. [Google Scholar] [CrossRef]
- Di Vincenzo, O.; Marra, M.; Di Gregorio, A.; Pasanisi, F.; Scalfi, L. Bioelectrical Impedance Analysis (BIA)-Derived Phase Angle in Sarcopenia: A Systematic Review. Clin. Nutr. 2021, 40, 3052–3061. [Google Scholar] [CrossRef]
- Shah, S.; Vanclay, F.; Cooper, B. Improving the Sensitivity of the Barthel Index for Stroke Rehabilitation. J. Clin. Epidemiol. 1989, 42, 703–709. [Google Scholar] [CrossRef]
- Castiglia, S.F.; Galeoto, G.; Lauta, A.; Palumbo, A.; Tirinelli, F.; Viselli, F.; Santilli, V.; Sacchetti, M.L. The Culturally Adapted Italian Version of the Barthel Index (IcaBI): Assessment of Structural Validity, Inter-Rater Reliability and Responsiveness to Clinically Relevant Improvements in Patients Admitted to Inpatient Rehabilitation Centers. Funct. Neurol. 2017, 22, 221–228. [Google Scholar] [CrossRef] [PubMed]
- Serón-Arbeloa, C.; Labarta-Monzón, L.; Puzo-Foncillas, J.; Mallor-Bonet, T.; Lafita-López, A.; Bueno-Vidales, N.; Montoro-Huguet, M. Malnutrition Screening and Assessment. Nutrients 2022, 14, 2392. [Google Scholar] [CrossRef]
- Irisawa, H.; Mizushima, T. Assessment of Changes in Muscle Mass, Strength, and Quality and Activities of Daily Living in Elderly Stroke Patients. Int. J. Rehabil. Res. 2022, 45, 161–167. [Google Scholar] [CrossRef] [PubMed]
- Przysada, G.; Czenczek-Lewandowska, E.; Wyszyńska, J.; Weres, A.; Baran, J.; Kwolek, A.; Leszczak, J. Effect of Post-Stroke Rehabilitation on Body Mass Composition in Relation to Socio-Demographic and Clinical Factors. Int. J. Environ. Res. Public Health 2020, 17, 5134. [Google Scholar] [CrossRef]
- Ogawa, T.; Suenaga, M. Elderly Patients after Stroke Increase Skeletal Muscle Mass by Exercise Therapy in Rehabilitation Wards. J. Stroke Cerebrovasc. Dis. 2021, 30, 105958. [Google Scholar] [CrossRef]
- Vahlberg, B.; Lindmark, B.; Zetterberg, L.; Hellström, K.; Cederholm, T. Body Composition and Physical Function after Progressive Resistance and Balance Training among Older Adults after Stroke: An Exploratory Randomized Controlled Trial. Disabil. Rehabil. 2017, 39, 1207–1214. [Google Scholar] [CrossRef]
- Yoshimura, Y.; Bise, T.; Shimazu, S.; Tanoue, M.; Tomioka, Y.; Araki, M.; Nishino, T.; Kuzuhara, A.; Takatsuki, F. Effects of a Leucine-Enriched Amino Acid Supplement on Muscle Mass, Muscle Strength, and Physical Function in Post-Stroke Patients with Sarcopenia: A Randomized Controlled Trial. Nutrition 2019, 58, 1–6. [Google Scholar] [CrossRef] [PubMed]

Disclaimer/Publisher’s Note: The statements, opinions and data contained in all publications are solely those of the individual author(s) and contributor(s) and not of MDPI and/or the editor(s). MDPI and/or the editor(s) disclaim responsibility for any injury to people or property resulting from any ideas, methods, instructions or products referred to in the content. |
© 2023 by the authors. Licensee MDPI, Basel, Switzerland. This article is an open access article distributed under the terms and conditions of the Creative Commons Attribution (CC BY) license (https://creativecommons.org/licenses/by/4.0/).