Abstract
Recently the incorporation of artificial intelligence has allowed the development of valuable methodological advances in taphonomy. Some studies have achieved great precision in identifying the carnivore that produced tooth marks. Additionally, other works focused on human activity have managed to specify what type of tool or raw material was used in the filleting processes identified at the sites. Through the use of geometric morphometrics and machine learning techniques, the present study intends to analyze the cut marks of the Ulaca oppidum (Solosancho, Ávila, Spain) in order to identify the type of tools used during carcass modification. Although the Ulaca oppidum is an Iron Age site, the results suggest that most of the cut marks were produced with flint tools.
Keywords:
Iron Age; geometric morphology; robust statistics; Vettones; zooarchaeology; taphonomy; cut marks 1. Introduction
The combination of morphometrics, robust statistics, and artificial intelligence applied to taphonomy has generated an extensive literature in recent years [1,2,3,4,5,6,7,8,9,10,11,12,13,14,15,16,17,18,19,20,21,22,23,24,25,26,27,28,29,30,31,32,33,34,35]. The use of these novel technologies has made it possible to clarify concepts widely discussed in taphonomy, such as the equifinality problems related to the action of carnivores in archaeological sites. In this way, using geometric morphometric techniques together with the application of machine and deep learning or robust statistics has provided the necessary tools to classify tooth marks in experimental contexts [11,13,27,28] and even identify which carnivore produced the tooth marks in different archaeological sites [14,21,32,34].
Regarding the problems derived from the identification of human activity, artificial intelligence has also enabled the classification of cut marks produced with different tools using experimental samples [2,3,6,8,16,17,20,23], as well as archaeological remains [4,11,24,26,27,30]. The recent application of these novel methods has expanded the range of techniques in taphonomy that aim to analyze bone alterations in detail, which until the beginning of the 21st century were often limited to the use of scanning electron microscopy [36,37,38,39] or other techniques [40]. The implementation of new digital tools has also provided an increase in the resolution of taphonomic studies, the improvement of three-dimensional documentation, and the reproducibility of the study process.
Considering these methodological improvements, this work presents the application of combined geometric morphometric and machine learning techniques to the analysis of the cut marks documented in the oppidum of Ulaca (Solosancho, Ávila, Spain) [41] with the aim of determining the type of tool used during carcass modification. Since this is a site from the Iron Age, the cut marks found on the faunal remains could have been possibly made with metal tools, such as knives, axes, or swords [41] (Figure 4a). In the present study, we analyze the morphology of the Ulaca cut marks in detail in order to specify the type of tool used in the animal defleshing processes and verify if, in this particular case, metal tools were employed in daily activities.
The Ulaca Oppidum
Ulaca is located near Villaviciosa (Solosancho, Ávila, Spain) (Google Earth DMS coordinates of 40°31′48.53″ N and 4°53′01.04″ W) (Figure 1a). The site occupies the top of a hill that provides visual control over the Amblés Valley [42,43]. Ulaca is an urban center or oppidum of the end of the Iron Age (c.III-I BC) erected by people known as the Vettones. The Vettones were one of the most remarkable populi in Celtic Iberia. Texts addressing these populations from classical Greek and Roman authors described them as groups occupying the territory of the current provinces of Ávila and Salamanca, as well as parts of Zamora, Cáceres, and Toledo. Ulaca is one of the largest fortified sites in the Iberian Peninsula [44,45], with more than 70 ha and over 3000 m of walls, where a ca 1500 people would have lived [42]. The site is constituted by well-preserved structures, including impressive granite quarries, a rock sanctuary (Figure 1d), and a sauna (Figure 1b) or a voluminous building known as “El Torreón” (the Tower) (Figure 1c) [42,43,46,47,48]. This oppidum shows a complex spatial organization with different areas for distinct functions, such as an area of artisan workshops or a cemetery [49,50,51].
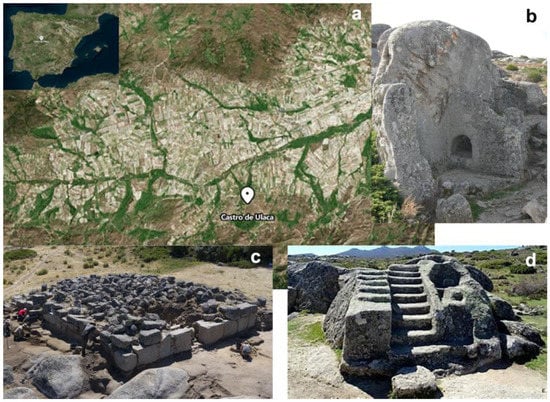
Figure 1.
(a) Location of the Ulaca oppidum (Solosancho, Ávila, Spain). Details of some of the most characteristic structures of the site: (b) The sauna; (c) The Tower; (d) The rock altar.
The inhabitants of Ulaca practiced different economic activities, such as craft, cereal agriculture, and livestock practices. The proximity of some water courses (Figure 1a) allowed agricultural activities to be carried out [50,52]. Zooarchaeological studies have shown a predominance of cattle (40% faunal remains), followed by horses, suidae, and ovicaprids, although the latter groups were poorly represented [41]. Thus, the economic base of the Vetton social elites resides in the control of the land and the cattle [51].
Taphonomic evidence in the form of cut marks associated with episodes of skinning, fleshing, and disarticulation has shown that animals, including cows and horses, were also consumed at the site [41]. The observed cut marks are usually limited to fine traces, but, in some cases, deep marks, which could be associated with cuts produced by metal tools, have been identified [41] (Figure 4a). Metal tools are not frequent in Ulaca; for instance, in the 233 m2 area studied by [41], a total of 150 metal objects/fragments were found, of which 84 were made of iron. Among the objects, some knives stand out, such as those included in Figure 2. Alongside the metal tools, a blade, a core, and some flakes of flint have also been found in this area. In order to define the implications of metallurgy in daily life in Late Iron Age Ulaca, the present study is focused on analyzing the cut marks included in [41] to determine the type of tool used in carcass processing.
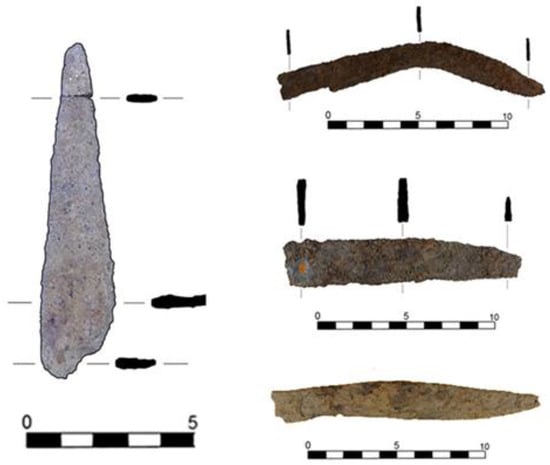
Figure 2.
Iron knives found in the Ulaca oppidum from SU 101 [left], SU 40 [top and middle right] (cemetery level), and SU 71 [bottom right] (workshop level).
2. Materials and Methods
2.1. Sample
The sample employed in the present study (Table 1) includes 30 cut marks identified on archaeological material recovered from Ulaca [41]. Archaeological cut marks were examined and identified with the aid of a 20x hand lens following the criteria established by several authors [53,54]. Only conspicuous cut marks were selected for the study according to their location on large size ungulates as Bos taurus long bone shafts and their preservation. The Ulaca cut marks were compared with a total of 259 cut marks generated with flint (n = 139) and metal (n = 120) tools. Flint raw material was knapped by an experienced individual to produce a series of simple flakes. These flakes, as well as a stainless steel knife (Molybdenum Vanadium C 0.5 CR 14 MO 0.5 VA 0.25), were then used to produce cut marks on the fresh long bone shafts of Bos taurus carcasses still bearing meat. Cut marks were produced by a single right-handed individual homogeneously across the diaphysis of each specimen, maintaining the cutting angle perpendicular to the bone. Despite carcass heterogeneity (Table 1), neither the anatomical element nor size of the animal should be considered a conditioning factor for morphological studies, as stated by [20].

Table 1.
Cut mark sample used in this study.
After a preliminary sample assessment, where all different experimental groups were considered separately, cut mark modern samples produced with flint and metal tools were grouped in two larger groups (flint and metal) due to the almost imperceptible differences intra raw material groups.
Cut marks were digitized using the DAVID structured-light scanner SLS-2 located at the University of Salamanca (Spain). Reconstruction protocols are specified in [8,17,18]. The DAVID structured-light scanner SLS-2 generates high-resolution 3D models. Subsequently, Global Mapper software (https://www.bluemarblegeo.com/global-mapper/, accessed on 19 February 2023) was used to define and measure cross-sectional mark profiles on the 3D models. Cross-sections were taken between 30% and 70% of the mark length since they have been established as equally representative and valid for morphometric studies [15]. Following this methodology [15], seven landmarks defining the extremes, the depth, and the curvature of the cut mark profile (Figure 3) were used to describe the mark morphology.
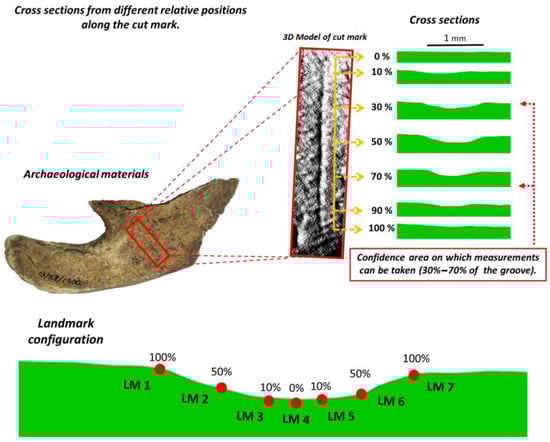
Figure 3.
Visual summary of the data collection process. Processing for 3D reconstruction and acquisition of the landmark data and measurements from the cut marks profiles.
2.2. Methodology
Geometric Morphometrics and Statistics
The tools provided by the Geometric Morphometric (GM) tool kit were used to characterize and study the cut marks on the basis of the extracted cross-sections. GM is a method based on the use of homologous points across specimens, known as landmarks, that keep morphological information in the form of Cartesian coordinates [55,56,57,58], which ultimately enables the study of shape and form (shape and size) variance and co-variance [59,60,61]. The GM analyses require the use of standardization methods that normalize the morphological information by translating, rotating and scaling the landmark configurations used to describe the specimens under study. For the present study, one of the most renowned techniques, general Procrustes analysis (GPA), was used to perform this step, followed by the also commonly used principal component analyses (PCA), which achieves the dimensionality reduction of the input data while providing a graphical output that enables the visualization of sample variance distribution space, as well as the underlying morphological changes with the aid of transformation grids [62].
Differences in size among cut marks were compared with the help of boxplots, whereas a selection of principal components (PC scores) that in sum represent up to 95% of the total variance were extracted for further statistical analyses to assess differences in shape and form. Affinities between the Ulaca cut mark sample and the experimental samples were explored using a multivariate analyses of variance (MANOVA), machine learning (ML) models, and neural networks (NN) (Table 2).
Table 2.
Models used to classify the oppidum of Ulaca archaeological sample.
Shapiro tests were performed to evaluate sample distribution [68], which ultimately led to the use of robust statistical methods [69,70], such as Wilk’s Lambda test statistic [71] to compare the mean of the different groups. A p-value threshold of 0.003 was adopted for defining statistical significance [70].
ML models and NN were trained by dividing the sample into a training (70% of the sample) and testing set (30% of the sample), which is used for model validation. A recursive partitioning of data and a k-fold cross-validation (k = 10) was implemented as meta-learning method for performance improvement so that overfitting could be avoided. The most efficient models tested in the present study are based on the use of CART Trees, or classification and regression trees that provide comprehensible and robust techniques based on a recursive partitioning of the data; gradient boosted machines (GBM) that create an ensemble of trees that successively learn from the preceding one; support vector machines (SVM), or models that use a kernel-trick that allows the construction of non-linear decision boundaries; and neural networks (NN) that imitate the work of the human brain by generating a structure based on nodes displayed in hierarchical layers. Hyperparameter grids were built for each model to test different tunning parameters at once (Table 2). See Supplementary File S1 for the final parameters used for each model.
Differences in prediction performance among models were compared according to kappa, sensitivity, specificity, and balanced accuracy values [72]. Kappa statistics indicate the existing match between the model and the documented data, being kappa >0.8 a signal of powerful predictive performance. Sensitivity and specificity values provide the proportion of true correctly classified examples vs. the proportion of false correctly classified examples. These rates are corrected by the balanced accuracy through calculating the average.
Data collection, morphological standardization, dimensionality reduction, and group comparison and classification were performed on the open access software R (v.4.1.x; Core Team 2015 [73]). A total of 7 fixed landmarks (Figure 3) were collected for each cut mark cross-section following the guidelines established in [15] using the functions included in the geomorph library [74]. GPA and PCA were conducted using the functions included in the GraphGMM package [75]. Shapiro tests and permutation MANOVA were applied using the functions available in the stats and RVAideMemoire libraries [76]. Classification models were conducted using the functions and libraries indicated in Table 2.
3. Results
According to the results, the Ulaca cut mark sample falls within the morphological variance of the experimental flint cut mark sample. Similarities between both groups are particularly striking when only shape features are considered (Figure 4), as the Ulaca cut marks are shallow and wide, and thus, they tend towards displaying a U-shaped cross-section like more than half of the flint cut marks generated for the purpose of the present study. Although there is certain overlap between the experimental flint and metal sample, the Ulaca cut marks are situated towards the most extreme positive axis end in the graph along PC1, avoiding any mismatch with the deeper and narrower V-shaped bone surface modifications produced with the metal knife.
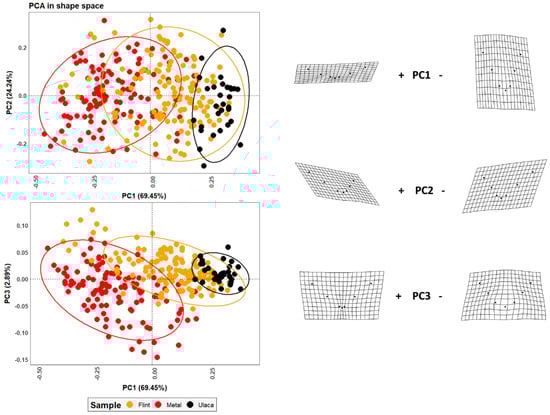
Figure 4.
PCA plot in shape space on the Ulaca oppidum, metal and flint cut mark samples, and the extreme transformation grids calculated for the first three PC scores.
When size is considered alongside shape, the Ulaca cut mark sample still mostly falls within the variance range of the experimental flint sample, though the overlap with the metal group is also noticeable. Such similarities might be related to the similar variance range in absolute size shown by the three groups (Figure 5). Nonetheless, the Ulaca archaeological sample has the lowest mean centroid size, which falls closer to the flint sample mean centroid size than to the metal mean centroid size (Figure 6). In the case of the Ulaca and flint samples, it is also remarkable that the outliers in size are larger than any of the metal cut marks, of which variance range tends to be more limited.
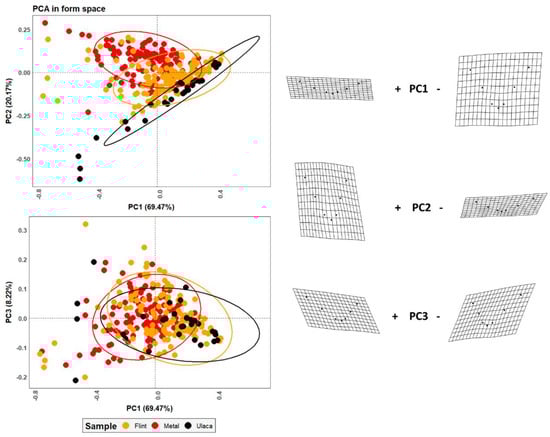
Figure 5.
PCA plot in form space on the Ulaca, metal and flint cut mark samples, and the extreme transformation grids calculated for the first three PC scores.
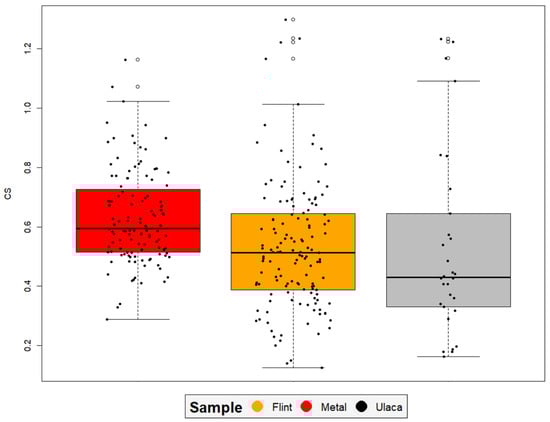
Figure 6.
Boxplots comparing the centroid sizes of the Ulaca cut mark sample and the two experimental samples of cut marks generated with metal and flint tools.
Despite the similarities observed between the Ulaca and the flint sample, the shape and form morphological means calculated for the three groups are significantly different (p = 0.001). When considering cut marks as individual specimens, the most accurate ML and NN trained models (Table 3) classify most of the Ulaca bone surface modifications as cut marks generated with flint with great certainty (above 90% in most cases). However, some models classify few marks as metal or substantially lower their certainty regarding the classification of certain marks as flint (Supplementary File S1). Such abnormalities happen more often when size features are considered in the predictive models. These results suggest that the selected Ulaca cut mark sample may have been generated with different raw materials despite the clear predominance of flint-like cut marks identified in the present study.
Table 3.
Predictive models’ performance.
4. Discussion
The present study adds to the works previously performed by other authors on the origins of metallurgy through the study of bone surface modifications with lithic or metal industry [38,39,77,78,79,80,81,82], though, in this case, we analyse a site from the Iron Age instead of from the Bronze Age or the Chalcolithic period.
The results obtained in this study are quite surprising since our primary hypothesis was that considering the site’s chronological context (c.II-I BC) and the presence of iron knives and other iron or bronze tools at the site, there should be a predominance of bones with cut marks produced with metal tools. However, the results summarized in Figure 4, Figure 5 and Figure 6 and Table 3 show that most of the Ulaca cut marks might have been produced with lithic tools, whereas only a small percentage might have been produced using metal tools. On the basis of these results, several questions have been raised.
The sample handled in this study includes 30 bones with cut marks along the diaphysis; that means that only 30 cut marks out of the 99 marks documented in [41] have been analysed. Thus, it is possible that some cut marks made with metal tools were not included in the present study. However, for the evaluation of the remaining cut marks, new experimental analyses on axial elements and long bone epiphyses would be necessary. So far, all the experimental studies developed by the authors of this research to analyse cut marks made with metal or lithic artefacts are focused on diaphyseal sections [8,9,11,15,16,17,18,19,20,23,25,27,28]. Although some studies show that cut marks do not change significantly when the size of the animal varies [20], changes in the density, texture, and shape between axial, long bone epiphyses, and diaphysis are significant [83]. Thus, we still do not know if this condition affects the morphological characteristics of the cut marks. For this reason, the study of the cut marks of the Ulaca oppidum found on axial elements or long bone epiphyses, requires new referential frameworks.
On the other hand, some chop marks observed in Ulaca have not been analysed in this work. Chop marks are a somewhat V-shaped impact marks with impact fractures and/or splinters that are produced by beating to facilitate the disarticulation or fracture of the bone. Their morphology contrasts with the fine, thin, and deep V-section traces observed among cut marks, which can have different orientations, variable lengths, and can appear in groups or isolated after activities of skinning, defleshing, disarticulation, or evisceration. Probably, some chop marks observed in Ulaca could have been produced by metal tools, as shown by [41] (Figure 4a). In some recent prehistoric contexts of the Bronze Age, mixed practices have been observed in which chop marks are produced by metal and also lithic tools [82]. The analysis of chop marks also requires extra experimental works to create accurate referential frameworks. In the particular case of the Ulaca oppidum, the skeletal distribution of the cut marks and the functionality associated with these marks requires future analyses as stated in the Supplementary file of [41].
Considering the limitations imposed by the lack of proper comparative experimental samples that would allow an extensive analysis, the outcome presented in this study should be considered preliminary. However, the results obtained in this study provide a very interesting view of the daily life of the people inhabiting Central Spain during the Late Iron Age, highlighting the widespread use of flint tools for common practices such as carcass processing despite the knowledge of metallurgy. Such behaviour has also been observed in other Iron Age sites. For instance, Greenfield [38] showed that 58.54% of the cut marks observed in a Late Bronze-Early Iron Age site (Halstatt A–B) were made with lithic artefacts, whereas [40] showed that metal-inflicted cut marks were made by the beginning of the Iron Age in Central Spain. In the latter example, the metal cut marks showed in any case micro-striations and morphological similarities to cut marks produced by stone tools. Therefore, it should not come as a surprise that lithic industry continued to be relevant in the daily uses of the populations of the Iron Age.
Additionally, the results presented here are consistent with the archaeological record identified at Ulaca. So far, the metallurgical evidence in Ulaca is scarce. Proof of this is that only 150 metal remains have been identified in the area analysed here, although it should be noted that there is evidence of intense detectorist activity in this zone [42,50]. In addition, among the metal objects found at the site, there are few functional elements, including four knives (Figure 2), of which three appear in a funerary context (e.g., they were found in tombs), and the remaining one was located in an area interpreted as an artisan workshop.
According to our results and the metallurgical evidence from Ulaca, several questions can be raised; why is the frequency of cut marks made with metal utensils so low? Additionally, one might consider if our results could be explained by the bias produced by sample size and selection. Thus, further research is needed to elucidate these questions and comprehend the use of metals in the world of the Vettones. For that purpose, additional archaeological records of this chronology should be studied, and larger samples of cut marks (including marks on axial elements and long bone epiphyses) should be considered.
In addition, it may be interesting to perform further studies to address the use of the metal objects found in Ulaca. Carrying out metallographic and traceological analyses could help clarify whether the knives deposited in the tombs had functional and/or symbolic uses.
In any case, it seems evident from the results of the present work that the lithic industry continued to be important in domestic activities related to the consumption of animals for the populations of the end of the Iron Age in the inland of the Iberian Peninsula.
5. Conclusions
The results of the present study suggest that the cut marks produced at Ulaca were mainly made with lithic tools and to a lesser extent with metal tools. These results are surprising given the Late Iron Age context of the site. However, there are other examples of Iron Age sites where cut marks have been mainly produced using flint tools.
There is no doubt that metallurgy coexisted with the use of lithic artefacts in domestic activities at the Ulaca oppidum. In fact, the morphology of some chop marks suggests the use of knives, axes, or other metal utensils to fracture bones and facilitate disarticulation, though further analyses are required to test this hypothesis.
In addition, it would be necessary to perform similar investigations in other contemporary archaeological sites in order to address the use of metal and lithic tools in similar contexts.
Experimental analyses need also to be expanded to include axial elements among others to generate comprehensive referential frameworks that allow the analysis of larger samples when studying archaeological sites. The enlargement of the referential framework would allow the application of techniques such as geometric morphometrics and artificial intelligence that has been proven to be very useful in taphonomic studies of diverse nature to a broader range of archaeological contexts, which would ultimately help researchers interpret past human behaviour.
Supplementary Materials
The following supporting information can be downloaded at: https://www.mdpi.com/article/10.3390/app13063967/s1, File S1: Results; containing additional tables.
Author Contributions
Conceptualization, M.Á.M.-G., J.A. and J.Y.S.d.l.T.; methodology, M.Á.M.-G., J.A., V.E.-G. and J.Y.S.d.l.T.; software, J.A.; validation, J.A.; formal analysis, M.Á.M.-G. and J.A.; investigation, J.A., V.E.-G. and J.Y.S.d.l.T.; resources, J.R.-H., J.R.Á.-S. and G.R.-Z.; data curation, M.Á.M.-G., C.S.B., J.R.-H. and V.E.-G.; writing—original draft preparation, M.Á.M.-G., J.A., V.E.-G., C.S.B. and J.Y.S.d.l.T.; writing—review and editing, M.Á.M.-G., J.A., V.E.-G., J.Y.S.d.l.T. and J.R.-H.; visualization, J.A.; supervision, J.A. and J.Y.S.d.l.T.; project administration, M.Á.M.-G., G.R.-Z. and J.R.Á.-S.; funding acquisition, M.Á.M.-G., G.R.-Z. and J.R.Á.-S. All authors have read and agreed to the published version of the manuscript.
Funding
During the development of the present work J.A. was funded by the Euskal Herriko Unibertsitatea [ESPDOC21/05]. This work has been partially funded by the Ministerio de Ciencia e Innovación (project PID2021-123721OB-I00 funded by MCIN/AEI/10.13039/501100011033/FEDER, UE) and Fundación Española para la Ciencia y la Tecnología (FCT-21-17318). M.Á.M.-G. and C.S.B. acknowledges the grant RYC2021-034813-I and RYC2021-034720-I respectively, funded by MCIN/AEI/10.13039/501100011033 and by European Union “NextGenerationEU”/PRTR.
Institutional Review Board Statement
No animals were sacrificed specifically for the purpose of these experiments.
Informed Consent Statement
Not applicable.
Data Availability Statement
Data sharing not applicable.
Acknowledgments
We would like to thank the support provided by the TIDOP Group in the Department of Cartographic and Land Engineering of the Higher Polytechnics School of Avila, University of Salamanca, for the use of their tools and facilities.
Conflicts of Interest
The authors declare no conflict of interest.
References
- Kaiser, T.M.; Katterwe, H. The application of 3D-microprofilometry as a tool in the surface diagnosis of fossil and sub-fossil vertebrate hard tissue. An example from the Pliocene Upper Laetolil Beds, Tanzania. Int. J. Osteoarchaeol. 2001, 11, 350–356. [Google Scholar] [CrossRef]
- Bello, S.M.; Soligo, C. A new method for the quantitative analysis of cutmark micromorphology. J. Archaeol. Sci. 2008, 35, 1542–1552. [Google Scholar] [CrossRef]
- Bello, S.M. New results from the examination of cut-marks using three-dimensional imaging. In Developments in Quaternary Sciences; Elsevier: Amsterdam, The Netherlands, 2011; Volume 14, pp. 249–262. [Google Scholar]
- Bello, S.M.; Parfitt, S.A.; Stringer, C. Quantitative micromorphological analyses of cut marks produced by ancient and modern handaxes. J. Archaeol. Sci. 2009, 36, 1869–1880. [Google Scholar] [CrossRef]
- Bello, S.M.; De Groote, I.; Delbarre, G. Application of 3-dimensional microscopy and micro-CT scanning to the analysis of Magdalenian portable art on bone and antler. J. Archaeol. Sci. 2013, 40, 2464–2476. [Google Scholar] [CrossRef]
- Bonney, H. An investigation of the use of discriminant analysis for the classification of blade edge type from cut marks made by metal and bamboo blades. Am. J. Phys. Anthropol. 2014, 154, 575–584. [Google Scholar] [CrossRef]
- Boschin, F.; Crezzini, J. Morphometrical analysis on cut marks using a 3D digital microscope. Int. J. Osteoarchaeol. 2012, 22, 549–562. [Google Scholar] [CrossRef]
- Courtenay, L.A.; Yravedra, J.; Mate-González, M.Á.; Aramendi, J.; González-Aguilera, D. 3D analysis of cut marks using a new geometric morphometric methodological approach. Archaeol. Anthropol. Sci. 2019, 11, 651–665. [Google Scholar] [CrossRef]
- Courtenay, L.A.; Maté-González, M.Á.; Aramendi, J.; Yravedra, J.; González-Aguilera, D.; Domínguez-Rodrigo, M. Testing accuracy in 2D and 3D geometric morphometric methods for cut mark identification and classification. PeerJ 2018, 6, e5133. [Google Scholar] [CrossRef]
- Courtenay, L.A.; Yravedra, J.; Huguet, R.; Ollé, A.; Aramendi, J.; Maté-González, M.Á.; González-Aguilera, D. New taphonomic advances in 3D digital microscopy: A morphological characterisation of trampling marks. Quat. Int. 2019, 517, 55–66. [Google Scholar] [CrossRef]
- Courtenay, L.A.; Yravedra, J.; Aramendi, J.; Maté-González, M.Á.; Martín-Perea, D.M.; Uribelarrea, D.; Baquedano, E.; González-Aguilera, D.; Domínguez-Rodrigo, M. Cut marks and raw material exploitation in the lower pleistocene site of Bell’s Korongo (BK, Olduvai Gorge, Tanzania): A geometric morphometric analysis. Quat. Int. 2019, 526, 155–168. [Google Scholar] [CrossRef]
- Courtenay, L.A.; Yravedra, J.; Huguet, R.; Aramendi, J.; Maté-González, M.Á.; González-Aguilera, D.; Arriaza, M.C. Combining machine learning algorithms and geometric morphometrics: A study of carnivore tooth marks. Palaeogeogr. Palaeoclimatol. Palaeoecol. 2019, 522, 28–39. [Google Scholar] [CrossRef]
- Courtenay, L.A.; Herranz-Rodrigo, D.; González-Aguilera, D.; Yravedra, J. Developments in data science solutions for carnivore tooth pit classification. Sci. Rep. 2021, 11, 1–15. [Google Scholar] [CrossRef]
- Courtenay, L.A.; Yravedra, J.; Herranz-Rodrigo, D.; Rodríguez-Alba, J.J.; Serrano-Ramos, A.; Estaca-Gómez, V.; González-Aguilera, D.; Solano, J.A.; Jiménez-Arenas, J.M. Deciphering carnivoran competition for animal resources at the 1.46 Ma early Pleistocene site of Barranco León (Orce, Granada, Spain). Quat. Sci. Rev. 2023, 300, 107912. [Google Scholar] [CrossRef]
- Maté González, M.Á.; Yravedra, J.; González-Aguilera, D.; Palomeque-González, J.F.; Domínguez-Rodrigo, M. Micro-photogrammetric characterization of cut marks on bones. J. Archaeol. Sci. 2015, 62, 128–142. [Google Scholar] [CrossRef]
- Maté-González, M.Á.; Palomeque-González, J.F.; Yravedra, J.; González-Aguilera, D.; Domínguez-Rodrigo, M. Micro-photogrammetric and morphometric differentiation of cut marks on bones using metal knives, quartzite, and flint flakes. Archaeol. Anthropol. Sci. 2018, 10, 805–816. [Google Scholar] [CrossRef]
- Maté-González, M.Á.; Aramendi, J.; Yravedra, J.; Blasco, R.; Rosell, J.; González-Aguilera, D.; Domínguez-Rodrigo, M. Assessment of statistical agreement of three techniques for the study of cut marks: 3D digital microscope, laser scanning confocal microscopy and micro-photogrammetry. J. Microsc. 2017, 267, 356–370. [Google Scholar] [CrossRef]
- Maté-González, M.Á.; Aramendi, J.; González-Aguilera, D.; Yravedra, J. Statistical comparison between low-cost methods for 3D characterization of cut-marks on bones. Remote Sens. 2017, 9, 873. [Google Scholar] [CrossRef]
- Maté-González, M.Á.; Yravedra, J.; Martín-Perea, D.M.; Palomeque-González, J.; San-Juan-Blázquez, M.; Estaca-Gómez, V.; Uribelarrea, D.; Álvarez-Alonso, D.; Cuartero, F.; González-Aguilera, D.; et al. Flint and quartzite: Distinguishing raw material through bone cut marks. Archaeometry 2018, 60, 437–452. [Google Scholar] [CrossRef]
- Maté-González, M.Á.; Courtenay, L.A.; Aramendi, J.; Yravedra, J.; Mora, R.; González-Aguilera, D.; Domínguez-Rodrigo, M. Application of geometric morphometrics to the analysis of cut mark morphology on different bones of differently sized animals. Does size really matter? Quat. Int. 2019, 517, 33–44. [Google Scholar] [CrossRef]
- Aramendi, J.; Maté-González, M.A.; Yravedra, J.; Cruz Ortega, M.; Arriaza, M.C.; González-Aguilera, D.; Baquedano, E.; Domínguez-Rodrigo, M. Discerning carnivore agency through the three-dimensional study of tooth pits: Revisiting crocodile feeding behaviour at FLKZinj and FLK NN3 (Olduvai Gorge, Tanzania). Palaeogeogr. Palaeoclimatol. Palaeoecol. 2017, 488, 93–102. [Google Scholar] [CrossRef]
- Pante, M.C.; Muttart, M.V.; Keevil, T.L.; Blumenschine, R.J.; Njau, J.K.; Merritt, S.R. A new high-resolution 3-D quantitative method for identifying bone surface modifications with implications for the Early Stone Age archaeological record. J. Hum. Evol. 2017, 102, 1–11. [Google Scholar] [CrossRef]
- Linares-Matás, G.J.; Yravedra, J.; Maté-González, M.Á.; Courtenay, L.A.; Aramendi, J.; Cuartero, F.; González-Aguilera, D. A geometric-morphometric assessment of three-dimensional models of experimental cut-marks using flint and quartzite flakes and handaxes. Quat. Int. 2019, 517, 45–54. [Google Scholar] [CrossRef]
- López-Cisneros, P.; Linares-Matás, G.; Yravedra, J.; Maté-González, M.Á.; Estaca-Gómez, V.; Mora, R.; Aramendi, J.; Rodríguez Asensio, J.A.; Barrera-Logares, J.M.; González-Aguilera, D. Applying new technologies to the taphonomic study of La Lluera (Asturias, Spain). Geometric morphometrics and the study of bone surface modifications (BSM). Quat. Int. 2019, 517, 107–117. [Google Scholar] [CrossRef]
- Pineda, A.; Courtenay, L.A.; Téllez, E.; Yravedra, J. An experimental approach to the analysis of altered cut marks in archaeological contexts from Geometrics Morphometrics. J. Archaeol. Sci. Rep. 2023, 48, 103850. [Google Scholar] [CrossRef]
- Yravedra, J.; García Vargas, E.; Maté González, M.Á.; Aramendi, J.; Palomeque-González, J.; Vallés-Iriso, J.; Matasanz-Vicente, J.; González-Aguilera, D.; Domínguez-Rodrigo, M. The use of Micro-Photogrammetry and Geometric Morphometrics for identifying carnivore agency in bone assemblage. J. Archaeol. Sci. Rep. 2017, 14, 106–115. [Google Scholar] [CrossRef]
- Yravedra, J.; Maté-González, M.Á.; Palomeque-González, J.F.; Aramendi, J.; Estaca-Gómez, V.; San-Juan-Blázquez, M.; García Vargas, E.; Organista, E.; González-Aguilera, D.; Arriaza, M.C.; et al. A new approach to raw material use in the exploitation of animal carcasses at BK (upper bed II, Olduvai gorge, Tanzania): A micro-photogrammetric and geometric morphometric analysis of fossil cut marks. Boreas 2017, 46, 860–873. [Google Scholar] [CrossRef]
- Yravedra, J.; Diez-Martín, F.; Egeland, C.P.; Maté-González, M.Á.; Palomeque-González, J.F.; Arriaza, M.C.; Aramendi, J.; García Vargas, E.; Estaca-Gómez, V.; Sánchez, P.; et al. FLK West (Lower Bed II, Olduvai Gorge, Tanzania): A new early Acheulean site with evidence for human exploitation of fauna. Boreas 2017, 46, 816–830. [Google Scholar] [CrossRef]
- Yravedra, J.; Aramendi, J.; Maté-González, M.Á.; Courtenay, L.A.; González-Aguilera, D. Differentiating percussion pits and carnivore tooth pits using 3D reconstructions and geometric morphometrics. PLoS ONE 2018, 13, e0194324. [Google Scholar] [CrossRef]
- Yravedra, J.; Maté-González, M.Á.; Courtenay, L.A.; López-Cisneros, P.; Estaca-Gómez, V.; Aramendi, J.; de Andrés-Herrero, M.; Linares-Matás, G.; González-Aguilera, D.; Álvarez-Alonso, D. Approaching raw material functionality in the Upper Magdalenian of Coímbre cave (Asturias, Spain) through geometric morphometrics. Quat. Int. 2019, 517, 97–106. [Google Scholar] [CrossRef]
- Yravedra, J.; Maté-González, M.Á.; Courtenay, L.A.; González-Aguilera, D.; Fernández Fernández, M. The use of canid tooth marks on bone for the identification of livestock predation. Sci. Rep. 2019, 9, 16301. [Google Scholar] [CrossRef]
- Yravedra, J.; Courtenay, L.A.; Herranz-Rodrigo, D.; Rodríguez-Alba, J.J.; Linares-Matás, G.; Estaca-Gómez, V.; Maté-González, M.Á.; Luzón, C.; Serrano-Ramos, A.; Solano, J.A.; et al. Taphonomic characterisation of tooth marks of extinct Eurasian carnivores through GeometricMorphometric. Science 2022, 67, 1644–1648. [Google Scholar]
- Otárola-Castillo, E.; Torquato, M.G.; Hawkins, H.C.; James, E.; Harris, J.A.; Marean, C.W.; McPhernon, S.; Thompson, J.C. Differentiating between cutting actions on bone using 3D geometric morphometrics and Bayesian analyses with implications to human evolution. J. Archaeol. Sci. 2018, 89, 56–67. [Google Scholar] [CrossRef]
- Arriaza, M.C.; Aramendi, J.; Maté-González, M.Á.; Yravedra, J.; Stratford, D. The hunted or the scavenged? Australopith accumulation by brown hyenas at Sterkfontein (South Africa). Quat. Sci. Rev. 2021, 273, 107252. [Google Scholar] [CrossRef]
- Calder, J.; Coil, R.; Melton, J.A.; Olver, P.J.; Tostevin, G.; Yezzi-Woodley, K. Use and misuse of machine learning in anthropology. IEEE BITS Inf. Theory Mag. 2022, 2, 102–115. [Google Scholar] [CrossRef]
- Shipman, P. Applications of scanning electron microscopy to taphonomic problems. Ann. N. Y. Acad. Sci. 1981, 376, 357–385. [Google Scholar] [CrossRef]
- Olsen, S. The identification of stone and metal toolmarks on bone artifacts. Scanning Electron Microsc. Archaeol. 1988, 452, 337–360. [Google Scholar]
- Greenfield, H.J. The origins of metallurgy: Distinguishing stone from metal cut-marks on bones from archaeological sites. J. Archaeol. Sci. 1999, 26, 797–808. [Google Scholar] [CrossRef]
- Greenfield, H.J. Slicing cut marks on animal bones: Diagnostics for identifying stone tool type and raw material. J. Field Archaeol. 2006, 31, 147–163. [Google Scholar] [CrossRef]
- Yravedra, J.; Morín, J.; Agustí, E.; Sanabria, P.; López, M.; Urbina, D.; López- Frailes, F.J.; López, G.; Illán, J. Implicaciones metalúrgicas de las marcas de corte en la transición Bronce Final/Hierro en el interior de la Península Ibérica. Gallaecia Rev. de Arqueol. Antigüidade 2009, 28, 77–92. [Google Scholar]
- Estaca-Gómez, V.; Rodríguez-Hernández, J.; Gómez-Hernández, R.; Yravedra, J.; Ruiz-Zapatero, G.; Álvarez-Sanchis, J.R. Zooarchaeology of the Iron Age in Western Iberia: New insights from the Celtic oppidum of Ulaca. Archaeol. Anthropol. Sci. 2022, 14, 168. [Google Scholar] [CrossRef]
- Ruiz Zapatero, G. Castro de Ulaca. Solosancho, Ávila; Institución Gran Duque de Alba: Ávila, Spain, 2005. [Google Scholar]
- Maté-González, M.Á.; Rodríguez-Hernández, J.; Sáez Blázquez, C.; Troitiño Torralba, L.; Sánchez-Aparicio, L.J.; Fernández Hernández, J.; Herrero Tejedor, T.R.; Fabián García, J.F.; Piras, M.; Díaz-Sánchez, C.; et al. Challenges and Possibilities of Archaeological Sites Virtual Tours: The Ulaca Oppidum (Central Spain) as a Case Study. Remote Sens. 2022, 14, 524. [Google Scholar] [CrossRef]
- Ruiz Zapatero, G.; Álvarez-Sanchís, J.R.; Rodríguez-Hernández, J. Urbanism in Iron Age Iberia: Two Worlds in Contact. J. Urban Archaeol. 2020, 1, 123–150. [Google Scholar] [CrossRef]
- Álvarez-Sanchís, J.R.; Jimeno Martínez, A.; Ruiz Zapatero, G. (Eds.) Aldeas y Ciudades en el Primer Milenio a.C. La Meseta Norte y los Orígenes del Urbanismo. In Complutense; University of Madrid: Madrid, Spain, 2011; Volume 22. [Google Scholar]
- Maté-González, M.Á.; Sáez Blázquez, C.; Carrasco García, P.; Rodríguez-Hernández, J.; Fernández Hernández, J.; Vallés Iriso, J.; Torres, Y.; Troitiño Torralba, L.; Courtenay, L.A.; González-Aguilera, D.; et al. Towards a Combined Use of Geophysics and Remote Sensing Techniques for the Characterization of a Singular Building: “El Torreón” (the Tower) at Ulaca Oppidum (Solosancho, Ávila, Spain). Sensors 2021, 21, 2934. [Google Scholar] [CrossRef]
- Almagro-Gorbea, M.; Álvarez-Sanchís, J.R. La sauna de Ulaca: Saunas y baños iniciáticos en el mundo céltico. Cuad. De Arqueol. De La Univ. De Navar. 1993, 1, 177–253. [Google Scholar] [CrossRef]
- Rodríguez-Hernández, J. Los procesos técnicos de la cantería durante la Segunda Edad del Hierro en el occidente de la Meseta. Zephyrus 2012, 70, 113–130. [Google Scholar]
- Álvarez-Sanchís, J.R. Oppida and Celtic society in western Spain. e-Keltoi 2005, 6, 255–285. [Google Scholar]
- Álvarez-Sanchís, J.R.; Marín, C.; Falquina, A.; Ruiz Zapatero, G. El oppidum vettón de Ulaca (Solosancho, Ávila) y su necrópolis. In Arqueología Vettona. La Meseta Occidental en la Edad del Hierro; Álvarez-Sanchís, J.R., Ed.; Museo Arqueológico Regional, Alcalá de Henares: Madrid, Spain, 2008; pp. 338–361. [Google Scholar]
- Rodríguez-Hernández, J. Poder y sociedad: El oeste de la Meseta en la Edad del Hierro; Institución Gran Duque de Alba: Ávila, Spain, 2019. [Google Scholar]
- Blanco González, A. Tendencias del uso del suelo en el Valle Amblés (Ávila, España). De la Edad del Hierro al Medievo. Zephyrus 2009, 63, 155–183. [Google Scholar]
- Binford, L.R. Bones: Ancient Men and Modern Myths; Academic Press Inc.: New York, NY, USA, 1981. [Google Scholar]
- Shipman, P. Life Historia of a Fossil. an Introduction to Taphonomy and Paleoecology; Harvard University Press: Cambridge, MA, USA; London, UK, 1981; p. 222. [Google Scholar]
- O’Higgins, P.; Johnson, D.R. The quantitative description and comparison of biological forms. Cr. Rev. Anat. Sci. 1998, 1, 149–170. [Google Scholar]
- Bookstein, F.L. Morphometric Tools for Landmark Data: Geometry and Biology; Cambridge University Press: New York, NY, USA, 1991. [Google Scholar]
- Hall, B.K. Descent with modification: The unity underlying homology and homoplasy as seen through an analysis of development and evolution. Biol. Rev. 2003, 78, 409–433. [Google Scholar] [CrossRef]
- Klingenberg, C.P. Novelty and “Homology-free” Morphometrics: What’s in a Name? Evol. Biol. 2008, 35, 186–190. [Google Scholar] [CrossRef]
- Rohlf, F.J. Shape Statistics: Procrustes Superimpositions and Tangent Spaces. J. Classif. 1999, 16, 197–223. [Google Scholar] [CrossRef]
- Slice, D.E. Landmark Coordinates Aligned by Procrustes Analysis Do Not Lie in Kendall’s Shape Space. Syst. Biol. 2001, 50, 141–149. [Google Scholar] [CrossRef] [PubMed]
- Richtsmeier, J.T.; Deleon, V.B.; Lele, S.R. The promise of geometric morphometrics. Am. J. Phys. Anthropol. 2002, 45, 63–91. [Google Scholar] [CrossRef] [PubMed]
- Bookstein, F.L. Principal warps: Thin-plate spline and the decomposition of deformations. IEEE Trans. Pattern Anal. Mach. Intell. 1989, 11, 567–585. [Google Scholar] [CrossRef]
- Kuhn, M. “Caret” Package: Classification and Regression Training; R Package Version 6.0-93. 2022. Available online: https://cran.r-project.org/web/packages/caret/caret.pdf (accessed on 2 February 2023).
- Bergstra, J.; Bengio, Y. Random Search for Hyper-Parameter Optimization Yoshua Bengio. J. Mach. Learn. Res. 2012, 13, 281–305. [Google Scholar]
- Snoek, J.; Larochelle, H.; Adams, R.P. Practical Bayesian Optimization of Machine Learning Algorithms. arXiv 2012, arXiv:1203.2944. [Google Scholar]
- Shahriari, B.; Swersky, K.; Wang, Z.; Adams, R.P.; De Freitas, N. Taking the human out of the loop: A review of Bayesian optimization. Proc. IEEE 2016, 104, 148–175. [Google Scholar] [CrossRef]
- Venables, W.N.; Ripley, B.D. Modern Applied Statistics with S; Springer: New York, NY, USA, 2002. [Google Scholar]
- Mohd Razali, N.; Bee Wah, Y. Power comparisons of Shapiro-Wilk, Kolmogorov-Smirnov, Lilliefors and Anderson-Darling tests. J. Stat. Model. Anal. 2011, 2, 21–33. [Google Scholar]
- Höhle, J.; Höhle, M. Accuracy assessment of digital elevation models by means of robust statistical methods. ISPRS J. Photogramm. Remote Sens. 2009, 64, 398–406. [Google Scholar] [CrossRef]
- Courtenay, L.; Gonzalez-Aguilera, D.; Lagüela, S.; del Pozo, S.; Ruiz Méndez, C.; Barbero-García, I.; Román-Curto, C.; Cañueto, J.; Santos-Durán, C.; Cardeñoso-Álvarez, M.E.; et al. Hyperspectral Imaging and Robust Statistics in Non-Melanoma Skin Cancer Analysis. Biomed. Opt. Express 2021, 12, 5107–5127. [Google Scholar] [CrossRef]
- Rao, C.R. An asymptotic expansion of the distribution of Wilk’s criterion. Bull. L’institut. Int. Stat. 1951, 33, 177–180. [Google Scholar]
- Lantz, B. Machine Learning with R; Packt Publishing Ltd.: Birmingham, UK, 2013. [Google Scholar]
- R Core-Team. A Language and Environment for Statistical Computing; R Foundation for Statistical Computing: Vienna, Austria, 2013; Available online: https://www.Rproject.org/ (accessed on 9 July 2015).
- Adams, D.; Collyer, M.; Kaliontzopoulou, A.; Baken, E. Geomorph: Geometric Morphometric Analyses of 2D/3D Landmark Data. R Package Version 4.0.4. 2022. Available online: https://cran.r-project.org/web/packages/geomorph/geomorph.pdf (accessed on 2 February 2023).
- Courtenay, L.A. GraphGMM v.1.0.0. Github. Available online: https://github.com/LACourtenay/GraphGMM (accessed on 2 February 2023).
- Hervé, M. “RVAideMemoire” Package: Testing and Plotting Procedures for Biostatistics. Version 0.9-81-2. Available online: https://cran.r-project.org/web/packages/RVAideMemoire/RVAideMemoire.pdf (accessed on 2 February 2023).
- Greenfield, H.J. Monitoring the origins of metallurgy: An application of cut mark analysis on animals bones from the Central Balkans. Environ. Archaeol. 2000, 5, 119–132. [Google Scholar] [CrossRef]
- Greenfield, H.J. Insufficient evidence for metal butchering marks at Tell el-Hesi during the Early Bronze Age: Critique of the analysis of microscopic grooves in ‘Cultural Modification Analyses on Faunal Remains in Relation to Space Use and Direct Provisioning from Field VI EBIIIA Tell el-Hesi’ by Kara Larson, James, W. Hardin, and Sara Cody. Palest. Explor. Q. 2021, 160, 144–155. [Google Scholar]
- Greenfield, H.J.; Brown, A. ‘Making the cut’: Changes in butchering technology and efficiency patterns from the Chalcolithic to modern Arab occupations at Tell Halif, Israel. In Bones and Identity: Zooarchaeological Approaches to Reconstructing Social and Cultural Landscapes in Southwest Asia; Marom, N., Yeshurun, R., Weissbrod, L., Bar-Oz, G., Eds.; Oxbow Press: Oxford, UK, 2016; pp. 273–291. [Google Scholar]
- Greenfield, H.J.; Beller, J.A.; Levy, T.E. Butchering technology during the Early Bronze Age I: An examination of microscopic cut marks on animal bones from Nahal Tillah, Israel. In Tell It in Gath: Studies in the History and Archaeology of Israel. Essays in Honor of A. M. Maeir on the Occasion of his Sixtieth Birthday, Ägypten und Altes Testament. Studien zu Geschichte, Kultur und Religion Ägyptens und des Alten Testaments; Band 90; Shai, I., Chadwick, J.R., Hitchcock, L., Dagam, A., McKinny, C., Uziel, J., Eds.; Zaphon: Münster, Germany, 2018; pp. 20–40. [Google Scholar]
- Greenfield, H.J.; Beller, J.A.; Gaastra, J. Changes in butchering technology and efficiency patterns between the Early and Middle Bronze Ages from Tell Zir¯a’a, Jordan. In Tall Zir¯a’a, The Gadara Region Project (2001–2011) Final Report: Early and Middle Bronze Age (Strata 25–17); Vieweger, D., Häser, J., Eds.; Deutsches Evangelisches Institut: Wuppertal, Germany, 2021; Volume 3. [Google Scholar]
- Okaluk, T.R.; Greenfield, H.J. Macroscopic Chop Mark Identification on Archaeological Bone: An Experimental Study of Chipped Stone, Ground Stone, Copper, and Bronze Axe Heads on Bone. Quaternary 2022, 5, 15. [Google Scholar] [CrossRef]
- Lyman, R.L. Vertebrate Taphonomy; Cambridge University Press: Cambridge, UK, 1994. [Google Scholar]


Disclaimer/Publisher’s Note: The statements, opinions and data contained in all publications are solely those of the individual author(s) and contributor(s) and not of MDPI and/or the editor(s). MDPI and/or the editor(s) disclaim responsibility for any injury to people or property resulting from any ideas, methods, instructions or products referred to in the content. |
© 2023 by the authors. Licensee MDPI, Basel, Switzerland. This article is an open access article distributed under the terms and conditions of the Creative Commons Attribution (CC BY) license (https://creativecommons.org/licenses/by/4.0/).