Article

Study of Mechanical Properties of Micron Polystyrene-Toughened Epoxy Resin

1
China Communications First Public Bureau Group Fourth Engineering Company Limited, Nanning 530000, China
2
School of Civil Engineering, Changsha University of Science & Technology, Changsha 410114, China
*
Author to whom correspondence should be addressed.
Appl. Sci. 2023, 13(6), 3981; https://doi.org/10.3390/app13063981
Submission received: 22 February 2023 / Revised: 15 March 2023 / Accepted: 16 March 2023 / Published: 21 March 2023

Abstract

:
Epoxy resin has a tight three-dimensional mesh structure after curing; due to this reason, the epoxy resin is brittle and not tough enough, which becomes the main reason for the destruction of the epoxy adhesive-steel/CFRP interface under fatigue loading of CFRP-reinforced steel structures. To prepare epoxy adhesives with good performance and suitable for CFRP-reinforced steel structures, the mechanical properties of epoxy adhesives are improved by adding polystyrene (PS) microspheres. In this work, five modified adhesives with PS weight fractions of 0 wt%, 1.25 wt%, 2.50 wt%, 3.75 wt% and 5 wt% are prepared by dispersion of PS particles through an ultrasonic cell crusher using a room-temperature curing process, and the tensile, flexural and impact properties of PS adhesives with different doping are investigated. Then, the microscopic morphology of the tensile section of the colloids is observed by scanning electron microscopy (SEM). The results show that the optimum dosing of PS is 2.5 wt%, and the tensile strength, tensile modulus of elasticity, flexural strength, flexural modulus and impact strength of the adhesive are increased by 77%, 147.7%, 71%, 35% and 22%, respectively, with this dosing. SEM analysis shows that PS particles produce large deformation to absorb energy when the matrix is fractured, and crack expansion needs to bypass or shear the PS particles, thus inhibiting crack expansion and achieving the purpose of toughening. Adhesion agglomeration of PS particles in the resin is the main reason for the decrease in the mechanical properties of adhesives.

1. Introduction

Fatigue cracking of steel structures is one of their common diseases [1], and the adhesion of carbon-fiber-reinforced polymer (CFRP) is an effective method to strengthen steel structures [2,3,4]. Epoxy resin is the most commonly used adhesive, and its performance is crucial to the reinforcement effect [5,6,7]. It has been shown that the damage mode of CFRP-reinforced steel structures under fatigue loading is often the adhesive-steel/CFRP interface damage [8,9,10], and the adhesive has a significant influence on the bonding performance of the bonding interface [11,12,13]. Epoxy resin is a thermosetting resin with good mechanical properties, bonding performance and thermal stability performance [14,15], but its curing into a cross-linked mesh structure, brittleness, poor impact resistance and lack of toughness are shortcomings that affect the reinforcement effect to some extent [16,17,18]. Therefore, it is necessary to study the high-toughness adhesives applicable to CFRP-pasted steel structures.
To clarify the toughening mechanism of micron (nano)-material-modified epoxy resins, improve their bonding properties, and prepare high-performance epoxy adhesives, numerous scholars have conducted a large number of related studies [19,20,21,22]. Asghar H. et al. [23] investigated the effect of carbon nanotube (CNT)-modified epoxy adhesive on carbon-fiber-cloth–steel interface and found that the carbon-nanotube-epoxy adhesive can transfer more load from the main structure to the carbon-fiber-fabric laminate, thus changing the bonding performance. Abdullah et al. [24] used experimental methods based on in situ Fourier transform infrared spectroscopy, dynamic mechanics and SEM microstructure to determine the enhancement effect of alumina nanoparticles in bisphenol A (DGEBA)-type epoxy resin, diglycidyl ether, compared to pure epoxy resin, with relatively low concentrations of alumina-nanoparticle-modified adhesives showing significant improvements in mechanical and thermal properties. Hasan et al. [25] conducted tensile tests on modified epoxy resins using expanded polystyrene as filler and short-cut glass fibers as reinforcement, and the results showed that the modified composites had significantly lower density and higher specific modulus, but both had lower specific strength than the pure resin, and increasing the fiber/filler ratio would enhance the tensile strength and elastic modulus of the colloids. Zhifeng Hu [26] et al., used end-epoxy-based polystyrene oligomers (PSG) to toughen the epoxy/anhydride resin system. The results showed that when the molecular mass of PSG was 3500–4900 and the weight fraction added was 2–7 wt%, the impact toughness was improved from 16.4 kJ/m2 of unmodified epoxy resin to 31.1–39.8 kJ/m2, which increased by 89.6–143%, and the strength and heat resistance of the epoxy resin were better maintained while toughening. However, epoxy resins have low strength in terms of crack extension and exhibit brittle fracture behavior because of their tight three-dimensional molecular network structure, which leads to limitations in the use of such polymers under loading conditions [27]. Moreover, most of the aforementioned studies used high-temperature curing processes, which are cumbersome and do not facilitate the practical engineering applications of CFRP-reinforced steel structures.
Therefore, in this work, based on the epoxy resin adhesive ratios developed by the team in the early stage, the effects of mixing different weight fractions of micron PS-modified epoxy resin adhesives in tensile, flexural and impact properties were investigated by using an ambient-temperature curing process and ultrasonic cell crushing and dispersion techniques. Then, the tensile section morphology of the adhesive was observed by SEM electron scanning microscopy to further reveal the toughening mechanism of micron PS on epoxy resin.

2. Experimental Program

2.1. Test Materials and Equipment

Raw material: bisphenol A epoxy resin (E51), the epoxy equivalent of 184–195 g/equiv, is provided by Shandong Urso Chemical Technology Co., Ltd., Jingnan, China; epoxy resin diluent using glycerolether, epoxy equivalent 120–137 g/equiv, is provided by Suzhou Ecol New Material Co., Ltd. Suzhou, China; the curing agent using aliphatic amines and polyether amines are both supplied by BASF, Germany; the reinforcing agent is made of tetrafunctional epoxy resin, which is provided by Guangzhou Taiji New Material Co., Ltd., Guangzhou, China; and solid powder polystyrene (PS) microspheres, particle size 50 μm, are provided by Hongyuan Polymer Materials Co., Ltd., Changsha, China.
Test equipment: vacuum drying oven, model SZF-6090, Ningbo Loshang Intelligent Technology Co., Ningbo, China; ultrasonic cell crusher, model GY98-3N, Ningbo Xinzhi Biotechnology Co., Ningbo, China; high-precision electronic scale, accuracy 0.0001 g, model FA3204, Shanghai Weighing Instrument Factory, Shanghai, China; universal testing machine, model WDW-300D, Jinan Kesheng Testing Machine Equipment Co., Jinan, China; plastic pendulum impact tester, impact energy 5.5 J, model LZ21.400-B, Shenzhen Lambethansi Material Testing Co., Shenzhen, China; scanning electron microscope (SEM), model EVOMA3413, Carl Zeiss SMT GmbH.

2.2. Specimen Preparation

In this work, the tensile, three-point bending and impact properties of modified epoxy resin are tested according to the Chinese specification, “Test Method of Resin Casting Body Properties” (GBT 2567-2008) [28], and the corresponding dimensions are shown in Figure 1. The specimen fabrication is based on the optimal ratio of adhesives developed by the team in the early stage, as shown in Table 1.
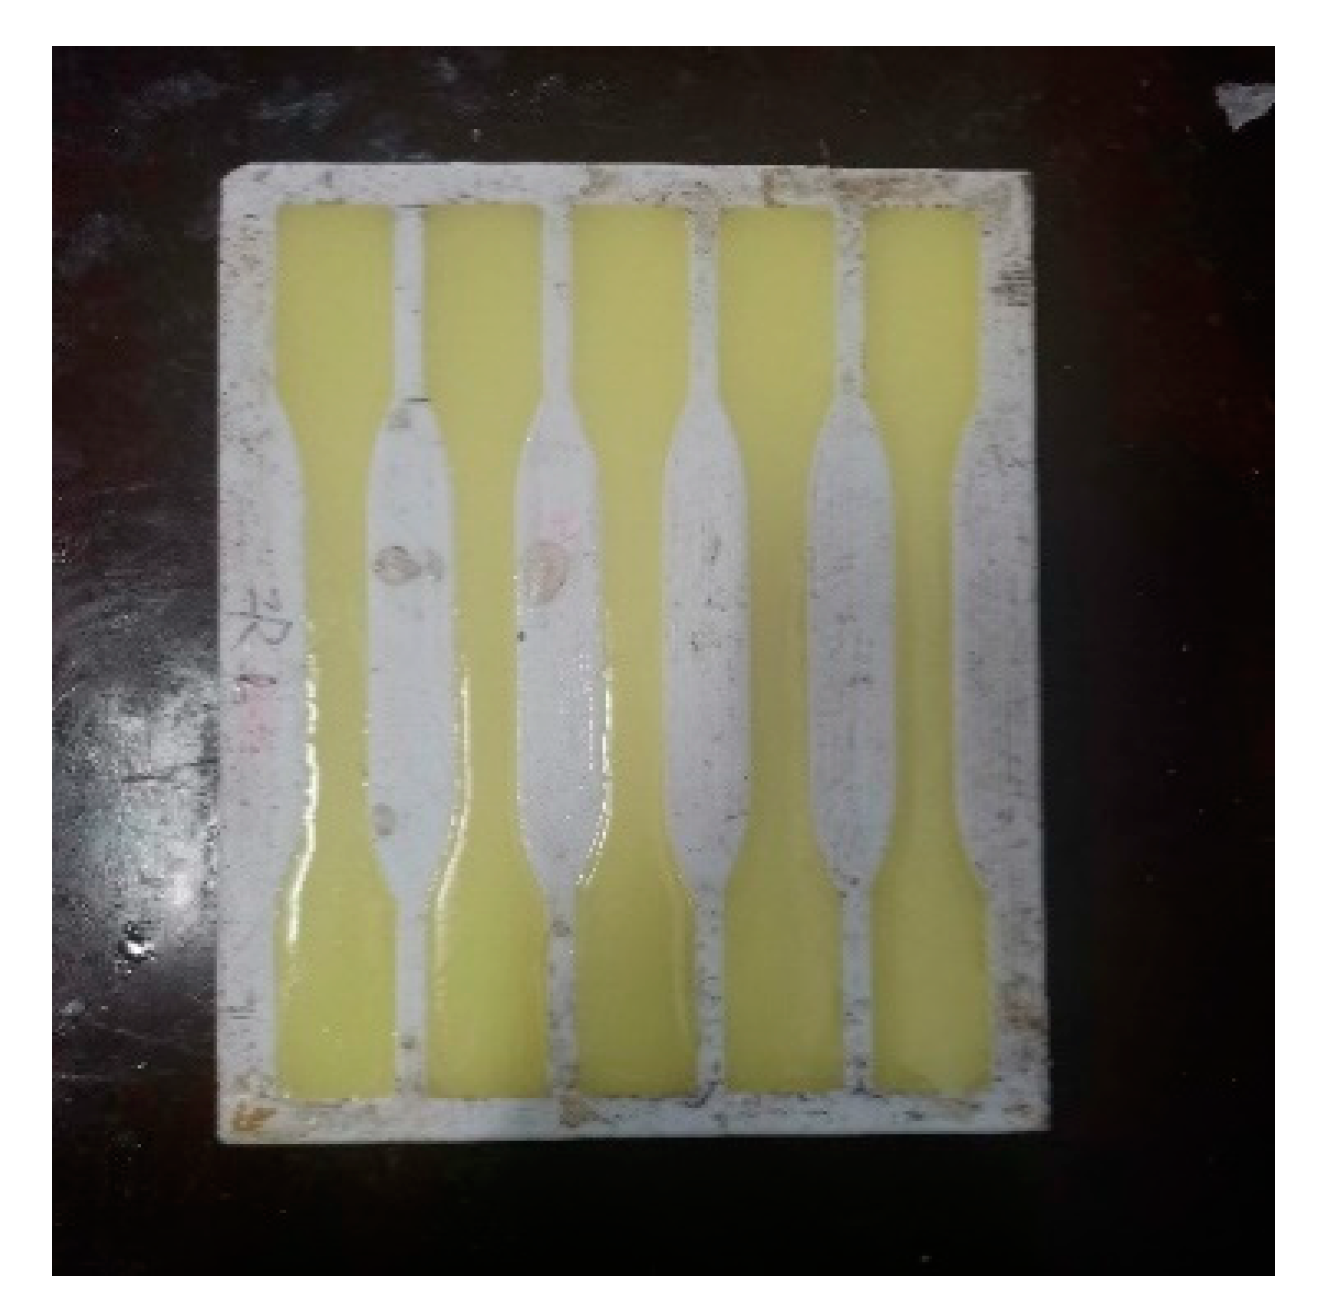
Specimen preparation steps are as follows: (1) first, use a high-precision electronic scale to weigh the appropriate amount of solid powder polystyrene (PS) microspheres, and then place the weighed PS microspheres with a small beaker in a vacuum drying oven to dry 8–12 h to ensure complete removal of moisture; (2) weigh the Bisphenol-A type epoxy resin, tetra functional epoxy resin and aliphatic amine curing agent according to the proportion in Table 1 and place in a beaker and set aside. Thereafter, add the PS microspheres to the beaker at 0 wt%, 1.25 wt%, 2.50 wt%, 3.75 wt% and 5 wt% of the weight fraction of the bisphenol A-type epoxy resin and stir manually for 5 min to make the micron material roughly uniformly dispersed in the mixture. (3) The beaker is then placed in the cell pulverizer for 30 min of ultrasonic dispersion [29] with an ultrasonic power of 900 w. Since the ultrasonic dispersion would cause the temperature of the mixture in the beaker to rise, the beaker is placed in a water bath and put into the ultrasonic cell pulverizer together to prevent splashing of the mixed liquid because of the high temperature. (4) After the end of ultrasonic crushing, wait for the mixture in the beaker to cool to room temperature and add the epoxy active diluent and polyether amine according to the ratio in Table 1. Then, after stirring manually for 5 min, pour into the mold preheated in advance and coated with a release agent, and cure at room temperature for 7 days. To ensure the accuracy of the data, every five specimens are grouped and the test results are averaged. The specimens are shown in Figure 2.

2.3. Test Methods

2.3.1. Tensile Test

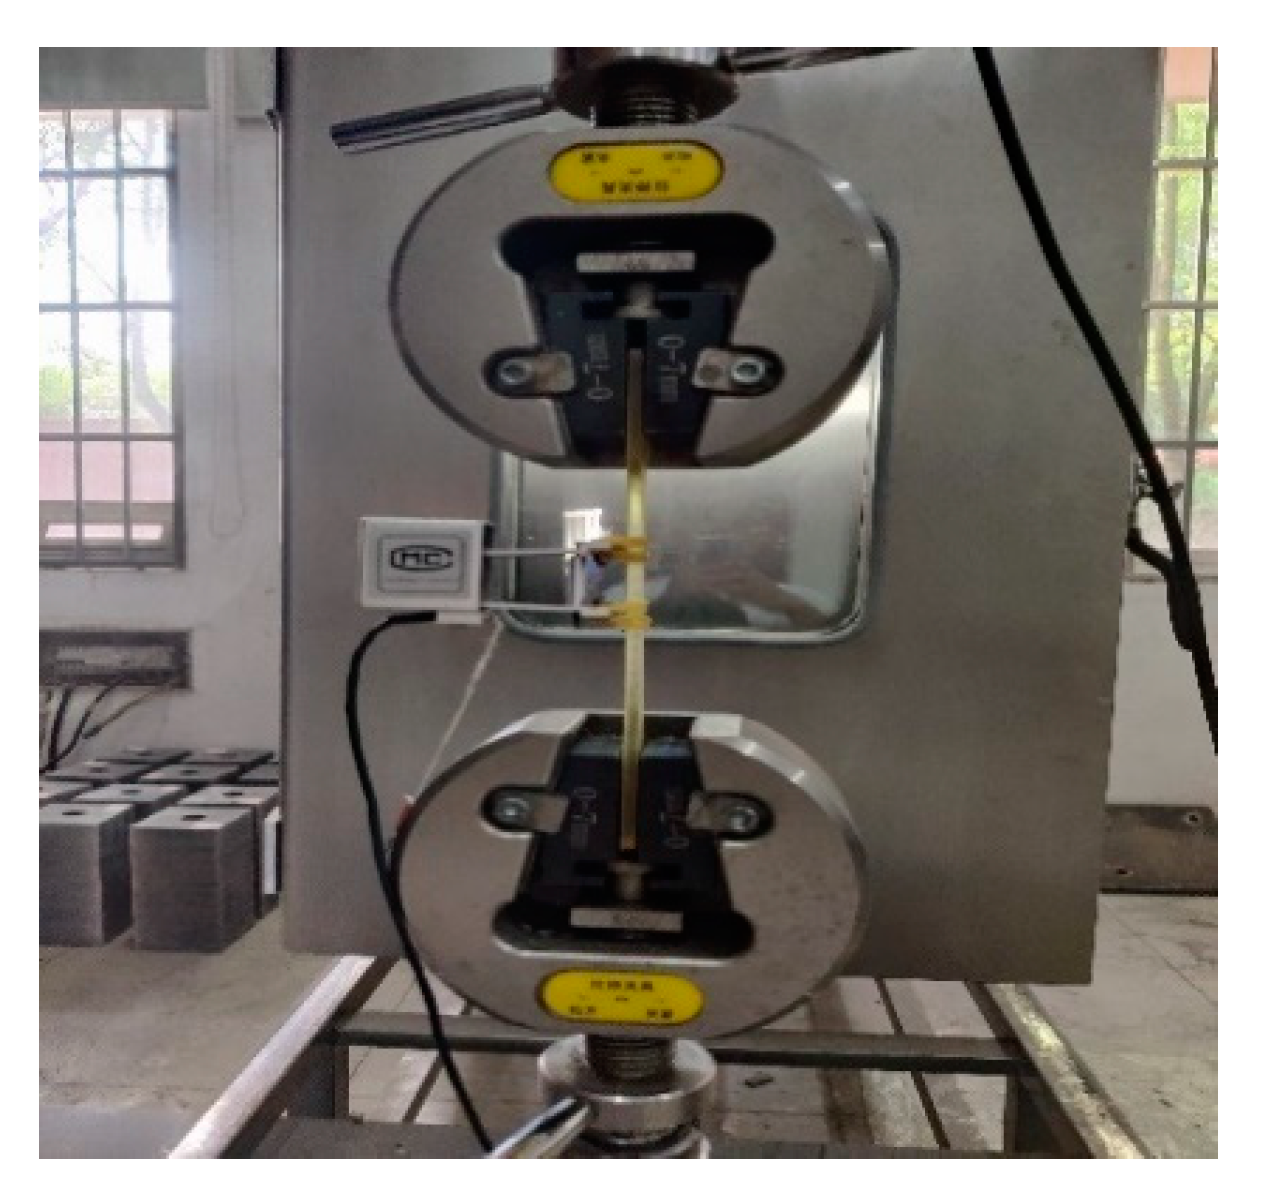
In this work, tensile, flexural and impact tests of modified epoxy resins are conducted according to the Chinese specification, “Test Method of Resin Casting Body Properties” (GBT 2567-2008). To facilitate the subsequent measurement of the microstructure and actual dimensions of the damaged section, the specimens were numbered first, such as “1.25-1” for the first specimen with PS doping of 1.25 wt%. As shown in Figure 3, the specimen will be clamped at both ends of the upper and lower jigs, and the elongation meter will be fixed to the specimen spacing section with rubber bands. The test loading rate was 2 mm/min, and the damage load value was extracted when the specimen was damaged.
The tensile strength of the adhesive is calculated according to Equation (1).
σ t = P b h
where σ t (MPa) is the tensile strength of the specimen, P (N) is the ultimate load of the specimen, and b (mm) and h (mm) are the width and height, respectively, of the specimen section.
The tensile modulus E is taken as the slope of the straight-line segment in the tensile stress–strain curve. Since the strain of the specimen is measured by the elongation gauge in the loading test, the stress–strain of the specimen is calculated as Equations (2) and (3).
σ = P b h
ε = d L
where, in Equation (2), σ (MPa) is the specimen stress. P (N), b (mm) and h (mm) are as above, ε is the specimen strain and elongation at break, d (mm) is the extensometer test data, and L is the length of the specimen 200 mm.

2.3.2. Flexural Test

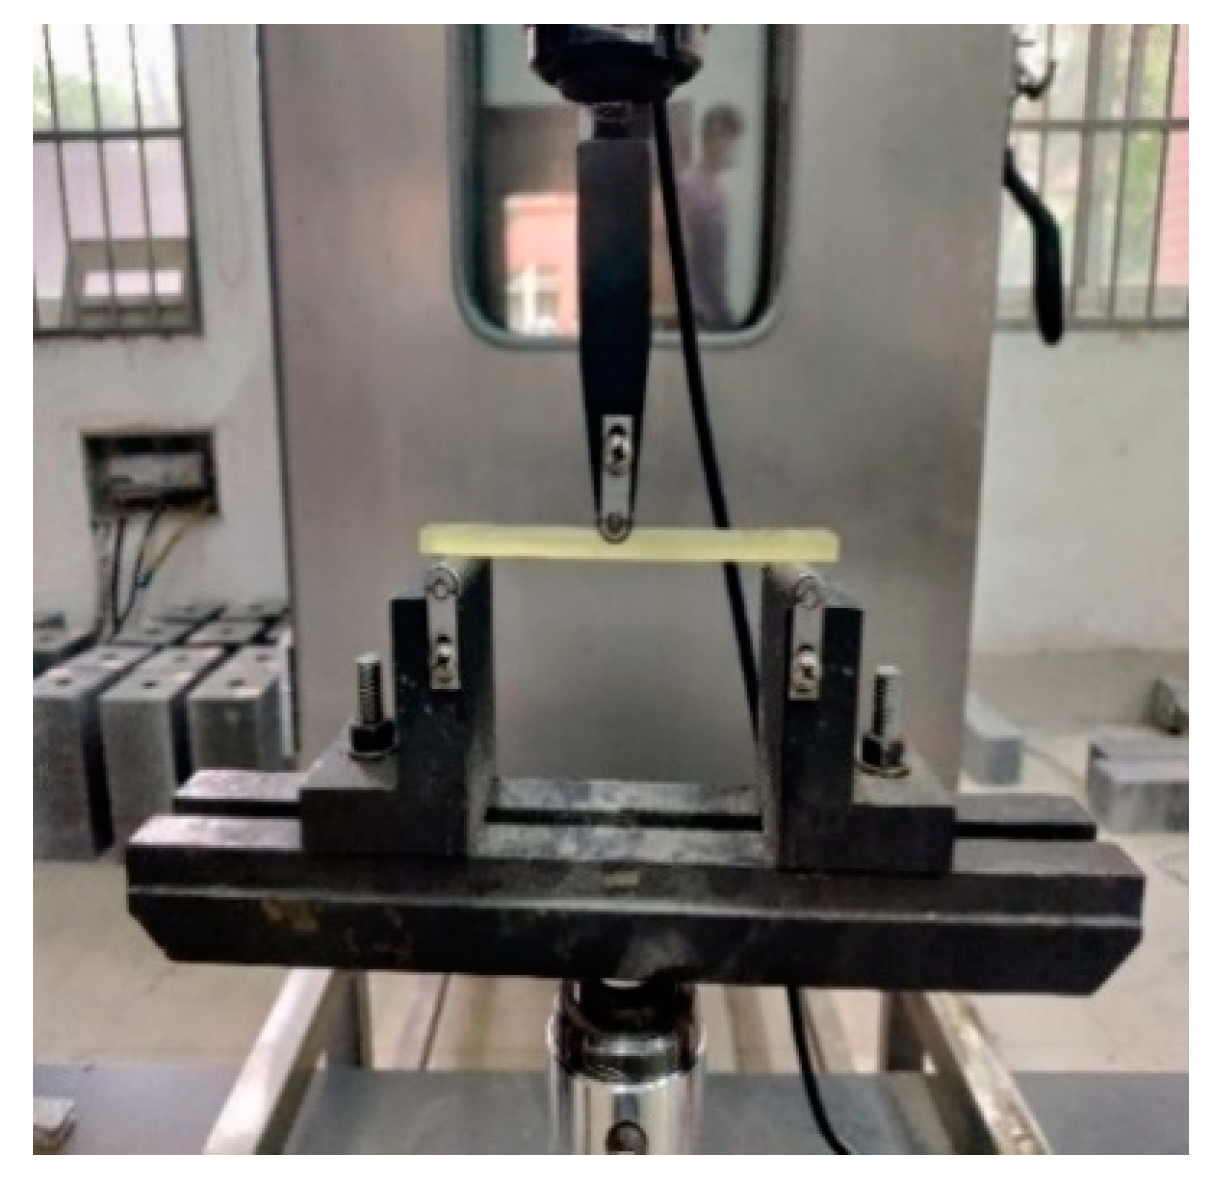
First, the specimens were numbered, and then the specimens were placed on the bracket, with each end of the specimen 10 mm away from the bracket, as in Figure 4. The test loading rate was 2 mm/min, and the ultimate load value was recorded when the specimens were damaged.
The flexural strength is calculated according to Equation (4).
σ t = 3 p L 2 b h 2
where σ t (MPa) is the flexural strength, P (N) is the breaking load, L (mm) is the length of the specimen, b (mm) is the width of the specimen, and h (mm) is the thickness of the specimen.
The bending elastic modulus is calculated according to Equation (5).
E f = L 3 Δ P 4 b h 3 Δ S
where E f (MPa) is the bending modulus of elasticity, Δ P (N) is the load increment value of the initial straight section of the load-deflection curve, and Δ S (mm) is the mid-span deflection corresponding to the load increment Δ P .

2.3.3. Impact Test

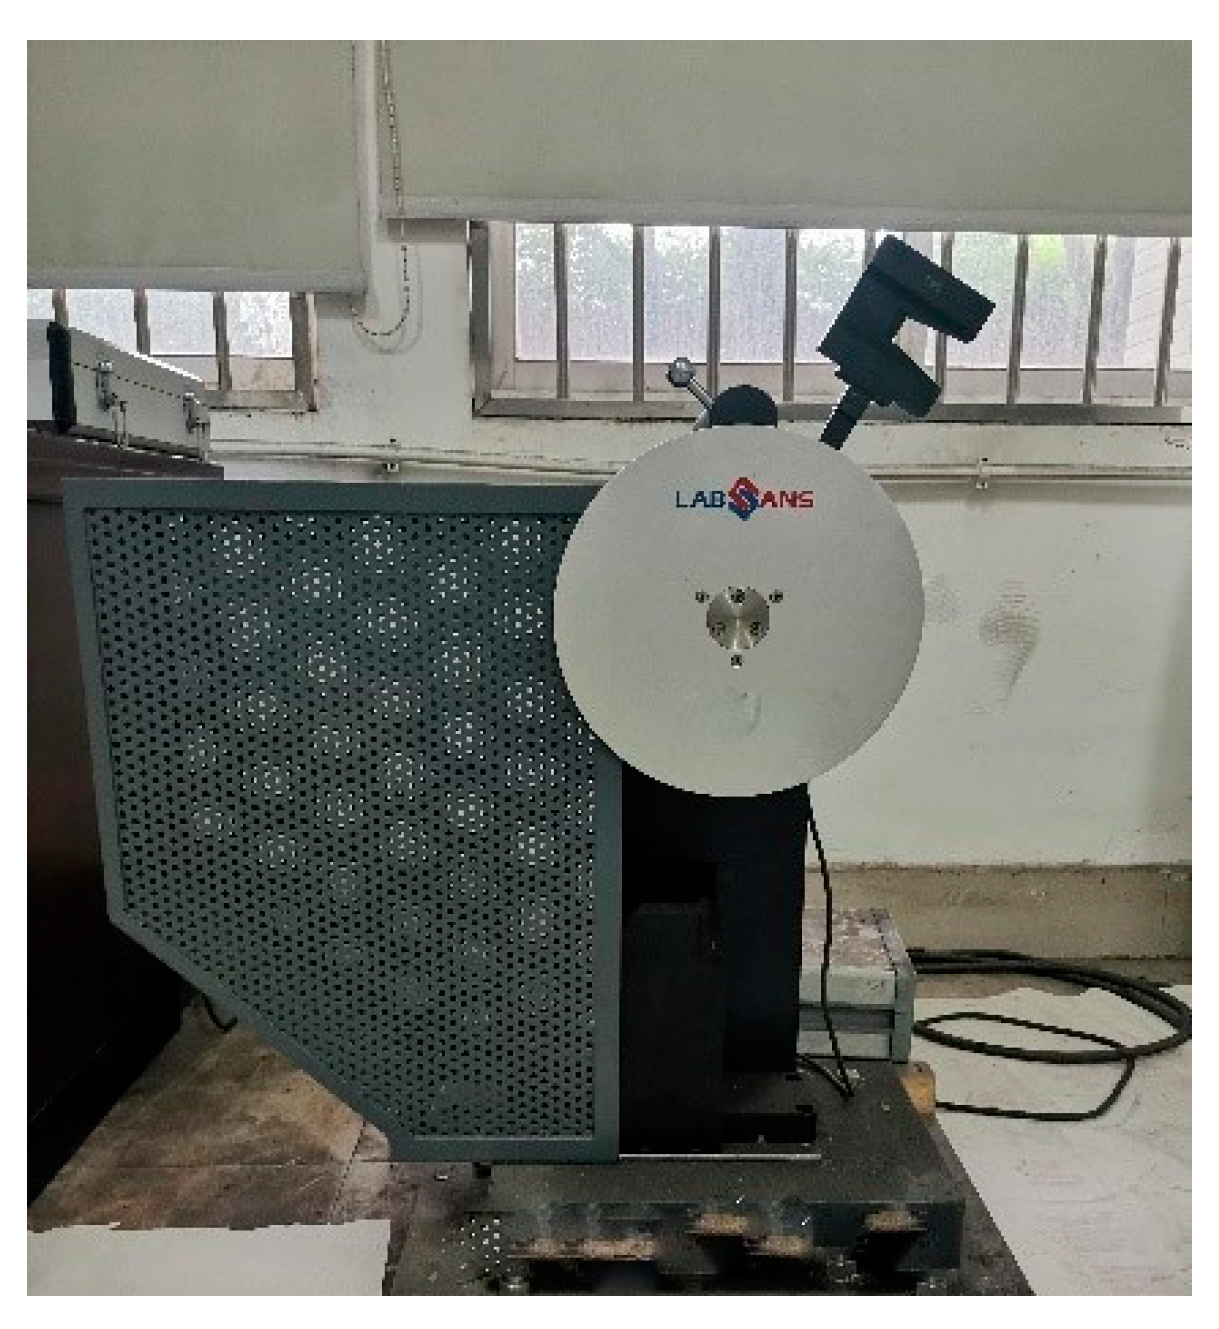
In this work, the specimen without a notch is used, so the size specification in the instrument is adjusted to 10 mm × 4 mm without notch mode before testing the impact performance. First, the specimen was placed on the holder so that the specimen was centered, then the pendulum was released smoothly. After the pendulum impacts the specimen, the energy consumed by the specimen and the form of damage was read from the instrument page, as shown in Figure 5.
The impact strength is calculated according to Equation (6).
σ K = A b d
where σ K ( kJ / m 2 ) is the impact strength, A (J) is the work consumed by punching the sample, and b (mm) and d (mm) are the width and thickness of the middle of the sample, respectively.

3. Results and Discussions

3.1. Tensile Properties of Epoxy Resins with Different PS Weight Fraction

Table 2 shows the tensile test data of specimens doped with different weight fractions of PS microspheres, and the corresponding tensile strength, elastic modulus and elongation at break variation curves are plotted according to Table 2.
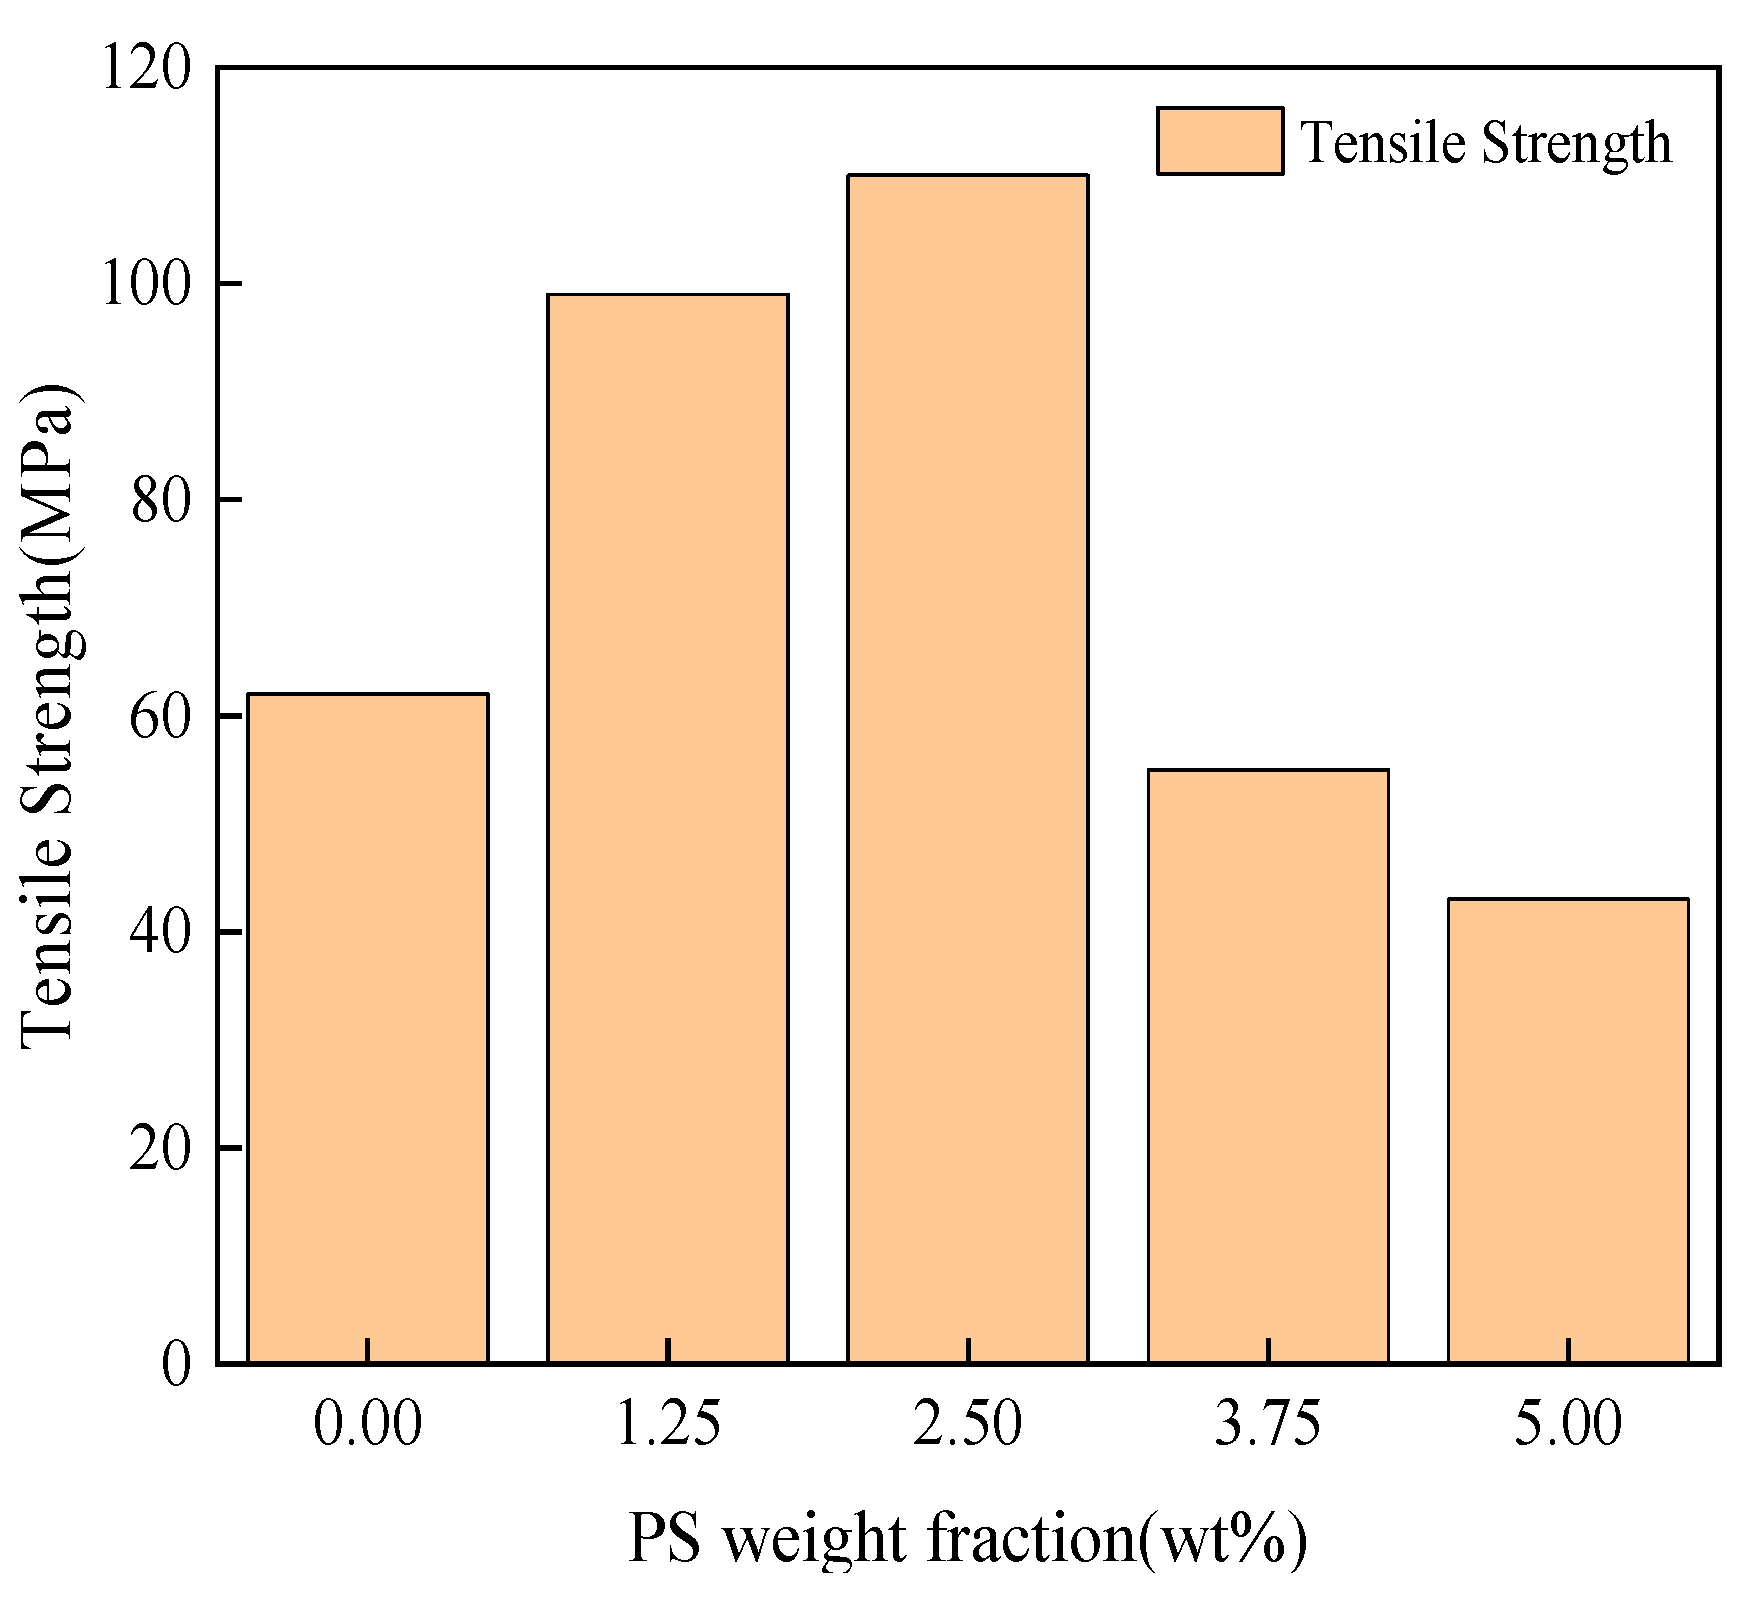
The tensile strengths of the specimens with different PS weight fractions are shown in Figure 6. It can be seen from the figure that with the increase in the PS weight fraction, the tensile strength of the specimens shows a trend of increasing and then decreasing, and the tensile strength of the specimens increased from 62 MPa to 110 MPa with the increase in PS weight fraction from 0 wt% to 2.5 wt%, an increase of 77%. However, the tensile strength of the specimens decreases substantially when the PS weight fraction is increased further, and when the PS weight fraction is greater than 3.75 wt%, the tensile strength of the specimens is lower than that of the specimens without the addition of PS, at which time the addition of PS causes a significant decrease in the tensile strength.
The elastic moduli of the specimens with different PS weight fractions are shown in Figure 7. The trend of the elastic modulus of the specimens with different PS weight fractions is similar to that of the tensile strength, both showing an increase and then a decrease. However, the difference is that when increasing the PS weight fraction from 0 wt% to 1.25 wt%, the elastic modulus of the specimens increases substantially from 12,087 MPa to 29,641 MPa, an increase of 145%, which is significant; continuing to increase to 2.5 wt%, the elastic modulus increases less (only 2.7%), which is not much different from the PS weight fraction of 1.25 wt%. Continuing to increase the PS weight fraction, the modulus of elasticity of the specimens decreases sharply to a level close to that of the specimens without PS addition, so that the modulus of elasticity peaks at weight fractions of 1.25 wt% and 2.5 wt%.
The elongation at break of the specimens doped with different weight fractions of PS is shown in Figure 8. It can be seen that the trend of elongation at break is different from that of tensile strength and modulus of elasticity. The elongation at break of the specimen was maximum when the weight fraction of PS was 0 wt%. As the weight fraction of PS increased, the elongation at break of the specimens decreased, and the elongation at break decreased from 0.6037 to 0.3378 with the addition of a small amount of PS, a decrease of 44%, and it can be concluded that a certain amount of PS doping will significantly reduce the elongation at break of the specimens [30]. However, a further increase in PS doping increases the elongation at the break of the specimens, and at a PS weight fraction of 3.75 wt%, the elongation at the break of the specimens reaches a maximum of 0.5494, yet it is still less than the initial elongation at break of the specimens.
The tensile stress–strain curves of the specimens doped with different weight fractions of PS are shown in Figure 9. Despite the different weight fractions of PS incorporated, the stress–strain curves of the specimens were linear, i.e., they only showed the elastic phase and did not show the damage phase, which was due to the influence of the environment [31]. During winter, when the ambient temperature is lower and the specimen raw material is less liquid, it takes more time to mix the raw material evenly than in summer, but the mixing time was kept the same to control the variables, but the environment of the test was the same when testing the effect of PS weight fraction on the mechanical properties of the specimens. Therefore, the data of this test are valid.
The effect of PS incorporation on the stress–strain curves of the specimens was significant. With the increase in PS content, the stress–strain curve of the specimen changed from flat to steep, and the slope and peak of the curve increased significantly, which indicated that the ability of the specimen to resist deformation was improved. The slopes of the curves of the specimens with PS doping of 1.25 wt% and 2.5 wt% are close to each other, with the difference that the peak value of the 2.5 wt% specimen is higher, and the slope and peak values of the curves decrease as the PS doping continues to increase, even to below 0 wt% for the specimens with PS doping, which echoes the conclusion drawn from the tensile strength of the above specimens.

3.2. The Flexural Properties of Epoxy Resins with Different PS Weight Fraction

The results of three-point bending tests for specimens with different mass fractions of PS microspheres doped are shown in Table 3. Based on the data in the table, the flexural strength, flexural modulus and deflection curves were plotted for different weight fractions of PS.
The flexural strength of the specimens with different PS weight fractions is shown in Figure 10. As shown in the figure, the flexural strength of the specimens increased with the increase in PS weight fraction. When the PS weight fraction was increased to 2.5 wt%, the flexural strength of the specimens reached a peak of 178 MPa, which was 71% higher than that of the specimens without PS addition, with a significant enhancement effect. The bending strength of the specimens showed a decreasing trend when the PS content was increased to 5 wt%, and the bending strength of the specimens was only 96.48 MPa, which was 46% lower than that of the specimens with a PS weight fraction of 2.5 wt% and 9 MPa smaller than that of the specimens without PS addition.
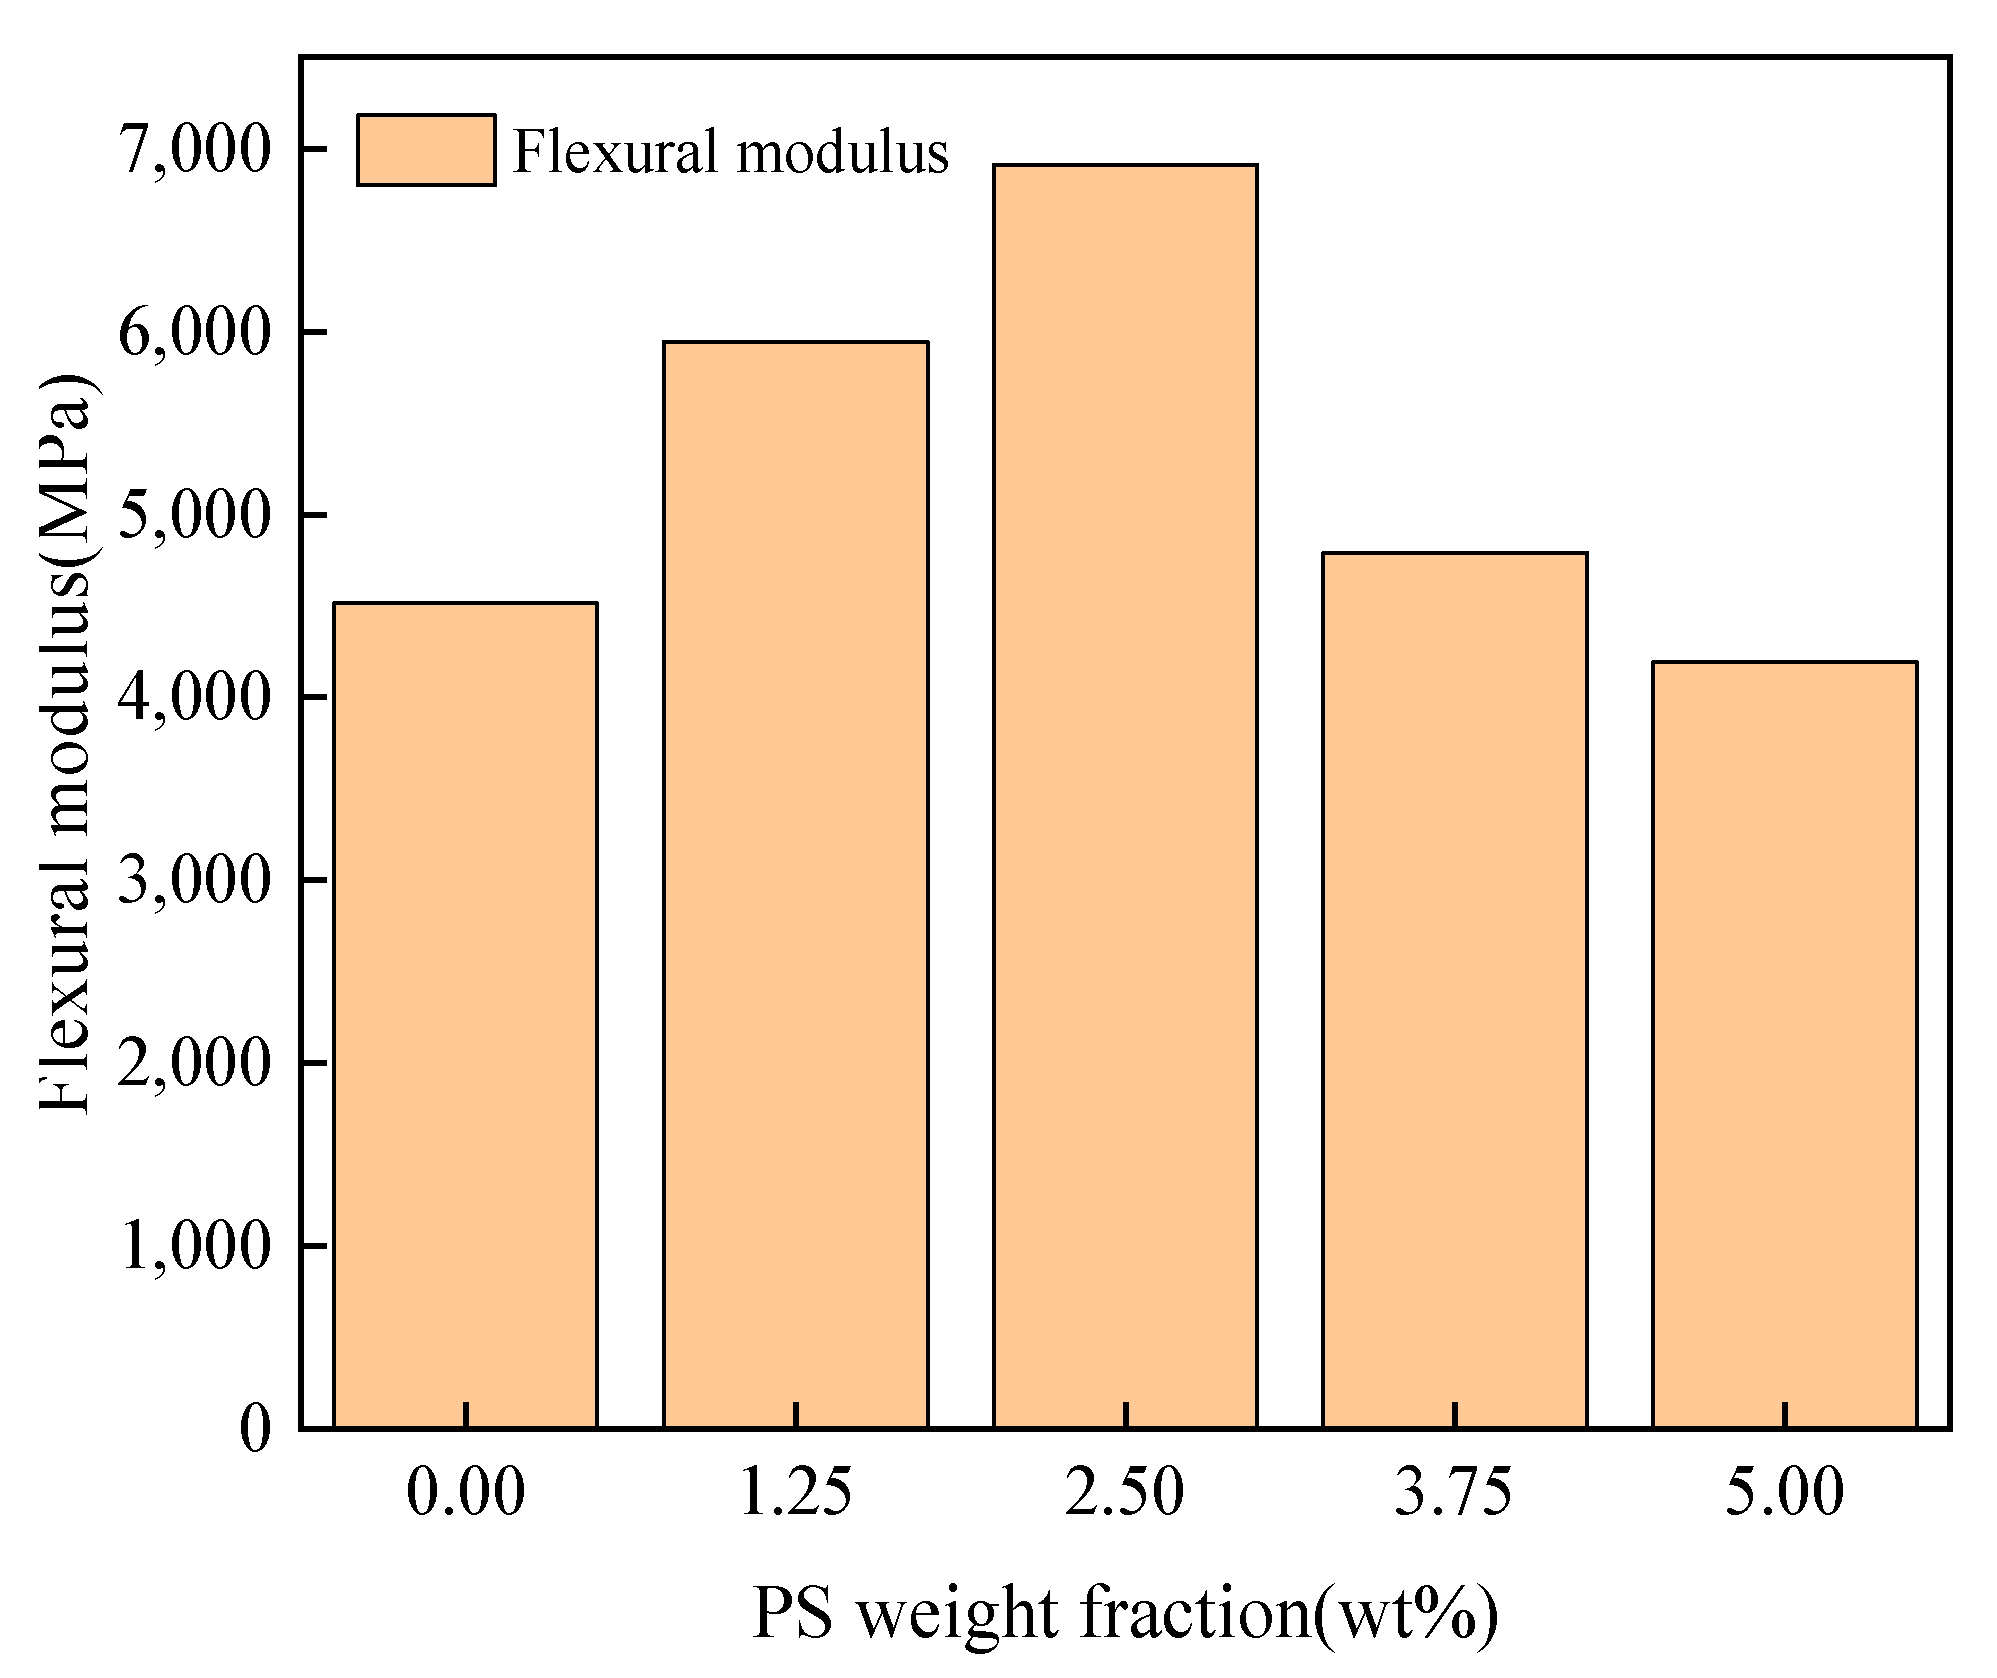
Figure 11 shows the flexural modulus of specimens with different PS weight fractions. As can be seen from the figure, the variation pattern of flexural modulus is similar to that of flexural strength, showing a trend of rising to the peak and then falling. The specimens with PS weight fraction of 2.5 wt% show the largest flexural modulus, which is 35% higher than that of the specimens without PS addition, with a clear trend of improvement. However, as the PS weight fraction increased again, the flexural modulus of the specimens decreased. When the PS weight fraction increased to 5 wt%, the flexural modulus decreased by 39% compared to the specimens with a PS weight fraction of 2.5 wt% and was 322 MPa smaller than that of the specimens without PS addition.
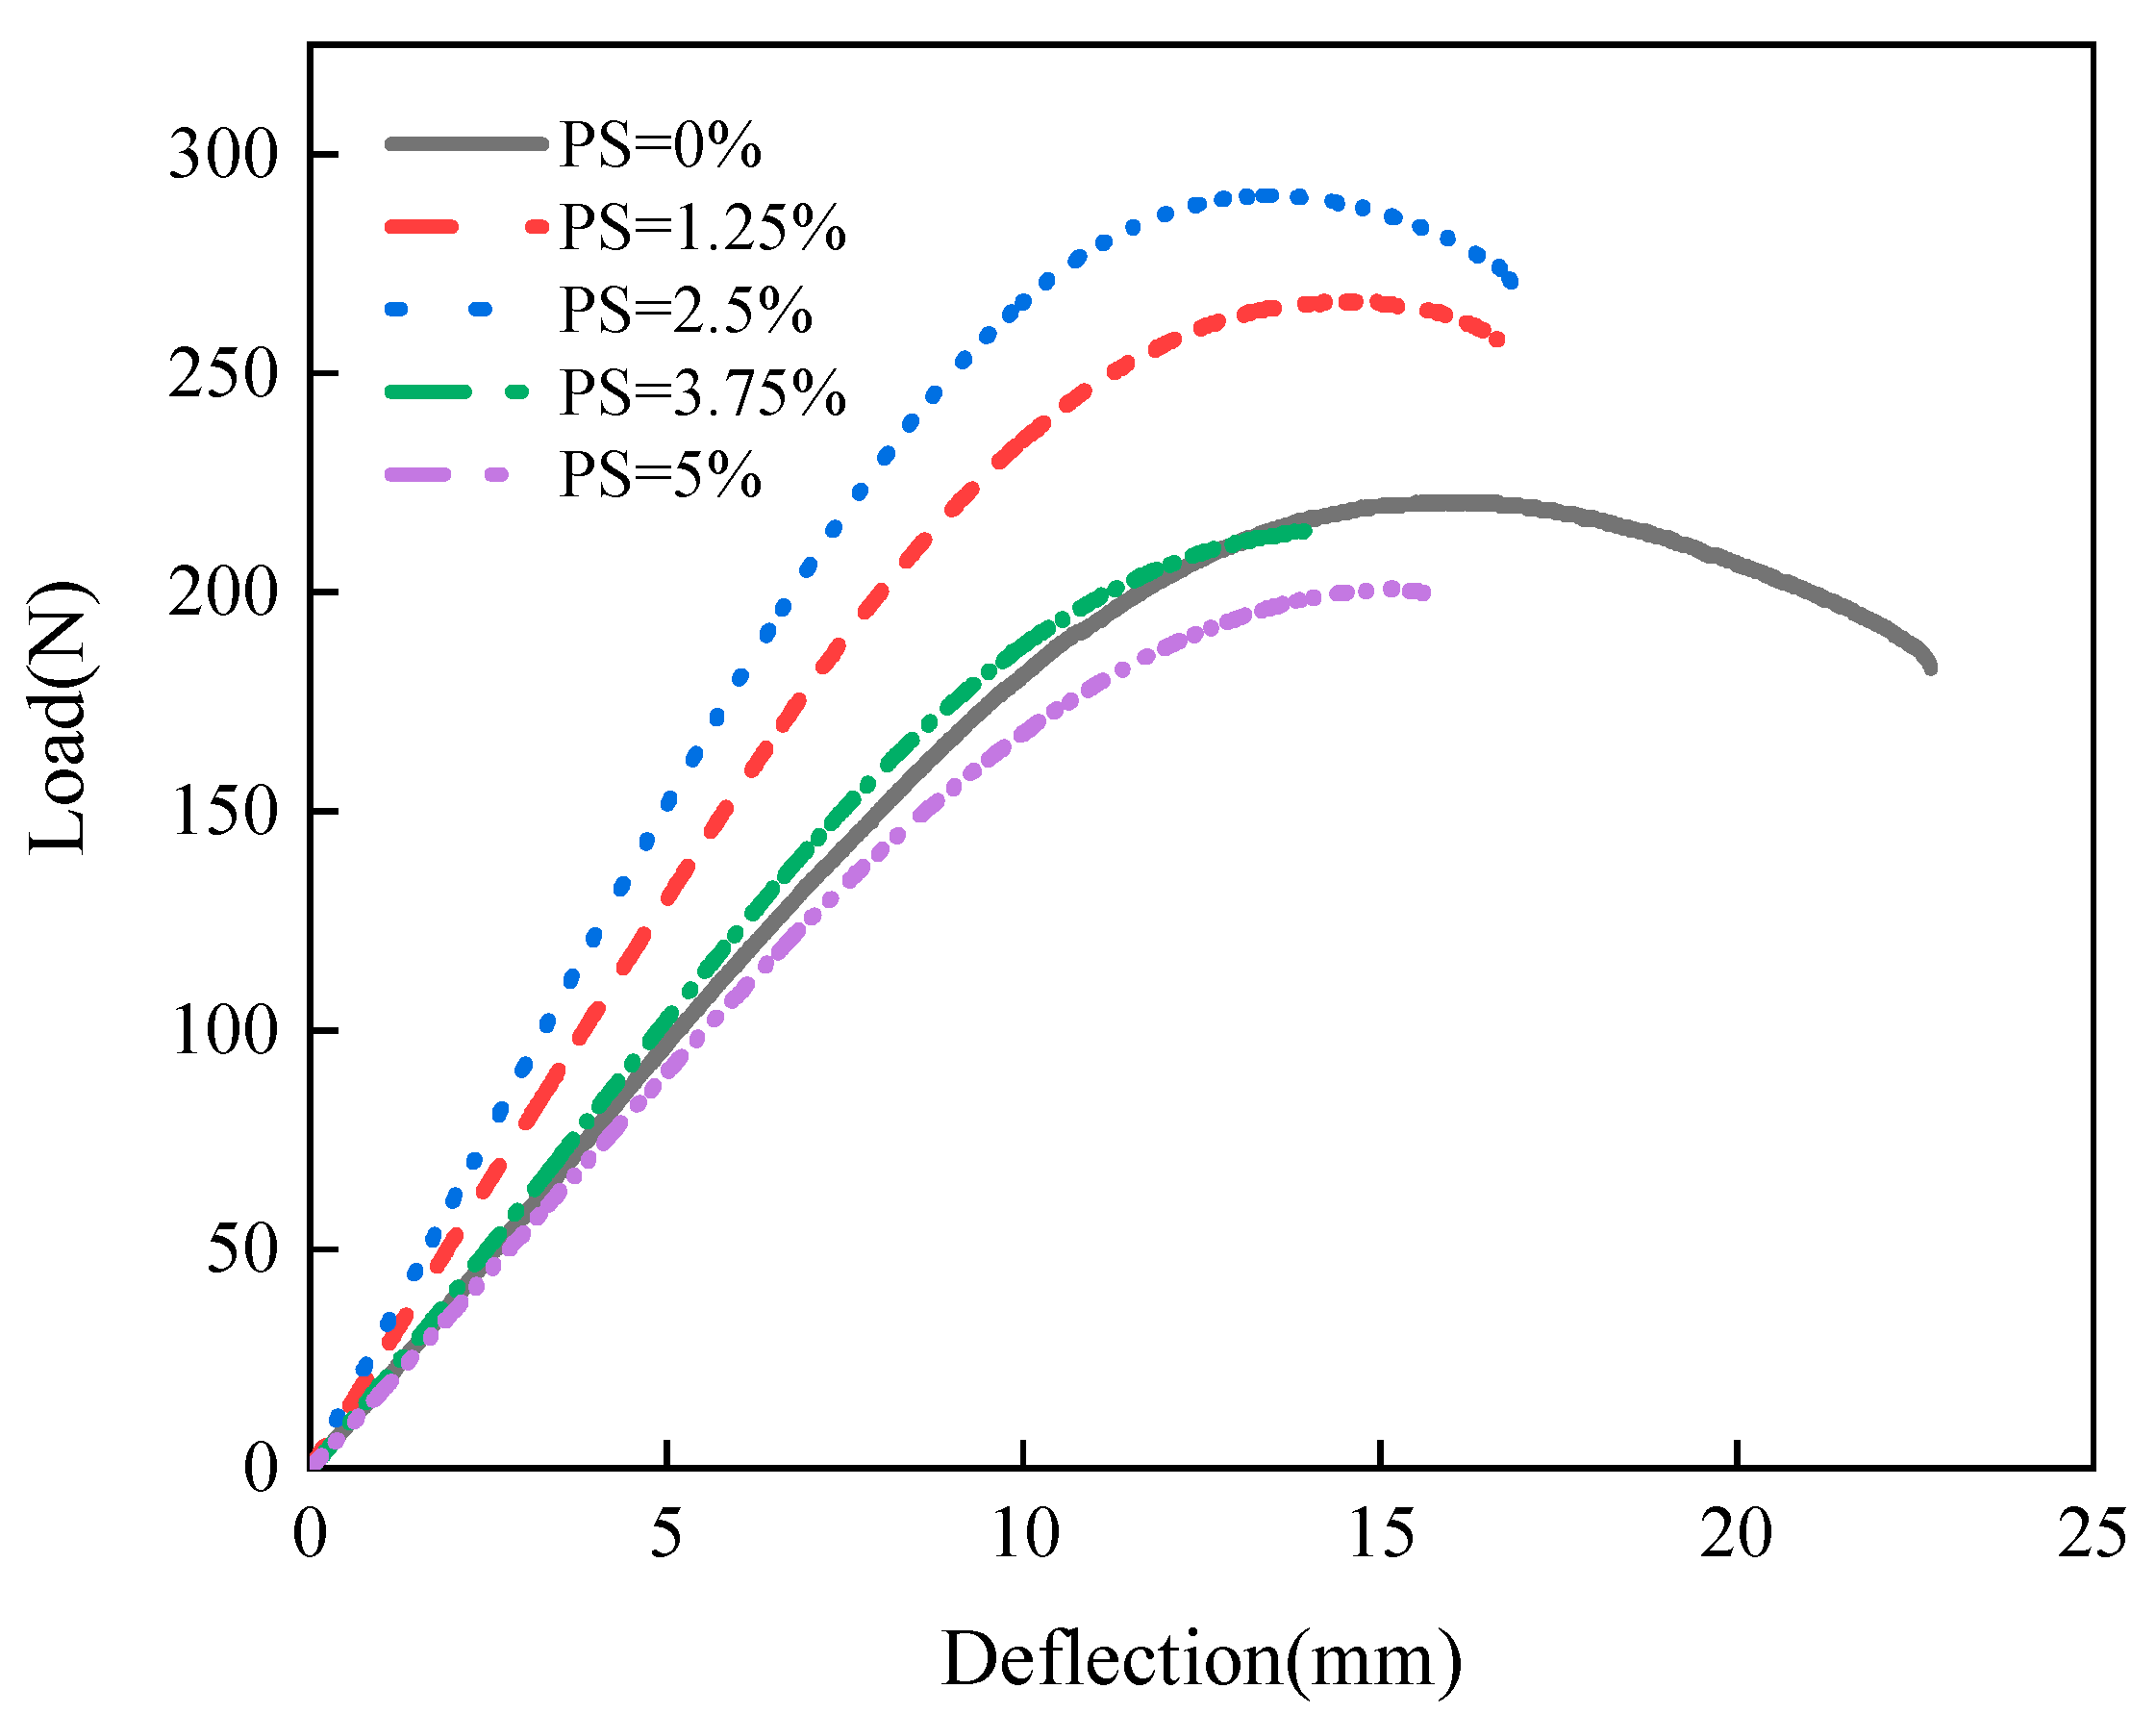
Figure 12 shows the load-deflection curves of specimens with different PS weight fractions. As can be seen from the figure, the curve is divided into two parts: the elastic stage and the damage stage. At the beginning of loading, the load-deflection curve is a straight line, and the specimen is in the elastic stage; as the load continues to increase, the specimen deflection reaches its peak; then as the load increases, the curve starts to decline, and the specimen enters the damage stage. The load-deflection curves corresponding to specimens with different PS weight fractions vary greatly. When the weight fraction of PS was 0 wt%, the deflection of the specimen was the largest; as the weight fraction of PS increased, the slope of the curve increased and the peak value increased, but the corresponding range of deflection changes decreased significantly; when the weight fraction of PS increased from 1.25 wt% to 2.5 wt%, the slope and peak value of the curve increased, but the corresponding deflection changes were small or even unchanged; continuing to increase the weight fraction of PS, the slope and peak of the curve show a decreasing trend when the weight fraction of PS is increased. However, the changes in deflection of the specimens mixed with PS were all in the same range, and the deflection was substantially decreased compared with the specimens without PS added.

3.3. Impact Performance of Epoxy Resin with Different PS Weight Fraction

The impact performance test results for different PS weight fraction specimens are shown in Table 4. the impact strength variation was plotted according to the table.
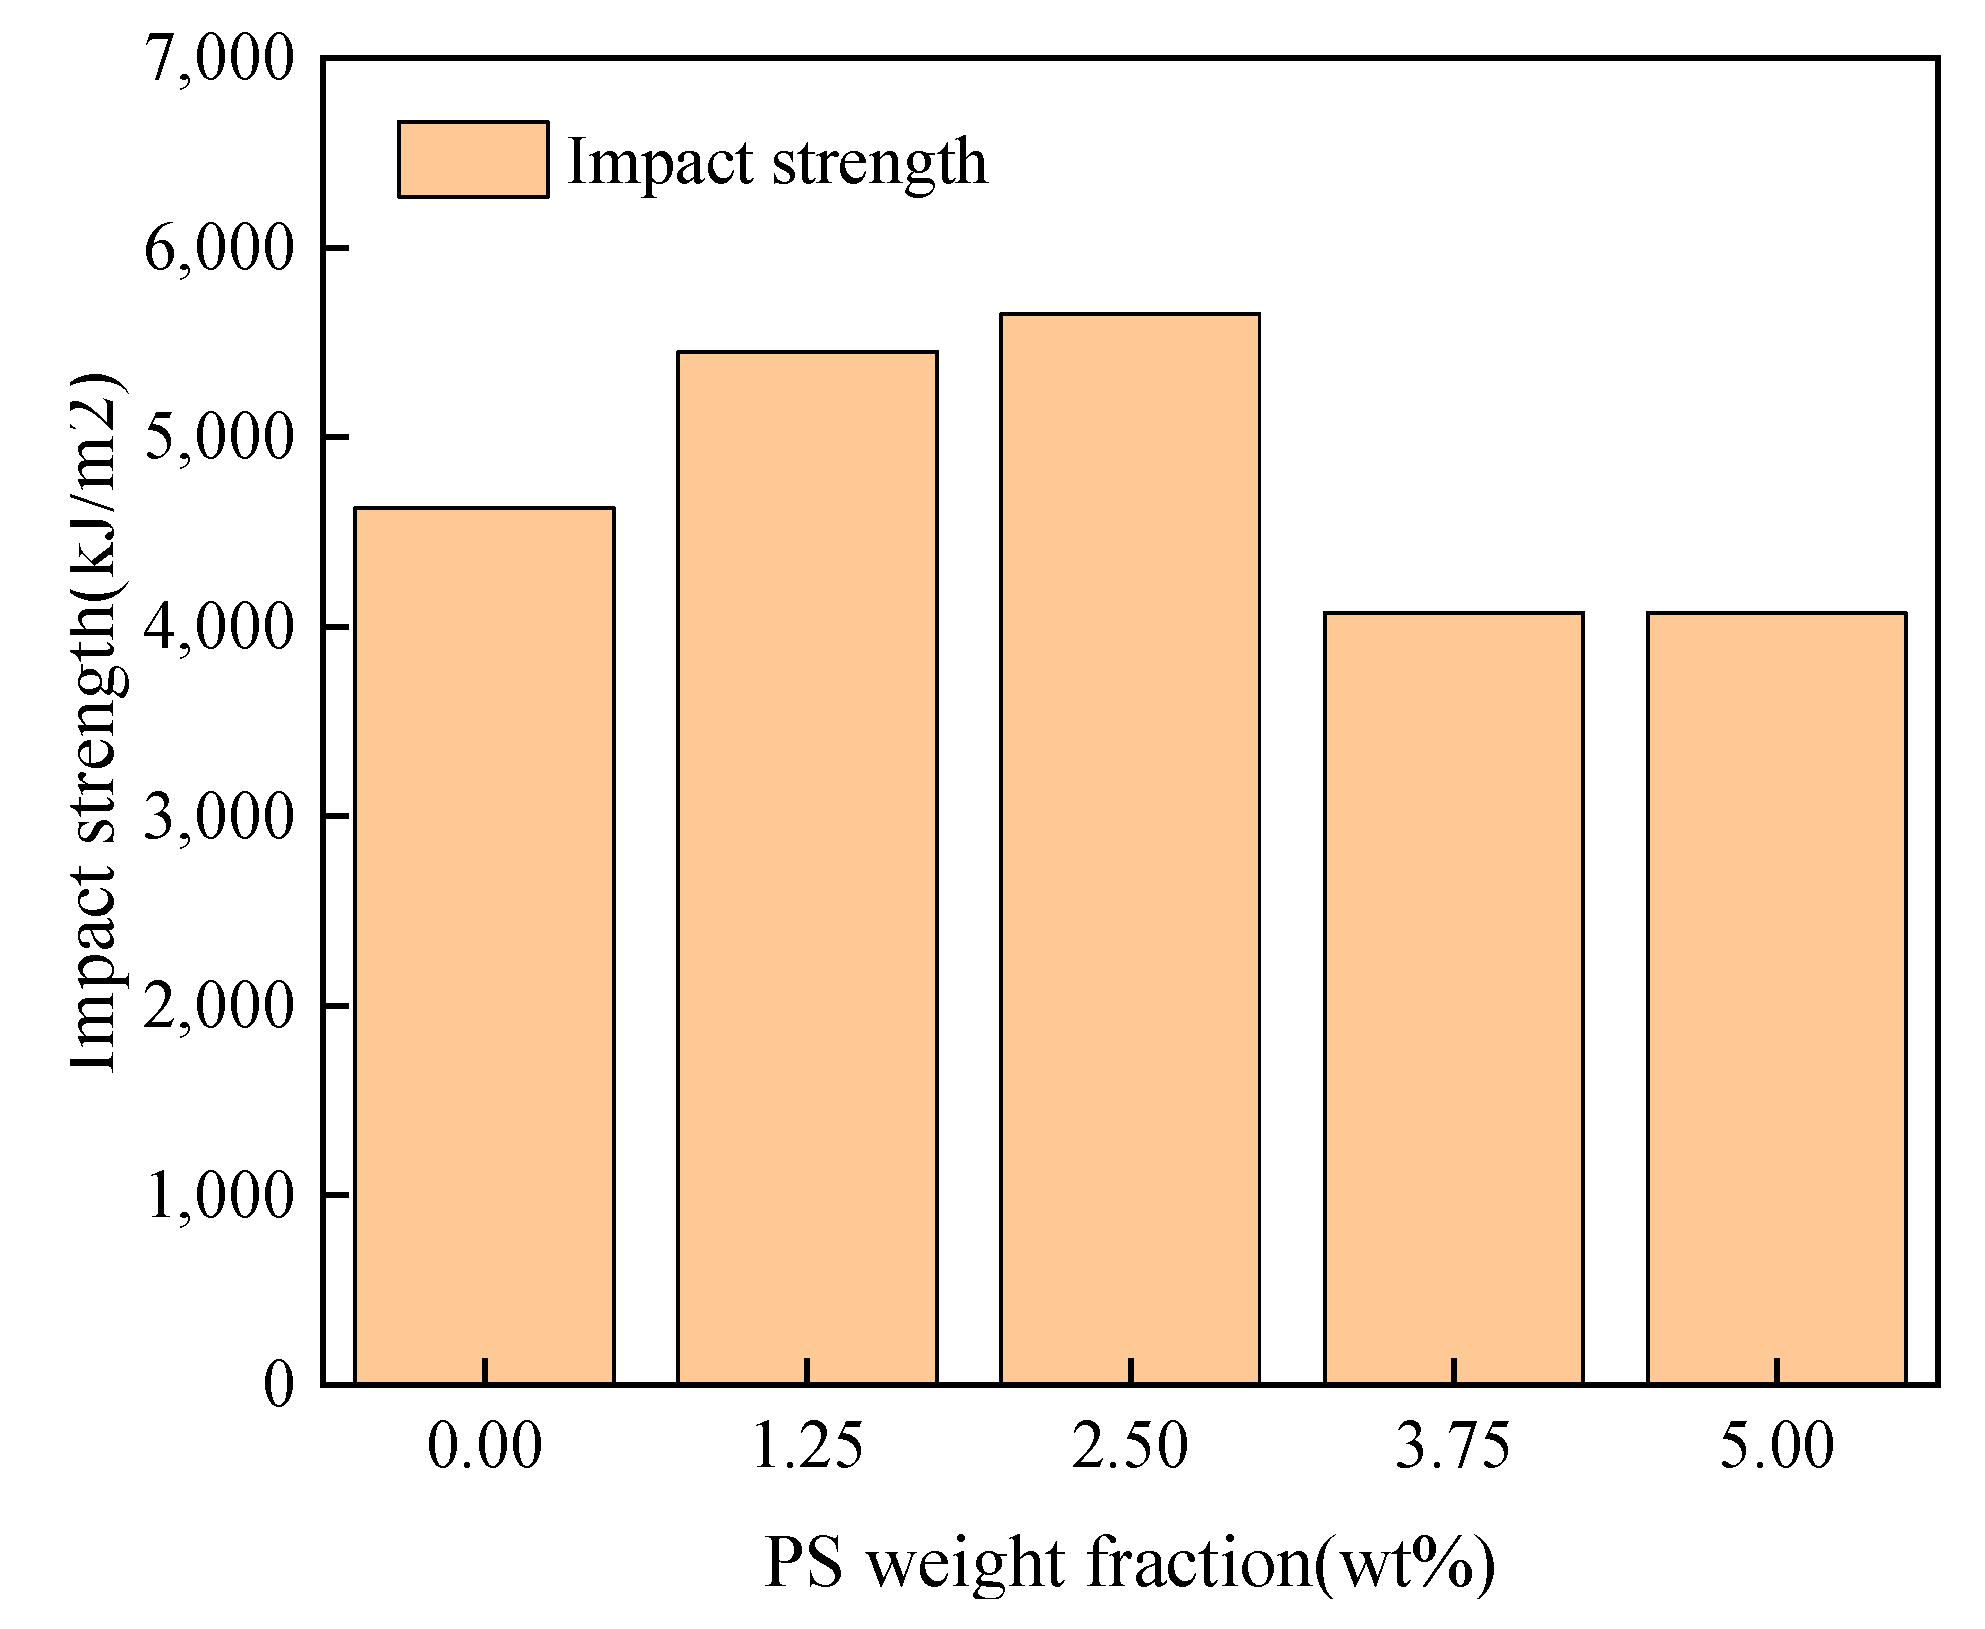
The impact strengths of the specimens with different PS weight fractions are shown in Figure 13. From the figure, it can be seen that the impact strength of the specimens increased with the increase in PS weight fraction. The increase in impact strength from 0 wt% to 2.5 wt% for PS weight fraction was 22%, which is a significant enhancement effect. However, by continuing to increase PS, the impact strength of the specimens began to decrease. The impact strength values were the same for the specimens with PS mass fractions of 3.75 wt% and 5 wt%, both of which were 4075 KJ/m2, not excluding the existence of chance in the test, and the impact strength decreased by 12% compared to the specimens with a PS weight fraction of 2.5 wt%.

3.4. The Micromorphology of Epoxy Resin with Different PS Weight Fractions

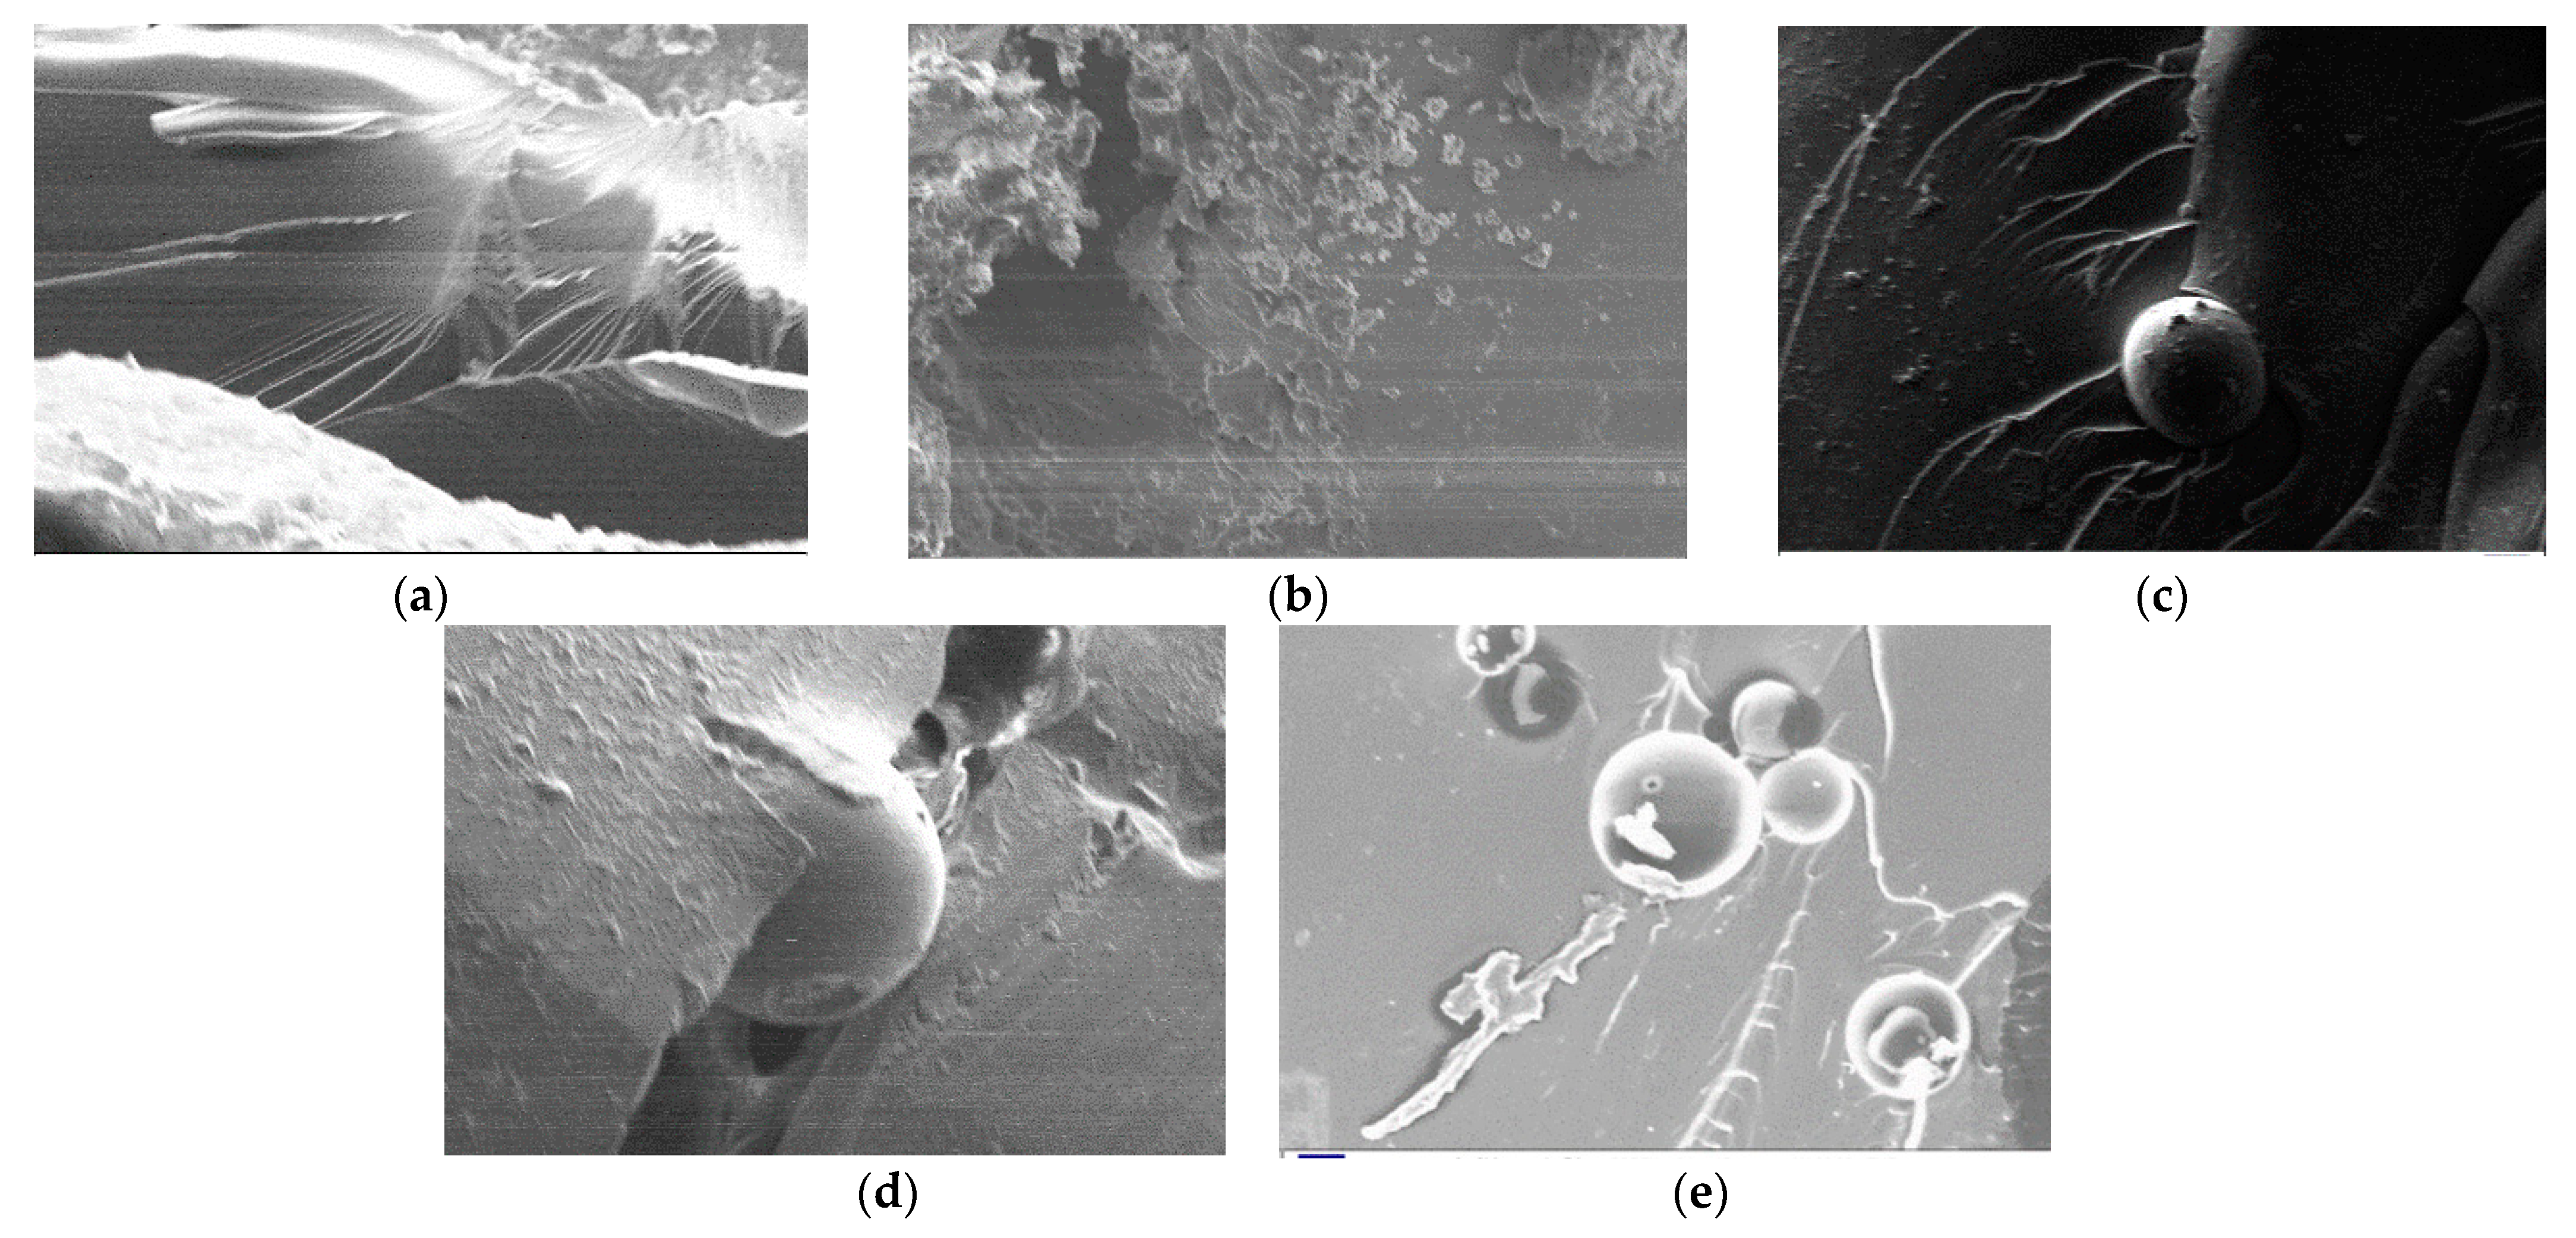
The fracture surface of the tensile specimen was gold-sprayed and the test temperature was 24 °C. The microscopic morphology of the tensile section of the epoxy resin adhesive with different PS weight fractions was observed using SEM, as shown in Figure 14.
It can be seen that when the PS weight fraction is 0 wt%, the PS/bisphenol A-type epoxy resin composites have relatively smooth fracture surfaces with basically no obvious bumps and cracks, typical of brittle damage. When the PS weight fraction was increased to 1.25 wt%, the tensile section became rough, with obvious lines formed by tensile fracture. It can be observed from Figure 14c,d that cracks appeared in the fracture surface of the specimen with 2.5 wt% PS, and the cracks were effectively suppressed when the cracks extended to the PS particles; according to the “silver grain–nail anchor” mechanism [29,32,33], when PS micron material was added to the epoxy resin, the PS particles would act like nail anchors at the crack extension. The crack expansion needs to bypass or shear the PS particles, thus limiting the damage to the substrate. When the epoxy resin matrix fractures, the PS particles will produce large deformation to absorb energy to improve the fracture toughness of the PS/epoxy resin composite, thus inhibiting crack expansion. When the PS weight fraction was increased to 5 wt%, it can be seen from Figure 14e that with the increase in PS mass fraction, although PS can prevent crack growth, PS particles appear agglomerated in the resin [34,35], leading to the decrease in the mechanical properties of PS/epoxy resin composites.

4. Conclusions

In this work, a new micron-material-modified epoxy resin adhesive was prepared by toughening epoxy resin with micron polystyrene (PS) microspheres as micron filler, and three different mechanical properties of the modified adhesive in tensile, bending and impact were investigated, and the following conclusions were drawn.
(1)
The mechanical properties of the epoxy resin were significantly improved by adding the appropriate amount of micron polystyrene (PS). The tensile strength, the tensile modulus of elasticity, flexural strength, flexural modulus and impact strength of the adhesives showed a trend of increasing and then decreasing with the increase in PS incorporation; 2.5 wt% of PS resulted in the optimum mechanical properties, which were improved by 77%, 147.7%, 71%, 35% and 22%, respectively, compared with the pure epoxy resin.
(2)
The influence of PS admixture on the elongation at break and bending deflection of the adhesive was significant; the elongation at break and bending deflection of the adhesive were maximum when the PS admixture was 0. With the increase in PS mass fraction, the elongation at break and flexural deflection of the adhesive increased, but still less than the pure resin.
(3)
Correlations between the microscopic morphology and the mechanical properties of the adhesive were obtained using SEM techniques. The PS particles produce large deformation to absorb energy when the matrix fractures, and crack expansion needs to bypass or shear the PS particles, thus inhibiting the crack expansion and achieving toughening. When the PS weight fraction increases to 5%, PS particles in the resin appear to adhere to the agglomeration phenomenon, resulting in a decrease in the mechanical properties of the adhesive.

Author Contributions

Conceptualization, C.L. and Y.L.; methodology, C.L.; validation, C.L. and Z.C.; formal analysis, C.L.; investigation, Z.C.; resources, Z.C.; data curation, C.L. and Y.L.; writing—original draft preparation, C.L., Y.L. and Z.C.; writing—review and editing, Y.L.; visualization, C.L.; supervision, C.L. and Z.C.; project administration, C.L.; funding acquisition, Z.C. All authors have read and agreed to the published version of the manuscript.

Funding

This research was funded by the National Natural Science Foundation of China through Grant Nos. 51708047, 51778069 and 51978081, the Natural Science Foundation of Hunan Province through Grant No. 2019JJ50670, and the Excellent Youth Project of the Hunan Provincial Department of Education through Grant No. 19B013.

Institutional Review Board Statement

Not applicable.

Informed Consent Statement

Not applicable.

Data Availability Statement

The data used to support this study are available from the corresponding author upon request.

Acknowledgments

We would like to thank the reviewers for their valuable suggestions.

Conflicts of Interest

The authors declare that they have no conflict of interest.

References

  1. Li, C.X.; Ke, L.; Chen, Z.Y.; He, J.; Guo, L.C.; Yang, J. Fatigue performance of orthotropic anisotropic steel bridge panels with curved cutouts and their CFRP reinforcement. Chin. J. Highw. 2021, 34, 63–75. [Google Scholar]
  2. Wang, Y.; Li, J.; Deng, J.; Li, S. Bond behavior of CFRP/steel strap joints exposed to overloading fatigue and wetting/drying cycles. Eng. Struct. 2018, 172, 1–12. [Google Scholar] [CrossRef]
  3. Ghafoori, E.; Motavalli, M.; Nussbaumer, A.; Herwig, A.; Prinz, G.S.; Fontana, M. Determination of minimum CFRP pre-stress levels for fatigue crack prevention in retrofitted metallic beams. Eng. Struct. 2015, 84, 29–41. [Google Scholar] [CrossRef]
  4. Wu, C.; Zhao, X.L.; Chiu, W.K.; Al-Mahaidi, R.; Duan, W.H. Effect of fatigue loading on the bond behavior between UHM CFRP plates and steel plates. Compos. Part B 2013, 50, 344–353. [Google Scholar] [CrossRef]
  5. Tavakkolizadeh, M.; Saadatmanesh, H. Fatigue Strength of Steel Girders Strengthened with Carbon Fiber Reinforced Polymer Patch. J. Struct. Eng. 2003, 129, 186–196. [Google Scholar] [CrossRef] [Green Version]
  6. Benachour, A.; Benyoucef, S.; Tounsi, A.; Bedia, E.A. Interfacial stress analysis of steel beams reinforced with bonded prestressed FRP plate. Eng. Struct. 2008, 30, 3305–3315. [Google Scholar] [CrossRef]
  7. Kotełko, M.; Lis, P.; Macdonald, M. Load capacity probabilistic sensitivity analysis of thin-walled beams. Thin-Walled Struct. 2017, 115, 142–153. [Google Scholar] [CrossRef] [Green Version]
  8. Li, C.X.; Ke, L.; Chen, Z.Y.; He, J.; Luo, N.H. Experimental and numerical simulation of bonding performance of CFRP-steel interface. J. Compos. 2018, 35, 3534–3546. [Google Scholar]
  9. Xu, B.S.; Qian, Y.J.; Tang, J.S.; Ma, M.; Li, X.B. Sensitivity analysis of stress parameters at CFRP-steel interface based on viscoelastic principal structure. Highw. Transp. Technol. 2017, 34, 57–63. [Google Scholar]
  10. Chen, Z.Y.; Peng, Y.Z.; Li, C.X.; Guo, J. Mechanical properties of double-lap steel-CFRP plate adhesive interface at high temperature. J. Compos. 2021, 38, 449–460. [Google Scholar]
  11. Li, C.X.; Li, Y.; He, J.; Liu, Y.M.; Peng, Y.Z. Effect of curing agent on the interfacial properties of room temperature glued CFRP sheets/steel plates. J. Constr. Mater. 2021, 24, 339–347. [Google Scholar]
  12. Yang, Y.; Biscaia, H.; Chastre, C.; Silva, M.A. Bond characteristics of CFRP-to-steel joints. J. Constr. Steel Res. 2017, 138, 401–419. [Google Scholar] [CrossRef]
  13. He, J.; Xian, G. Debonding of CFRP-to-steel joints with CFRP delamination. Compos. Struct. 2016, 153, 12–20. [Google Scholar] [CrossRef]
  14. Yuan, Z.W.; Niu, Y.P.; Wang, S.W.; Du, S.M. Toughening mechanism and research progress of epoxy resin. Resins 2019, 34, 65–70. [Google Scholar]
  15. Chen, F.; Wang, S.X.; Zhai, J.M.; Guo, J.J. Study on toughened bisphenol A epoxy resin modified by vinyl ester resin. Compos. Sci. Eng. 2020, 12, 92–99. [Google Scholar]
  16. Mishra, K.; Singh, R.P. Effect of APTMS modification on multiwall carbon nanotube reinforced epoxy nanocomposites. Compos. Part B 2019, 162, 425–432. [Google Scholar] [CrossRef]
  17. Li, H.W.; Yu, X.H.; Xia, Y. Synthesis of bisphenol S epoxy resin and development of its adhesive. China Adhes. 2021, 30, 1–4. [Google Scholar]
  18. Al-Mosawe, A.; Al-Mahaidi, R.; Zhao, X.L. Effect of CFRP properties, on the bond characteristics between steel and CFRP laminate under quasi-static loading. Constr. Build. Mater. 2015, 98, 489–501. [Google Scholar] [CrossRef]
  19. Biscaia, H.C.; Chastre, C. Theoretical analysis of fracture in double overlap bonded joints with FRP composites and thin steel plates. Eng. Fract. Mech. 2018, 190, 435–460. [Google Scholar] [CrossRef]
  20. Wang, J.J.; Zhang, X.Z.; Su, Y.L. Study on the toughening modification of epoxy resins. Resins 2020, 35, 55–59. [Google Scholar]
  21. Pinto, D.; Bernardo, L.F.; Amaro, A.; Lopes, S. Mechanical Properties of Epoxy Nanocomposites Using Alumina as Reinforcement—A Review. J. Nano Res. 2015, 30, 9–38. [Google Scholar] [CrossRef]
  22. Wazalwar, R.; Tripathi, N.; Raichur, A.M. Mechanical and curing behavior of epoxy composites reinforced with polystyrene-graphene oxide (PS-GO) core-shell particles. Compos. Part C Open Access 2021, 5, 100128. [Google Scholar] [CrossRef]
  23. Korayem, A.H.; Li, C.Y.; Zhang, Q.H.; Zhao, X.L.; Duan, W.H. Effect of carbon nanotube modified epoxy adhesive on CFRP-to-steel interface. Compos. Part B 2015, 79, 95–104. [Google Scholar] [CrossRef]
  24. Omrani, A.; Simon, L.C.; Rostami, A.A. The effects of alumina nanoparticle on the properties of an epoxy resin system. Mater. Chem. Phys. 2008, 114, 145–150. [Google Scholar] [CrossRef]
  25. Serin, H.; Yıldızhan, Ş. Tensile properties and cost-property efficiency analyses of expanded polystyrene/chopped glass fiber/epoxy novel composite. J. Mech. Sci. Technol. 2021, 35, 145–151. [Google Scholar] [CrossRef]
  26. Hu, Z.F.; Duan, H.J.; Tang, Y.S.; Chen, X.S.; Zhang, L. End-epoxy-based polystyrene oligomers toughened modified epoxy resins. Resins 2016, 31, 49–53. [Google Scholar]
  27. Mirmohseni, A.; Zavareh, S. Modeling and optimization of a new impact-toughened epoxy nanocomposite using response surface methodology. J. Polym. Res. 2011, 18, 509–517. [Google Scholar] [CrossRef]
  28. GBT 2567-2008; Test Method of Resin Casting Body Properties. General Administration of Quality Supervision, Inspection and Quarantine: Beijing, China, 2008.
  29. Rostamiyan, Y.; Mashhadzadeh, A.H.; SalmanKhani, A. Optimization of mechanical properties of epoxy-based hybrid nanocomposite: Effect of using nano silica and high-impact polystyrene by mixture design approach. Mater. Des. 2013, 56, 1068–1077. [Google Scholar] [CrossRef]
  30. Fereidoon, A.; Mashhadzadeh, A.H.; Rostamiyan, Y. Experimental, modeling and optimization study on the mechanical properties of epoxy/high- impact polystyrene/multi-walled carbon nanotube ternary nanocomposite using artificial neural network and genetic algorithm. Sci. Eng. Compos. Mater. 2013, 20, 265–276. [Google Scholar] [CrossRef]
  31. Ma, Q.L.; Zhang, C.X.; Wang, H.; Jiang, J.; Lv, W.B. Effect of temperature on the shear strength of carbon nanotube fiber/epoxy resin interface. J. Shanghai Univ. (Nat. Sci. Ed.) 2018, 24, 961–967. [Google Scholar]
  32. Sun, T.; Wu, Z.; Zhuo, Q.; Liu, X.; Wang, Z.; Fan, H. Microstructure and mechanical properties of aminated polystyrene spheres/epoxy polymer blends. Compos. Part A 2014, 66, 58–64. [Google Scholar] [CrossRef]
  33. Sha, Y.; Kramer, E.; Hahn, S.; Berglund, C.; Hui, C. Fracture Toughness and Failure Mechanisms of Epoxy/Rubber-Modified Polystyrene (HIPS) Interfaces Reinforced by Grafted Chains. Macromolecules 1996, 29, 4728–4736. [Google Scholar] [CrossRef]
  34. Gu, H.; Ma, C.; Liang, C.; Meng, X.; Gu, J.; Guo, Z. A low loading of grafted thermoplastic polystyrene strengthens and toughens transparent epoxy composites. J. Mater. Chem. C 2017, 5, 4275–4285. [Google Scholar] [CrossRef]
  35. Amaro, A.M.; Bernardo, L.; Pinto, D.G.; Lopes, S.; Rodrigues, J. The influence of curing agents in the impact properties of epoxy resin nanocomposites. Compos. Struct. 2017, 174, 26–32. [Google Scholar] [CrossRef]
Figure 1. Adhesive specimens and dimensions (unit: mm).
Applsci 13 03981 g001
Figure 2. Tensile specimens.
Applsci 13 03981 g002
Figure 3. Tensile performance test.
Applsci 13 03981 g003
Figure 4. Flexural performance test.
Applsci 13 03981 g004
Figure 5. Impact performance test.
Applsci 13 03981 g005
Figure 6. Tensile strength of specimens with different PS content.
Applsci 13 03981 g006
Figure 7. Elastic modulus of specimens with different PS content.
Applsci 13 03981 g007
Figure 8. Elongation at break of specimens with different PS content.
Applsci 13 03981 g008
Figure 9. Stress–strain curves of specimens with different PS content.
Applsci 13 03981 g009
Figure 10. Flexural strength of specimens with different PS content.
Applsci 13 03981 g010
Figure 11. Flexural modulus of specimens with different PS content.
Applsci 13 03981 g011
Figure 12. Load-deflection curves of specimens with different PS content.
Applsci 13 03981 g012
Figure 13. Impact strength of specimens with different PS content.
Applsci 13 03981 g013
Figure 14. Micromorphology of the tensile section of epoxy resin colloid: (a) tensile section of epoxy resin with PS mass fraction of 0 wt%; (b) tensile section of epoxy resin with PS mass fraction of 1.25 wt%; (c) tensile section of epoxy resin with PS mass fraction of 2.5 wt%; (d) tensile section of epoxy resin with PS mass fraction of 3.75 wt%; (e) tensile section of epoxy resin with PS mass fraction of 5 wt%.
Applsci 13 03981 g014
Table 1. Epoxy resin adhesive ratios.
Material SymbolMaterial NameBased on E51
1Bisphenol A type epoxy resin (E51)1
2Epoxy resin thinner10 wt%
3Fatty amines (triethylenetetramine)15 wt%
4Polyether amines30 wt%
5Trifunctional epoxy resin10 wt%
Note: the amount of all materials in the ratio is the weight fraction of bisphenol A-type epoxy resin.
Table 2. Tensile test data of epoxy resin colloid with different PS weight fractions.
SymbolPS Weight Fraction (wt%)Tensile Strength (MPa)Modulus of Elasticity (MPa)Elongation at
Break (%)
106212,0880.6037
21.259929,6410.3378
32.5011029,9450.4097
43.755512,7630.5494
554311,0690.39415
Table 3. Three-point bending test data of epoxy resin colloids with different PS weight fractions.
SymbolPS Weight Fraction (wt%)Flexural Strength (MPa)Flexural Modulus (MPa)Deflection (mm)
10105451522.722
21.25127594416.6787
32.50178691216.9621
43.75102479214.1701
5596419315.7122
Table 4. Impact test data of epoxy resin colloid with different PS weight fractions.
SymbolPS Weight Fraction (wt%)Absorbed Work (J)Toughness (J/m3)Impact Strength (KJ/m2)
100.1850.2074625
21.250.2185.4505405
32.500.2265.6495650
43.750.1634.0754075
550.1634.0754075
Disclaimer/Publisher’s Note: The statements, opinions and data contained in all publications are solely those of the individual author(s) and contributor(s) and not of MDPI and/or the editor(s). MDPI and/or the editor(s) disclaim responsibility for any injury to people or property resulting from any ideas, methods, instructions or products referred to in the content.