Abstract
Wearable devices have been used to assess and monitor volleyball performance. Given the diversity of technologies used and the variables measured, this study aimed to synthesize and review the wearable technology used to assess and monitor physical performance in volleyball players. A comprehensive search of published articles was performed in the following databases: Web of Science, PubMed, and Scopus, up to 23 October 2022. Studies with volleyball players of any age that used a wearable device to assess or monitor physical performance (e.g., jump height) were included. Nine studies conducted with male or female volleyball players were included. The participants’ age ranged between 16 and 32 years. Eight studies used Triaxial IMU, and one study used Vertec IMU. The performance analysis was based on vertical jump ability (n = 7) and overall volleyball performance (n = 2). Of the nine studies analyzed, 75% of the studies revealed blinding at the participant level and allocation concealment, and 95% reported a low risk of bias in the outcome assessment. This study shows that monitoring and assessing vertical jump ability through wearable devices is an increasing procedure in volleyball. Therefore, as jump height is a critical variable in athletic performance in volleyball, coaches and researchers might consider using wearable devices to assess and monitor physical performance changes in volleyball players.
1. Introduction
Volleyball is a complex modality with technical and tactical skills and different physical demands [1]. This sport is characterized by the absence of invasion of the opponent’s field of play, with no physical contact between players, making performance largely dependent on individual physical abilities and technical skill [2,3]. A volleyball game has a dynamic and explosive character, with constant vertical jumps, shots, and quick displacements.
Therefore, monitoring the training and competition load placed on athletes is fundamental, such that athletes are constantly being evaluated so that they can obtain the best possible performance [4]. According to the literature, performance analysis significantly improves the parameters that affect performance [5,6]. One of the most used methods to assess and monitor loads in training and competition is through wearable technologies [7]. Over the last few years, a new generation of wearable technologies has allowed coaches and researchers to quantify load through various devices such as accelerometers, gyroscopes, and magnetometers [8]. There have been improvements in wearable technologies so that sensors are cheaper, smaller, and do not interfere with the performance of athletes when collecting data. In addition, several methods of attaching devices are used to investigate these sports. Today’s sensors are attached to the players through straps, belts, and tapes and are used on different body parts (e.g., arms, waist, quadriceps) [9].
Most studies found in the literature were based on jump parameters (e.g., the number of jumps per game) [10]. In this regard, Bahr et al. [10] reported in their study that for two hours of play, the athletes needed to perform 12 h of jumps (count the number of jumps performed). However, although a review revealed that in the case of volleyball, the use of wearable technologies had become a constant in recent years during performance and training (e.g., software for video analysis or training), the literature is still scarce when summarizing the type of wearable measuring instruments. Therefore, this data collection is essential for informing researchers and coaches regarding the type of instruments most used and variables analyzed to assist in the prescription, evaluation, and monitoring of sports performance in volleyball.
Based on the above premise, this systematic review aimed to examine and summarize the current research about wearable technology used to assess and monitor physical performance in volleyball players and provide perspectives for future research.
2. Materials and Methods
The analysis of this review followed the Preferred Reporting Items for Systematic Reviews and Meta-Analysis (PRISMA) statement guidelines [11].
2.1. Search Strategy
The search was performed in all literature and three electronic databases: Web of Science, PubMed, and Scopus. The method used was the Boolean search, which limited the results found with operators, including AND/OR, only to studies that presented relevant key terms for the scope of the review. The terms used in the research were presented as (wearable* OR sensor*) AND “volleyball”. In addition, the articles covered in the investigation were published between January 1990 and October 2022.
2.2. Study Selection and Eligibility Criteria
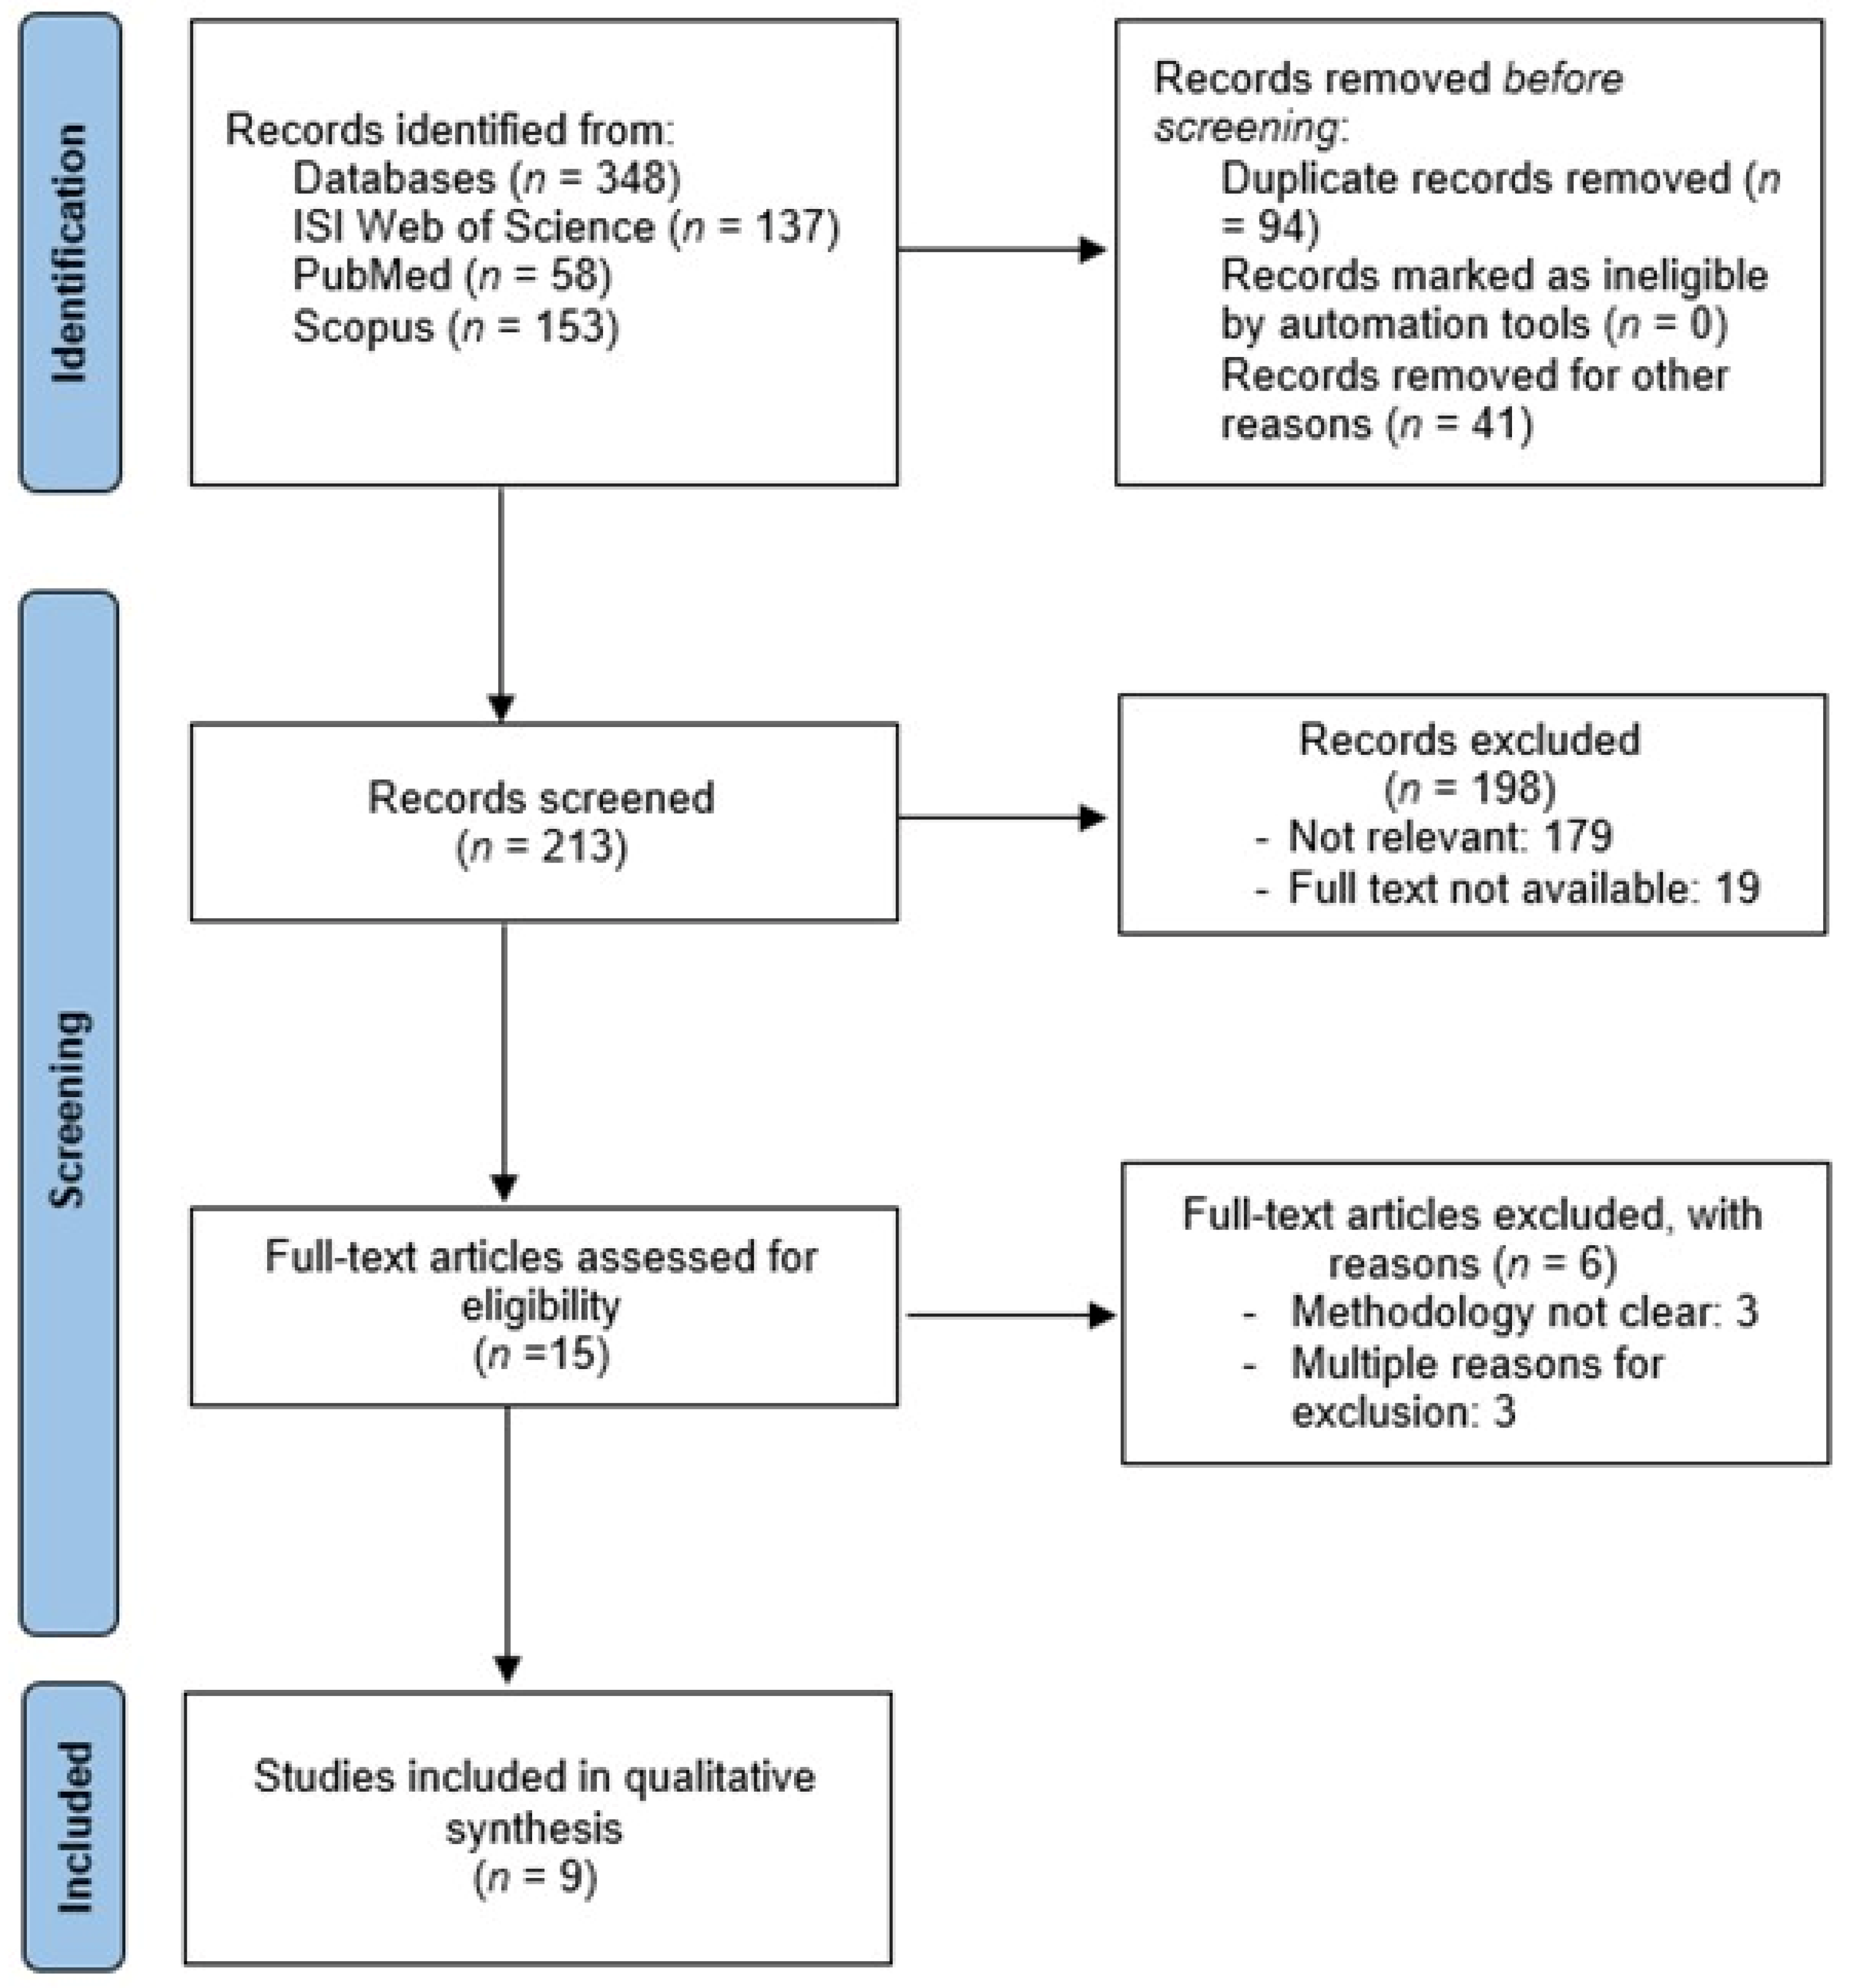
The initial search identified 348 potentially relevant articles. After removing duplicates, manual screening was performed according to the title and abstract. Those that were not related to the theme were excluded. Then, the final articles were thoroughly analyzed by two authors (A.C.S. and D.A.M.). The different phases of the systematic review were described using the PRISMA statement [12], which maps the number of records identified, included, and excluded and the reasons for exclusions. Studies were included or excluded using criteria defined using the PICOS (Population, Intervention, Comparison, and Outcome) principles [13]. Literature searches incorporated the following inclusion criteria: (i) male or female volleyball players of any age; (ii) studies that used wearable devices (e.g., accelerometers) to assess and/or monitor physical performance (e.g., jump height, dominant and non-dominant hand actions) in training and/or competition; (iii) experimental and observational studies. Exclusion criteria were: (i) studies with the older population or non-athletes; (ii) samples with a physical, chronic, neurological disability or a clinical diagnosis of attention deficit hyperactivity disorder. Following these criteria, 15 original research articles were evaluated in full text for eligibility. For the qualitative analysis, 9 articles were included. Theses, dissertations, and abstracts or conference proceedings were also excluded. Studies were in English and were published in a peer-reviewed journal. A detailed flowchart, including a systematic literature search, screening, eligibility, and enrollment, is shown in Figure 1.
Figure 1.
PRISMA study flow diagram.
2.3. Data Extraction and Synthesis
The articles that were included in this review were investigated to gather information related to sample size, age, wearable devices, measures and main results. Data extraction was achieved through two authors (A.C.S. and D.L.M.), and contradictories were decided by a third author (H.P.N).
2.4. Risk of Bias Assessment
Risk of bias assessment was conducted using the Cochrane Reviews method [14]. Two authors (A.C.S. and D.L.M.) assessed each study’s risk of bias using the following key criteria: random sequence generation, allocation concealment, blinding of outcome assessment, blinding participants and personnel, incomplete outcome data, selective reporting, and other bias; and in the case of inconsistencies between the two authors about which classification to assign to a given criterion, a third author evaluated the study (H.P.N.). The terms used in classifying the studies were low risk, high risk, or unclear risk. The Review Manager software (RevMan, The Nordic Cochrane Centre, Copenhagen, Denmark) version 5.4 was used to build the risk of bias graphs.
2.5. Quality of Studies Included in the Systematic Review
The quality of the articles covered in this systematic review was analyzed by two researchers (A.C.S. and M.C.M.) using the Physiotherapy Evidence Database (PEDro) scale, which relies on relevant criteria such as blind allocation, intention-to-treat analysis, and adequacy of follow-up. The Physiotherapy Evidence Database (PEDro) scale consists of 11 items and is reasoned on a Delphi list [15]. The first item of the PEDro scale (eligibility criteria) related to external validity is not generally used for the final score [16]. Any discrepancies were solved by a third evaluator (D.A.M.). Table 1 presents the individual assessment by the PEDro scale.

Table 1.
Study quality based on the Physiotherapy Evidence Database (PEDro) scale.
3. Results
3.1. Studies Description
Table 2 shows a detailed analysis of the nine included studies in this review. The studies included sample sizes of 8–128 participants (males and females) aged 16–32. The study participants in the review belonged to seven countries: two studies in Canada and Australia and one in the USA, Qatar, China, Netherlands, and Brazil. All studies used a cross-sectional design. Of the nine studies reviewed on physical performance in volleyball, 77.7% (n = 7) developed an intervention on vertical jumps, and 22.3% (n = 2) directed the intervention to the performance of volleyball players. Of the wearable technology mentioned in the articles, 77.8% (n = 7) of the studies focused on accelerometers, gyroscopes, and magnetometers, while 11.1% (n = 1) was based on Vertec, and 11.1% (n = 1) leaned on other wearable devices (i.e., wearable sensing device (WSD)).

Table 2.
Characteristics of the studies included in the review.
3.2. Results of the Risk of Bias Assessment
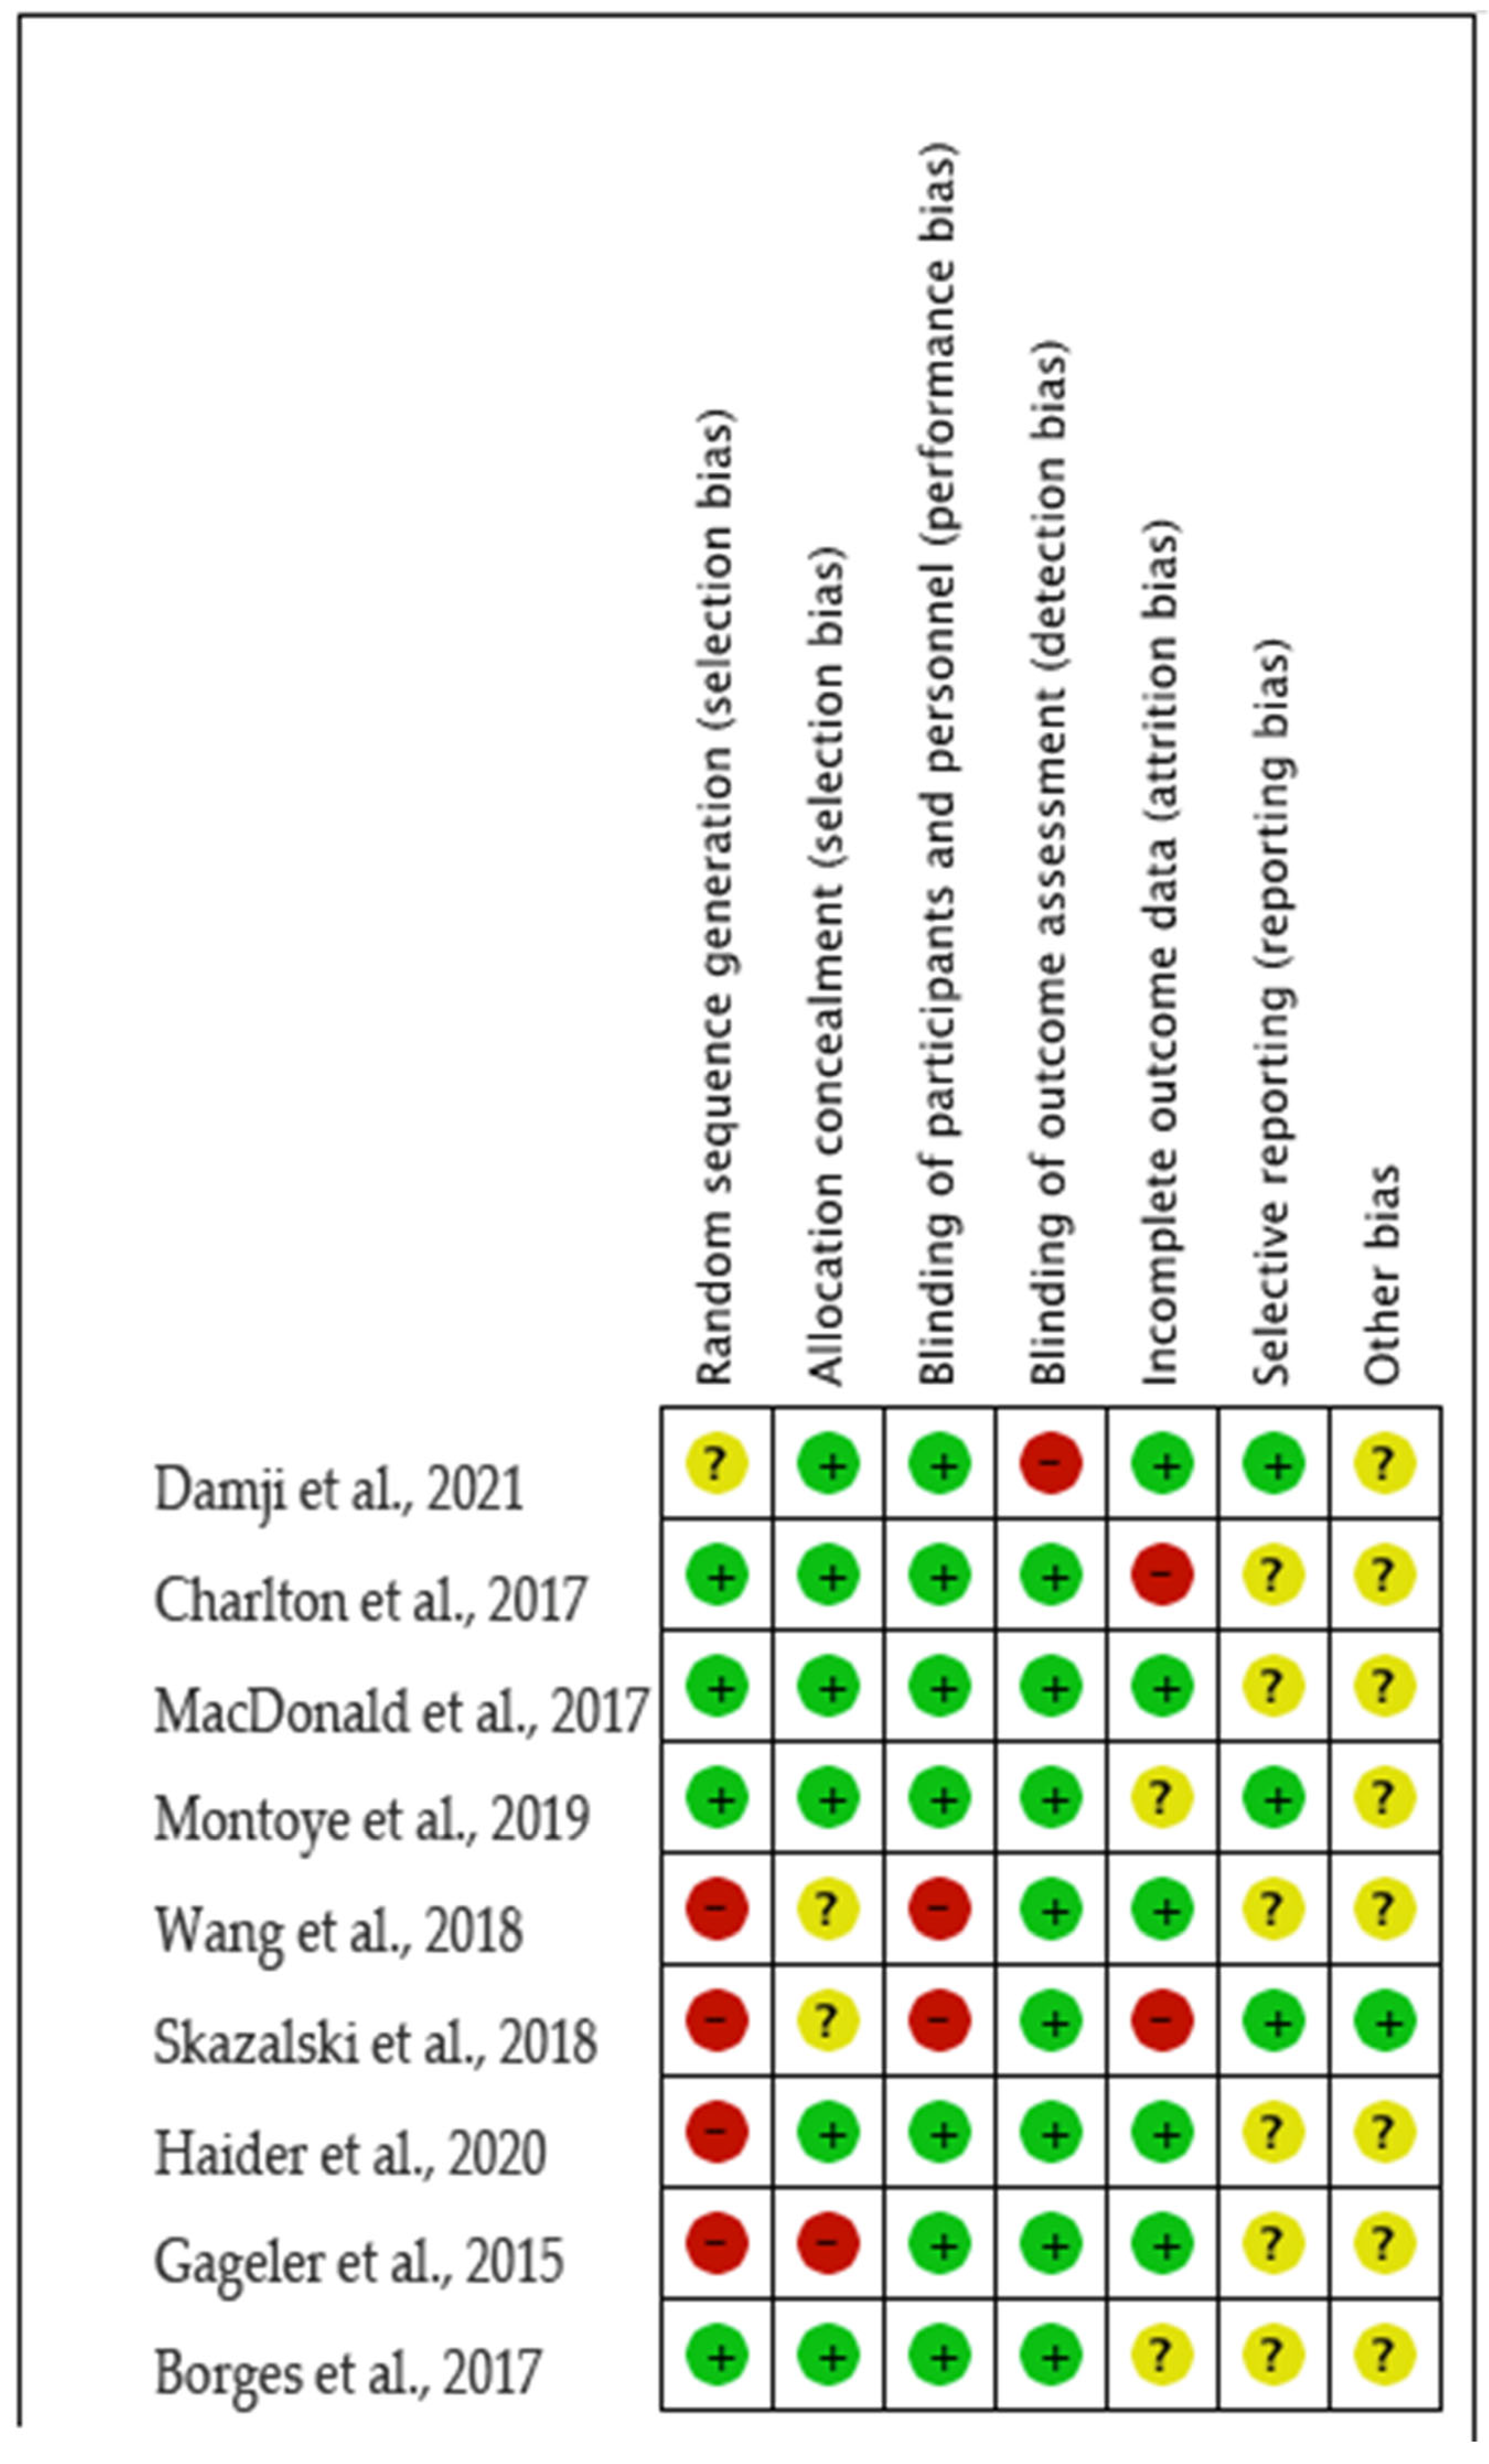
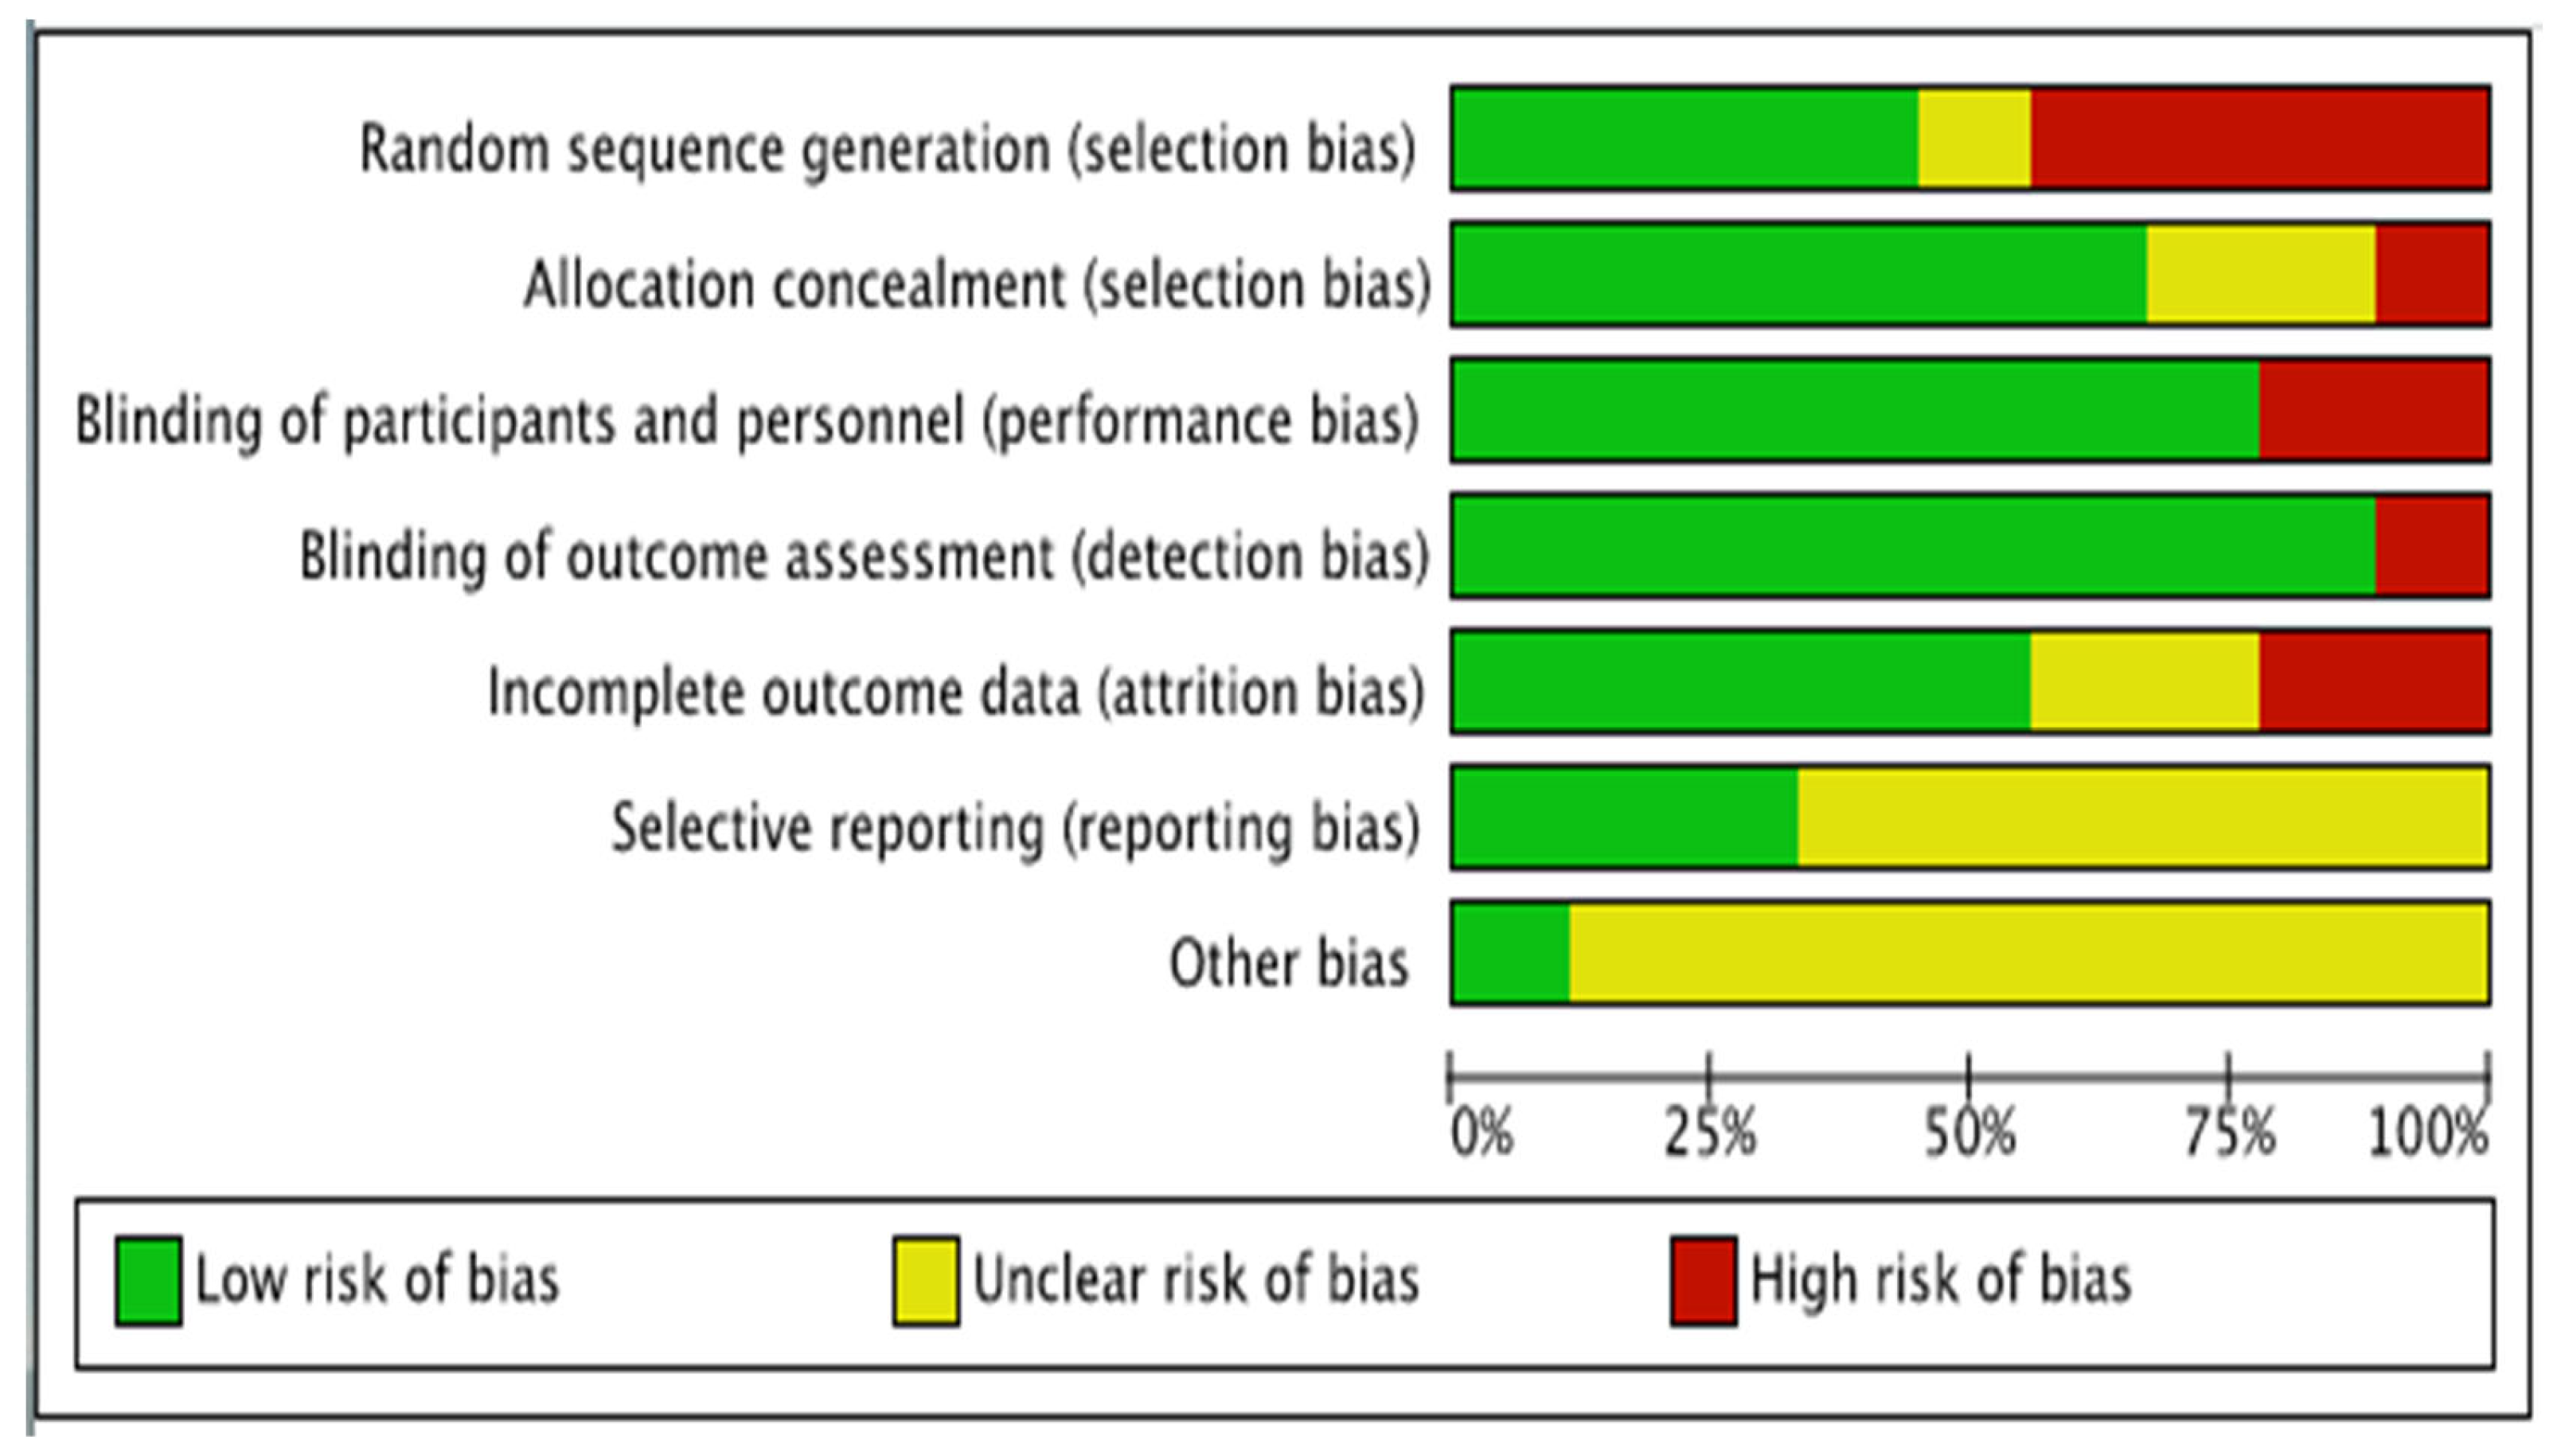
The allocation sequence generation item was identified as the lowest applied item (45%), as it does not provide enough detail. Some of the investigations analyzed in this review performed a blind design; however, few implemented a comparison between groups. About 75% of the studies revealed blinding at the participant level and allocation concealment; this information is related to whether blinding was provided, and 95% of the studies reported a low risk of bias in the blinding of the outcome assessment (detection bias), which confided one transparency in the methods and test employees (Figure 2 and Figure 3).
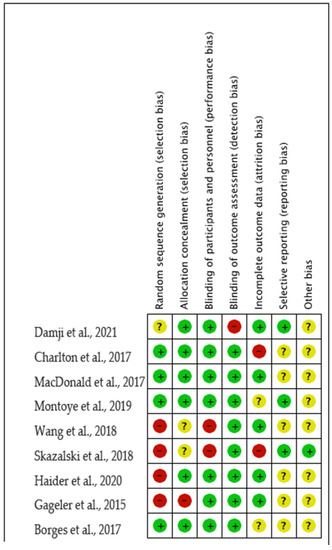
Figure 2.
Judgments about each risk-of-bias item for each included study [8,17,18,19,20,21,22,23,24].
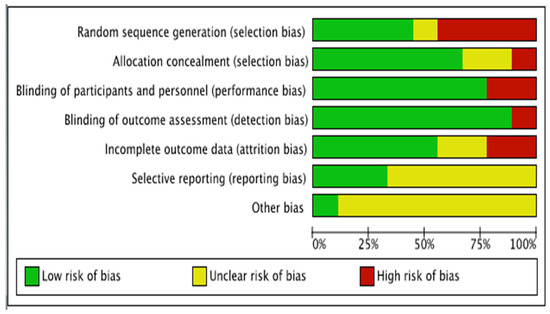
Figure 3.
Risk-of-bias items are presented as percentages across all included studies.
3.3. Main Results of the Included Studies
Of the nine studies included in the review, 77.7% focused on the assessment of jumping height using the VERT device (n = 5) [8,17,18,21,24], Blast Athletic (n = 1) [19], and GPSports (n = 1) [23] (Table 3).

Table 3.
Analysis of the main results of the studies included in the review.
Charlton et al. [17] and Skazalski et al. [21] reported a high correlation (r = 0.83–0.99) with other devices in jump height. In the study by Montoye and Mitrzyk [19], there was a moderate–high correlation between the standing vertical jump (r = 0.67) and the one-step vertical jump (r = 0.69).
MacDonald et al. [18] found improvements in maximal and submaximal height jumps of 1.3–3.8% and 3.1–5.1%, respectively.
Borges et al. [24] found a coefficient of variation in jump height in the attack zone of 7.8% and 7.9% during the block.
Damji et al. [8] reported a peak acceleration at the limits of agreement in jump height of −84.13% and 52.37%. Finally, Gageler et al. [23] reported 1201 video jumps during a training session. Of the 1201 jumps, it was found that 1144 (95%) of the jumps on the inertial data were performed correctly, 57 (5%) of the jumps were considered false negatives, and 54 (4%) false positives. It was also possible to verify that the flight time in the jumps was −0.015 ± 0.058 s.
The remaining 25% of the studies (n = 2) were based on other devices to assess the performance of volleyball players [20,22] (Table 3).
Haider et al. [22] highlighted, at the balanced level, an average unweighted recall (UAR) in the gyroscope and the barometer for the non-dominant hand (NDH) of 74.71% and 52.72%, respectively. In turn, for super-bagging, it was possible to observe that the UAR for the accelerometer was 80.91% (NDH) and 82.43% (dominant hand, DH); for the magnetometer, 76.80% (NDH) and 78.71% (DH); for the gyroscope, 75.11% (DH) and finally for the barometer, 59.06% (DH).
Finally, Wang et al. [20] reported that the average accuracy found in the device for the wrist was 94% in the difference between the level of volleyball players (amateur, sub-elite, and elite).
4. Discussion
The current review examined the research on wearable technology used to assess and monitor the physical performance of volleyball players and to provide perspectives for future research in volleyball players. The studies on this topic were relatively recent, with increased interest in the last two decades.
4.1. Main Findings
One of the actual results of this review is that monitoring and assessing vertical jump height is a general procedure used in wearable research. As jump height is a marker of athletic performance in volleyball [25,26,27], its accurate measurement in training and competition and the ability to track changes over time seems critical. Furthermore, as the vertical jump is a decisive factor in players’ performance [28], a top volleyball player must demonstrate enough strength to jump as high as possible, block, react quickly, attack the ball, and combine these actions with a high technical level [3]. Thus, vertical impulsion has become increasingly important, supporting specific motor skills and actions [29,30]. Specifically, the shot, the block, the pass in suspension, and the service in suspension are performed through vertical impulsion [31]. Therefore, as it becomes evident, evaluating the lower limbs’ muscle power is crucial in volleyball players, contributing to maximizing their performance [32].
The moderate to high correlations found in this review on the evaluated devices may be due to the homogeneity of testing a collegiate sample of volleyball players, while a more varied sample would likely result in a higher correlation [33]. The greater degree of underestimation may be due to the type of surface, the type of jump, or the specifications of the device itself [19].
In the following paragraphs, a brief mention of the different wearable devices used in volleyball research will be given.
4.2. VERT Wearable Jump Monitor
Five studies calculated jump height and counted the number of jumps using the VERT device, with samples recruited from elite volleyball players [8,17,18,21,24]. All studies assessed the validity and reliability of the VERT device. Four of the five studies in this review concluded that VERT has acceptable validity and reliability [17,18,21,24]. However, the study by MacDonald et al. [18] exposed that the VERT underestimates the maximum and submaximal jump height. In turn, the study by Skazalski et al. [19] showed that VERT might also not be appropriate to record lower jump heights or to measure maximum jump capacity when it is necessary to perform a precision jump.
When using a device such as the VERT, researchers must consider the acceptable level of potential error for the target population and the objective of the test. One in five of these studies came to different conclusions. McDonald [34] revealed that the jump heights between devices (VERT and a jump mat) differed by approximately 10 cm, a difference that could take a player between blocking the ball and scoring or failing to block the ball and missing the point (this being one of the critical actions to score a point in volleyball). The same author also concluded that the jump height measured by the VERT device is reliable but not valid; therefore, it is not recommended for practical use. Weaving et al. [35] argued that a single variable is not capable of capturing the complexity of a player’s/athlete’s training load and that the transmission of a large amount of data that are provided by these devices can overload them, being able to falsify the current state of the athlete and thus provide contradictory information about the performance/yield of the athlete, both in training and in-game.
VERT is a device that accurately measures the height and number of jumps athletes perform in their training or game. This equipment is used to monitor, verify and compare the performance of athletes in games and training. Data interpretation enables a greater understanding of the athlete’s behavior in games and training, training adjustments, injury reduction and prevention, and performance enhancement.
4.3. Blast Athletic Performance Monitor Device
The Blast Athletic performance device is a video capture technology that analyzes performance, jump, and sprint. Blast automatically detects the jumps and their respective heights, later synchronized via Bluetooth with the Blast Athletic mobile app on the smartphone for further analysis.
Only the study by Montoye and Mitrzyk [19] used the Blast Athletic performance monitor in its investigation. The authors reported that Blast underestimated jump height and had limited ability to detect changes up to 5.0 cm after a volleyball season. In addition, a relative correction was observed that reduced but did not eliminate the measurement error. However, researchers should consider that this device has only been validated in a single study; thus, further studies must confirm and validate the results against other devices.
4.4. Wearable Sensing Device
The wearable sensing device (WSD) is a device that aims to evaluate the skills of volleyball players using a MEMS-based IMU in its data collection. To the best of our knowledge, only one study used this device [20]. Wang et al. [20] reported that the WSD successfully recorded the inertial information of the volleyball players and stored all data on a MicroSD card for later analysis. Furthermore, with this device, it is possible to observe the data of all the IMU movements performed by the volleyball players and join them to a video system for further analysis, a handy tool for coaches/teachers and volleyball players. In addition, it was still possible to compile data on the different skill levels of volleyball players, which can be used by researchers/coaches/teachers in additional studies/research. Wang et al. [20] examined 15 features to characterize each data segment. The support vector machine, k-nearest neighbor, and naïve Bayes classifiers estimated the performance levels represented by the skill data. Comparisons of these classifiers indicated that support vector machines could achieve high accuracy (94%) in assessing skill levels, which can help coaches/teachers monitor players throughout the entire sporting season (training and game). Therefore, based on the results obtained in Wang et al. [18], it was possible to distinguish the different skill levels found in players using the WSD. Thus, we can conclude that this device can effectively estimate the skill level of a volleyball player, and a training program suitable for each player can improve the skill level and the effectiveness of the training or game. However, further studies are needed using this device to determine its reliability.
The WSD is a reliable device for differentiating the skill levels of different volleyball players; however, this device does not transmit wireless inertial sensor information for real-time data analysis, i.e., this system can only use machine learning to assess different levels of players from offline analytics.
4.5. GPSports Wearable Device
GPSports is a device that aims to evaluate the time and height of jumps of athletes/players/students. As far as we know, only one study used this device in volleyball [23], which observed that it could provide some valuable indicators for individual levels of workload and performance. Out of 1201, GPSport detected 1144 correct hops (95%) (i.e., analysis matching between video and inertial data). In addition, it was found that the measurement accuracy for the time of flight was −0.015 ± 0.058 s.
GPSports is a system with satisfactory performance in automatically detecting jumps in volleyball players and can drastically reduce the time required to obtain fundamental workload indicators. Therefore, this system provides a valuable addition to existing measures that require significant input of time or certain conditions that restrict applications in team court-based training.
4.6. Advantages and Disadvantages of Wearable Devices
Like most other equipment or software, wearable devices/sensors have advantages and disadvantages. The main advantage of these devices/sensors is that they can be easily used in any field environment (increasing the ecological validity); thus, coaches/teachers can obtain feedback (positive or negative) on the measured variables in real time and report the performance level of players/athletes/students, whether in training, game or class [36]. Furthermore, the data obtained through these devices/sensors can serve a multitude of purposes, always based on the objectives outlined at the beginning of each study, such as: (i) measuring, controlling, and increasing the physical performance of players/athletes/students; (ii) preventing possible injuries caused by excessive overload (in training or game); (iii) preventing the early return to training/game of injured players/athletes; (iv) monitoring and predicting the performance development of younger players/athletes. In addition, these devices/sensors are programmed/manufactured to operate in any sports environment (outdoor or indoor venues) because they are small, light, wireless, and easy to transport [36]. Finally, some devices/sensors have additional features, such as waterproofing or memorizing data at low temperatures [37,38].
These wearable devices/sensors also have disadvantages that researchers and coaches should consider when using. For example, Peake et al. [38] concluded in their study that only 5% of wearable technologies (mobile apps and equipment designed to provide biofeedback to players/athletes/students) used in various studies were officially validated through independent research and that the institutions/companies that manufacture this equipment should invest more to prove the reliability/validity/effectiveness of their products [38].
4.7. Study Limitations and Future Research
This systematic review presents some limitations that must be mentioned: (i) the small number of included studies, meaning that these results should not be generalized; (ii) most of the included studies were conducted with males, and thus, it would be interesting to have more studies with females to understand their differences and similarities; (iii) there is a lack of studies in volleyball using wearable devices to assess the performance in the upper limbs and on the specific movements of each player during training/competition; (iv) more studies are needed with other wearable technologies and new evaluation procedures to understand the sports performance of volleyball players better; (v) no study presented data related to the receiver operating characteristic (ROC) curve and the respective area under the curve. This analysis could give important insights regarding the discriminant ability of the devices to measure the different volleyball performance parameters, such as jump height. Therefore, based on these limitations, future research with wearable devices is needed to better understand jump characteristics during training and competition across different age groups, player levels, and sex. In addition, analyzing the players’ movements during training and competition should be studied using wearable devices.
5. Conclusions
Wearable devices can be essential instruments to assess and monitor the physical performance of volleyball players. The benefits of using these instruments to assess physical condition are known. However, there are few studies on the influence of these technologies in volleyball. Thus, further studies in volleyball using wearable devices seem necessary to determine their influence on capturing the incidence of injuries, the relationship between jumping load and injuries, and landing mechanics to subsequently intervene in the planning of a sporting season.
Author Contributions
Conceptualization and design, A.C.S. and D.L.M.; acquisition of data, A.C.S.; analysis or interpretation of data, A.C.S. and D.L.M.; software, A.C.S. and D.A.M.; validation, A.C.S., D.L.M. and M.C.M.; formal analysis, D.A.M. and M.C.M.; writing—original draft preparation, A.C.S., D.L.M., H.P.N. and M.C.M.; writing—review and editing, D.L.M., D.A.M., H.P.N. and M.C.M.; supervision, A.C.S.; final approval: A.C.S., D.L.M., D.A.M., H.P.N. and M.C.M. All authors have read and agreed to the published version of the manuscript.
Funding
This research was funded by Fundação para a Ciência e a Tecnologia (FCT), I.P., project number UIDB/04045/2020 and grant number SFRH/BD/147608/2019 (D.L.M.).
Institutional Review Board Statement
Not applicable.
Informed Consent Statement
Not applicable.
Data Availability Statement
Not applicable.
Conflicts of Interest
The authors declare no conflict of interest.
References
- Forthomme, B.; Croisier, J.-L.; Ciccarone, G.; Crielaard, J.-M.; Cloes, M. Factors Correlated with Volleyball Spike Velocity. Am. J. Sports Med. 2005, 33, 1513–1519. [Google Scholar] [CrossRef] [PubMed]
- Häkkinen, K. Changes in Physical Fitness Profile in Female Volleyball Players during the Competitive Season. J. Sports Med. Phys. Fitness 1993, 33, 223–232. [Google Scholar] [PubMed]
- Zhang, Y. An Investigation on the Anthropometry Profile and Its Relationship with Physical Performance of Elite Chinese Women Volleyball Players. Master’s Thesis, Southern Cross University, East Lismore, NSW, Australia, 2010. [Google Scholar]
- Bourdon, P.C.; Cardinale, M.; Murray, A.; Gastin, P.; Kellmann, M.; Varley, M.C.; Gabbett, T.J.; Coutts, A.J.; Burgess, D.J.; Gregson, W.; et al. Monitoring Athlete Training Loads: Consensus Statement. Int. J. Sports Physiol. Perform. 2017, 12, S2-161–S2-170. [Google Scholar] [CrossRef]
- Forte, D.; Altavilla, G. Preliminary Correlation between Anthropometric and Performance Data in Volleyball about the Transition Period. J. Phys. Educ. Sport 2018, 18, 1994–1998. [Google Scholar]
- Raiola, G.; Altavilla, G.; De Luca, C.; Di Tore, P.A. Analysis on Some Aspects of the Service in Volleyball. Sport Sci. 2016, 9, 74–77. [Google Scholar]
- Bartlett, J.D.; O’Connor, F.; Pitchford, N.; Torres-Ronda, L.; Robertson, S.J. Relationships Between Internal and External Training Load in Team-Sport Athletes: Evidence for an Individualized Approach. Int. J. Sports Physiol. Perform. 2017, 12, 230–234. [Google Scholar] [CrossRef] [PubMed]
- Damji, F.; MacDonald, K.; Hunt, M.A.; Taunton, J.; Scott, A. Using the VERT Wearable Device to Monitor Jumping Loads in Elite Volleyball Athletes. PLoS ONE 2021, 16, e0245299. [Google Scholar] [CrossRef]
- Camomilla, V.; Bergamini, E.; Fantozzi, S.; Vannozzi, G. Trends Supporting the In-Field Use of Wearable Inertial Sensors for Sport Performance Evaluation: A Systematic Review. Sensors 2018, 18, 873. [Google Scholar] [CrossRef]
- Bahr, M.A.; Bahr, R. Jump Frequency May Contribute to Risk of Jumper’s Knee: A Study of Interindividual and Sex Differences in a Total of 11,943 Jumps Video Recorded during Training and Matches in Young Elite Volleyball Players. Br. J. Sports Med. 2014, 48, 1322–1326. [Google Scholar] [CrossRef]
- Shamseer, L.; Moher, D.; Clarke, M.; Ghersi, D.; Liberati, A.; Petticrew, M.; Shekelle, P.; Stewart, L.A. Preferred Reporting Items for Systematic Review and Meta-Analysis Protocols (PRISMA-P) 2015: Elaboration and Explanation. BMJ 2015, 349, g7647. [Google Scholar] [CrossRef]
- Montoye, A.H.K.; Mitrzyk, J.R.; Molesky, M.J. Comparative Accuracy of a Wrist-Worn Activity Tracker and a Smart Shirt for Physical Activity Assessment. Meas. Phys. Educ. Exerc. Sci. 2017, 21, 201–211. [Google Scholar] [CrossRef]
- Adesida, Y.; Papi, E.; McGregor, A.H. Exploring the Role of Wearable Technology in Sport Kinematics and Kinetics: A Systematic Review. Sensors 2019, 19, 1597. [Google Scholar] [CrossRef]
- Higgins, J.P.; Green, S. Cochrane Handbook for Systematic Reviews of Interventions; Version 5.1.0; The Cochrane Collaboration, Ed.; The Cochrane Collaboration: London, UK, 2011. [Google Scholar]
- Verhagen, A.P.; de Vet, H.C.W.; de Bie, R.A.; Kessels, A.G.H.; Boers, M.; Bouter, L.M.; Knipschild, P.G. The Delphi List. J. Clin. Epidemiol. 1998, 51, 1235–1241. [Google Scholar] [CrossRef] [PubMed]
- Maher, C.G.; Sherrington, C.; Herbert, R.D.; Moseley, A.M.; Elkins, M. Reliability of the PEDro Scale for Rating Quality of Randomized Controlled Trials. Phys. Ther. 2003, 83, 713–721. [Google Scholar] [CrossRef] [PubMed]
- Charlton, P.C.; Kenneally-Dabrowski, C.; Sheppard, J.; Spratford, W. A Simple Method for Quantifying Jump Loads in Volleyball Athletes. J. Sci. Med. Sport 2017, 20, 241–245. [Google Scholar] [CrossRef] [PubMed]
- MacDonald, K.; Bahr, R.; Baltich, J.; Whittaker, J.L.; Meeuwisse, W.H. Validation of an Inertial Measurement Unit for the Measurement of Jump Count and Height. Phys. Ther. Sport 2017, 25, 15–19. [Google Scholar] [CrossRef] [PubMed]
- Montoye, A.H.K.; Mitrzyk, J. Validity of the Blast Athletic Performance Monitor for Assessing Vertical Jump Height in Female Volleyball Players. Meas. Phys. Educ. Exerc. Sci. 2019, 23, 99–109. [Google Scholar] [CrossRef]
- Wang, Y.; Zhao, Y.; Chan, R.H.M.; Li, W.J. Volleyball Skill Assessment Using a Single Wearable Micro Inertial Measurement Unit at Wrist. IEEE Access 2018, 6, 13758–13765. [Google Scholar] [CrossRef]
- Skazalski, C.; Whiteley, R.; Hansen, C.; Bahr, R. A Valid and Reliable Method to Measure Jump-Specific Training and Competition Load in Elite Volleyball Players. Scand. J. Med. Sci. Sports 2018, 28, 1578–1585. [Google Scholar] [CrossRef]
- Haider, F.; Salim, F.A.; Postma, D.B.W.; van Delden, R.; Reidsma, D.; van Beijnum, B.-J.; Luz, S. A Super-Bagging Method for Volleyball Action Recognition Using Wearable Sensors. Multimodal Technol. Interact. 2020, 4, 33. [Google Scholar] [CrossRef]
- Gageler, H.W.; Wearing, S.; James, A.D. Automatic Jump Detection Method for Athlete Monitoring and Performance in Volleyball. Int. J. Perform. Anal. Sport 2015, 15, 284–296. [Google Scholar] [CrossRef]
- Borges, T.O.; Moreira, A.; Bacchi, R.; Finotti, R.L.; Ramos, M.; Lopes, C.R.; Aoki, M.S. Validation of the VERT Wearable Jump Monitor Device in Elite Youth Volleyball Players. Biol. Sport 2017, 3, 239–242. [Google Scholar] [CrossRef] [PubMed]
- Sattler, T.; Sekulic, D.; Hadzic, V.; Uljevic, O.; Dervisevic, E. Vertical Jumping Tests in Volleyball. J. Strength Cond. Res. 2012, 26, 1532–1538. [Google Scholar] [CrossRef] [PubMed]
- Sattler, T.; Hadžić, V.; Dervišević, E.; Markovic, G. Vertical Jump Performance of Professional Male and Female Volleyball Players. J. Strength Cond. Res. 2015, 29, 1486–1493. [Google Scholar] [CrossRef] [PubMed]
- Ziv, G.; Lidor, R. Vertical Jump in Female and Male Volleyball Players: A Review of Observational and Experimental Studies. Scand. J. Med. Sci. Sports 2010, 20, 556–567. [Google Scholar] [CrossRef]
- Garganta, R.; Maia, J.; Janeira, M.A. Estudo Discriminatório Entre Atletas de Voleibol do Sexo Feminino Com Base em Testes Motores Específicos; Universidade do Porto: Porto, Portugal, 1993. [Google Scholar]
- Kitamura, K.; Pereira, L.A.; Kobal, R.; Abad, C.C.C.; Finotti, R.; Nakamura, F.Y.; Loturco, I. Loaded and Unloaded Jump Performance of Top-Level Volleyball Players from Different Age Categories. Biol. Sport 2017, 3, 273–278. [Google Scholar] [CrossRef]
- Villa, J.; García-López, J. Tests de Salto Vertical (I): Aspectos Funcionales. Rev. Digit. Rend. Deport. 2003, 6, 1–14. [Google Scholar]
- Sheppard, J.M.; Gabbett, T.J.; Stanganelli, L.-C.R. An Analysis of Playing Positions in Elite Men’s Volleyball: Considerations for Competition Demands and Physiologic Characteristics. J. Strength Cond. Res. 2009, 23, 1858–1866. [Google Scholar] [CrossRef]
- Adams, K.; O’Shea, J.P.; O’Shea, K.L.; Climstein, M. The Effect of Six Weeks of Squat, Plyometric and Squat-Plyometric Training on Power Production. J. Strength Cond. Res. 1992, 6, 36–41. [Google Scholar] [CrossRef]
- Goodwin, L.D.; Leech, N.L. Understanding Correlation: Factors That Affect the Size of R. J. Exp. Educ. 2006, 74, 249–266. [Google Scholar] [CrossRef]
- McDonald, T. Testing VERTTM Accelerometer to Identify Validity and Reliability When Compared to Switch Mat. Bachelor’s Thesis, East Tennessee State University, Johnson City, TN, USA, 2017. [Google Scholar]
- Weaving, D.; Jones, B.; Till, K.; Abt, G.; Beggs, C. The Case for Adopting a Multivariate Approach to Optimize Training Load Quantification in Team Sports. Front. Physiol. 2017, 8, 1024. [Google Scholar] [CrossRef] [PubMed]
- Bächlin, M.; Tröster, G. Swimming Performance and Technique Evaluation with Wearable Acceleration Sensors. Pervasive Mob. Comput. 2012, 8, 68–81. [Google Scholar] [CrossRef]
- Krüger, A.; Edelmann-Nusser, J. Biomechanical Analysis in Freestyle Snowboarding: Application of a Full-Body Inertial Measurement System and a Bilateral Insole Measurement System. Sport. Technol. 2009, 2, 17–23. [Google Scholar] [CrossRef]
- Peake, J.M.; Kerr, G.; Sullivan, J.P. A Critical Review of Consumer Wearables, Mobile Applications, and Equipment for Providing Biofeedback, Monitoring Stress, and Sleep in Physically Active Populations. Front. Physiol. 2018, 9, 743. [Google Scholar] [CrossRef] [PubMed]
Disclaimer/Publisher’s Note: The statements, opinions and data contained in all publications are solely those of the individual author(s) and contributor(s) and not of MDPI and/or the editor(s). MDPI and/or the editor(s) disclaim responsibility for any injury to people or property resulting from any ideas, methods, instructions or products referred to in the content. |
© 2023 by the authors. Licensee MDPI, Basel, Switzerland. This article is an open access article distributed under the terms and conditions of the Creative Commons Attribution (CC BY) license (https://creativecommons.org/licenses/by/4.0/).

