Article

Thermographic Assessment of Skin Temperature Changes following Partial Body Cryostimulation (PBC) in Football Players

1
Department of Functional Diagnostics and Physical Medicine, Faculty of Health Sciences, Pomeranian Medical University, 71-210 Szczecin, Poland
2
Department of Humanities and Occupational Therapy, Pomeranian Medical University, 70-103 Szczecin, Poland
*
Author to whom correspondence should be addressed.
Appl. Sci. 2023, 13(7), 4123; https://doi.org/10.3390/app13074123
Submission received: 27 January 2023 / Revised: 12 March 2023 / Accepted: 15 March 2023 / Published: 24 March 2023
(This article belongs to the Special Issue Advances in Sport Injury Prevention)

Abstract

:
Infrared thermography has been widely used to visualize skin temperature in human science. One of the important areas of its application is the analysis of changes in body surface temperature as a result of the use of physical medicine treatments in post-exercise regeneration in sports. The aim of this study was to evaluate the cutaneous temperature response in selected body areas and the range of chosen markers of skeletal muscle damage to partial body cryostimulation (PBC) as a method of post-match regeneration. Fourteen football players underwent PBC after a match. Thermographic analyses of anterior and posterior surfaces of the body were performed before and immediately after the treatment. Before, directly after, and 24, 48, and 72 h after the match serum creatine kinase (CK), lactate dehydrogenase (LDH), and aspartate aminotransferase (AST) were evaluated. After PBC, a significant (p ≤ 0.001) decrease in skin temperature (Tsk) in all analyzed areas occurred. The greatest drop was observed in the areas of the thighs (∆ = 9.96–11.02 °C); the smallest temperature drop occurred in the areas of the upper and lower part of the back (∆ = 6.18−6.70 °C) and in the area of the chest (∆ = 6.80 °C). The most significant positive relationships between the magnitude of change in Tsk of the anterior and posterior surfaces of the thighs, body fat, and systolic and diastolic blood pressure have been shown. There were no significant differences between temperatures in selected areas in relation to the sides of the body, both before and after PBC. The range of temperature changes confirms the stimulating effect of PBC. The course of changes in the concentration of CK and AST indicates a potentially beneficial effect of PBC on the course of post-workout regeneration, without side effects. Maintaining a constant body temperature during PBC comes at the expense of thermoregulatory mechanisms leading to a lower body surface temperature.

1. Introduction

Participation in football match-play leads to acute and transient subjective, biochemical, metabolic, and physical disturbances in players over subsequent hours and days [1,2,3,4,5]. The physical demands of football can induce post-exercise muscle damage, leading to strength and power decrements, increased levels of intramuscular enzymes, a marked inflammatory response, and associated upregulated oxidative stress during recovery [5]. Maximizing the performance capacity of an athlete, despite the matter of training, also depends on the right balance between training and complete recovery, defined as the return to homeostasis following metabolic and inflammatory challenges and muscle damage induced by exercise training sessions [6,7,8]. The recovery process can be categorized in three terms: immediate recovery between exertions, short-term recovery between repeats, and training recovery between workouts. The choice of recovery techniques is of utmost importance to ensure that the athlete is refreshed and ready to take the effort during the next training session [9].
The purpose of systemic cryotherapy/cryostimulation is the reduction on the body tissue temperature for therapeutic or recovery purposes [10]. The main idea of cryotherapy is to deprive the tissues of as much heat as possible in the shortest possible time; a recently popular technique for using this method in competitive sports, both in the process of post-exercise regeneration and in the entire training cycle, has become whole-body cryotherapy (WBC) and partial-body cryotherapy (PBC) [11]. Although the exact mechanisms of the systemic action of cold are not fully explained, the effects of WBC and PBC on the human body include lowering the temperature of warmed tissues, reducing inflammation, analgesic effects and increasing the body’s ability to regenerate after exercise by reducing enzyme activity, acceleration of metabolism, and reduction of protein degradation after ischaemia induced by physical activity [12,13,14,15,16,17]. It is therefore not surprising that post-exercise cooling interventions, in particular WBC or PBC, are a very common regeneration strategy used by professional football teams. Currently, cryotherapy modalities are widely used in the treatment of subjective (DOMS-delayed onset muscle soreness) and objective (strength) recovery characteristics [18,19,20].
There are only single published randomized controlled trials evaluating the effects of WBC on post-exercise recovery in athletes [13,21]. Bouzigon et al. [22], based on systematic review on the effects of cryostimulation on the physical recovery, confirm the interest in the use of the WBC in sport field but at the same time point out the need for further research to confirm the benefits and optimize the cryostimulation procedure.
The monitoring of recovery needs is considered essential during football tournaments, with bloodborne fatigue markers being objective and easy-to-measure indicators of recovery processes. Among them, enzymes such as creatine kinase (CK), lactate dehydrogenase (LDH), or aspartate aminotransferase (AST) stand out as frequently analyzed indicator markers [23,24]. A significant increase in muscle damage markers has been described immediately after football matches and throughout the post-match recovery period up to 72 h [25,26,27,28]. There have been numerous studies to assess muscle damage after various loads with physical effort based on changes in the muscle damage markers [4,29,30]; however, studies evaluating markers of muscle damage during post-exercise recovery with PBC are still lacking. When comparing WBC with PBC, it should be noted that PBC uses medium-sized mobile devices, the so-called cryocabin, and the cooling agent during the treatment is liquid nitrogen, while WBC uses larger stationary devices (cryochamber), which are cooled, depending on the cooling system, with cold air, nitrogen, or a cooling compressor system [10]. Therefore, PBC is more often used in field work with sports teams, and WBC is more often used in rehabilitation or sports centers [10,31]. Although these techniques are becoming more and more popular, there are still few studies assessing the range of changes in the skin temperature of the body of players, which is necessary to trigger for the reflex thermoregulatory reactions. The production and accumulation of heat in skeletal muscles during prolonged dynamic exercise leads to the dissipation of heat through the bloodstream and therefore an increase in the temperature of the tissues [32]. For this reason, infrared thermography (IRT) has become one of the quantitative methods of assessing training effects that is increasingly used in sports medicine. IRT is a safe, non-invasive, and low-cost technique that allows for the rapid and non-contact recording of the irradiated infrared energy that is released from the body. Therefore, IRT allows you to carry out multiple, repeatable measurements without exposing the patient to unpleasant feelings [33,34,35,36,37,38,39,40,41,42,43,44]. The most important areas of application for infrared thermography in sports are: the detection of injury in sports medicine, exercise-associated thermographic changes, the relationship between skin temperature and muscle activation, the assessment of the symmetry/asymmetry of the temperature distribution of selected areas of the body after physical effort, thermal analysis, and the performance properties of thermal protective clothing [45]. Both static and dynamic thermography are increasingly used to assess the temperature of the skin areas over the selected muscle groups participating in symmetrical or asymmetric exercises [41,42,46,47,48]. IRT is also a good tool for assessing the body’s thermal response to physical stimuli applied to it, including extremely low temperatures [49].
PBC is based on a direct contact between participant and nitrogen. The interaction between the body and cooling agent occurs principally at the skin. The skin temperature may therefore reflect the balance of heat loss and heat produced by metabolically active tissues. Therefore, the main goal of this study was to evaluate the effect of PBC performed immediately after football match as a method of post-exercise regeneration on the skin temperature (Tsk) changes in selected body areas. The following should be mentioned as supplementary objectives: (i) whether and to what extent selected areas of the players’ body differ in skin temperature and whether there is symmetry of temperature distribution between the right and left sides of the body before and after the PBC, (ii) in which areas of the body there was the greatest and the smallest decrease in temperature in response to the applied PBC effect, and (iii) whether there are relationships between the thermal response and individual characteristics of the participants, such as blood pressure, BMI value, content of adipose tissue, muscle tissue, and water as well as the post-match blood concentration of the LA, CK, LDH, and AST. Additionally, the dynamics of changes in muscle damage markers during 72 h of post-match regeneration in football players was assessed.

2. Materials and Methods

2.1. Study Group

Fourteen male football players (26 ± 6 years; 181.5 ± 4.5 cm; 77.35 ± 5.1 kg; BMI 23.5 ± 1.1 kg/m2) from a fourth football league club in Poland volunteered to participate in the study. All football players were made aware of experimental procedures and provided informed consent prior to taking part in the experiment. The inclusion criteria were informed consent to participate in research, participating in a match for at least 45 min, no contraindications to PBC, and no previous participation in any form of cryotherapy. The goalkeeper was excluded from the study.
According to the Declaration of Helsinki, each participant signed a written informed consent before taking part in the study. The study was also approved by the local Ethics Committee of the Pomeranian Medical University (Ref. No. KB-0012/79/19)

2.2. Procedures

The tests were carried out during the autumn league games. The participants were instructed on how to prepare for the study in accordance with the Thermographic Imaging in Sports and Exercise Medicine (TISEM) guidelines [50]. Before the football match, each of the study participants was subjected to anthropometric evaluation, taking into account body height and body weight using a mechanical column scale (Seca 711/220) with a stadiometer. Moreover, the body mass index (BMI) was calculated [51]. In addition, a detailed analysis of the football players’ body composition was performed with the Bioelectrical Impedance Analysis (BIA) method using the ACCUNIQ BC380 analyzer (SELVAS Healthcare, Daejeon, Republic of Korea, taking into account the following parameters that can be estimated: body fat percentage and absolute body fat content (FAT [%] and FAT [kg]), free fat mass (FFM [kg]), muscle mass (MM [kg]), total body water percentage and total (absolute) body water content (TBW [%] and TBW [kg]), and bone mass (BM [kg]). Systolic blood pressure (SBP), diastolic blood pressure (DBP), and heart rate (HR) were measured with a clinically validated automatic blood pressure monitor (OMRON M6 Comfort (HEM-7321-E) Healthcare, Kyoto, Japan).
The match lasted 90 min with a 15 min break. The average playing time of all football players was 73.84 ± 22.47 min. Each of the tested football players participated in the match for at least 45 min, and each player participated in a standard pre-match warm-up.

2.2.1. Blood Sampling and Analysis

Venous blood samples were collected by qualified medical personnel from the antecubital vein using Vacutainer tubes (Sarstedt, Nümbrecht, Germany), before (pre) and directly after the match (post) and during following days: 24 h (24 h post), 48 h (48 h post), and 72 h (72 h post) after the match, respectively. Except for the match day, blood samples were always obtained after overnight fasting, between 7:00 and 8:30 a.m., after a 10 min rest in the sitting position, from the antecubital vein, and into dry tubes (7 mL) in order to obtain blood serum. Each time after collection, the blood was left at room temperature for 15–30 min to clot. The blood was then centrifuged (1000× g, 10 min, 4 °C; Universal 320 R, Hettich Lab Technology, Tuttlingen, Germany). The serum was then aliquoted and immediately deep-frozen at −80 °C until analysis. In blood serum, lactate (LA), CK, LDH, and AST concentrations were determined with the enzymatic colorimetric method (LA only pre and post). Then, the football players started the pre-match warm-up and the main play.

2.2.2. Cryostimulation Procedure

Immediately after the match, after the second venous blood sampling, the football players underwent partial body cryostimulation. PBC was carried out using the mobile cryogenic chamber in an open system (Maximus s.c., Wołów, Poland). It was a model of a cryochamber prepared and used during the European Football Championship Euro 2016, as an element of supporting biological regeneration of the Polish national team football players. This solution allows the chamber to be placed at any location, near the training center or hotel base. The chamber is able to accommodate up to five individuals, covering a body without the head, which improves the quality and cold tolerance by the athletes. In addition, a great advantage of this solution is the efficiency of chamber cooling process and its ability to maintain constant temperature at any treatment area. The duration of cryostimulation was 3 min at a temperature of −140 °C. During the cryostimulation procedure, the subjects were dressed only in shorts, socks, wooden clogs, and gloves. The subjects were instructed to march in place during the exposure period. In the case of an open space cryochamber, it is not necessary to cover the respiratory tract and the auricles, because the treatment area covers the body maximally to the upper chest line of the body, defined by the highest points on the manubrium of the sternum.

2.2.3. Thermographic Measurements

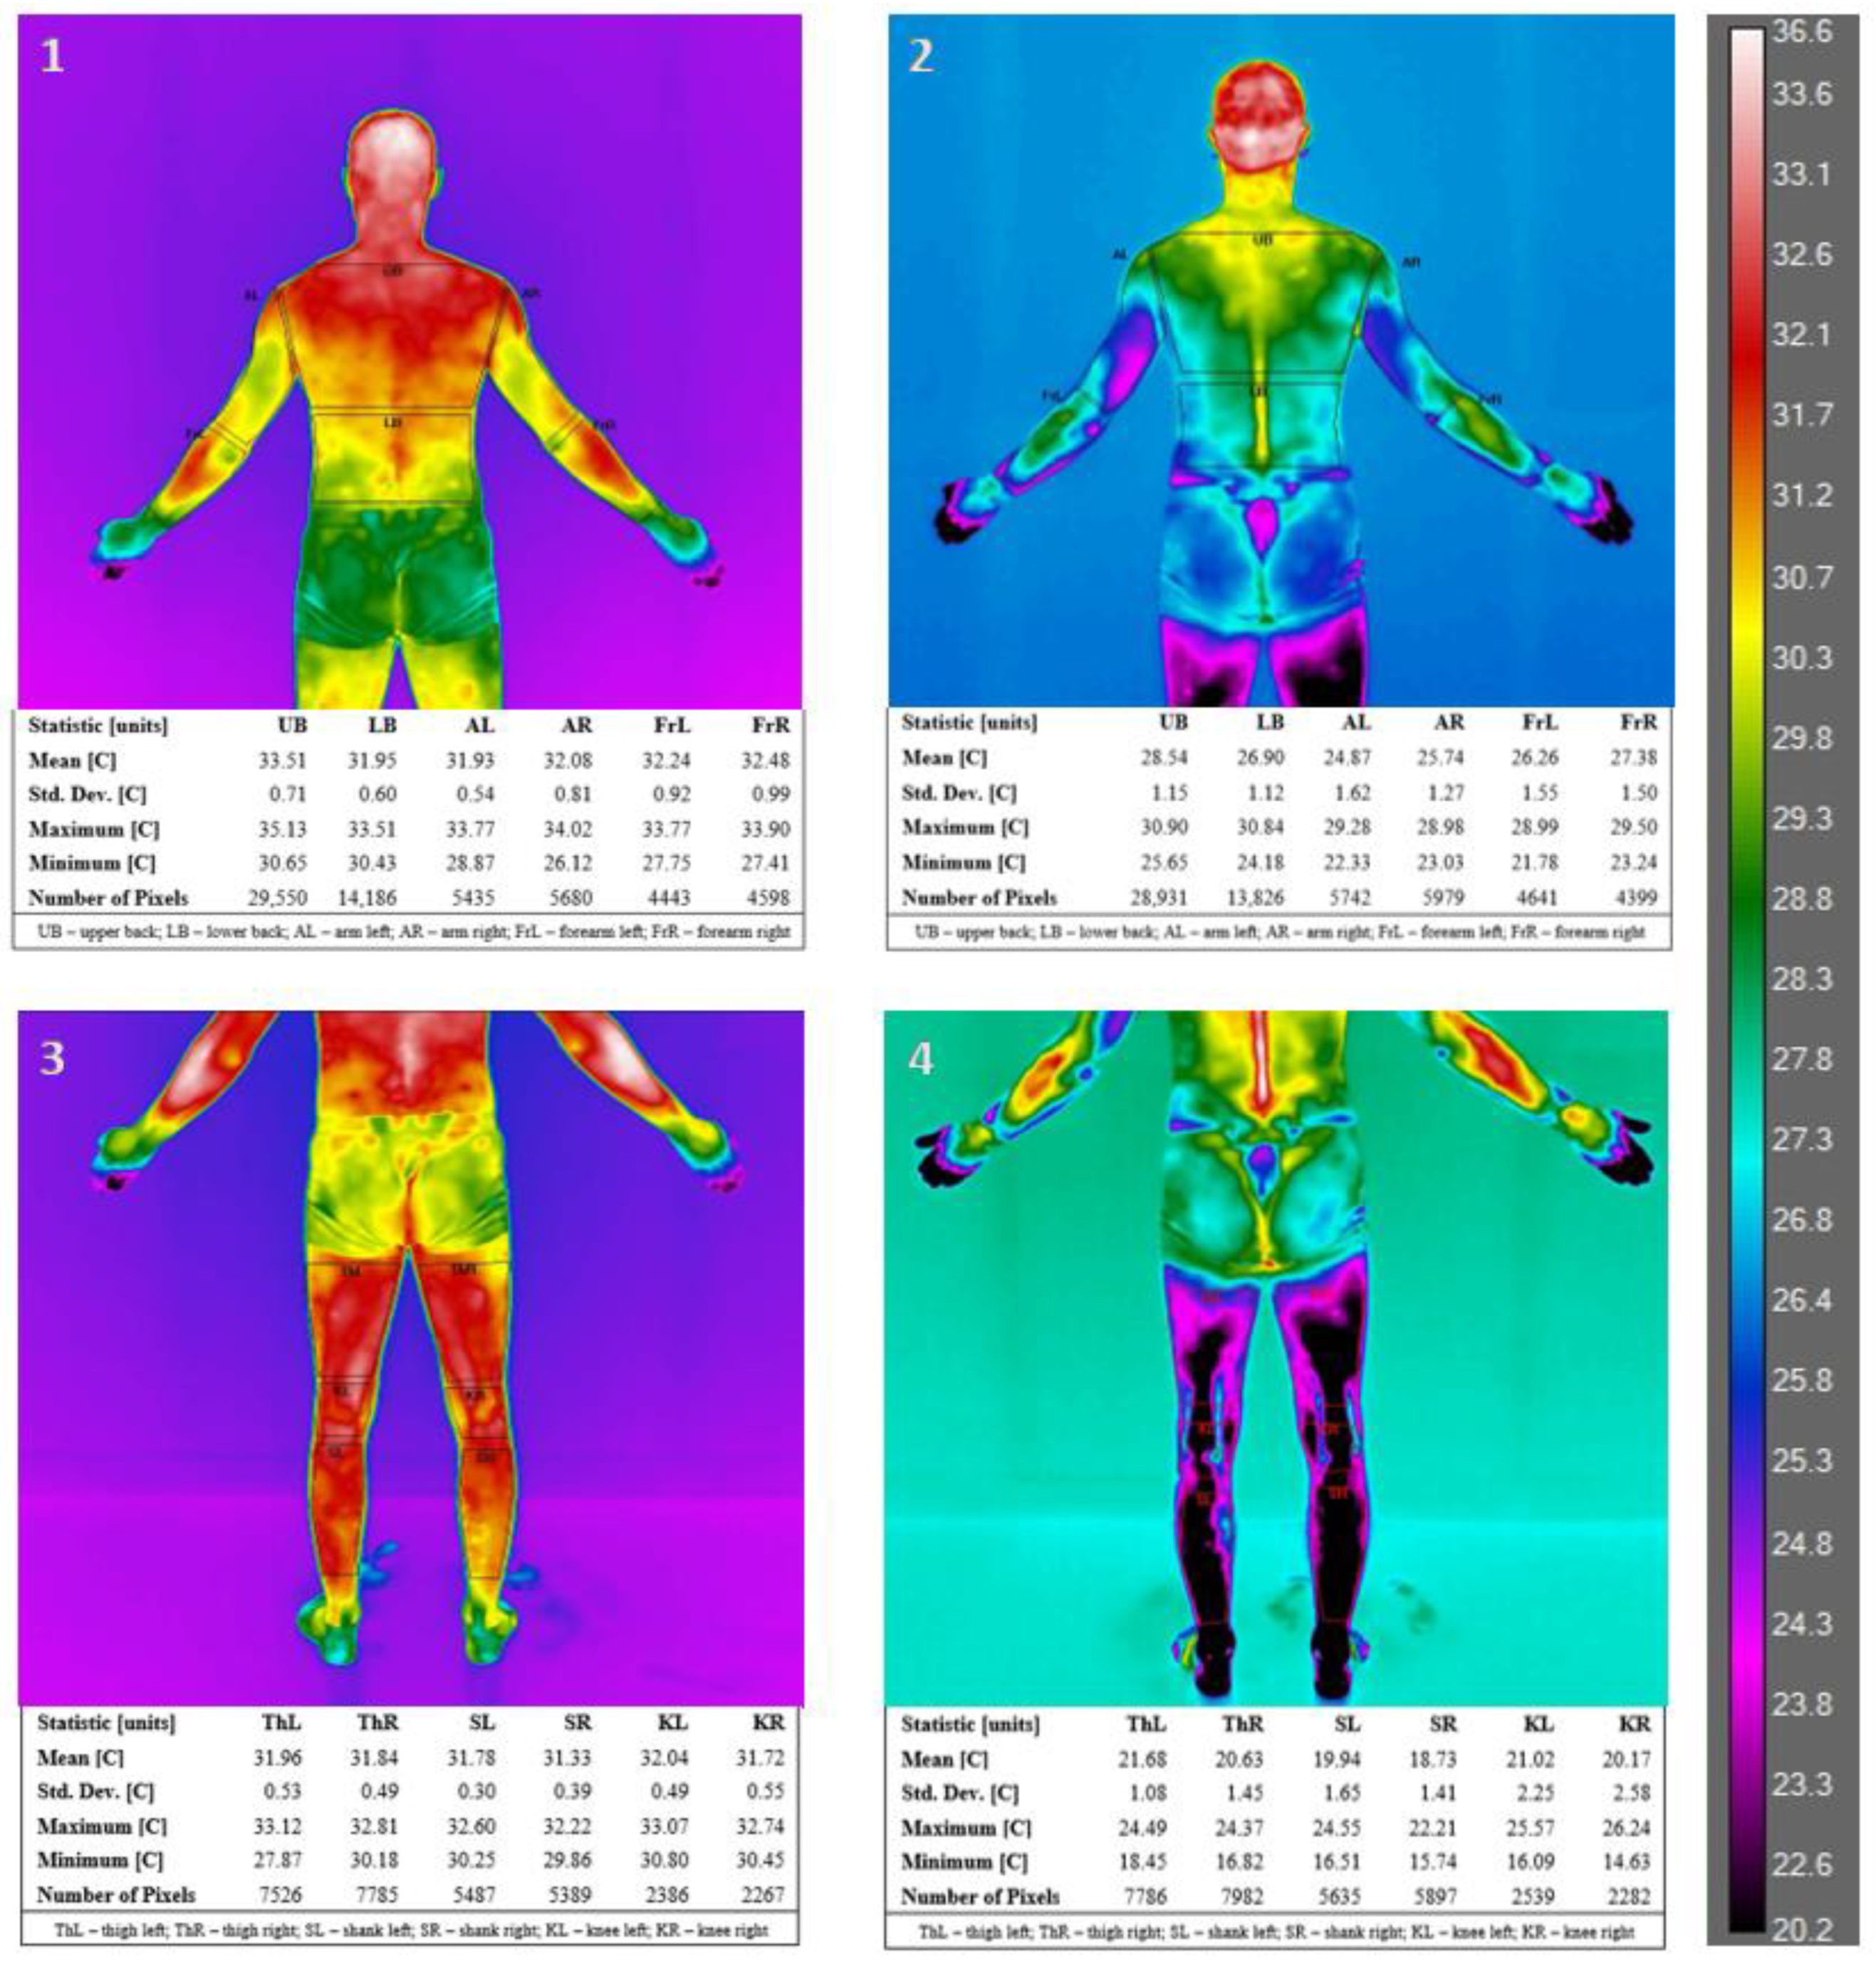
Immediately before and after the PBC procedure, football players were subjected to 4 thermal imaging scans in anatomical position in the Anterior–Posterior (AP) projections: frontal plane front upper body, frontal plane front lower body, frontal plane back upper body, and frontal plane back lower body (Figure 1 and Figure 2). Each of the thermograms taken was subjected to a detailed analysis using FLIR ResearchIR 4 Software, USA, that enabled the determination of specific, symmetrical areas of the body on thermograms, which were the basis for assessing the temperature distribution. Subsequently, the following areas of the right and left side of the body were selected for a detailed analysis: UL—upper limb, LL—lower limb, A—arm, Fr—forearm, H—hand, Th—thigh, K—knee, S—shank, Ch—chest, Ab—abdomen, UB—upper back, and LB—lower back. A FLIR T1030sc High Performance HandHeld Thermal Imaging Camera with a detector resolution of 1024 × 768 (786,432 pixels) and accuracy of ±1 °C (±1.8° F) or ±1% at 25 °C for temperatures between 5 °C and 150 °C was used. Using the FLIR ResearchIR 4 Software V. 4.30.0, the parameters were the minimum temperature (Tmin), the maximum temperature (Tmax), and the average temperature (Tmean), and these parameters of the selected body areas on recorded images were calculated. The mean temperature in the region of interest (ROI), marked as Tmean, was used to analyze the results. The tests were performed in accordance with the standards of the European Association of Thermology [52], under thermal comfort conditions after 15 min of acclimation. The subjects were positioned so that the optical axis of the lens was normal to the frontal plane, thus ensuring the optimal measurement angle. The skin emissivity was set to 0.98. The camera was placed onto a tripod. Thermograms were taken in a room with a humidity of 50% and a temperature of 23 ± 1 °C, from a distance of 1.5 m, which meets the criteria for thermal imaging tests. Air temperature and relative humidity were monitored on an ongoing basis by a thermohygrometer (digital thermo-hygrometer 30.5023, TFA Dostmann, Wertheim-Reicholzheim, Germany) and taken into account when configuring the thermal imaging camera.

2.3. Statistical Analysis

The results obtained during the research were analyzed statistically (STATISTICA StatSoft, Inc. USA 2014; version 12. StatSoft Poland). The normality of the data distribution was verified with the Shapiro–Wilk test. Due to the normal distribution, the characteristics of the examined variables were presented in the form of means and standard deviation (Mean ± SD). To estimate the significance of differences in the temperature of selected body surface areas and between contralateral areas in football players, Student’s t-test was used. To test differences in biochemical parameters between different time points, a one-way ANOVA with repeated measures was used with Tukey’s HSD post hoc tests. Correlations between the values of the skin temperatures of selected body areas as well as between temperature changes after PBC and other analyzed variables (blood pressure, BMI, FAT, FAT%, MM, TBW, and the post-match blood concentration of the LA, CK, LDH, and AST) were estimated by calculating the Pearson correlation coefficient. The p value < 0.05 was considered statistically significant.

3. Results

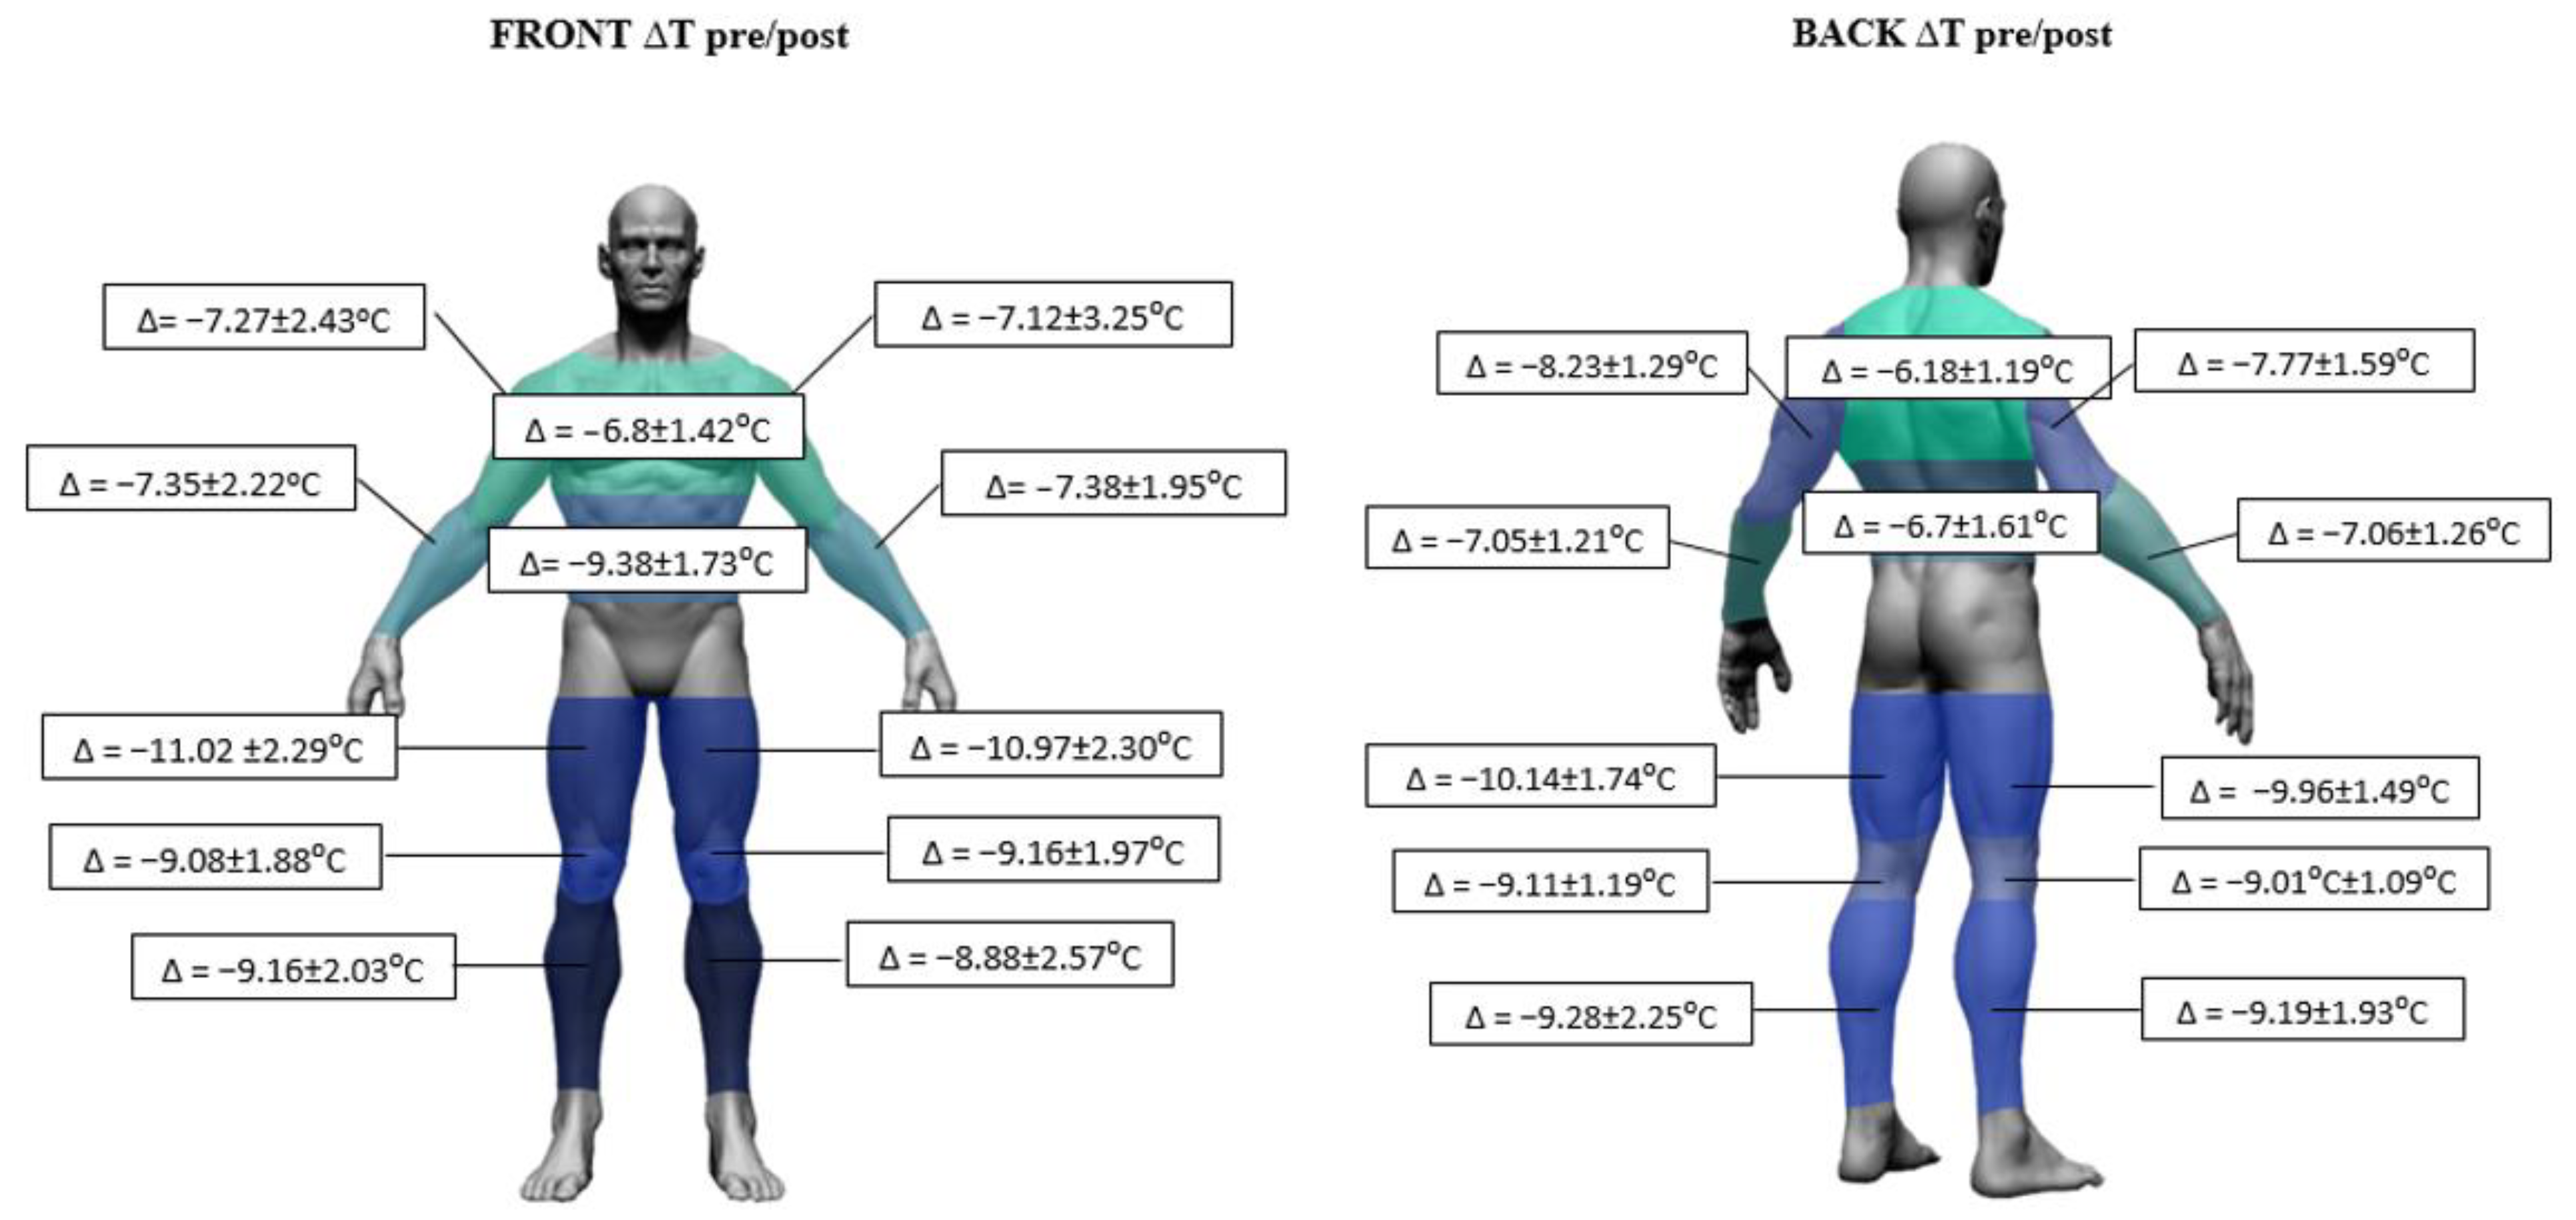
Body composition analysis showed a low absolute body fat content (FAT kg) in the body of the tested football players (9.6 ± 2.63% on average), while the lean body mass (FFM) was 70 ± 5.33 kg. Each of the participants had a BMI value within the normal range. All athletes were normotensive, and blood pressures for the group were 127 ± 11 mmHg for systolic blood pressure (SBP) and 69 ± 7 mmHg for diastolic blood pressure (DBP). Mean values, standard deviation, minimum and maximum values for body height, body weight, and BMI as well as the body composition parameters and blood pressure of football players are summarized in Table 1. In the course of the study, the skin temperature of selected areas of the football players’ body after the match and after PBC procedure was assessed. The mean values of the skin temperature of analyzed body areas before and after the PBC are presented in Table 2. The size of temperature changes in chosen areas of the body as a result of PBC was also analyzed, and the differences in temperature (∆Tpre/post), taking into account the front and back surfaces of the body, are shown graphically in Figure 3.
A comparative thermal analysis of the chosen areas allowed us to state that before the PBC procedure, the highest temperature was recorded in the central part of the body, i.e., in the upper and lower back (33.59 ± 0.41 °C and 33.12 ± 0.61 °C, respectively), as well as the chest (33.39 ± 0.60 °C) and abdomen (33.59 ± 0.41 °C). In contrast, the lowest temperature was recorded in the front areas of the knee joints (29.64 ± 1.53 °C and 29.79 ± 1.56 °C for the right and left knee joint, respectively; statistically significant difference at p < 0.01 with all of the analyzed areas) and the anterior thighs (30.92 ± 0.72 °C and 30.98 ± 0.70 °C for the right and left thigh, respectively; statistically significant difference at p < 0.05 with all of the analyzed areas). Immediately after the PBC procedure, a significant decrease in skin temperature was recorded in all analyzed areas (Table 2). The greatest differences were observed in the area of the thighs (a temperature drop on average by 11.02 °C and 10.97 °C for the anterior surfaces of the right and left thigh and by 9.96 °C and 10.14 °C for the posterior surfaces of the right and left thigh, respectively). The smallest temperature drop occurred in the areas of the upper and lower part of the back (on average by 6.18 °C and 6.70 °C, respectively) and in the area of the chest (on average by 6.80 °C). Statistical analysis showed no significant differences between temperatures in selected areas in relation to the sides of the body, both before and after PBC.
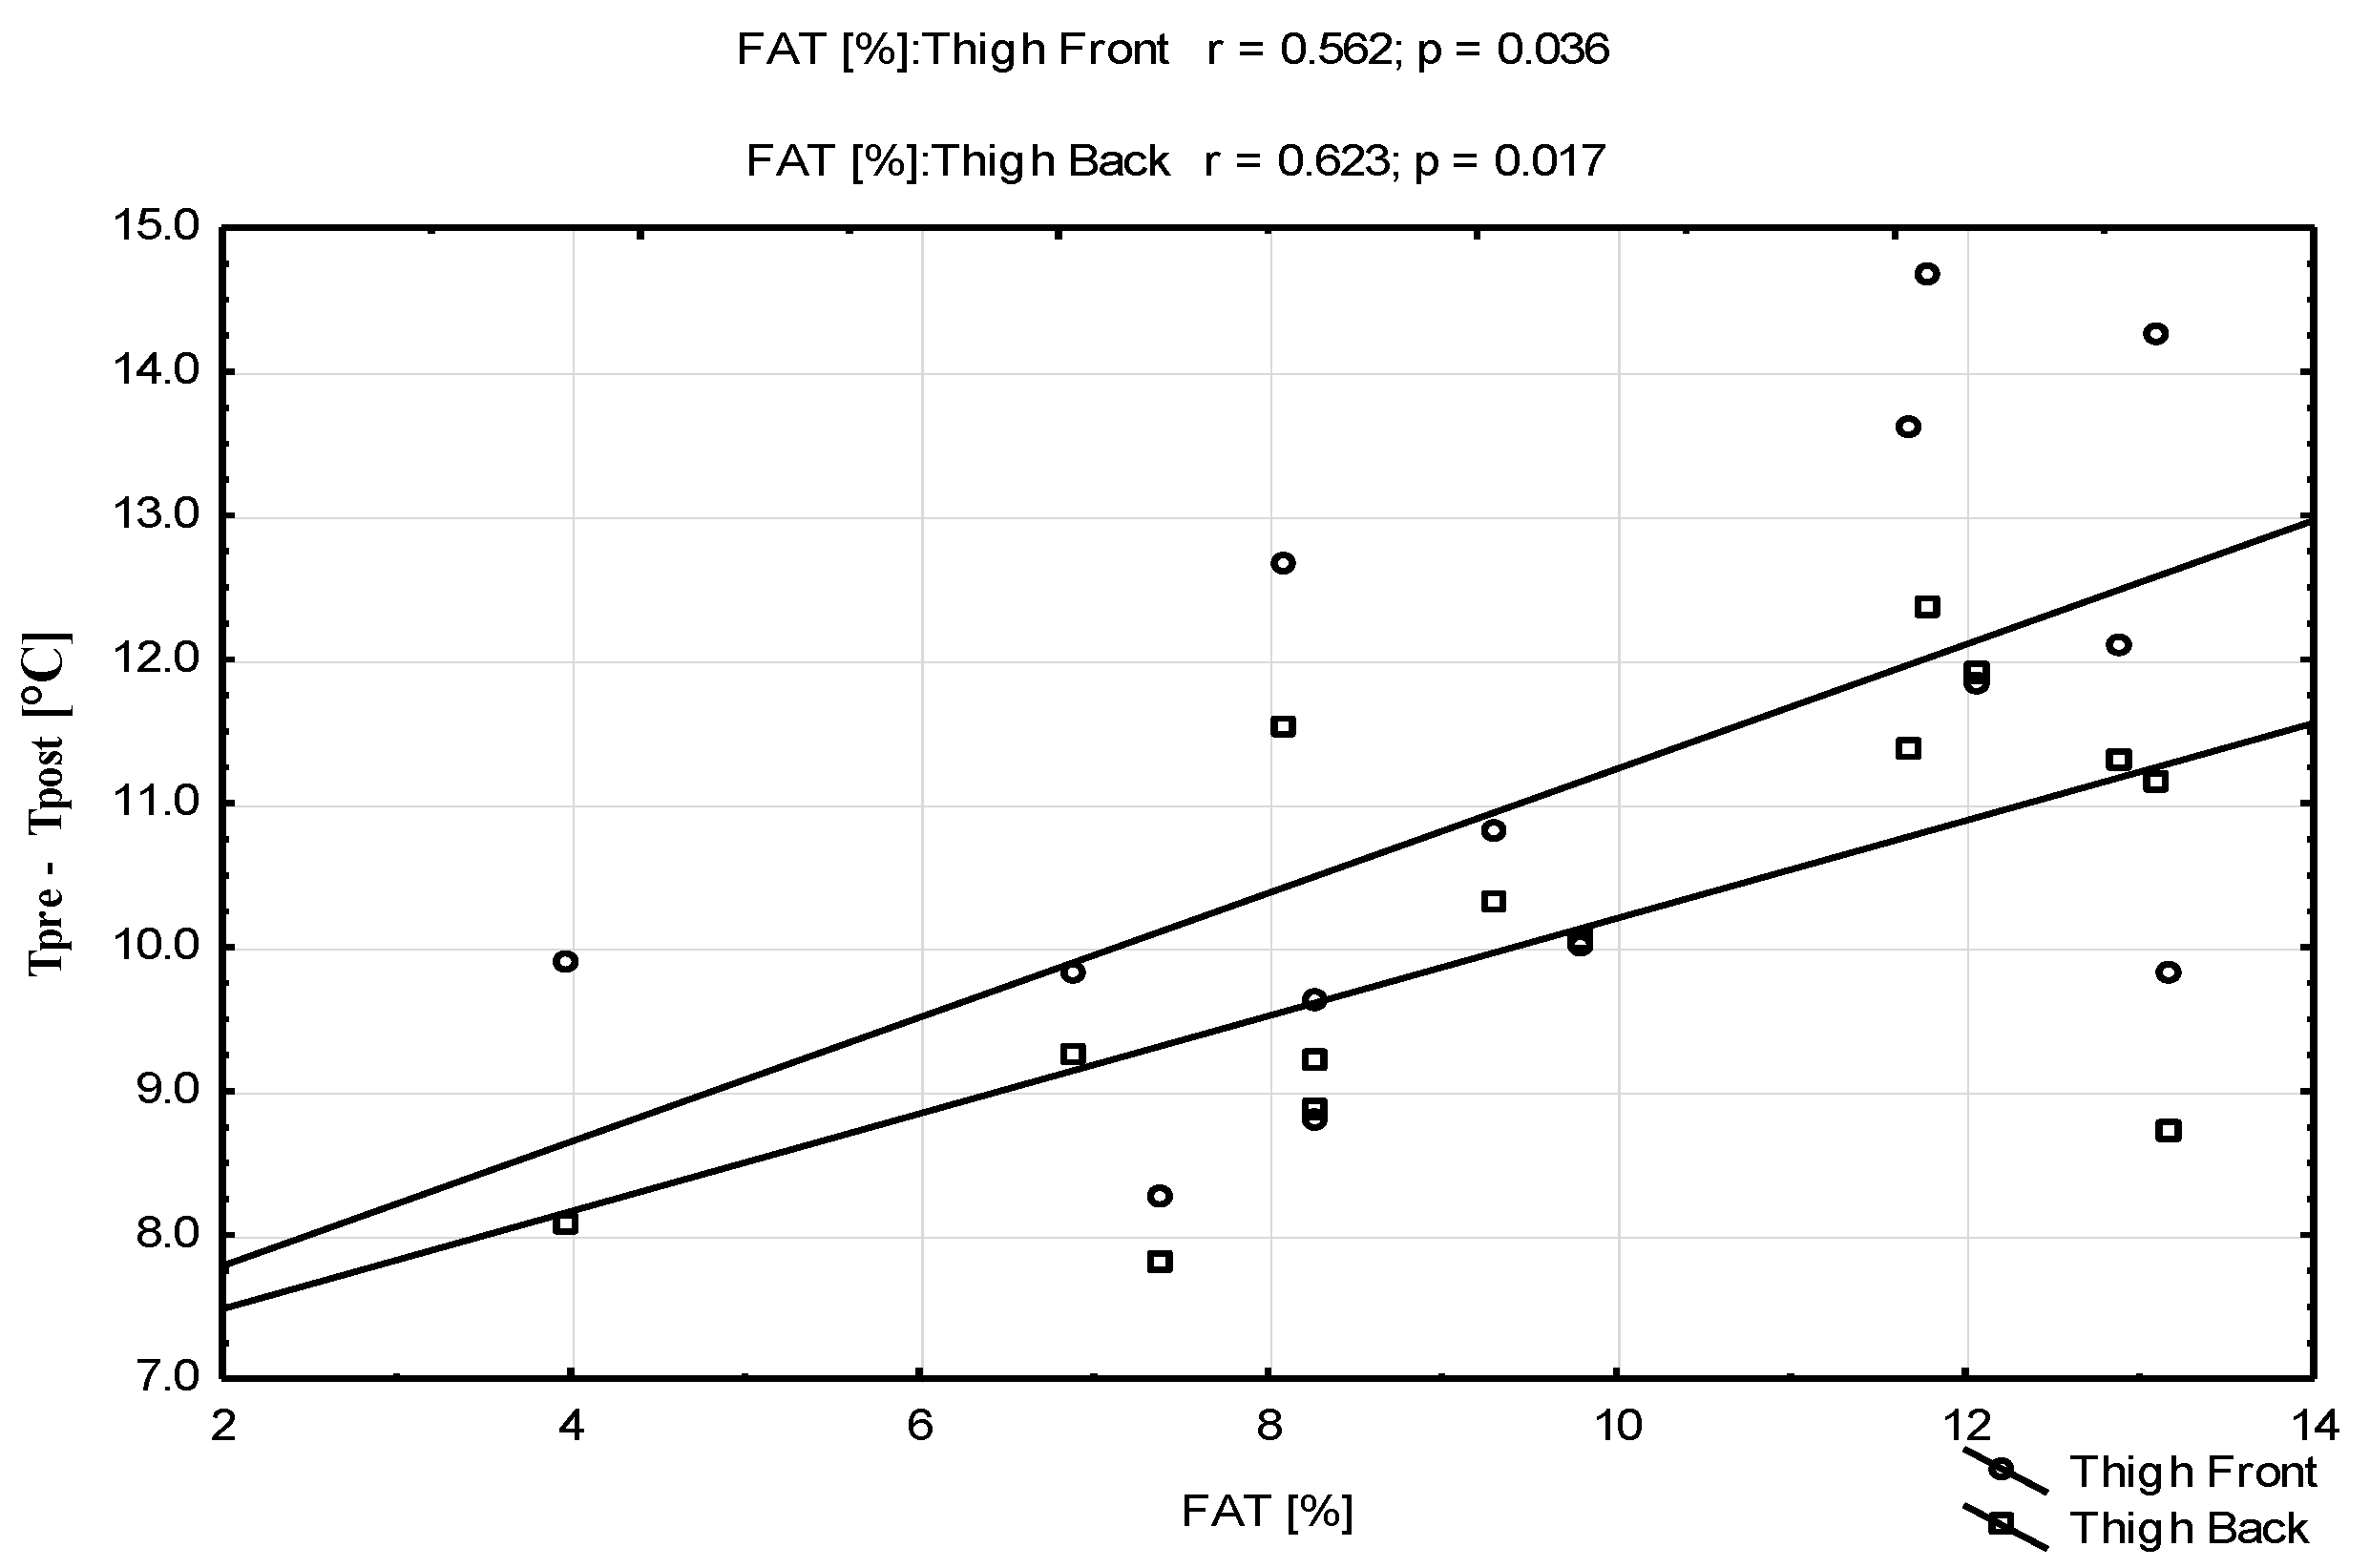
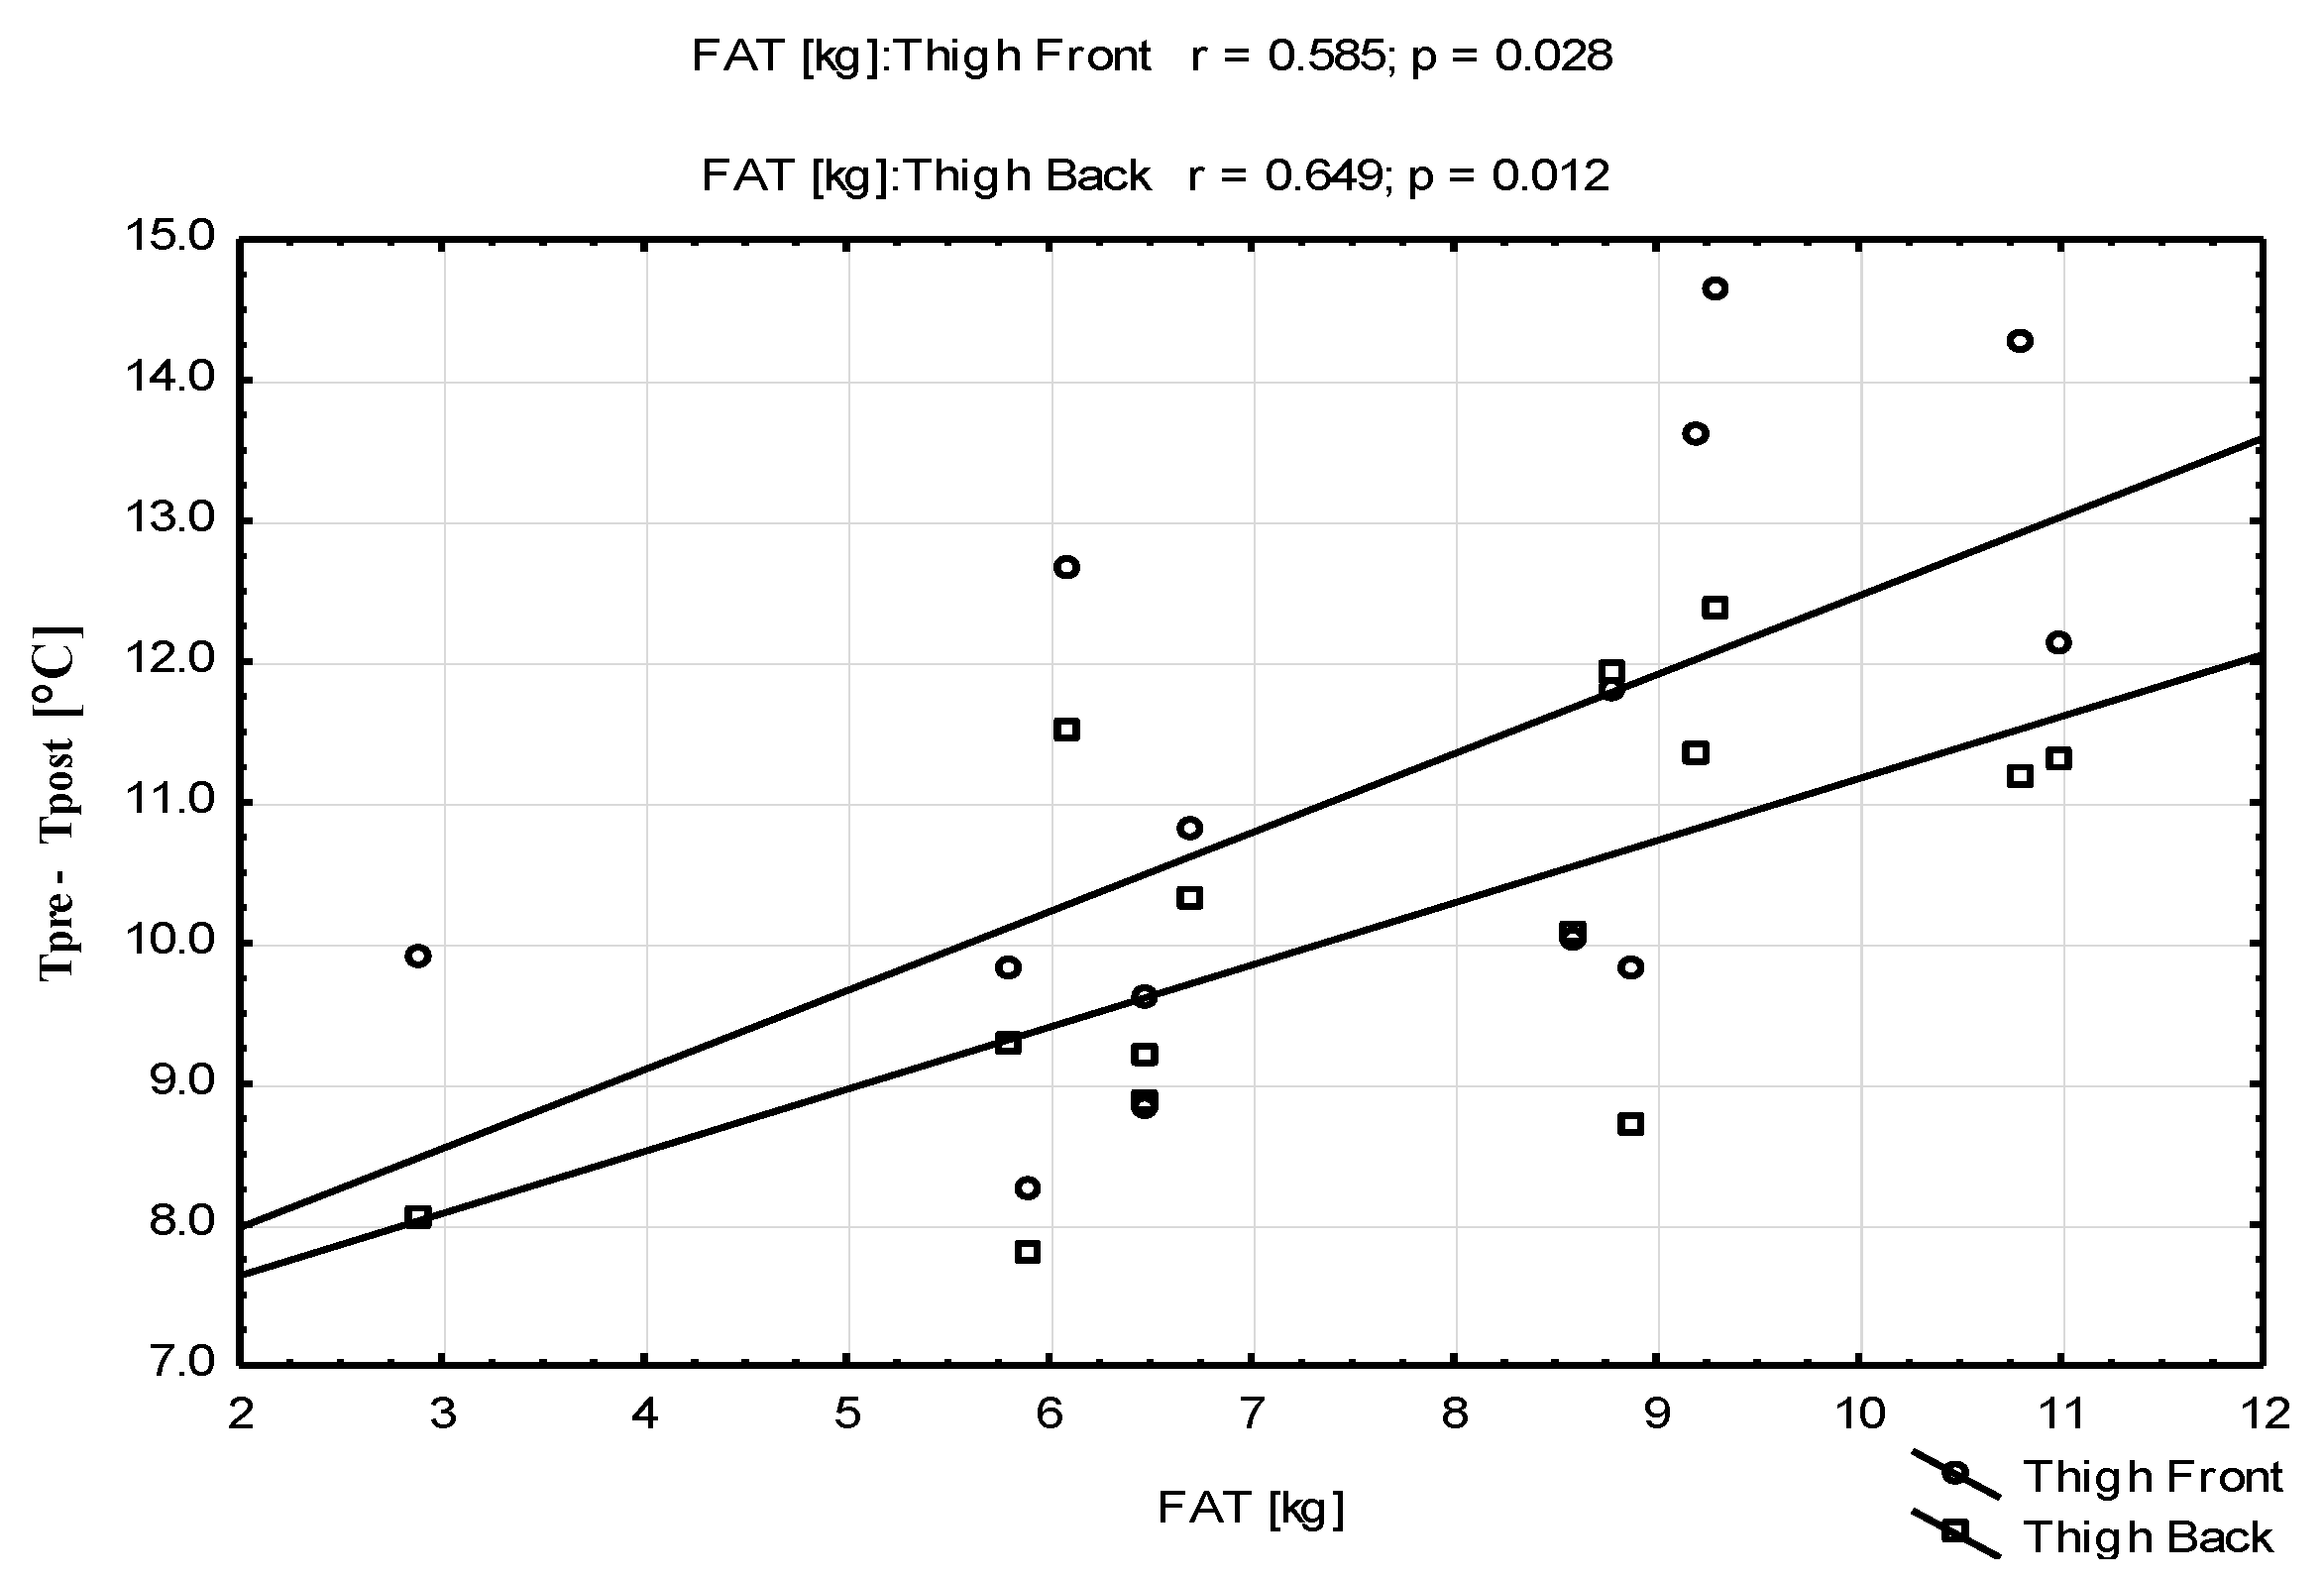
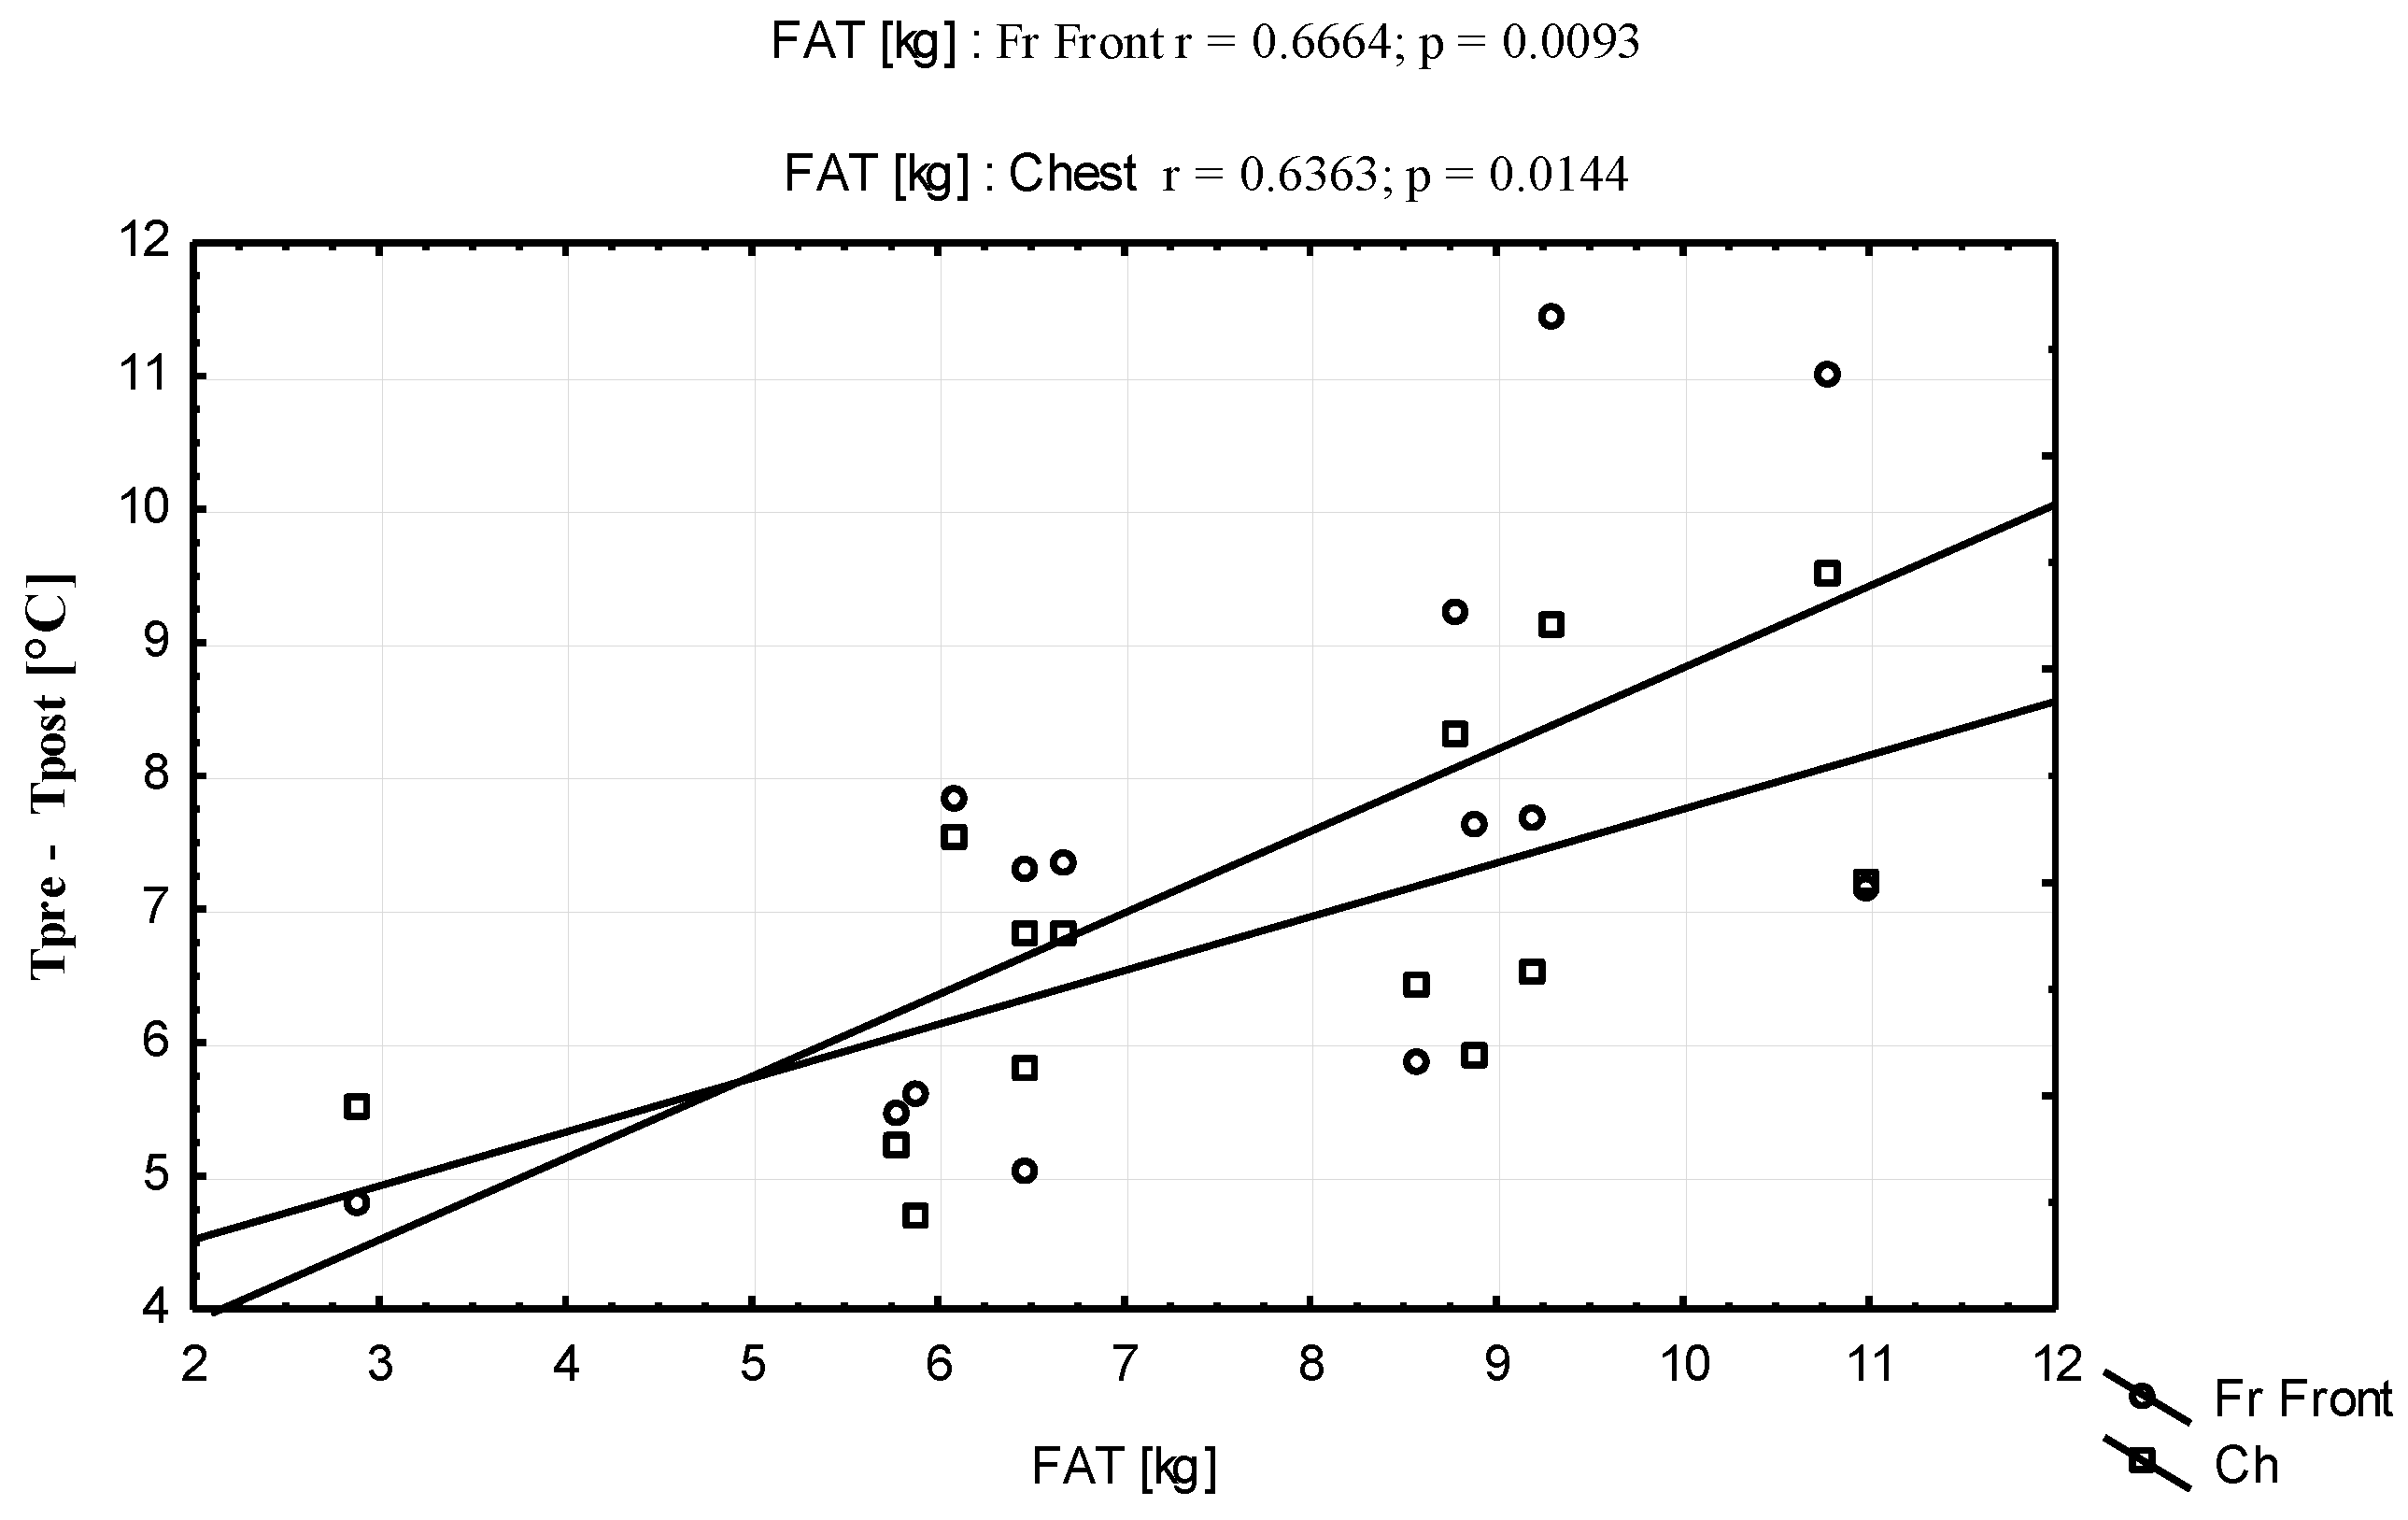
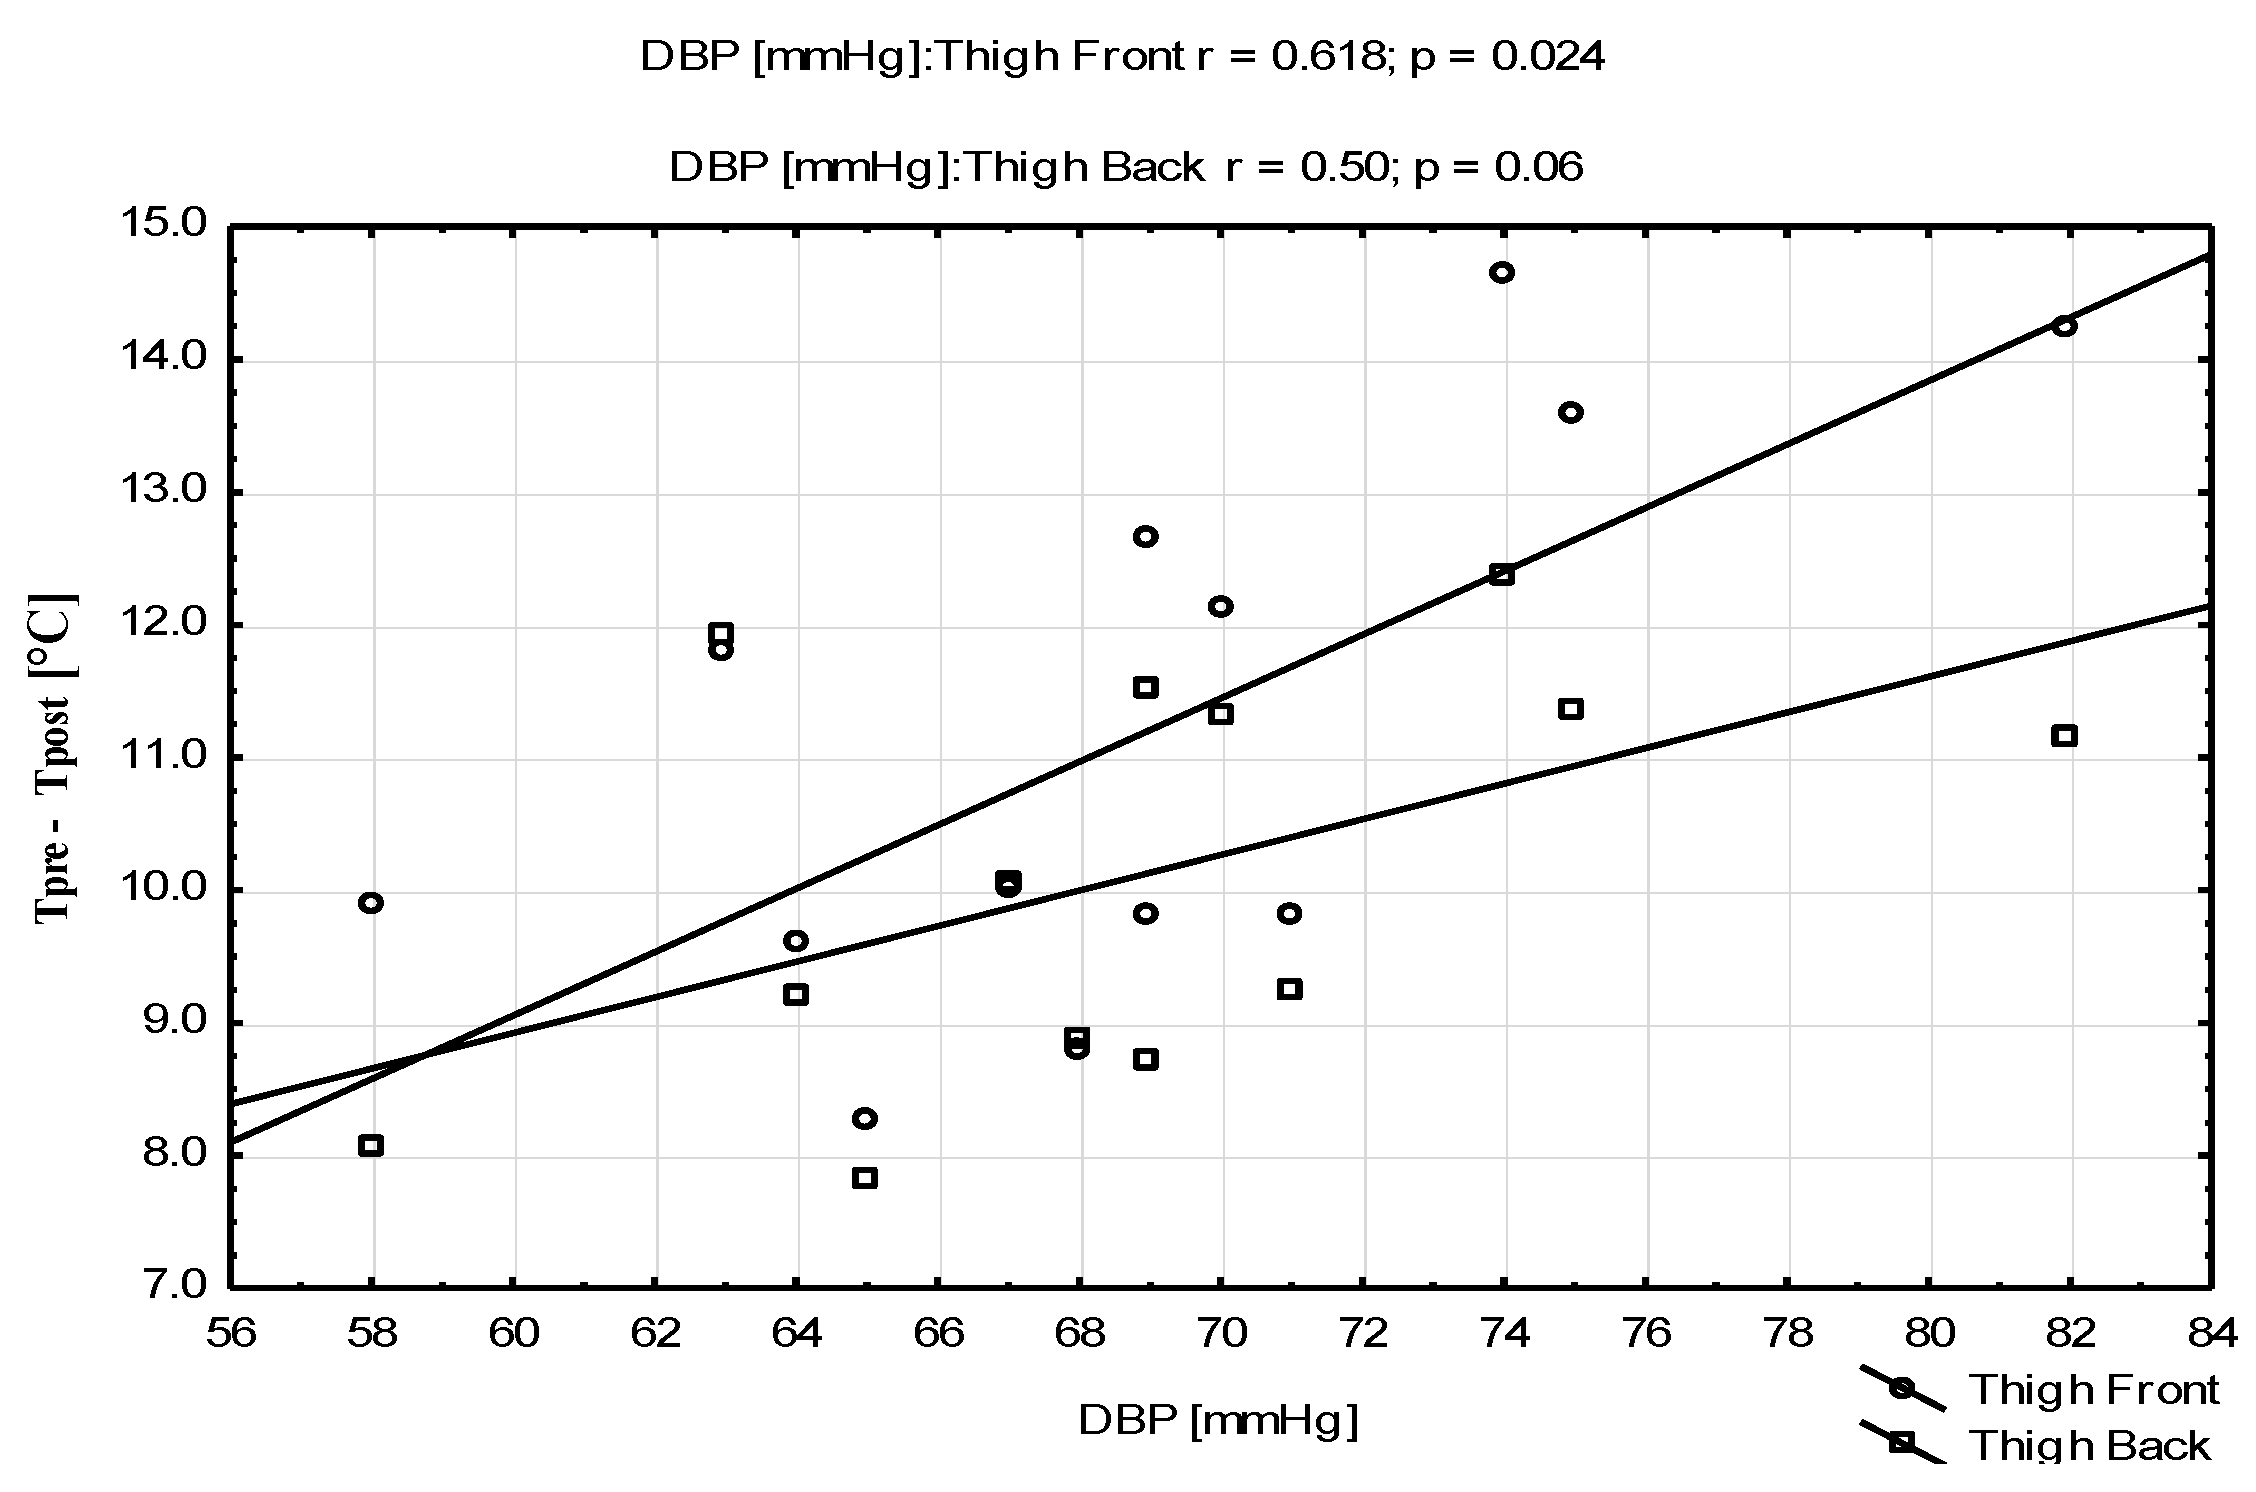
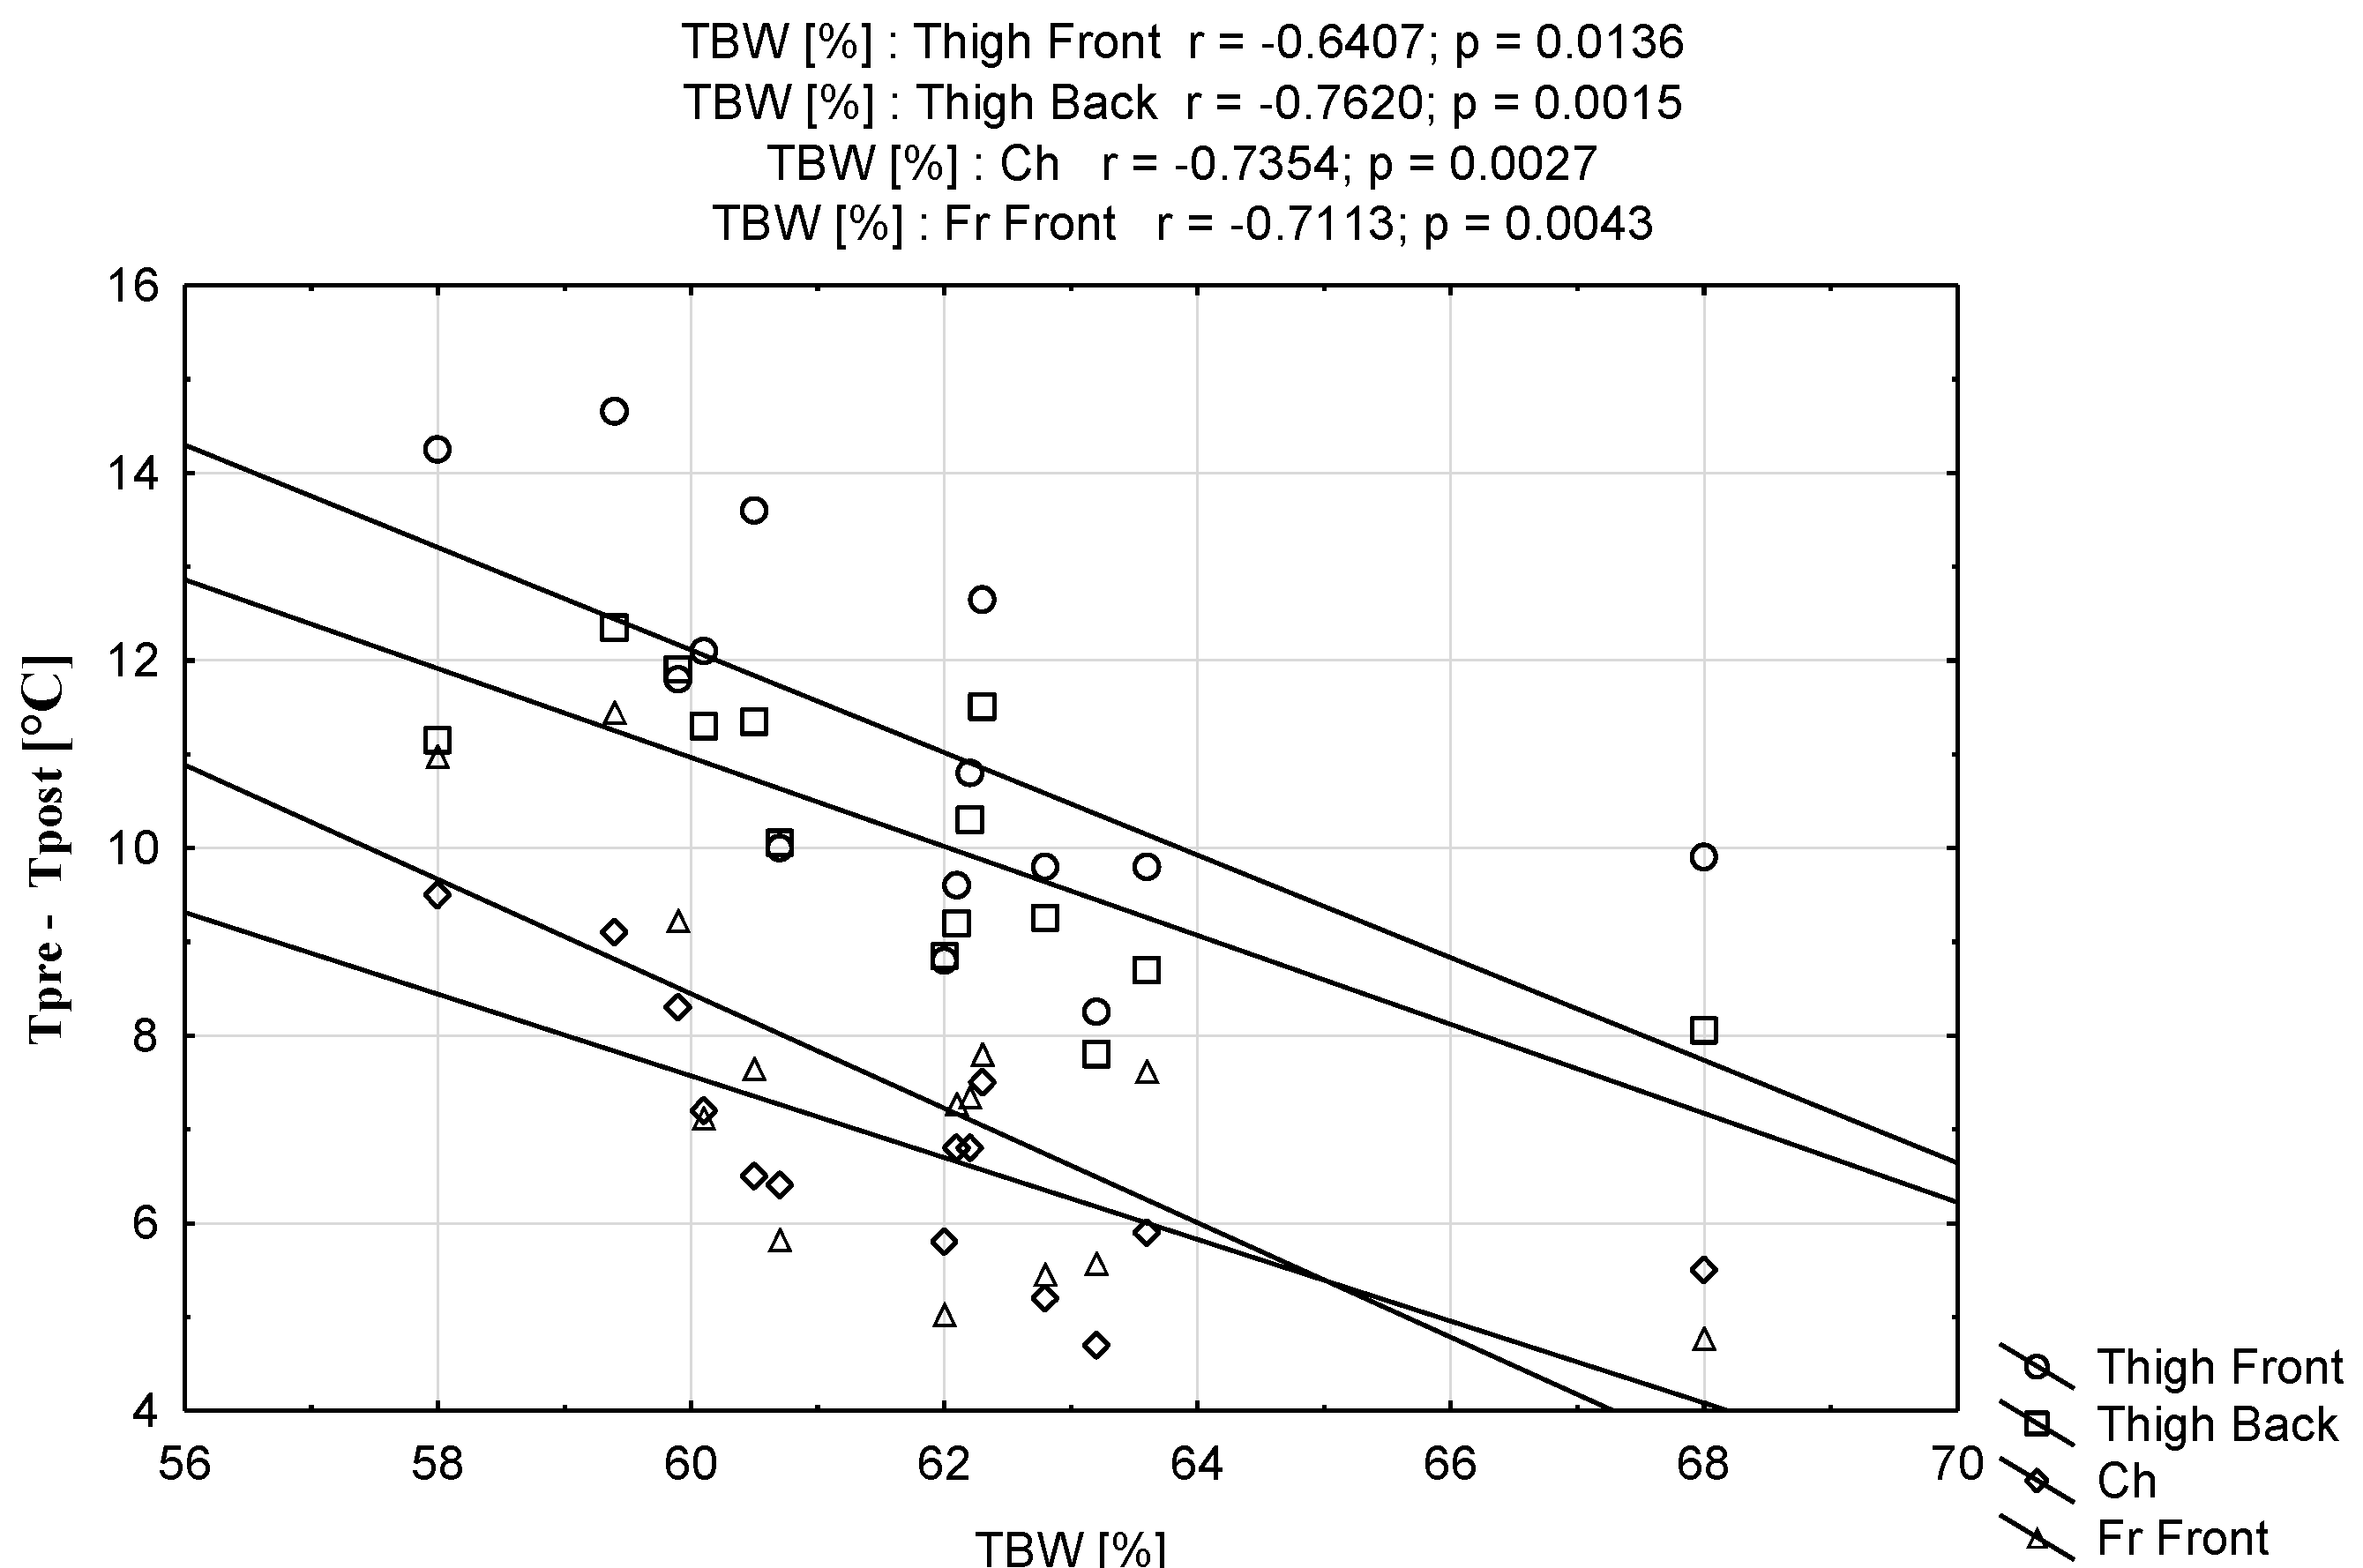
Another element of the study was the search for the relationship between the magnitude of temperature changes in response to cryostimulation and the values of individual body composition parameters. It was shown that most factors such as the BMI value, lean body mass, muscle mass, and absolute body water content did not significantly affect the changes in the body temperature of football players after the PBC procedure. Interestingly, it was observed that the absolute and percentage body fat content of players correlated with the magnitude of temperature changes in some areas of the body after PBC. This relationship was noticed for the anterior and posterior skin temperature of the thighs, where the temperature change after PBC was greatest (Figure 4 and Figure 5). Similar relationships were noted for the anterior surface of the lower shank area (r = 0.556; p = 0.039 FAT [kg] and r = 0.571; p = 0.033 FAT [%]), knees (r = 0.538; p = 0.047 FAT [kg]), and forearms (r = 0.666; p = 0.009 FAT [kg] and r = 0.7108; p = 0.004 FAT [%]) as well as the chest (r = 0.636; p = 0.014 FAT [kg] and r = 0.625; p = 0.17 FAT [%]) and abdomen (r = 0.536; p = 0.048 FAT [kg]). The most important relationships between FAT and ∆Tpre/post of selected areas of the body after PBC were presented in the Figure 6 and Figure 7. The magnitude of change in the surface skin temperature of the thighs turned out to be also significantly dependent on body water content and blood pressure. Negative values of the correlation coefficient between the anterior and posterior surfaces of the thighs and body water percentage (r = −0.582; p = 0.029 and r = −0.725; p = 0.003, respectively) and positive ones with the blood pressure value were obtained (Figure 8 and Figure 9). Moreover, %TBW turned out to be a significant factor in the case of changes in the temperature also for other areas of the body, of the anterior surface of the knee joint (r = −0.588; p = 0.27), the anterior and posterior surfaces of the arm (r = −0.617; p = 0.19 and r = −0.534; p = 0.49, respectively), the anterior surface of the forearm (r = −0.711; p = 0.004), the chest (r = −0.735; p = 0.003), the abdomen (r = −0.667; p = 0.09), and the upper back (r = −0.533; p = 0.05). The most important relationships between %TBW and ∆Tpre/post of selected areas of the body after PBC are presented in the Figure 10.
Blood pressure values significantly affected not only the magnitude of temperature decrease in the thigh area but also positively correlated with the values of changes in the area of the anterior surface of the knee joint (r = 0.621; p = 0.024 for SBP and r = 0.558; p = 0.047 for DBP). In addition, many relationships were found between the DBP value and the area of the arms (r = 0.673; p = 0.012 front; r = 0.629; p = 0.021 back), the anterior part of the forearm (r = 0.615; p = 0.025), and the upper part of the back (r = 0.602; p = 0.030).
In a further stage of the study, an analysis of changes in the concentration of biochemical blood indicators in football players was carried out, assessing the concentration of lactate (LA) after the match and changes in muscle damage markers, which consisted of measuring the activity of creatine kinase (CK), lactate dehydrogenase (LDH), and aspartate aminotransferase (AST) within 72 h following the match.
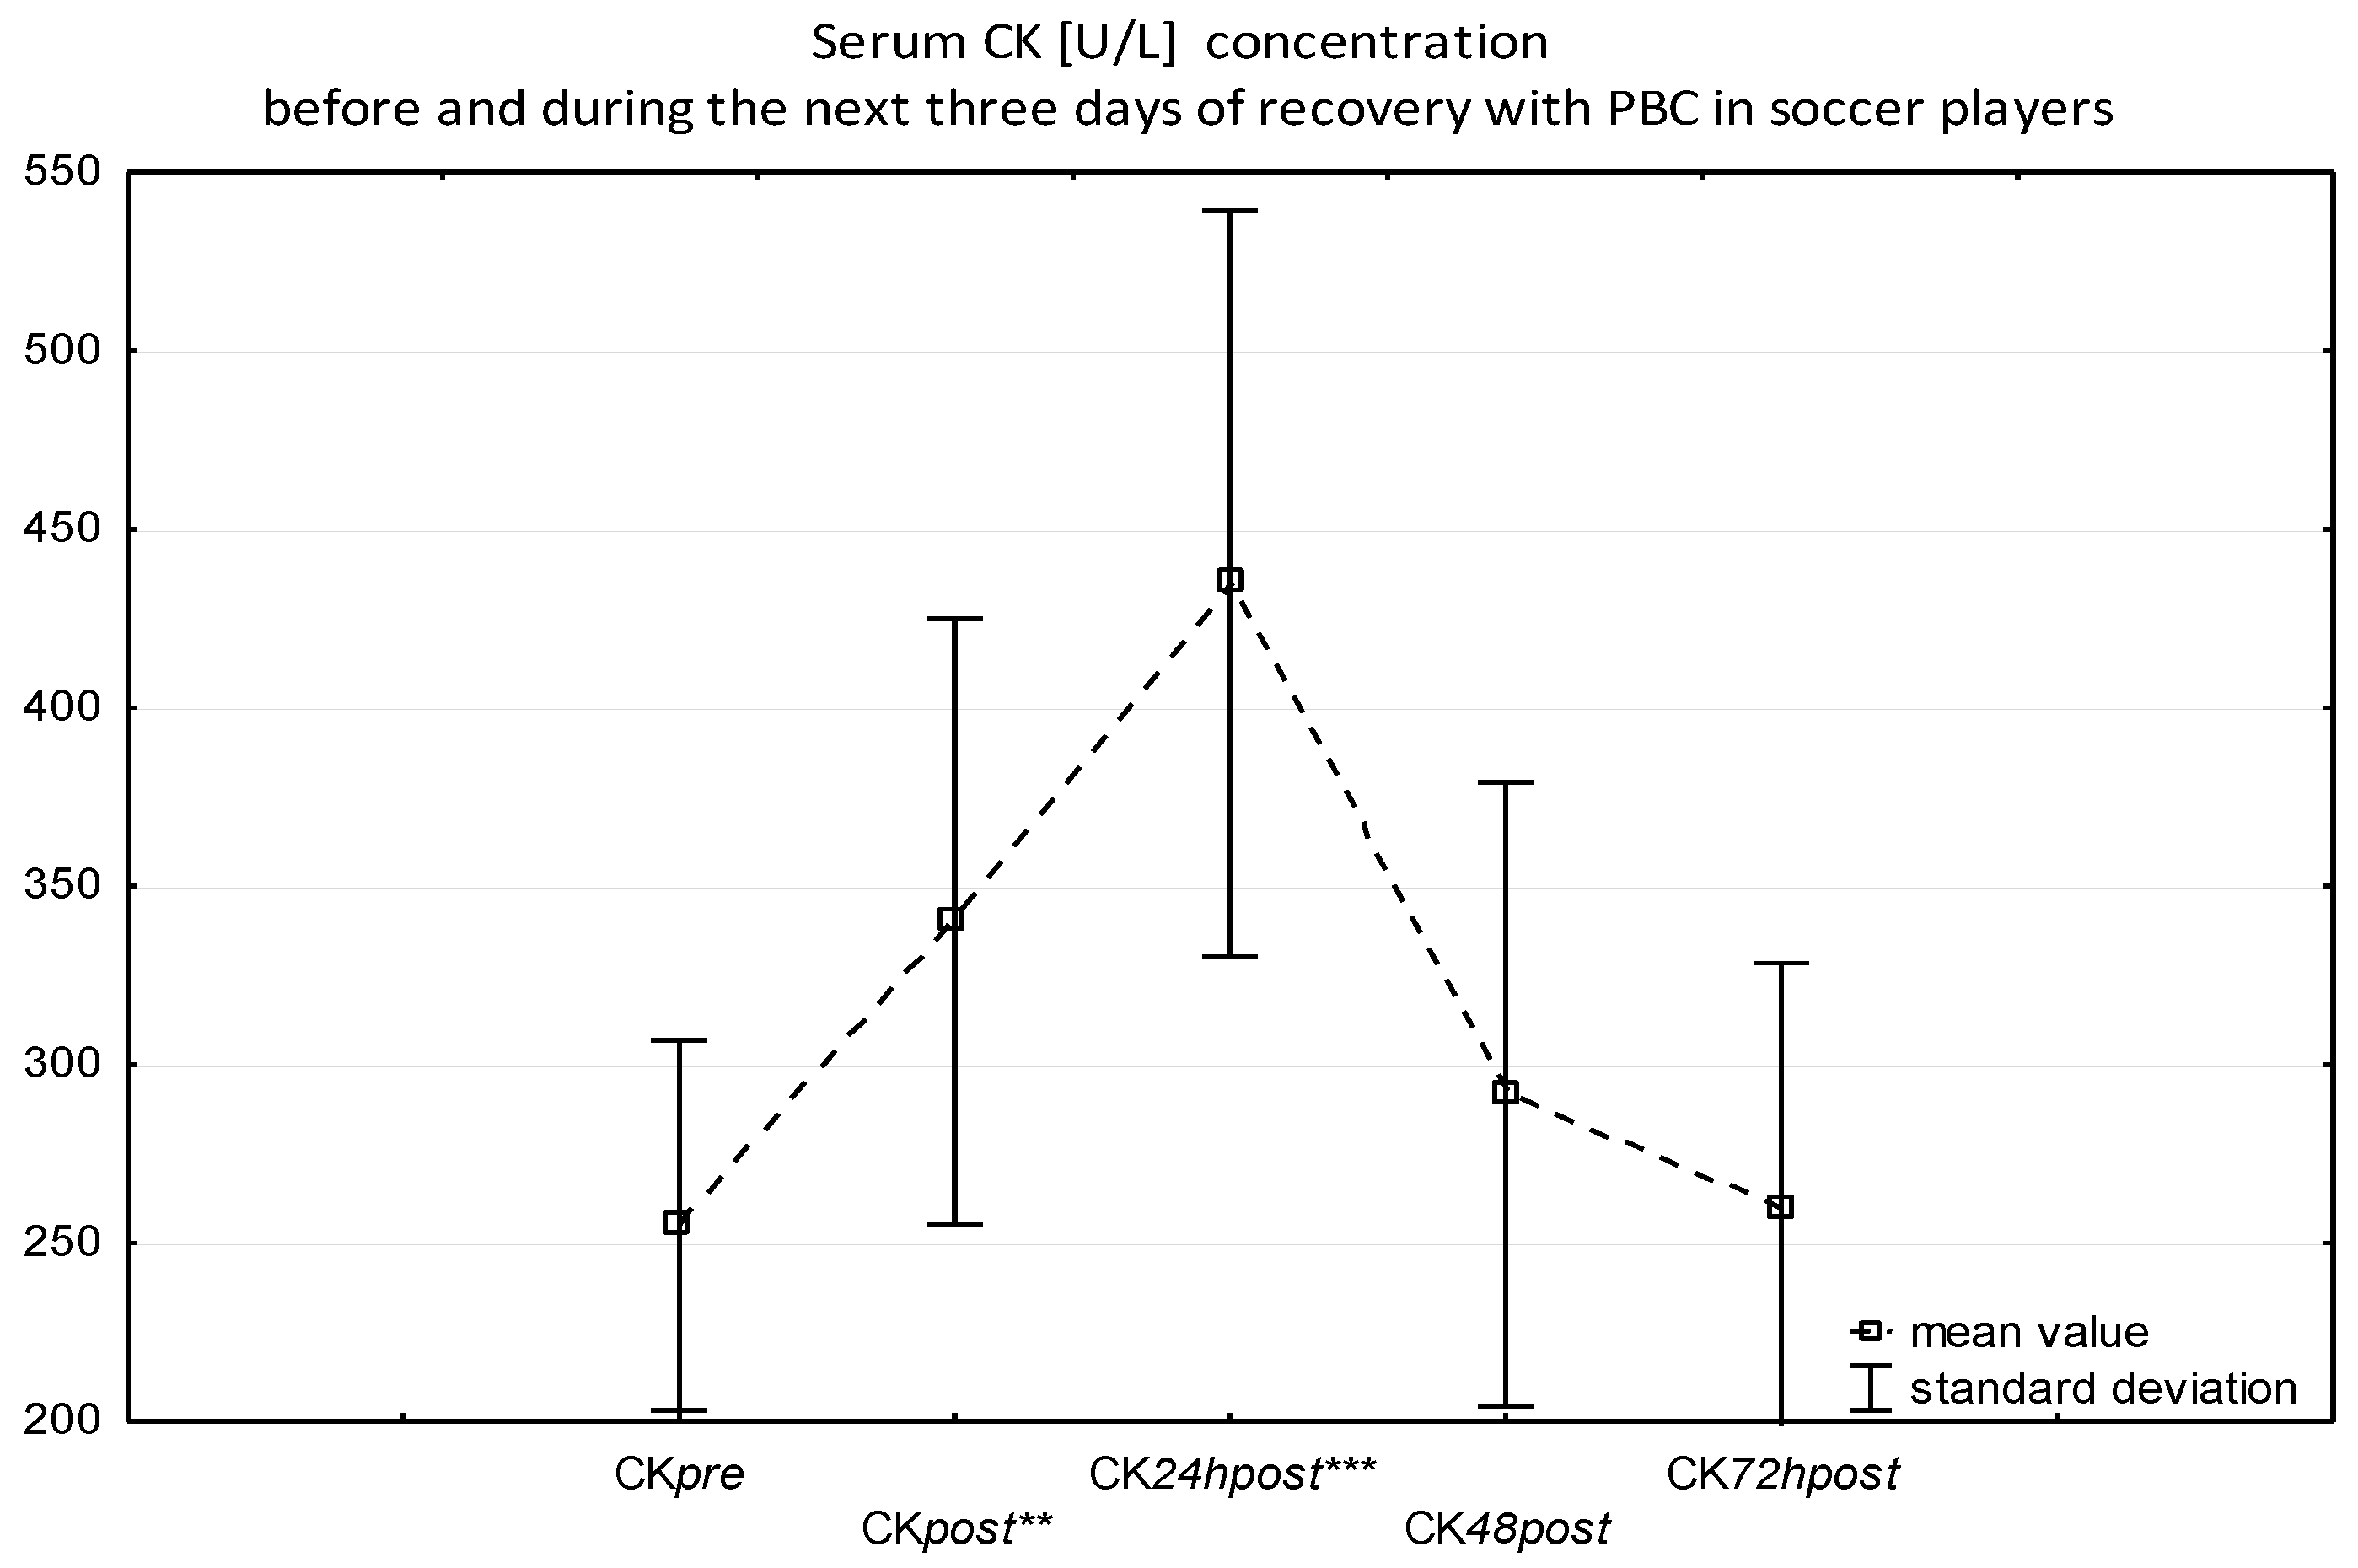
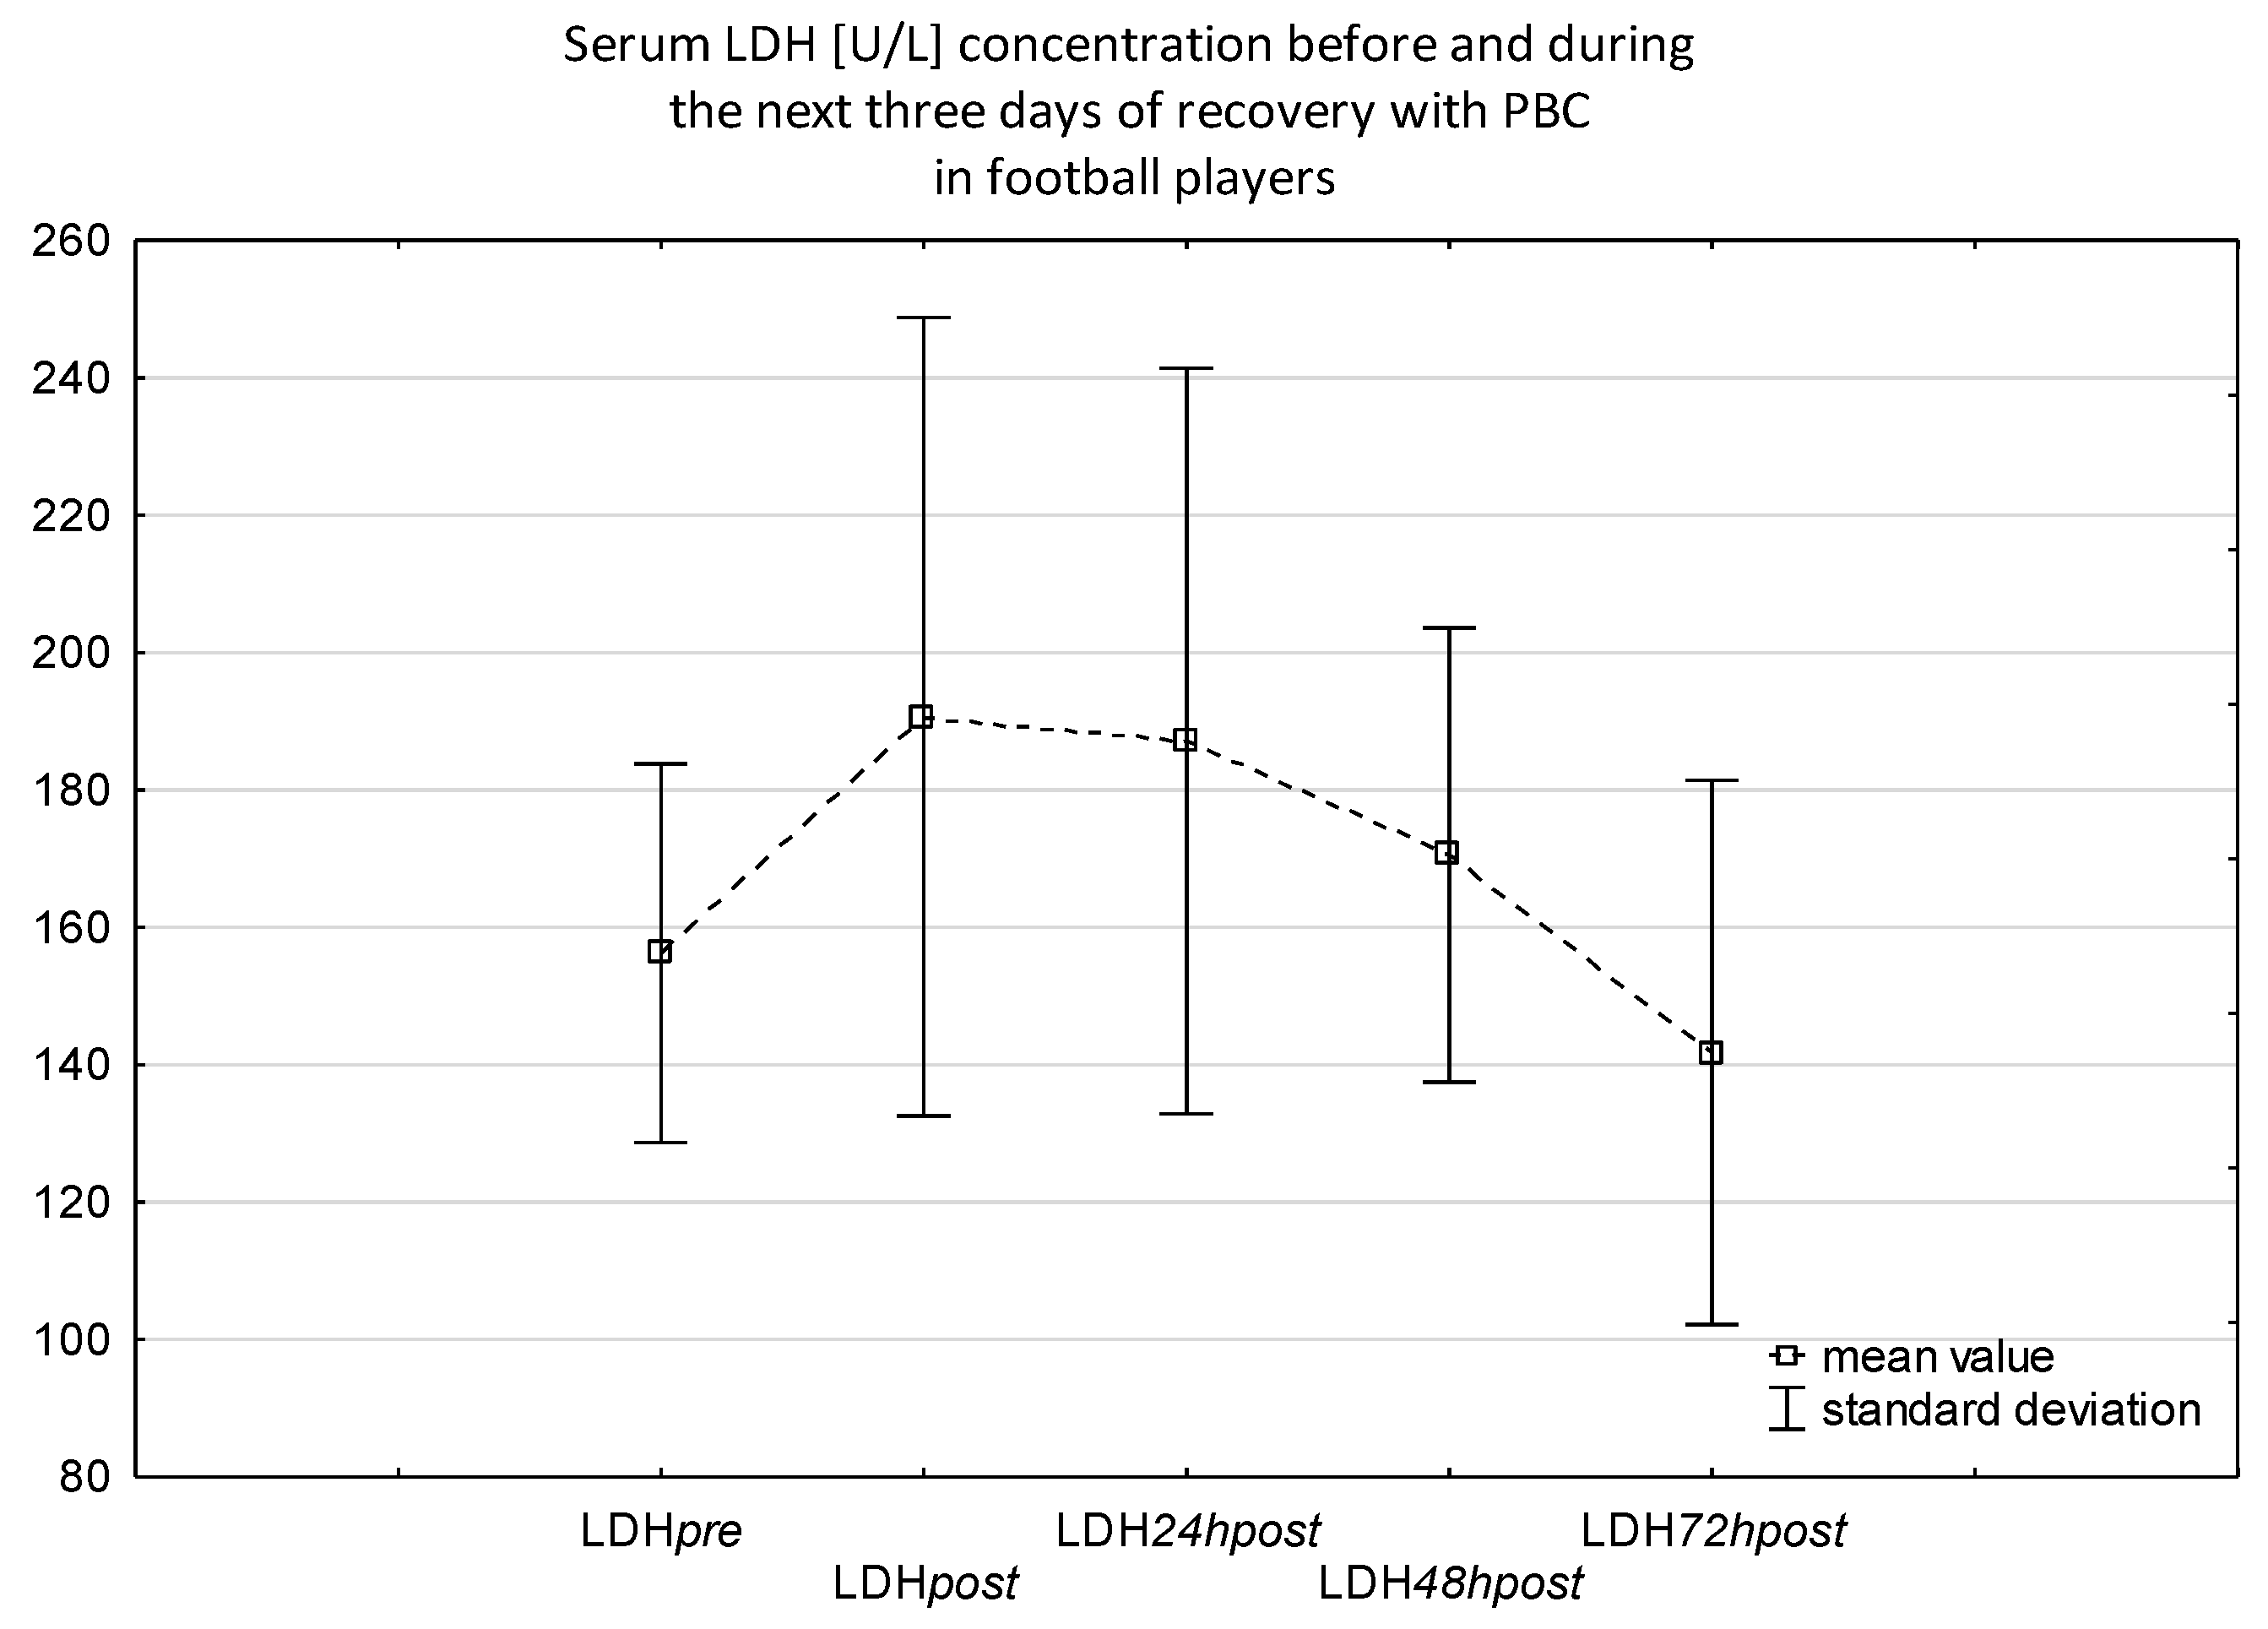
The dynamics of changes in the concentration of individual markers in the blood serum of the subjects at successive measurement points, i.e., before the match, immediately after the match but before the application of PBC, and then 24, 48, and 72 h after the end of the match, are presented in Figure 11, Figure 12 and Figure 13. Lactate concentration was significantly higher post- versus pre-match. As a result of the match physical activity, serum lactate values increased on average from 1.78 ± 0.36 µmol/mL to 5.26 ± 1.17 µmol/mL (p < 0.001). The mean pre-exercise values for muscle damage markers were, respectively, 254.98 ± 97.16 U/L for CK, 156.24 ± 53.63 U/L for LDH, and 22.81 ± 3.35 U/L for AST. Immediately after the match, there was a significant increase in CK and AST concentrations, lasting up to 24 h after exercise, when the analyzed concentrations reached their maximum values of 340.11 ± 159.08 U/L; p = 0.0025 for CK and 28.87 ± 4.13 U/L; p = 0.00001 for AST. During the next day (48 h post), a progressive decrease in the concentration of these markers was observed; in the case of CK, these values did not differ significantly from the baseline. On the other hand, for AST the values comparable to the baseline values were recorded only 72 h after the match. Interestingly, in the case of LDH, despite an upward trend in serum concentrations following the match effort and a decrease between 24 and 72 h after the match, no statistically significant differences between the values obtained in subsequent measurements were found. Peak serum LDH concentrations were observed immediately after the match, with the mean value for the group being 190.68 ± 109.10 U/L. There was no correlation between the amount of temperature change in the lower extremities and the post-match concentration of the analyzed markers of muscle damage.

4. Discussion

Previous research regarding the effects of cryostimulation on skin temperature of the body usually referred to whole body cryotherapy during the therapeutic treatment of various diseases. The aim of the study was to evaluate the effect of partial body cryostimulation in a multi-person cryocabin, performed immediately after a football match as a recovery technique, on the range of changes in skin temperatures of selected body areas within 24 regions of interests (12 anterior and 12 posterior). To our knowledge, this study is the first instance of research using a multi-person cabin in an open system. The main results of the research indicate that immediately after PBC, the skin temperature decreased significantly in all analyzed areas of the body. The temperature drop varied in area, ranging from 6.2 °C in the upper back to 11 °C on the front surface of the thighs. There are several reasons why monitoring body skin temperature seems to be a good diagnostic parameter during cryostimulation treatment: skin is recognized as the largest thermoregulatory organ; there is a relationship between skin temperature and vasoconstrictor skin sympathetic nerve activity and core temperature; the initial increase in metabolic response to cold exposure is driven by enhanced peripheral sensor activity as skin temperature declines; the rate of Tsk change affects thermogenesis, highlighting a significant dynamic influence of cutaneous thermoreceptors; Tsk is easier to access than intramuscular temperature; there are reports of correlations between these values [53,54,55]. The latest research in this area focuses on the importance of Transient Receptor Potential ion channels, especially TRPM8, TRPA1, and TRPC5, which have been found to be cold-sensitive ion channels. It has been proven that the TRPM8 channels are activated only when temperature is reduced to below −15 and −30 °C, which allows the entry of ions (Ca2+, Na+) that depolarize the membrane and initiate its action potential, which would indicate their important role in the neurophysiology response to cryostimulation [56,57]. Thus far, many studies have been conducted mainly on animal models, but it should be noted that Tsk decreases after PBC reaches a value of about 10 °C, which may be a factor significantly modifying the activity of harmful cold-sensitive TRP.
Comparing the temperature distribution on the contralateral sides of the body in athletes, both before and after the PBC procedure, no temperature asymmetry greater than 0.5 °C was observed in any of the analyzed areas. Thermal symmetry has been defined as the degree of similarity between two regions of interest (ROIs) mirrored across the human body longitudinal axis, which are identical in size and position [58]. The first studies on thermal symmetry in humans showed that in healthy people, the difference in skin temperature between the left and right sides of the body is only 0.24 ± 0.073 °C [59]. Subsequent results of Vardasca et al. [58] determined precisely that the thermal lateral differentiation in healthy people is 0.4 ± 0.3 °C when the entire body surface is considered and is 0.4 ± 0.15 °C for its individual regions. It should be noted that for interpretation in accordance with the standards of thermovision research, a temperature difference in the corresponding areas of the right and left sides of the body of <0.5 °C indicates no thermal asymmetry. Additionally, statistical analysis showed no significant differences between temperatures in selected areas, both before and after PBC. Maintaining symmetry in the thermal response of players following exposure to extremely low temperatures confirms physiological regulation of blood flow, controlled by the autonomic nervous system that is assumed to be anatomically and histologically symmetrical.
Post-exercise cryostimulation as a recovery strategy described in the literature refers to PBC and WBC. The differences between those two methods involve primarily the exclusion of the head in PBC treatment, as well as different ways to create cold, different device sizes, and mobility possibilities [31]. PBC devices seems to be very convenient during the competition season because of their mobility and portability. It requires less space; it is easier to contact participants during the procedure and to exit from a PBC cabin; it requires less maintenance than a WBC cabin. Currently, there are several technologies, models, and types of cryocabin construction for both WBC and PBC, but in most cases PBC is used with one-person cabin [10]. There is significant debate regarding the effectiveness of both modalities during athletic recovery. There are few examples in the literature of data describing the range of temperature changes in specific body surfaces that indicate the amount of heat take away from the body at a given time during PBC treatments, but it has been demonstrated that the thermal response after PBC is similar to the response after WBC [60,61]. In our case, an innovative solution was used, i.e., a model of a multi-person cryocabin for PBC, which is important in team sports, giving the possibility of quick simultaneous impact on 4–5 players. Internal temperature sensors precisely regulate the temperature in the treatment cubicle, which makes it possible to maintain it at a constant level among consecutive treatment sessions.
The initial reaction of the skin after an extremely cold exposure is the release of noradrenalin and peripheral cutaneous vasoconstriction [62]. The sympathetic response occurs by lowering the temperature of the skin [18], skin blood flow [63], and muscle oxygenation [21]. In our research, thermal imaging showed that PBC treatment had the greatest effect on lowering the skin temperature of lower extremities, especially in the thigh area. However, as expected, the smallest temperature changes were recorded in the upper back and the upper chest. The main factor affecting such characteristics of temperature changes in the analyzed body surfaces is the specific structure of the open treatment cryochamber, which means that during the PBC procedure, the head, neck, and nape are located above the plane of the cooling agent effect. The cold temperature is obtained by spraying nitrogen (expanded nitrogen), blown directly into the treatment area. Moreover, the generated nitrogen vapors in the upper part of the cabin, at the border of contact with the air, lose their extremely low temperature by mixing with warm air, in contrast to the place of exposure of the lower body parts, where the most gas with the lowest treatment temperature accumulates [49]. Interestingly, Dębiec-Bąk et al. [64], in the study on the range of temperature changes in various areas of the body, observed a comparable variability of temperature reduction as a result of using WBC, i.e., in a closed cabin, where the exposure also included the head. Specifically, the cooling effect was stronger in the lower extremities, whereas in the trunk it was weaker, regardless of whether the treatment was carried out at −100 °C or −140 °C. Based on this report, it can be assumed that although during WBC in a closed system the patient’s entire body is under the influence of the treatment, the temperature distribution in the cryochamber is uneven at individual heights. The magnitude of temperature changes obtained in our study was comparable to those described by Louis et al. [65]. These authors, comparing the thermal response and autonomic modulation after PBC and WBC, showed that in both cryotherapy modalities, the mean decrease in Tsk (except the head during PBC) was 8.3 ± 0.7 °C and 8.6 ± 1.3 °C for PBC and WBC, respectively, with a slight drop in the temperature of the head region in response to PBC. The reduction in tympanic temperature was larger after WBC than PBC, i.e., 0.31 ± 0.15 °C vs. 0.07 ± 0.12 °C, respectively. In the cited studies, changes for the Tsk value (calculated on the basis of the analysis from 22 ROIs) were presented, without the analysis for individual areas, which does not allow addressing of the nature of the distribution of changes. They also concluded that both cryostimulation techniques induce an immediate and quite similar autonomic stimulation without the marked effect of head cooling and that the key factor influencing the body response to cryostimulation might be the magnitude of body temperature reduction rather than the head cooling.
The results of our research show that the individual factors significantly affecting the temperature changes after cryogenic temperature exposition turned out to be the content of adipose tissue and total body water percentage, as well as blood pressure. On the other hand, the degree of fatigue assessed by the post-match concentration of lactate and muscle fatigue indicators does not affect the thermal response of competitors. An important factor determining the thermal response of football players was the content of adipose tissue, both in absolute and relative values. The drop in skin temperature after PBC for most areas was greater the higher was the content of adipose tissue in the subjects. Skin, adipose tissue, and vasoconstricted skeletal muscle form thermal insulators, with heat flux being proportional to the reciprocal of their combined thickness [54]. The relationship between the content of adipose tissue and the temperature of various body areas has been assessed by many authors, showing lower skin temperatures in people with a higher content of adipose tissue [66]. Additionally, it was proven that higher fat percentages in the specific anatomical sites tended to decrease mean skin temperatures of posterior thighs, posterior lower limbs, anterior thighs, and posterior arms; on the contrary, FAT% is positively correlated with body palm and posterior hands temperatures [67]. Extremely low temperature and sudden cold exposure with reduction in body temperature stimulate intense sympathoadrenal activity leading to increase cutaneous venomotor and vasomotor tone (vasoconstriction) and metabolic energy transformation (thermogenesis) to be able to reduce the blood flow in skin tissue and redirect it to the internal organs. Reflex cutaneous vasoconstriction characterizes the early and sustained response to whole-body cooling and is the primary autonomic mechanism to reduce convective heat transfer and defend core temperature during cold exposure [68]. Adipose tissue shows reduced thermal conductivity and increased insulating capacity and is also an insulating barrier for the conductive heat flow [69]; therefore, these areas may be cooler in thermographic analysis, both after intense physical exercise accompanied by sweating and after cryostimulation. Moreover, there is evidence that the increase in heat production during cold exposure can be three times as large in lean subjects as compared with overweight subjects [70]. As described in the introduction to the study, cold stimulation performed immediately after exercise has become a natural regeneration strategy commonly used in many sports and has proven to be a superior recovery modality when compared with passive recovery [71,72].
After a football match, physical performance is impaired immediately after the match and recovers gradually to pre-match levels. Several studies failed to observe a normalization of physical performance within the 3 days consecutive to a soccer match. The most significant indicators of muscle damage and overloads related to overtraining in different training periods are muscle pain, reduced power, and increased creatine kinase, myoglobin, aspartate aminotransferase, and lactate dehydogenase levels [4,29,30,73,74]. The observed increase in the concentration of lactate from the post-exercise period compared to the pre-exercise one indicates that the football match promoted an elevated energy demand, sufficient to cause skeletal muscle damage with increase in CK concentration. Aminotransferases released from the activated muscles are increased in response to physical exercise. AST is an important biomarker not only of the liver damage but also of the skeletal muscle damage [73,75]. The AST baseline levels of the tested football players were comparable to those obtained by Banfi and Morelii [76] in professional athletes and did not differ from the values for non-training persons. The serum concentration of the assessed biochemical indices (CK, AST) showed a significant post-match increase. The highest values of CK and AST concentrations in the tested football players were recorded 24 h after the end of physical exercise, which is consistent with the observations of other authors [77]. Interestingly and importantly, during the following days of observation, the levels of CK concentration returned to values close to the baseline already at 48 h, while in the case of AST they returned close to the baseline only at 72 h after the football match. Varley et al. [78] showed that the serum CK activity was correlated with the total number of accelerations and decelerations during the match and was still significantly higher at 40 h post-match when compared to baseline, with a peak at 24–48 h post-exercise, but it should be noted here that post-exercise CK concentrations were higher than those obtained by the players in this presented study. Similarly higher values of post-match CK concentrations were shown in the study by Trajkovic et al. [28] among U-21 football players, although it is noteworthy that the pre-match values in young players are significantly higher in the cited study. The factors affecting the post-match marker concentration values may be the intensity, commitment, and level of competition, as well as several factors of the match activity variables mentioned above. Ascensão et al. [26] suggest that a football match increases the levels of oxidative stress and muscle damage throughout the 72 h recovery period. Similarly, Fatouros et al. [79] and Russell et al. [80] found noticeable muscle damage up to 72 h post-exercise, following a football match. Other reports show that post-exercise CK concentration may last 120 h after intense exercise [25,27]. Short-term recovery is very important in sports activities. It seems that the use of post-cooling in the form of PBC as a method of regeneration immediately after the football match is a procedure with great potential. The mechanisms that can accelerate regeneration and return to cellular homeostasis after PBC can be considered: inducing a redirection of blood flow from the periphery to the core and thereby improving venous return and cardiac efficiency [81,82], reduction of nerve conduction velocity leading to acute analgesic effect, and reduction of acute inflammation from muscle damage [83].
Attention should be paid to technical and organizational considerations related to the portability of a mobile cabin and the possibility of using it during sporting competitions or match games, regardless of where they are held. Above all, however, this study confirms the strong stimulating effect of several-person cryostimulation in an open system, expressed by the thermal response of the body. We would also like to point out that the nature of temperature distribution during PBC, excluding the head during the procedure, seems to be safer for athletes immediately after exercise. One of the conditions for proper preparation for the procedure in order to minimize the risk of frostbite and the unpleasant feeling of cold is to dry the participant’s body to the maximum extent before it. Transepidermal water loss varies across the body regions [84]. The rate of sweating significantly increases in all regions of the body at various exercise intensities, and the ability of the head to evaporate heat loss through sweating during exercise is very intense at a high rate of sweating on the forehead −1.710 g m−2 h−1 [85]. Heat loss through the head is influenced not only by the intensity of exercise, but also by environmental conditions and the level of hydration [86]. In WBC treatments, this is an area that cannot be removed and therefore requires protection, and moisture in this area of the body increases the risk of discomfort during the procedure, but also poses a threat to the health of the players.

5. Limitations of the Study

It is important to note that the present study has limitations including a small sample size due to the number of players in a single football team. It would be worth verifying the obtained results by conducting research among a larger group of football players. Moreover, we did not carry out an evaluation of the physical performance of the football players (e.g., %VO2 max), which would allow the determination of the level of physical fitness. Despite the promising results regarding the effectiveness of the use of PBC, we are aware of the limitations of our research, which affect the clear-cut nature of the results obtained in terms of the effect of the PBC procedure on the dynamics of changes in the concentrations of selected muscle damage markers in the course of post-exercise regeneration of football players. Most of all, it seems reasonable to conduct comparative studies taking into account the differences in the course of post-match regeneration with the use of PBC in relation to the same competitive group, loaded with comparable physical effort without subsequent cryostimulation, i.e., with passive regeneration. Although the range of body surface temperature changes after PBC in our study was comparable to the literature data evaluating exposure to WBC, it would be worth using WBC and PBC on the same group of subjects to eliminate individual variability in response to cryostimulation.

6. Conclusions

To our knowledge this research is the first to focus on the potential use of mobile multi-personal PBC in post-match recovery in football players. The main finding of this study is that the assessment of the thermal response to PBC showed a significant, though regionally differentiated, decrease in body skin temperatures of football players exposed to PBC, each time symmetrical for the areas of the right and left side of the body and dependent on selected individual characteristics of football players. The range of temperature changes confirms the strong stimulating effect of PBC in an open system with the use of a multi-person cabin. It can be assumed that PBC did not slow down the course of post-workout regeneration of footballers and even showed the potential to positively influence the course of regeneration after the match, although comparative research in this area is necessary for unambiguous conclusions. Thermography is a suitable, non-invasive, and convenient method to estimate changes in the range of these temperatures, while providing at the same time the basis for assessing the effectiveness of the cooling procedure used.

Author Contributions

Conceptualization, A.L.; methodology, A.L.; formal analysis, A.L.; investigation, A.L. and A.K.; resources, A.L.; data curation, A.L.; writing—original draft preparation, A.L. and A.K.; writing—review and editing, A.L. and A.K.; visualization, A.K.; supervision, A.L.; funding acquisition, A.L. All authors have read and agreed to the published version of the manuscript.

Funding

The research was financed by Ministry of Science and Higher Education obtained by the Faculty of Health Sciences of the Pomeranian Medical University in Szczecin [WNoZ-318-01/S/13] [6570/IA/SP/2016]. Additionally, we would like to thank the Maximus s.c. Poland for providing a cryo-chamber and participation in research.

Institutional Review Board Statement

The study was conducted in accordance with the Declaration of Helsinki and approved by the local Ethics Committee of the Pomeranian Medical University (Ref. No. KB-0012/79/19).

Informed Consent Statement

Informed consent was obtained from all subjects involved in the study.

Data Availability Statement

Not applicable.

Conflicts of Interest

The authors declare no conflict of interest.

References

  1. Barnes, C.; Archer, D.T.; Hogg, B.; Bush, M.; Bradley, P.S. The evolution of physical and technical performance parameters in the english premier league. Int. J. Sports Med. 2014, 35, 1095–1100. [Google Scholar] [CrossRef] [PubMed]
  2. Faude, O.; Koch, T.; Mayer, T. Straight sprinting is the most frequent action in goal situations in professional football. J. Sports Sci. 2012, 30, 625–631. [Google Scholar] [CrossRef] [PubMed]
  3. Nedelec, M.; McCall, A.; Carling, C.; Legall, F.; Berthoin, S.; Dupont, G. Recovery in soccer: Part I—Post-match fatigue and time course of recovery. Sports Med. 2012, 42, 997–1015. [Google Scholar] [PubMed]
  4. Silva, J.R.; Rumpf, M.C.; Hertzog, M.; Castagna, C.; Farooq, A.; Girard, O.; Hader, K. Acute and Residual Soccer Match-Related Fatigue: A Systematic Review and Metaanalysis. Sports Med. 2018, 48, 539–583. [Google Scholar] [CrossRef]
  5. Marqués-Jiménez, D.; Calleja-González, J.; Arratibel, I.; Delextrat, A.; Terrados, N. Fatigue and Recovery in Soccer: Evidence and Challenges. Open Sports Sci. J. 2017, 10 (Suppl. S1), 52–70. [Google Scholar] [CrossRef] [Green Version]
  6. Hausswirth, C.; Le Meur, Y. Physiological and Nutritional Aspects of Post-Exercise Recovery Specific Recommendations for Female Athletes. Sports Med. 2011, 41, 861–882. [Google Scholar] [CrossRef]
  7. Meeusen, R.; Duclos, M.; Foster, C.; Fry, A.; Gleeson, M.; Nieman, D.; Raglin, J.; Rietjens, G.; Steinacker, J.; Urhausen, A. Prevention, diagnosis, and treatment of the overtraining syndrome: Joint consensus statement of the European College of Sport Science and the American College of Sports Medicine. Med. Sci. Sports Exerc. 2013, 45, 186–205. [Google Scholar] [CrossRef] [Green Version]
  8. Soligard, T.; Schwellnus, M.; Alonso, J.-M.; Bahr, R.; Clarsen, B.; Dijkstra, H.P.; Gabbett, T.; Gleeson, M.; Hägglund, M.; Hutchinson, M.R.; et al. How much is too much? (Part 1) International Olympic Committee consensus statement on load in sport and risk of injury. Br. J. Sports Med. 2016, 50, 1030–1041. [Google Scholar] [CrossRef] [Green Version]
  9. Bishop, P.A.; Jones, E.; Woods, A.K. Recovery from training: A brief review. J. Strength Cond. Res. 2008, 22, 1015–1024. [Google Scholar] [CrossRef]
  10. Bouzigon, R.; Grappe, F.; Ravier, G.; Dugue, B. Whole- and partial-body cryostimulation/cryotherapy: Current technologies and practical applications. J. Therm. Biol. 2016, 61, 67–81. [Google Scholar] [CrossRef]
  11. Patel, K.; Bakshi, N.; Freehill, M.T.; Awan, T.M. Whole-Body Cryotherapy in Sports Medicine. Curr. Sports Med. Rep. 2019, 18, 136–140. [Google Scholar] [CrossRef]
  12. Bleakley, C.; Bieuzen, F.; Davison, G.; Costello, J. Whole-body cryotherapy: Empirical evidence and theoretical perspectives. Open Access J. Sports Med. 2014, 5, 25–36. [Google Scholar] [CrossRef] [Green Version]
  13. Hausswirth, C.; Louis, J.; Bieuzen, F.; Pournot, H.; Fournier, J.; Filliard, J.-R.; Brisswalter, J. Effects of whole-body cryotherapy vs. far-infrared vs. passive modalities on recovery from exercise-induced muscle damage in highly-trained runners. PLoS ONE 2011, 6, e27749. [Google Scholar] [CrossRef] [Green Version]
  14. Pournot, H.; Bieuzen, F.; Louis, J.; Mounier, R.; Fillard, J.R.; Barbiche, E.; Hausswirth, C. Time-course of changes in inflammatory response after whole-body cryotherapy multi exposures following severe exercise. PLoS ONE 2011, 6, e22748. [Google Scholar] [CrossRef]
  15. Bleakley, C.M.; Hopkins, J.T. Is it possible to achieve optimal levels of tissue cooling in cryotherapy? Phys. Ther. Rev. 2010, 15, 344–350. [Google Scholar] [CrossRef]
  16. Costello, J.T.; Culligan, K.; Selfe, J.; Donnelly, A.E. Muscle, Skin and Core Temperature after −110 °C Cold Air and 8 °C Water Treatment. PLoS ONE 2012, 7, e48190. [Google Scholar] [CrossRef] [Green Version]
  17. Lombardi, G.; Ziemann, E.; Banfi, G. Whole-body cryotherapy in athletes from therapy to stimulation. An updated review of the literature. Front. Physiol. 2017, 8, 258. [Google Scholar] [CrossRef] [Green Version]
  18. Costello, J.T.; Donnelly, A.E.; Karki, A.; Selfe, J. Effects of whole body cryotherapy and cold water immersion on knee skin temperature. Int. J. Sports Med. 2014, 35, 35–40. [Google Scholar] [CrossRef] [Green Version]
  19. Ziemann, E.; Olek, R.A.; Kujach, S.; Grzywacz, T.; Antosiewicz, J.; Garsztka, T.; Laskowski, R. Five-day whole-body cryostimulation, blood inflammatory markers, and performance in high-ranking professional tennis players. J. Athl. Train. 2012, 47, 664–672. [Google Scholar] [CrossRef] [Green Version]
  20. Piras, A.; Campa, F.; Toselli, S.; Di Michele, R.; Raffi, M. Physiological responses to partial-body cryotherapy performed during a concurrent strength and endurance session. Appl. Physiol. Nutr. Metab. 2018, 44, 59–65. [Google Scholar] [CrossRef]
  21. Selfe, J.; Alexander, J.; Costello, J.T.; May, K.; Garratt, N.; Atkins, S.; Dillon, S.; Hurst, H.; Davison, M.; Przybyla, D.; et al. The effect of three different (−135 °C) whole body cryotherapy exposure durations on elite rugby league players. PLoS ONE 2014, 9, e86420. [Google Scholar] [CrossRef] [PubMed] [Green Version]
  22. Bouzigon, R.; Dupuy, O.; Tiemessen, I.; De Nardi, M.; Bernard, J.-P.; Mihailovic, T.; Theurot, D.; Miller, E.D.; Lombardi, G.; Dugué, B.M. Cryostimulation for Post-exercise Recovery in Athletes: A Consensus and Position Paper. Front. Sports Act. Living 2021, 3, 688828. [Google Scholar] [CrossRef] [PubMed]
  23. Nie, J.; Tong, T.K.; George, K.; Fu, F.H.; Lin, H.; Shi, Q. Resting and post-exercise serum biomarkers of cardiac and skeletal muscle damage in adolescent runners. Scand. J. Med. Sci. Sports 2011, 21, 625–629. [Google Scholar] [CrossRef] [PubMed]
  24. Brancaccio, P.; Maffulli, N.; Buonauro, R.; Limongelli, F.M. Serum Enzyme Monitoring in Sports Medicine. Clin. Sports Med. 2008, 27, 1–18. [Google Scholar] [CrossRef]
  25. Andersson, H.; Raastad, T.; Nilsson, J.; Paulsen, G.; Garthe, I.; Kadi, F. Neuromuscular fatigue and recovery in elite female soccer: Effects of active recovery. Med. Sci. Sports Exerc. 2008, 40, 372–380. [Google Scholar] [CrossRef] [Green Version]
  26. Ascensão, A.; Rebelo, A.; Oliveira, E.; Marques, F.; Pereira, L.; Magalhães, J. Biochemical impact of a soccer match—Analysis of oxidative stress and muscle damage markers throughout recovery. Clin. Biochem. 2008, 41, 841–851. [Google Scholar] [CrossRef]
  27. Ispirlidis, I.; Fatouros, I.G.; Jamurtas, T.; Nikolaidis, M.G.; Michailidis, Y.; Douroudos, I.; Margonis, K.; Chatzinikolaou, A.; Kalistratos, E.; Katrabasas, I.; et al. Time-course of Changes in Inflammatory and Performance Responses Following a Soccer Game. Clin. J. Sport Med. 2008, 18, 423–431. [Google Scholar] [CrossRef]
  28. Trajkovic, N.; Sporis, G.; Vlahovic, T.; Madic, D.; Gusic, M. Post-Match Changes in Muscle Damage Markers among U-21 Soccer Players Monten. J. Sports Sci. Med. 2018, 7, 49–53. [Google Scholar]
  29. Hoffman, J.R.; Kang, J.; Ratamess, N.A.; Faigenbaum, A.D. Biochemical and Hormonal Responses during an Intercollegiate Football Season. Med. Sci. Sports Exerc. 2005, 37, 1237–1241. [Google Scholar] [CrossRef]
  30. Koch, A.J.; Pereira, R.; Machado, M. The creatine kinase response to resistance exercise. J. Musculoskelet. Neuronal Neuronal Interact. 2014, 14, 68–77. [Google Scholar]
  31. Hausswirth, C.; Schaal, K.; Le Meur, Y.; Bieuzen, F.; Filliard, J.-R.; Volondat, M.; Louis, J. Parasympathetic Activity and Blood Catecholamine Responses Following a Single Partial-Body Cryostimulation and a Whole-Body Cryostimulation. PLoS ONE 2013, 8, e72658. [Google Scholar] [CrossRef] [Green Version]
  32. Krustrup, P.; Ferguson, R.A.; Kjær, M.; Bangsbo, J. ATP and heat production in human skeletal muscle duringdynamic exercise: Higher efficiency of anaerobic than aerobic ATP resynthesis. J. Physiol. 2003, 549, 255–269. [Google Scholar] [CrossRef]
  33. Arfaoui, A.; Bertucci, W.; Letellier, T.; Polidori, G. Thermoregulation during incremental exercise in masters cycling. J. Sci. Cycl. 2014, 3, 33–41. [Google Scholar]
  34. Ferreira, J.J.A.; Mendonça, L.C.S.; Nunes, L.A.O.; Andrade Filho, A.C.C.; Rebelatto, J.R.; Salvini, T.F. Exercise-Associated Thermographic Changes in Young and Elderly Subjects. Ann. Biomed. Eng. 2008, 36, 1420–1427. [Google Scholar] [CrossRef]
  35. Formenti, D.; Ludwig, N.; Gargano, M.; Gondola, M.; Dellerma, N.; Caumo, A.; Alberti, G. Thermal Imaging of Exercise-Associated Skin Temperature Changes in Trained and Untrained Female Subjects. Ann. Biomed. Eng. 2013, 41, 863–871. [Google Scholar] [CrossRef]
  36. Ludwig, N.; Gargano, M.; Formenti, D.; Bruno, D.; Ongaro, L.; Alberti, G. Breathing training characterization by thermal imaging: A case study. Acta Bioeng. Biomech. 2012, 14, 41–47. [Google Scholar] [CrossRef]
  37. Balci, G.A.; Basaran, T.; Colakoglu, M. Analysing visual pattern of skin temperature during submaximal and maximal exercises. Infrared Phys. Technol. 2016, 74, 57–62. [Google Scholar] [CrossRef] [Green Version]
  38. Merla, A.; Matei, P.A.; Di Donato, L.; Romani, G.L. Thermal imaging of cutaneous temperature modifcations in runners during graded exercise. Ann. Biomed. Eng. 2010, 8, 158–163. [Google Scholar] [CrossRef]
  39. Quesada, J.I.P.; Carpes, F.P.; Bini, R.R.; Palmer, R.S.; Pérez-Soriano, P.; de Anda, R.M.C.O. Relationship between skin temperature and muscle activation during incremental cycle exercise. J. Therm. Biol. 2015, 48, 28–35. [Google Scholar] [CrossRef]
  40. Quesada, J.P.; Lucas-Cuevas, A.G.; Gil-Calvo, M.; Giménez, J.V.; Aparicio, I.; de Anda, R.C.O.; Palmer, R.S.; Llana-Belloch, S.; Pérez-Soriano, P. Effects of graduated compression stockings on skin temperature after running. J. Therm. Biol. 2015, 52, 130–136. [Google Scholar] [CrossRef]
  41. Chudecka, M.; Lubkowska, A. Temperature changes of selected body’s surfaces of handball players in the course of training estimated by thermovision, and the study of the impact of physiological and morphological factors on the skin temperature. J. Therm. Biol. 2010, 35, 379–385. [Google Scholar] [CrossRef]
  42. Chudecka, M.; Lubkowska, A. The Use of Thermal Imaging to Evaluate Body Temperature Changes of Athletes During Training and a Study on the Impact of Physiological and Morphological Factors on Skin Temperature. Hum. Mov. 2012, 13, 33–39. [Google Scholar] [CrossRef]
  43. Sanz-López, F.; Martínez-Amat, A.; Hita-Contreras, F.; Valero-Campo, C.; Berzosa, C. Thermographic Assessment of Eccentric Overload Training Within Three Days of a Running Session. J. Strength Cond. Res. 2016, 30, 504–511. [Google Scholar] [CrossRef] [PubMed]
  44. Côrte, A.C.R.E.; Lopes, G.H.R.; Moraes, M.; De Oliveira, R.M.; Brioschi, M.H.; Hernandez, A.J. The importance of thermography for injury prevention and performance improvement in olympic swimmers: A series of case study. Int. Phys. Med. Rehabil. J. 2018, 3, 137–141. [Google Scholar] [CrossRef] [Green Version]
  45. Korman, P.; Zieliński, J.; Kusy, K.; Straburzyńska-Lupa, A. Possible uses of infrared thermography in sport. Trends Sport Sci. 2016, 2, 57–62. [Google Scholar]
  46. Escamilla-Galindo, V.L.; Estal-Martínez, A.; Adamczyk, J.G.; Brito, C.J.; Arnaiz-Lastras, J.; Sillero-Quintana, M. Skin temperature response to unilateral training measured with infrared thermography. J. Exerc. Rehabil. 2017, 13, 526–534. [Google Scholar] [CrossRef] [Green Version]
  47. Rodríguez-Sanz, D.; Losa-Iglesias, M.E.; López-López, D.; Calvo-Lobo, C.; Palomo-López, P.; Becerro-de-Bengoa-Vallejo, R. Infrared thermography applied to lower limb muscles in elite soccer players with functional ankle equinus and non-equinus condition. PeerJ 2017, 5, e3388. [Google Scholar] [CrossRef]
  48. Rodriguez- Sanz, D.; Losa-Iglesias, M.E.; Becerro de Bengoa-Vallejo, R.; Palomo-Lopez, P.; Beltran-Alacreu, H.; Calvo-Lobo, C.; Navarro-Flores, E.; Lopez-Lopez, D. Skin temperature in youth soccer players with functional equinus and non-equinus condition after running. J. Eur. Acad. Dermatol. Venereol. 2018, 32, 2020–2024. [Google Scholar] [CrossRef]
  49. Polidori, R.; Taiar, F.; Legrand, F.; Beaumont, S.; Murer, F.; Bogard, F.; Boyer, C. Infrared thermography for assessing skin temperature differences between Partial Body Cryotherapy and Whole Body Cryotherapy devices at −140 °C. Infrared Phys. Technol. 2018, 93, 158–161. [Google Scholar] [CrossRef]
  50. Moreira, D.G.; Costello, J.T.; Brito, C.J.; Adamczyk, J.G.; Ammer, K.; Bach, A.J.; Costa, C.M.; Eglin, C.; Fernandes, A.A.; Fernández-Cuevas, I.; et al. Thermographic imaging in sports and exercise medicine: A Delphi study and consensus statement on the measurement of human skin temperature. J. Therm. Biol. 2017, 69, 155–162. [Google Scholar] [CrossRef]
  51. Nuttall, F.Q. Body Mass Index: Obesity, BMI, and Health: A Critical Review. Nutr. Today 2015, 50, 117–128. [Google Scholar] [CrossRef] [Green Version]
  52. Fuijmasa, I. Standardization of techniques for thermal imaging testing: The current situation. Biomed. Thermol. 1995, 15, 63–68. [Google Scholar]
  53. Sawasaki, N.; Iwase, S.; Mano, T. Effect of skin sympathetic response to local or systemic cold exposure on thermoregulatory functions in humans. Auton. Neurosci. 2001, 87, 274–281. [Google Scholar] [CrossRef]
  54. Stocks, J.M.; Taylor, N.A.S.; Tipton, M.J.; Greenleaf, J.E. Human physiological responses to cold exposure. Aviat. Space Environ. Med. 2004, 75, 444–457. [Google Scholar]
  55. Jutte, L.S.; Merrick, M.; Ingersoll, C.D.; Edwards, J.E. The relationship between intramuscular temperature, skin temperature, and adipose thickness during cryotherapy and rewarming. Arch. Phys. Med. Rehabil. 2021, 82, 845–850. [Google Scholar] [CrossRef]
  56. Wang, H.; Siemens, J. TRP ion channels in thermosensation, thermoregulation and metabolism. Temp. Multidiscip. Biomed. J. 2015, 2, 178–187. [Google Scholar] [CrossRef] [Green Version]
  57. Lezama-García, K.; Mota-Rojas, D.; Pereira, A.M.F.; Martínez-Burnes, J.; Ghezzi, M.; Domínguez, A.; Gómez, J.; Geraldo, A.D.M.; Lendez, P.; Hernández-Ávalos, I.; et al. Transient Receptor Potential (TRP) and Thermoregulation in Animals: Structural Biology and Neurophysiological Aspects. Animals 2022, 12, 106. [Google Scholar] [CrossRef]
  58. Vardasca, R.; Ring, E.F.J.; Plassmann, P.; Jones, C.D. Thermal symmetry of the upper and lower extremities in healthy subjects. Thermol. Int. 2012, 22, 53–60. [Google Scholar]
  59. Uematsu, S.; Jankel, W.; Edwin, D.; Kim, W.; Kozikowski, A.; Long, D.M. Quantification of thermal asymmetry. Part 2: Application in low-back pain and sciatica. J. Neursurg. 1988, 69, 556–561. [Google Scholar] [CrossRef]
  60. Fonda, B.; De Nardi, M.; Sarabon, N. Effects of whole-body cryotherapy duration on thermal and cardio-vascular response. J. Therm. Biol. 2014, 42, 52–55. [Google Scholar] [CrossRef]
  61. Savic, M.; Fonda, B.; Sarabon, N. Actual temperature during and thermal response after whole-body cryotherapy in cryo-cabin. J. Therm. Biol. 2013, 38, 186–191. [Google Scholar] [CrossRef]
  62. Johnson, J.M.; Yen, T.C.; Zhao, K.; Kosiba, W.A. Sympathetic, sensory, and nonneuronal contributions to the cutaneous vasoconstrictor response to local cooling. Am. J. Physiol. Circ. Physiol. 2005, 288, H1573–H1579. [Google Scholar] [CrossRef] [PubMed] [Green Version]
  63. Song, C.W.; Chelstrom, L.M.; Levitt, S.H.; Haumschild, D.J. Effects of temperature on blood circulation measured with the laser doppler method. Int. J. Radiat. Oncol. 1989, 17, 1041–1047. [Google Scholar] [CrossRef] [PubMed]
  64. Dębiec-Bąk, A.; Skrzek, A.; Podbielska, H. Application of thermovision for estimation of the optimal and safe parameters of the whole body cryotherapy. J. Therm. Anal. Calorim. 2013, 111, 1853–1859. [Google Scholar] [CrossRef] [Green Version]
  65. Louis, J.; Schaal, K.; Bieuzen, F.; Le Meur, Y.; Filliard, J.-R.; Volondat, M.; Brisswalter, J.; Hausswirth, C. Head Exposure to Cold during Whole-Body Cryostimulation: Influence on Thermal Response and Autonomic Modulation. PLoS ONE 2015, 10, e0124776. [Google Scholar] [CrossRef]
  66. Neves, E.B.; Salamunes, A.C.C.; de Oliveira, R.M.; Stadnik, A.M.W. Effect of body fat and gender on body temperature distribution. J. Therm. Biol. 2017, 70 Pt B, 1–8. [Google Scholar] [CrossRef]
  67. Salamunes, A.C.C.; Stadnik, A.M.W.; Neves, E.B. The effect of body fat percentage and body fat distribution on skin surface temperature with infrared thermography. J. Therm. Biol. 2017, 66, 1–9. [Google Scholar] [CrossRef]
  68. Johnson, J.M.; Minson, C.T.; Kellogg, D.L. Cutaneous Vasodilator and Vasoconstrictor Mechanisms in Temperature Regulation. Compr. Physiol. 2014, 4, 33–89. [Google Scholar] [CrossRef]
  69. Savastano, D.M.; Gorbach, A.M.; Eden, H.S.; Brady, S.M.; Reynolds, J.C.; Yanovski, J.A. Adiposity and human regional body temperature. Am. J. Clin. Nutr. 2009, 90, 1124–1131. [Google Scholar] [CrossRef] [Green Version]
  70. Ooijen, A.M.C.-V.; Westerterp, K.R.; Wouters, L.; Schoffelen, P.F.; Van Steenhoven, A.A.; Lichtenbelt, W.D.V.M. Heat Production and Body Temperature During Cooling and Rewarming in Overweight and Lean Men. Obesity 2006, 14, 1914–1920. [Google Scholar] [CrossRef] [Green Version]
  71. Montgomery, P.G.; Pyne, D.; Hopkins, W.G.; Dorman, J.C.; Cook, K.; Minahan, C. The effect of recovery strategies on physical performance and cumulative fatigue in competitive basketball. J. Sports Sci. 2008, 26, 1135–1145. [Google Scholar] [CrossRef]
  72. Ferreira-Junior, J.B.; Bottaro, M.; Vieira, A.; Siqueira, A.F.; Vieira, C.A.; Durigan, J.L.Q.; Cadore, E.L.; Coelho, L.G.M.; Simões, H.G.; Bemben, M.G. One session of partial-body cryotherapy (-110 degrees C) improves muscle damage recovery. Scand. J. Med. Sci. Sports. 2015, 25, e524–e530. [Google Scholar] [CrossRef]
  73. Banfi, G.; Colombini, A.; Lombardi, G.; Lubkowska, A. Metabolic markers in sports medicine. Adv. Clin. Chem. 2012, 56, 1–54. [Google Scholar] [CrossRef]
  74. Nybo, L.; Girard, O.; Mohr, M.; Knez, W.; Voss, S.; Racinais, S. Markers of Muscle Damage and Performance Recovery after Exercise in the Heat. Med. Sci. Sports Exerc. 2013, 45, 860–868. [Google Scholar] [CrossRef]
  75. Koury, J.C.; Daleprane, J.B.; Pitaluga-Filho, M.V.; de Oliveira, C.F.; Gonçalves, M.C.; Passos, M.C. Aerobic Conditioning Might Protect Against Liver and Muscle Injury Caused by Short-Term Military Training. J. Strength Cond. Res. 2016, 30, 454–460. [Google Scholar] [CrossRef]
  76. Banfi, G.; Morelli, P. Relation between body mass index and serum aminotransferases concentrations in professional athletes. J. Sports Med. Phys. Fit. 2008, 48, 197–200. [Google Scholar]
  77. Fernandes, A.D.A.; Pimenta, E.M.; Moreira, D.G.; Sillero-Quintana, M.; Marins, J.C.B.; Morandi, R.F.; Kanope, T.; Garcia, E. Effect of a professional soccer match in skin temperature of the lower limbs: A case study. J. Exerc. Rehabil. 2017, 13, 330–334. [Google Scholar] [CrossRef]
  78. Varley, I.; Lewin, R.; Needham, R.; Thorpe, R.T.; Burbeary, R. Association Between Match Activity Variables, Measures of Fatigue and Neuromuscular Performance Capacity Following Elite Competitive Soccer Matches. J. Hum. Kinet. 2017, 60, 93–99. [Google Scholar] [CrossRef]
  79. Fatouros, I.G.; Chatzinikolaou, A.; Douroudos, I.I.; Nikolaidis, M.G.; Kyparos, A.; Margonis, K.; Michailidis, Y.; Vantarakis, A.; Taxildaris, K.; Katrabasas, I.; et al. Time-Course of Changes in Oxidative Stress and Antioxidant Status Responses Following a Soccer Game. J. Strength Cond. Res. 2010, 24, 3278–3286. [Google Scholar] [CrossRef]
  80. Russell, M.; Northeast, J.; Atkinson, G.; Shearer, D.A.; Sparkes, W.; Cook, C.J.; Kilduff, L.P. Between-Match Variability of Peak Power Output and Creatine Kinase Responses to Soccer Match-Play. J. Strength Cond. Res. 2015, 29, 2079–2085. [Google Scholar] [CrossRef] [Green Version]
  81. Vaile, J.; O’Hagan, C.; Stefanovic, B.; Walker, M.A.; Gill, N.; Askew, C. Effect of cold water immersion on repeated cycling performance and limb blood flow. Br. J. Sports Med. 2011, 45, 825–829. [Google Scholar] [CrossRef] [PubMed] [Green Version]
  82. Gregson, W.; Black, M.A.; Jones, H.; Milson, J.; Morton, J.P.; Dawson, B.T.; Atkinson, G.; Green, D.J. Influence of Cold Water Immersion on Limb and Cutaneous Blood Flow at Rest. Am. J. Sports Med. 2011, 39, 1316–1323. [Google Scholar] [CrossRef] [PubMed]
  83. Wilcock, I.M.; Cronin, J.B.; Hing, W.A. Physiological response to water immersion: A method for sport recovery? Sports Med. 2006, 36, 747–765. [Google Scholar] [CrossRef] [PubMed]
  84. Taylor, N.A.; Machado-Moreira, C.A. Regional variations in transepidermal water loss, eccrine sweat gland density, sweat secretion rates and electrolyte composition in resting and exercising humans. Extrem. Physiol. Med. 2013, 2, 4. [Google Scholar] [CrossRef] [Green Version]
  85. Smith, C.J.; Havenith, G. Body mapping of sweating patterns in male athletes in mild exercise-induced hyperthermia. Eur. J. Appl. Physiol. 2011, 111, 1391–1404. [Google Scholar] [CrossRef] [Green Version]
  86. O’Brien, C.; Cadarette, B.S. Quantification of head sweating during rest and exercise in the heat. Eur. J. Appl. Physiol. 2013, 113, 735–741. [Google Scholar] [CrossRef]
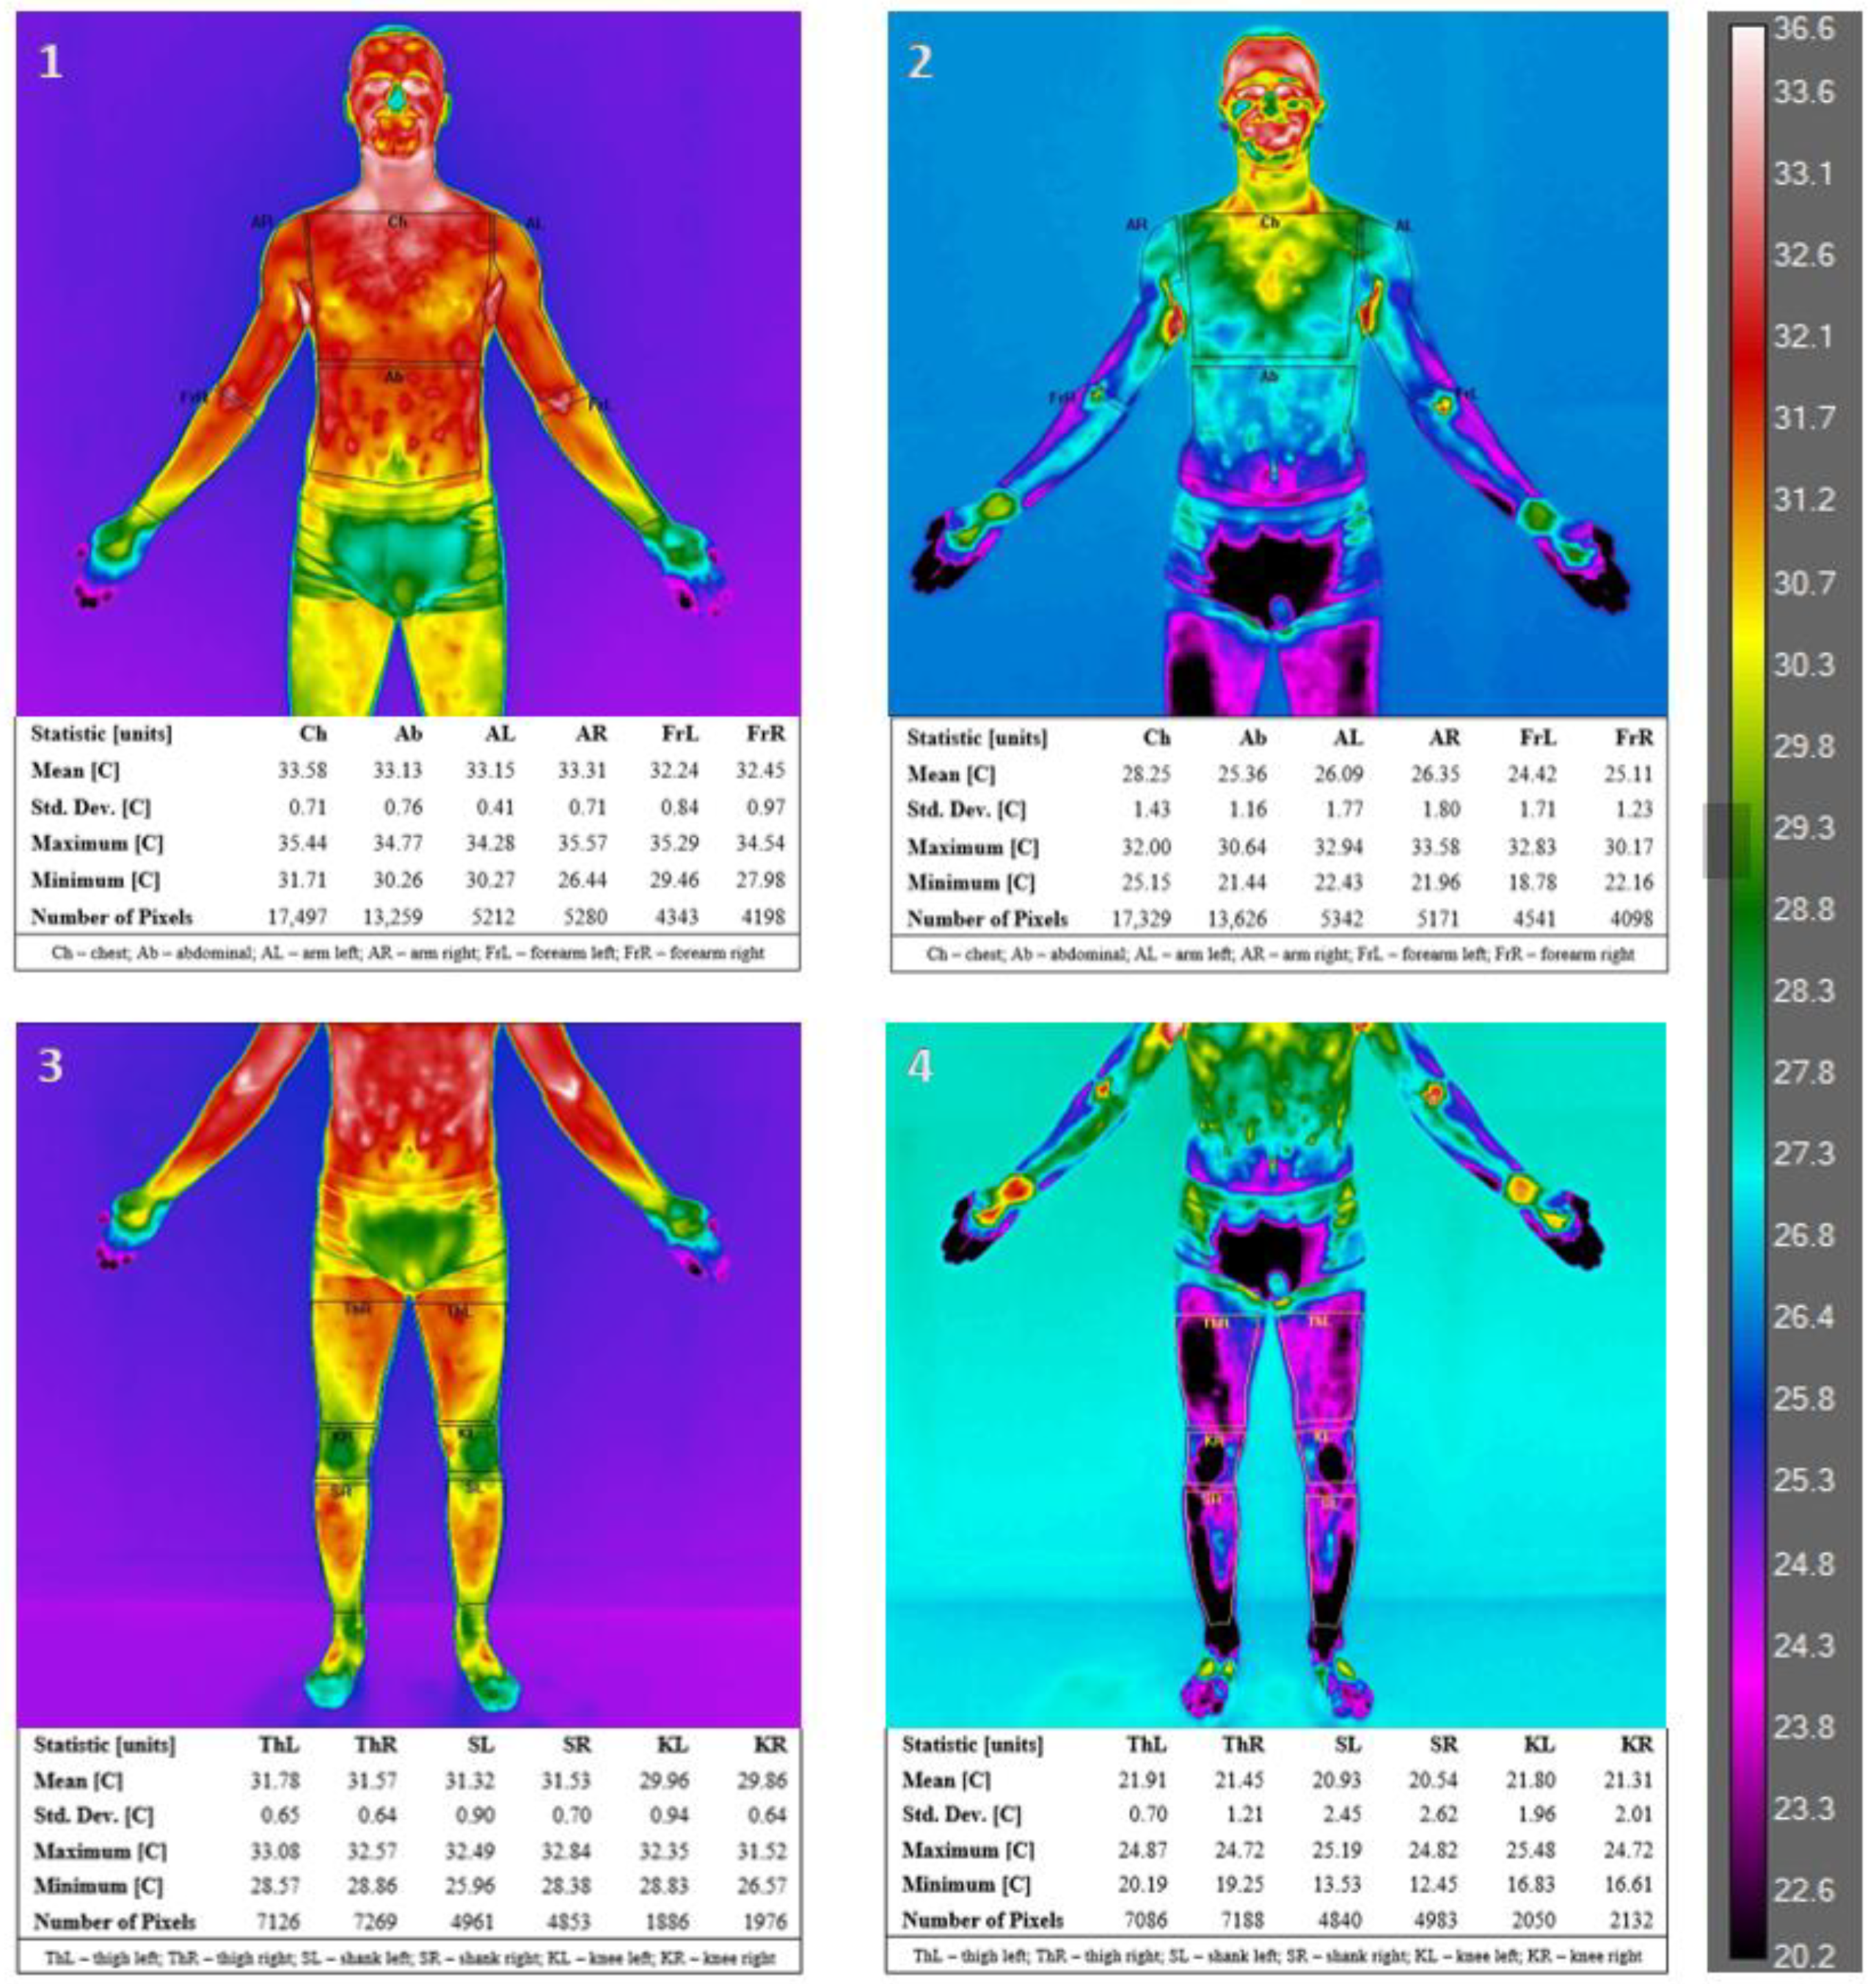
Figure 1. Sample thermographic photos before (1 and 3) and after (2 and 4) partial body cryostimulation for the front view. Legend: Ch—chest; Ab—abdominal; AL—left arm; AR—right arm; FrL—left forearm; FrR—right forearm; ThL—left thigh; ThR—right thigh; SL—left shank; SR—right shank; KL—left knee; KR—right knee.
Applsci 13 04123 g001
Figure 2. Sample thermographic photos before (1 and 3) and after (2 and 4) partial body cryostimulation for the back view. Legend: Ch—chest; Ab-abdominal; AL—left arm; AR—right arm; FrL—left forearm; FrR—right forearm; ThL—left thigh; ThR—right thigh; SL—left shank; SR—right shank; KL—left knee; KR-right knee.
Applsci 13 04123 g002
Figure 3. Mean values of skin temperature changes in selected areas of the body after the PBC procedure compared to the baseline temperature.
Applsci 13 04123 g003
Figure 4. Relationship between body fat percentage and the magnitude of change in temperature of the anterior and posterior surfaces of the thighs.
Applsci 13 04123 g004
Figure 5. Relationship between body fat content and the magnitude of change in temperature of the anterior and posterior surfaces of the thighs.
Applsci 13 04123 g005
Figure 6. Relationship between body fat and the magnitude of change in temperature of the forearm front and chest. Legend: Fr—forearm; Ch—chest.
Applsci 13 04123 g006
Figure 7. Relationship between body fat percentage and the magnitude of change in temperature of the forearm front and chest. Legend: Fr—forearm; Ch—chest.
Applsci 13 04123 g007
Figure 8. Relationship between systolic blood pressure and the magnitude of change in temperature of the anterior and posterior surfaces of the thighs.
Applsci 13 04123 g008
Figure 9. Relationship between diastolic blood pressure and the magnitude of change in temperature of the anterior and posterior surfaces of the thighs.
Applsci 13 04123 g009
Figure 10. Relationship between %TBW and the magnitude of change in temperature of the anterior and posterior surfaces of the thighs, chest, and forearm front. Legend: Fr—forearm; Ch—chest.
Applsci 13 04123 g010
Figure 11. Creatine kinase concentrations before and after the match and in the course of post-exercise regeneration with the use of partial body cryostimulation. ** significant difference vs. CKpre at p < 0.01; *** significant difference vs. CKpre at p < 0.001.
Applsci 13 04123 g011
Figure 12. Lactate dehydrogenase concentrations before and after the match and in the course of post-exercise regeneration with the use of partial body cryostimulation.
Applsci 13 04123 g012
Figure 13. Aspartate transaminase concentrations before and after the match and in the course of post-exercise regeneration with the use of partial body cryostimulation. *** significant differences vs. ASTpre at p < 0.001.
Applsci 13 04123 g013
Table 1. Characteristic of the subjects.
ParametersMean ± SDRange
(Min–Max)
Age [years]26 ± 619–36
Body mass [kg]77.4 ± 5.1067.6–88.2
Body hight [cm]181.6 ± 4.52174–191
BMI [kg/m2]23.4 ± 1.1522–25.5
FAT [%]9.6 ± 2.634–13.2
FAT [kg]7.5 ± 2.152.9–11
FFM [kg]70.0 ± 5.3358.7–79.6
MM [kg]66.6 ± 5.0855.8–75.7
TBW [kg]47.8 ± 3.2043–53.5
TBW [%]61.7 ± 2.2458–68
BM [kg]3.5 ± 0.213.2–3.9
SBP [mmHg]127 ± 11105–141
DBP [mmHg]69 ± 758–87
FAT [%]—body fat percentage; FAT [kg]—absolute body fat content; FFM—free fat mass; MM—muscle mass; TBW [%]—total body water percentage; TBW [kg]—total (absolute) body water content; BM—bone mass; SBP—systolic blood pressure; DBP—diastolic blood pressure.
Table 2. Descriptive statistics of the temperature values (Tmean) of the selected body surface areas and the results of the significance tests of differences between the temperature before and after PBC.
Body AreaMean ± SD [°C]Student’s t-Test
Tpre vs. Tpost
Right/LeftTpreTpostTp
Upper
Limb
[UL]
ARfront32.92 ± 0.5925.97 ± 1.9412.88280.0000 ***
L32.99 ± 0.6326.00 ± 2.1112.42080.0000 ***
Rback31.35 ± 0.7623.76 ± 1.7218.50290.0000 ***
L31.43 ± 0.8223.26 ± 1.5922.70500.0000 ***
FrRfront32.17 ± 0.5525.14 ± 2.4510.84960.0000 ***
L32.01 ± 0.8724.97 ± 2.4412.01040.0000 ***
Rback32.43 ± 0.5825.63 ± 1.3519.46160.0000 ***
L32.40 ± 0.8825.53 ± 1.4221.75100.0000 ***
Lower
Limb
[LL]
ThRfront30.92 ± 0.7220.20 ± 2.6015.39240.0000 ***
L30.98 ± 0.7020.27 ± 2.6615.20460.0000 ***
Rback31.67 ± 0.8121.80 ± 1.8621.22070.0000 ***
L31.47 ± 0.6121.40 ± 1.9017.86510.0000 ***
KRfront29.64 ± 1.5320.59 ± 2.3315.85670.0000 ***
L29.79 ± 1.5620.94 ± 2.3218.44140.0000 ***
Rback32.49 ± 0.5123.30 ± 1.5524.59380.0000 ***
L32.37 ± 0.4623.29 ± 1.5324.11890.0000 ***
SRfront31.95 ± 0.8923.10 ± 2.5514.14310.0000 ***
L31.81 ± 0.8023.37 ± 3.1610.65360.0000 ***
Rback31.57 ± 0.9022.64 ± 2.5414.23100.0000 ***
L31.46 ± 0.8822.56 ± 3.0412.61180.0000 ***
TrunkCh33.39 ± 0.6026.79 ± 1.4916.54710.0000 ***
Ab33.04 ± 0.9423.70 ± 2.4017.01420.0000 ***
UB33.59 ± 0.4127.50 ± 1.2418.40110.0000 ***
LB33.12 ± 0.6124.25 ± 1.5821.61130.0000 ***
UL—upper limb; LL—lower limb; A—arm; Fr—forearm; H—hand; Th—thigh; K—knee; S—shank; Ch—chest; Ab—abdomen; UB—upper back; LB—lower back; ***—p < 0.001.
Disclaimer/Publisher’s Note: The statements, opinions and data contained in all publications are solely those of the individual author(s) and contributor(s) and not of MDPI and/or the editor(s). MDPI and/or the editor(s) disclaim responsibility for any injury to people or property resulting from any ideas, methods, instructions or products referred to in the content.