Abstract
This study proposes a method for determining obstruction of the endotracheal tube (ET) and its degree and location. Respiratory signals were acquired using a three sensor (microphone, pressure, and flow) integrated sensor connector. Obstruction classification involved pre-processing and feature extraction. During pre-processing, one cycle of the respiratory signal was extracted using respiratory cycle extraction and phase segmentation. The signal was then divided into three phases: (i) inspiratory phase, (ii) expiratory phase, and (iii) between both the phases, where the intrapulmonary pressure increased, decreased, and remained constant, respectively. In the feature extraction process, the results were quantified using absolute value average and texture analyses. Artificial ET tubes were fabricated to simulate the presence of foreign substances in the ET tube; they had different degrees of obstruction (0%, 20%, 40%, and 50%) and obstruction positions (Sections 1, 2, and 3). The experiment was performed by connecting the sensor connector and artificial ET tube between the ventilator and test lung. Respiratory signals were obtained in 10 cases by cross connecting the artificial ET tubes. The degree and location of obstruction were classified according to the average absolute value and texture analyses of the flow data. The obstruction can be determined through the texture analysis results using the combined microphone and flow sensor data. The proposed method is simple in configuration, can be readily used in existing setups, and can be operated regardless of surrounding noise.
1. Introduction
Endotracheal intubation is a medical procedure that involves inserting an endotracheal (ET) tube into the trachea to maintain an open airway that connects the ET tube to a ventilator. It is primarily used for patients who cannot breathe independently due to issues such as respiratory failure and loss of consciousness during anesthesia, as well as in intensive care situations. Consequently, it can be directly associated with the maintenance of a patient’s life. Hence, during intubation, a bent ET tube or one clogged by foreign substances that settle inside the tube after intubation can lead to fatal consequences, such as carbon dioxide retention, hyperventilation, or lung infection, threatening the life of the patient [,]. Foreign substances, such as sputum, vomit, or hemorrhage, that block the ET tube must be removed using a suction catheter, or the tube must be replaced with a new tube [,]. However, during extubation, side effects such as infection or damage to the patient’s airway may occur []. Therefore, medical staff prefer to remove foreign substances through suction before the tube clogs to the extent that removal becomes difficult [].
Currently, ventilators do not provide any information on the degree of obstruction in the ET tube, and healthcare workers must manually check the degree of obstruction through auscultation at regular intervals or periodically apply suction, regardless of the absence or presence of obstruction [,]. Studies report that, in most hospitals, healthcare workers are required to attend to more than the recommended number of patients [,]. Hence, frequently checking intubated patients is difficult owing to their high workload. Additionally, skilled experts are required to distinguish between normal breathing, obstructive sounds, and breathing noise through auscultation [,]. Recently, a technique of automatically detecting the respiratory state of a patient using a ventilator and an electronic stethoscope [,] and a study to improve the convenience of homecare by linking it with a smart phone [] have been attempted. Although these studies have presented results on usefulness, utility and applicability, additional research is needed to provide information with high accuracy. Therefore, attempts are being made to develop a technology that automatically provides information on the degree of obstruction of the intubation tube so that suction can be performed only when necessary [,,,,,,,,,].
Most previous studies have conducted breath sound analyses using a microphone. ET tube obstruction was determined by frequency analysis of the patient’s breathing sounds using a spectrogram [,,]. A study was also conducted to classify normal and abnormal respiration through mel-frequency cepstral coefficient (MFCC) analysis using the breathing sounds of patients with various pathologies [,]. Additionally, studies have been conducted to analyze the presence of obstructions by extracting features through digital signal processing after recording lung sounds through auscultation [,]. Recently, several studies have used machine learning to increase the accuracy of analysis [,,,], and studies using two sensors, i.e., a microphone and a flow sensor, have also been conducted [,]. However, most of these studies only detected obstruction in the ET tube; the location and degree could not be determined. Moreover, they have insufficient accuracy.
Therefore, this study proposes a method that enables the acquisition of respiratory signals using three sensors (microphone, pressure, and flow sensors) and detects the presence, degree, and location of obstructions in the ET tube. The developed method, which uses an adapter-type sensor connector with three integrated sensors, can be used in existing ET intubation setups.
2. Materials and Methods
Figure 1 illustrates the device used in this study and the connection between the devices. Four types of devices were used: a ventilator (Savina 300, Drägerwerk AG & Co. KGaA, Lubeck, Germany) to control inspiration and expiration, a sensor connector to acquire respiratory signals, an ET tube with different degrees of obstruction, and a test lung (Drägerwerk AG & Co. KGaA, Lubeck, Germany) that simulates the lungs. These were connected in series. The ventilator was operated only in the pressure control ventilation (PCV) mode. The positive end expiratory pressure (PEEP) was set to 5 cmH2O, the respiratory rate (RR) was set to 20, and the inspiratory to expiratory ratio (I:E) was set to 1:2 cycles. Therefore, the inspiratory and expiratory phases were 1 and 2 s, respectively.
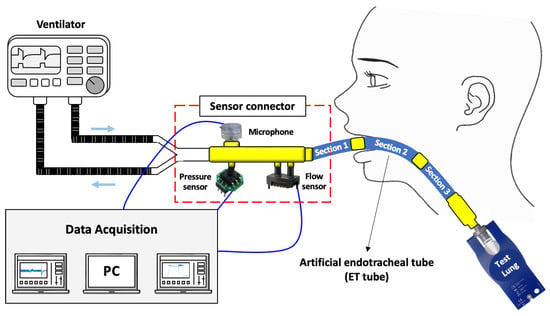
Figure 1.
Overall configuration of the experiment and diagram of connection between devices.
2.1. Collection of Respiratory Signals
In this study, changes in the respiration sound, pressure, and flow generated by the airflow in the ET tube were defined as respiratory signals. For respiratory sound measurement, a microphone SPW2430HR5H-B (Knowles Electronics, LLC., Itasca, IL, USA) with a bandwidth of 100 Hz to 10 kHz was used. The respiratory pressure in the tube was measured using a pressure sensor XGZP6847 (Wuhu CFSensor Co., Ltd., Wuhu, China) with a measurement range of 0–5 kPa and an accuracy of ±1.0%. The airflow in the tube was measured using a flow sensor SDP37 (Sensirion AG, Staefa, Switzerland) with a measuring range of ±125 Pa and an accuracy of ±3.0%.
Figure 2 shows the sensor connector for connecting the ventilator and ET tube while acquiring respiratory signals. The sensor connector was designed using SolidWorks software (Dassault Systèmes, Vélizy-Villacoublay, France) and printed with poly lactic acid (PLA) material using a 3D printer (Single Plus, CUBICON, Sungnam-si, Republic of Korea). The microphone was located on the upper surface of the sensor connector, and the pressure and flow sensors were located on the lower surface. The ventilator was connected to the left (larger-diameter side), and the ET tube was connected to the right (smaller-diameter side). After all of the sensors and devices were connected to the sensor connector, they were made airtight using epoxy. The overall dimensions of the sensor connector were 77 × 31 × 47 mm3. The three respiratory signals generated from the sensor module were stored on a PC using a data acquisition (DAQ) board and LabVIEW software (National Instruments, Austin, TX, USA). Finally, the sampling rate was set to 1 kHz for the pressure and flow sensors and 16 kHz for the microphone.
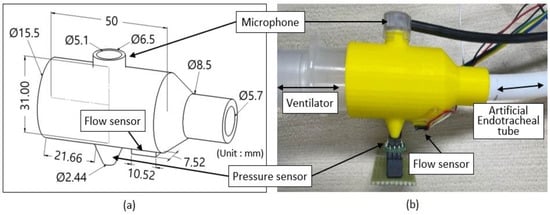
Figure 2.
Sensor connector for connecting ventilator and ET tube and acquisition of respiratory signals. (a) 3D drawing, and (b) actual view of the sensor connector to which the sensors are connected.
2.2. Artificial Endotracheal Tube
After ET intubation, the location and degree of foreign substances deposited in the ET tube vary depending on the patient’s condition and symptoms []. Therefore, an artificial ET tube was manufactured to acquire changes in the respiratory signal based on the location and degree of obstruction in the tube. The shape of the ET tube was designed using SolidWorks software; the tube had an inner diameter of 7.5 mm, a curvature of 162 R, and a total length of 30 cm, similarly to those used for adult patients. To simulate the various locations and degrees of obstruction, the artificial ET tube was divided into three parts of 10 cm each and printed with Agilus (Shore 95) material using a 3D printer (J850, Stratasys Ltd., Eden Prairie, MN, USA) (Figure 3a,b). The Shore hardness of the printed artificial ET tube measured by type OO using a durometer (GS-754G, TECLOCK, Nagano, Japan) was 95. Therefore, it was not distended or deformed even when the pressure change occurred in the ventilator. The degree of obstruction of each part was 0% when there was no foreign material compared to the cross-Sectional area of the tube, and 20%, 40%, and 50% obstructions were printed on a 30 cm long Section depending on the amount of foreign material (Figure 3c). Three 10 cm long tubes of equal proportions were made, and they were cross-connected to each other to adjust the location and degree of obstruction (Figure 3d). The obstruction locations were named Sections 1, 2, and 3.
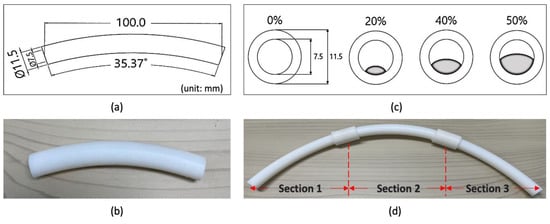
Figure 3.
Artificial ET tube that simulates each location and degree of obstruction. (a) Artificial ET tube drawing; (b) 10 cm artificial ET tube, three according to the degree of obstruction and control (20% to 50%), three according to the location of obstruction (Sections 1 to 3), for a total of 12 pieces; (c) cross-Sections for degree of obstruction (20%, 40%, and 50%); and (d) an artificial ET tube consisting of three interconnected tubes.
2.3. Experimental Paradigm
Respiratory signals were recorded at five 20 s intervals, and each interval consisted of four respiratory cycles. The experiment was conducted by cross-connecting 10 cm artificial ET tubes. When foreign substances existed only near the mouth, 20%, 0%, and 0% ET tubes were connected to Sections 1, 2, and 3, respectively. Subsequently, 46 cases were tested by changing the artificial ET tube according to the location (Sections 1, 2, and 3) and degree of obstruction (0%, 20%, 40%, and 50%).
2.4. Data Analysis
Respiratory signal analysis was performed using the following steps: pre-processing, feature extraction, absolute value average analysis, and texture analysis. Data conditioning and segmentation were conducted during pre-processing. Next, statistical characteristic analysis was employed for feature extraction using texture analysis. All analyses were performed using MATLAB (MathWorks, Inc., Natick, MA, USA). Figure 4 shows a step-by-step block diagram of the analysis of the respiratory signals.

Figure 4.
Flowchart of respiratory signal analysis.
2.4.1. Data Conditioning
To eliminate noise from the data, one average waveform was generated by adding all of the respiratory signals acquired over five iterations and dividing by five. Pre-processing and feature extraction were performed using this average waveform.
2.4.2. Respiratory Cycle Extraction and Phase Segmentation
A pressure signal was used to extract one respiratory cycle, including inspiratory and expiratory phases. The start and end points of the respiratory cycle were based on the minimum pressure waveform. When the ventilator injects air into the lungs, intrapulmonary pressure increases. The minimum value of the pressure was set as the starting point of the respiratory cycle. The pressure decreased as the lungs expelled air into the ventilator. The minimum value of this pressure was set as the endpoint of the respiratory cycle.
The flow rate signal was used to divide the inspiratory and expiratory phases within one respiratory cycle. A 20-point centered moving average was applied to the time series data sampled at 1 kHz. Subsequently, the moving average data were differentiated, and the point with a value close to 0, i.e., the midpoint in a state with little airflow between inspiratory and expiratory phases, was designated as Phase B. The point at which the differential value changed rapidly in the data before Phase B was set as the endpoint of the inspiratory phase (Phase A). In the data after Phase B, the point at which a sharp change in the differential value occurred was set as the starting point of the expiratory phase (Phase C).
2.4.3. Absolute Average Analysis for Flow Rate Data
The average flow rate signal was obtained using the data offset. Next, all values were converted into positive numbers using absolute values. The average value for each phase was extracted from the converted data.
2.4.4. Texture Analysis
Texture analysis is a method for quantifying the structural arrangement of pixels found in visual characteristics, such as the surface or roughness of an image or spatial change within an image. In this study, texture analysis was performed using three statistical features: average, skewness, and kurtosis. For the image, the spectrograms for the flow rate signal and for the signal combined with the microphone and flow sensor were used. A spectrogram image reflecting the change in the frequency component of the respiratory signal in accordance with time was obtained by calculating the short-time Fourier transform (STFT), which had an overlap of 0.015 s and a Blackman–Harris window of 0.03 s []. Finally, scaling was applied to adjust the spectrogram value to a range of 0–255 (Equation (1)).
S(m,n) denotes a spectrogram composed of m rows and n columns, and C(m,n) denotes the result of applying the scaling of the spectrogram. Texture analysis was applied to the scaled flow rate data as well as to the data combined with the microphone and flow rate data (Equations (2)–(4)), where μ is the average, n is the data point of C(m,n), p is the mean of Ck, α3 is skewness, σ is standard deviation, α4 is kurtosis [].
3. Results
3.1. Acquisition of Respiratory Signals
Figure 5 shows the experimental environment for measuring respiratory signals. Except for the sensor connector and artificial ET tube, all components were medical devices used in hospitals.
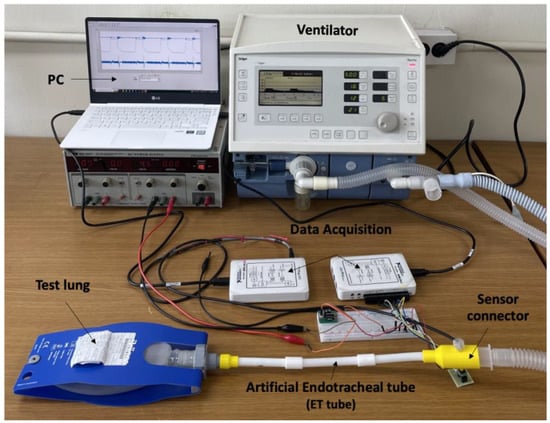
Figure 5.
Experimental environment for respiratory signal measurement.
Figure 6 shows the signals acquired from the sensor connector. Figure 6a–c show the signals for 50%, 40%, and 20% obstruction in Sections 1, 2, and 3, respectively. Respiratory sound, pressure, and flow rate were well measured at the same time in all repeated respiratory cycles. The result of extracting one respiratory cycle is highlighted in Figure 6c. All of the respiratory signals were acquired based on the pressure signal. As the pressure signal was used, the separation was clear even in the presence of external noise.

Figure 6.
Pressure, flow rate, and microphone signals acquired from the sensor connector: (a) Section 1 (location of obstruction) with 50% (degree of obstruction) waveform, (b) Section 2 with 40% waveform, and (c) Section 3 with 20% waveform and highlighted results of extracting one respiratory cycle based on the pressure signal.
Figure 7 shows the results of dividing one respiratory cycle into respiratory phases. The inspiratory phase Section, the region before the left vertical line, was classified as Phase A; the inspiratory maintenance phase, the middle region, was classified as Phase B; and the expiratory phase, the region after the right vertical line, was classified as Phase C.
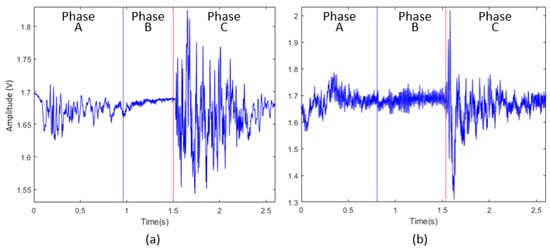
Figure 7.
Classification of respiratory phases for one respiratory cycle: (a) waveform showing phase dividing line in flow rate data, (b) waveform showing phase dividing line in signal obtained by adding microphone and flow rate data.
3.2. Feature Extraction Results
Paired t-tests were performed on the degree of obstruction (0%, 20%, 40%, and 50%) between all Sections (1, 2, and 3) for Phases A, B and C, respectively. Thereafter, the presence, degree, and location of obstruction were determined through absolute average and texture analyses.
3.2.1. Absolute Average Analysis Results
Analysis of the average absolute values for Phases A, B, and C for flow rate revealed that only Phase C showed statistical significance in degree and location of obstruction. The mean analysis of the absolute value of the control in the absence and presence of foreign substances revealed that the control data for flow rate showed a significant difference in all Sections and degrees of obstruction except for the 20% obstruction case of Section 1 (p = 0.583) (Table 1). As a result of the significance test for all Sections and all degrees of obstruction, there were significant differences (p < 0.05) in all experimental trials except for between 20% and 50% (p = 0.154) in Section 2 and between 40% and 50% in Section 3 (p = 0.263).

Table 1.
Statistical significance test results of absolute average analysis for all Sections and degrees of obstruction compared to flow rate control conditions.
Figure 8 shows the graph of the results of the absolute average analysis. In terms of the degree of obstruction, in Section 1, the absolute average increased with an increase in the degree of obstruction from 20% to 40% and 50%. At 20% obstruction, the value was similar to that of the control. In Section 2, no trends were observed. In Section 3, unlike Section 1, the value decreased with an increase in the degree of obstruction. Table 2 presents the linear model results for the degree of obstruction according to the location of obstruction. For the same degree of obstruction, the value decreased as the distance of the obstruction from the mouth increased from Sections 1 to 2 and 3.
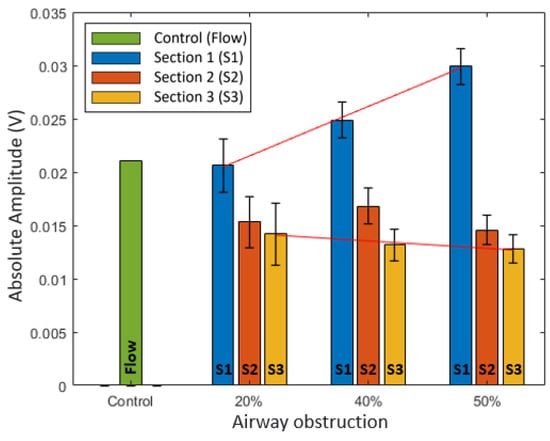
Figure 8.
Graph of absolute average analysis result for Phase C of flow.

Table 2.
Linear model results of absolute average analysis for degrees of obstruction in accordance with location of obstruction.
3.2.2. Texture Analysis Results
Texture analysis of Phases A, B, and C for flow revealed that only Phase C showed significant results. The texture analysis of average data revealed that the control data for flow showed significant differences except for the 20% obstruction case of Section 2 (p = 0.806) and 40% obstruction case of Section 3 (p = 0.134) (Table 3). Analysis of the degree of obstruction between all Sections and by Section indicated significant differences in all cases (p < 0.05) except for between 40% and 50% obstruction cases of Section 2 (p = 0.337). Both the location and degree of obstruction were significant in the combined microphone and flow sensor signal.

Table 3.
Statistical significance test results of texture analysis for average by all Sections and degrees of obstruction against flow control conditions.
Figure 9 shows the texture analysis results. Figure 9a shows the average results of the texture analysis. The combined microphone and flow rate data showed the largest values compared to all other degrees and locations of obstruction. The averaged flow data results of the texture analysis showed a trend similar to that of the absolute average analysis results. Figure 9b,c show the skewness and kurtosis of the texture analysis, respectively. The combined microphone and flow sensor data showed the smallest value compared with all other degrees and locations of obstruction. The degree of obstruction results for Section 1 showed that the value was lower with a higher degree of obstruction and the value at 20% obstruction was similar to that of the control. In Section 2, no trend was observed. In Section 3, unlike in Section 1, the value increased with an increase in the degree of obstruction. Table 4 shows the linear model results for the degree of obstruction according to the location of obstruction. The location of obstruction results showed that the value increased as the location of obstruction moved away from the mouth, regardless of the degree of obstruction.

Figure 9.
Texture analysis result graph for Phase C of flow and microphone + flow. (a) Average result graph, (b) skewness result graph, and (c) kurtosis result graph.

Table 4.
Linear model results of texture analysis for degrees of obstruction in accordance with location of obstruction.
4. Discussion
This study aimed to design a method for determining the presence, degree, and location of obstruction in an ET tube used for ET intubation. A sensor connector was fabricated to measure the signals of respiratory sound, pressure, and flow generated by respiration using three sensors, and a simulation experiment was conducted using medical devices. The presence, degree, and location of obstruction were determined through texture analysis using the combined microphone and flow sensor data. The degree and location of obstruction could be determined through absolute average and texture analyses of flow rate data. Therefore, it was possible to determine all cases by texture analysis, and cross-validation of degree and location was possible by absolute average analysis.
Most previous studies have focused solely on determining the presence of an obstruction. Recently, AI techniques, such as machine learning or deep learning, have been used to increase accuracy [,,]. AI requires complex algorithms and high-performance hardware for computation, as well as a large amount of reliable data to ensure high accuracy.
The method in this study has the following three characteristics. First, the sensor connector can be configured using commercially available microphones, pressure sensors, and flow sensors. As it uses a general signal processing method, involving only Phase C of the respiratory cycle defined in this study, it can be implemented with general-purpose hardware. The connector was manufactured as an adapter-type connector, which can be connected between the ventilator and the ET tube, ensuring its easy use.
Second, the method enables respiratory signal analysis even in the presence of external noise. Most previous studies primarily used microphones, which are vulnerable to ambient noise. As intubated patients tend to be critically ill, they are likely to require various medical devices with mechanical operation sounds and electrical alarms operating at the same time. As this study primarily used changes in pressure and flow rate due to respiration, the influence of ambient noise was minimal.
Third, the method developed in this study provided information on not only the presence of obstruction but also the degree and location of such an obstruction. In Section 1, the absolute average and average value of texture analysis increased as the degree of obstruction increased, whereas these values decreased in Section 3. The average value may have increased due to an increase in the velocity of the flow as the degree of obstruction in Section 1 increased which is located closer to the sensor connector. In Section 3, as the flow moved a distance of 20 cm while passing through Sections 1 and 2, the flow velocity further decreased, and the flow rate value becomes decreased. The skewness and kurtosis of the texture analysis showed trends opposite to those of the absolute average analysis. Skewness is an indicator of the asymmetry of a probability distribution. As the average increased, the skewness decreased as the distribution changed. Kurtosis is a measure of the frequency of the tail compared to the center of the distribution. As the degree of obstruction increased, the kurtosis decreased as the frequency spectrum expanded with noise. Such characteristics may have contributed to the opposing results. Therefore, the degree and location of obstruction can be mutually verified through the results of the absolute average and texture analyses. Section 2, the middle part of the ET tube, did not show any linearly correlated trend. This was probably due to the occurrence of turbulence in the middle of the ET tube as the degree of obstruction increased [,].
In the absolute mean analysis, the control condition of flow rate and the degree of obstruction at 20% in Section 1 were not significantly different from each other. However, the statistical significance test results for the texture analysis were significant. This may have been due to the fact that the change in flow rate was not large even when it was obstructed by up to 20%. Therefore, analysis of the small degree of obstruction meant that the texture analysis, including the frequency analysis, was more appropriate than the method using only the size of the signal. Some conditions in Section 3 were not significant. As the experiment on the different degrees of obstruction in Section 3 showed some significance, increasing the dataset would likely lead to significant results.
5. Conclusions
This study proposed a method for obtaining obstruction information from respiratory signals using three sensors, absolute average analysis, and texture analysis. The proposed method could determine whether the respiratory signal was obstructed, as well as the degree and location of obstruction. Additionally, the method could be used with general-purpose hardware that can be easily installed and employed in existing ET intubation setups. The limitations of this study are as follows. First, the obstruction conditions of the ET tube in this study were simulated; additional studies on actual intubated patients are needed. Second, breathing is accompanied by changes in humidity. Evaluating the behavior of the sensors used in the sensor connector under actual insertion conditions is necessary. Third, changes in experimental condition were performed for only one Section. Additional experiments on changes of two or more Sections will also be needed. Overall, the proposed method can be utilized with general-purpose hardware that can be easily installed and used in existing endotracheal intubation setups; hence, it has considerable clinical application potential.
Author Contributions
Conceptualization, H.K. and H.-S.K.; formal analysis, H.K., J.-K.P., J.A. and J.-H.Y.; data curation, J.-K.P., J.A. and J.-H.Y.; writing—original draft preparation, H.K., J.-K.P. and H.-S.K.; writing—review and editing, H.-S.K.; funding acquisition, H.-S.K. All authors have read and agreed to the published version of the manuscript.
Funding
This research received no external funding.
Institutional Review Board Statement
Not applicable.
Informed Consent Statement
Not applicable.
Data Availability Statement
The datasets generated and/or analyzed in this study are available from the corresponding author on reasonable request.
Acknowledgments
This work was supported by Konkuk University in 2022.
Conflicts of Interest
The authors declare no conflict of interest.
References
- Panditrao, M.M.; Bansal, R.B.; Panditrao, M.M. Unusual cause of airway obstruction after nasal intubation with a preformed endotracheal tube. J. Anaesthesiol. Clin. Pharmacol. 2020, 36, 429–430. [Google Scholar] [CrossRef] [PubMed]
- Lucchini, A.; Zanella, A.; Bellani, G.; Gariboldi, R.; Foti, G.; Pesenti, A.; Fumagalli, R. Tracheal Secretion Management in the Mechanically Ventilated Patient: Comparison of Standard Assessment and an Acoustic Secretion Detector. Respir. Care 2011, 56, 596–603. [Google Scholar] [CrossRef] [PubMed]
- Inoue, H.; Ito, J.; Uchida, H.; Morita, M.; Masuda, T.; Yamaya, K.; Hata, M.; Kato, S. Lower airway obstruction due to a massive clot resulting from late bleeding following mini-tracheostomy tube insertion and subsequent clot removal and re-intubation. JA Clin. Rep. 2017, 3, 16. [Google Scholar] [CrossRef] [PubMed]
- Kaushik, S.; Jain, G.; Gupta, N.; Saini, L.K.; Sindhwani, G. Retrieval of a tracheobronchial blood clot with a Yankauer suction catheter in complete airway obstruction. Acute Crit. Care 2021, 36, 78–80. [Google Scholar] [CrossRef]
- Joffe, A.; Barnes, C.R. Extubation of the potentially difficult airway in the intensive care unit. Curr. Opin. Anaesthesiol. 2022, 35, 122–129. [Google Scholar] [CrossRef]
- Wood, C.J. Endotracheal suctioning: A literature review. Intensiv. Crit. Care Nurs. 1998, 14, 124–136. [Google Scholar] [CrossRef]
- Bevis, R.; Elenbaas, J.; Stacy, K.M. Suctioning: Artificial Airway during Mechanical Ventilation (Respiratory Therapy); Elsevier: Amsterdam, The Netherlands, 2020. [Google Scholar]
- El Masry, A.; Williams, P.F.; Chipman, D.W.; Kratohvil, J.P.; Kacmarek, R.M. The impact of closed endotracheal suctioning systems on mechanical ventilator performance. Respir. Care 2005, 50, 345–353. [Google Scholar]
- Ball, J.E.; Bruyneel, L.; Aiken, L.H.; Sermeus, W.; Sloane, D.M.; Rafferty, A.M.; Lindqvist, R.; Tishelman, C.; Griffiths, P.; RN4Cast Consortium. Post-operative mortality, missed care and nurse staffing in nine countries: A cross-Sectional study. Int. J. Nurs. Stud. 2018, 78, 10–15. [Google Scholar] [CrossRef]
- McHugh, M.D.; Aiken, L.H.; Sloane, D.M.; Windsor, C.; Douglas, C.; Yates, P. Effects of nurse-to-patient ratio legislation on nurse staffing and patient mortality, readmissions, and length of stay: A prospective study in a panel of hospitals. Lancet 2021, 397, 1905–1913. [Google Scholar] [CrossRef]
- Sarkar, M.; Madabhavi, I.; Niranjan, N.; Dogra, M. Auscultation of the respiratory system. Ann. Thorac. Med. 2015, 10, 158–168. [Google Scholar] [CrossRef]
- Mwakanyanga, E.T.; Masika, G.M.; Tarimo, E.A.M. Intensive care nurses’ knowledge and practice on endotracheal suctioning of the intubated patient: A quantitative cross-Sectional observational study. PLoS ONE 2018, 13, e0201743. [Google Scholar] [CrossRef]
- Wei, T.-J.; Hsiung, P.-Y.; Liu, J.-H.; Lin, T.-C.; Kuo, F.-T.; Wu, C.-Y. Use of Electronic Auscultation in Full Personal Protective Equipment to Detect Ventilation Status in Selective Lung Ventilation: A Randomized Controlled Trial. Front. Med. 2022, 9, 851395. [Google Scholar] [CrossRef]
- Kim, Y.; Hyon, Y.; Lee, S.; Woo, S.-D.; Ha, T.; Chung, C. The coming era of a new auscultation system for analyzing respiratory sounds. BMC Pulm. Med. 2022, 22, 119. [Google Scholar] [CrossRef]
- Ferreira-Cardoso, H.; Jácome, C.; Silva, S.; Amorim, A.; Redondo, M.; Fontoura-Matias, J.; Vicente-Ferreira, M.; Vieira-Marques, P.; Valente, J.; Almeida, R.; et al. Lung Auscultation Using the Smartphone—Feasibility Study in Real-World Clinical Practice. Sensors 2021, 21, 4931. [Google Scholar] [CrossRef] [PubMed]
- Niu, J.; Cai, M.; Shi, Y.; Ren, S.; Xu, W.; Gao, W.; Luo, Z.; Reinhardt, J.M. A Novel Method for Automatic Identification of Breathing State. Sci. Rep. 2019, 9, 103. [Google Scholar] [CrossRef] [PubMed]
- Niu, J.; Shi, Y.; Cai, M.; Cao, Z.; Wang, D.; Zhang, Z.; Zhang, X.D. Detection of sputum by interpreting the time-frequency distribution of respiratory sound signal using image processing techniques. Bioinformatics 2018, 34, 820–827. [Google Scholar] [CrossRef] [PubMed]
- Rizal, A.; Hidayat, R.; Nugroho, H.A. Lung sounds classification using spectrogram’s first order statistics features. In Proceedings of the 2016 6th International Annual Engineering Seminar (InAES), Yogyakarta, Indonesia, 1–3 August 2016. [Google Scholar]
- Pramono, R.X.A.; Imtiaz, S.A.; Rodriguez-Villegas, E. Evaluation of mel-frequency cepstrum for wheeze analysis. In Proceedings of the 41st Annual International Conference of the IEEE Engineering in Medicine and Biology Society (EMBC), Berlin, Germany, 23–27 July 2019. [Google Scholar]
- Ingco, W.E.M.; Reyes, R.S.; Abu, P.A.R. Development of a Spectral Feature Extraction using Enhanced MFCC for Respiratory Sound Analysis. In Proceedings of the 2019 International SoC Design Conference (ISOCC), Jeju, Republic of Korea, 6–9 October 2019. [Google Scholar]
- Manir, S.B.; Karim, M.; Kiber, A. Assessment of Lung Diseases from Features Extraction of Breath Sounds Using Digital Signal Processing Methods. In Proceedings of the 2020 Emerging Technology in Computing, Communication and Electronics (ETCCE), Dhaka, Bangladesh, 21–22 December 2020. [Google Scholar]
- Moon, Y.-J.; Bechtel, A.J.; Kim, S.-H.; Kim, J.-W.; Thiele, R.H.; Blank, R.S. Detection of intratracheal accumulation of thick secretions by using continuous monitoring of respiratory acoustic spectrum: A preliminary analysis. J. Clin. Monit. Comput. 2020, 34, 763–770. [Google Scholar] [CrossRef]
- Shi, Y.; Wang, G.; Niu, J.; Zhang, Q.; Cai, M.; Sun, B.; Wang, D.; Xue, M.; Zhang, X.D. Classification of Sputum Sounds Using Artificial Neural Network and Wavelet Transform. Int. J. Biol. Sci. 2018, 14, 938–945. [Google Scholar] [CrossRef] [PubMed]
- Elad, D.; Soffer, G.; Zaretsky, U.; Wolf, M.; Shiner, R. Time-frequency analysis of breathing signals: In vitro airway model. Technol. Health Care 2001, 9, 269–280. [Google Scholar] [CrossRef]
- Park, Y.S.; Kee, Y.W.; Park, K.S.; Lee, J.; Lee, S.-M.; Yim, J.-J.; Yoo, C.-G.; Kim, Y.W.; Han, S.K.; Yang, S.-C. Sound Analysis in anIn VitroEndotracheal Tube Model. Korean J. Intern. Med. 2011, 26, 421–426. [Google Scholar] [CrossRef]
- Wiles, S.; Mireles-Cabodevila, E.; Neuhofs, S.; Mukhopadhyay, S.; Reynolds, J.P.; Hatipoğlu, U. Endotracheal Tube Obstruction Among Patients Mechanically Ventilated for ARDS Due to COVID-19: A Case Series. J. Intensiv. Care Med. 2021, 36, 604–611. [Google Scholar] [CrossRef] [PubMed]
- Santosh, K.C.; Hegad, R.S. Skewness and krutosis of apparent diffusion coefficient in human brain lesions to distinguish benign and malignant using MRI. In Recent Trends in Image Processing and Pattern Recognition, Proceedings of the 2nd International Conference on Recent Trends in Image Processing and Pattern Recognition (RTIP2R 2018), Solapur, India, 21–22 December 2018; Springer: Singapore, 2018. [Google Scholar]
- Kalpakli, A.; Örlü, R. Turbulent pipe flow downstream a 90° pipe bend with and without superimposed swirl. Int. J. Heat Fluid Flow 2013, 41, 103–111. [Google Scholar] [CrossRef]
Disclaimer/Publisher’s Note: The statements, opinions and data contained in all publications are solely those of the individual author(s) and contributor(s) and not of MDPI and/or the editor(s). MDPI and/or the editor(s) disclaim responsibility for any injury to people or property resulting from any ideas, methods, instructions or products referred to in the content. |
© 2023 by the authors. Licensee MDPI, Basel, Switzerland. This article is an open access article distributed under the terms and conditions of the Creative Commons Attribution (CC BY) license (https://creativecommons.org/licenses/by/4.0/).