Article

Characteristics of Dangerous Scenarios between Vehicles Turning Right and Pedestrians under Left-Hand Traffic

1
National Traffic Safety and Environment Laboratory, 7-42-27 Jindaiji-Higashi-machi, Chofu 182-0012, Tokyo, Japan
2
Faculty of Systems Design, Tokyo Metropolitan University, 6-6 Asahigaoka, Hino 191-0065, Tokyo, Japan
*
Author to whom correspondence should be addressed.
Appl. Sci. 2023, 13(7), 4189; https://doi.org/10.3390/app13074189
Submission received: 8 February 2023 / Revised: 20 March 2023 / Accepted: 22 March 2023 / Published: 25 March 2023

Abstract

:
Pedestrian deaths account for the highest percentage of fatality caused by traffic accidents in Japan. Increasing pedestrian safety is a key objective for reducing such deaths. For pedestrian fatality caused by vehicles at low speed, turning the vehicle toward the right was the most common behavior under left-hand traffic. Autonomous emergency braking (AEB) systems for pedestrian safety have great potential to mitigate pedestrian injuries and fatalities in traffic accidents. However, pedestrian-AEB systems, especially for vehicles turning right, are still under development. This study identified the characteristics of dangerous traffic scenarios between vehicles turning right and pedestrians, focusing on two directions of pedestrian crossing: from the left to the right side (Left-Pedestrian) and from the right to the left side (Right-Pedestrian). The ego vehicle recorded near-miss incidents using a drive recorder. The results revealed that the Left-Pedestrian and Right-Pedestrian scenarios had different features for both the width of roads going to and through the intersection and the average of the travel speeds of the ego vehicles. They had similar characteristics in terms of the presence of other vehicle categories, but differences in the relationship of numbers and/or travel directions of other vehicles. The findings of this study will contribute to the development and evaluation of safety systems for preventing collisions between right-turning vehicles and pedestrians at intersections.

1. Introduction

In 2021, there were 2636 traffic deaths in Japan; of these, pedestrian deaths accounted for the maximum number of deaths (941, 36%) [1]. Therefore, increasing pedestrian safety is a key objective for reducing casualties caused by traffic accidents.
In recent years, mobile phone networks [2], wireless fidelity (Wi-Fi) communication systems [3], combinations of mobile phone networks and Wi-Fi communication systems [4,5], and dedicated short-range communication (DSRC) technology [6,7] have been developed as wireless communication models that enable communication between vehicles and pedestrians. He et al. examined a responsive control method for a vehicle-to-pedestrian communication system and found that Bluetooth technology combined with DSRC could be effective for active pedestrian protection [8]. However, because such communication systems are still under development, further improvements are required to produce robust technology that can be used in real-world vehicle-to-pedestrian communication systems. Similar to other new safety technologies, autonomous emergency braking (AEB) systems for vehicles have been developed using onboard sensors to directly detect obstacles and apply automated braking to avoid collisions or reduce the impact of such collisions [9]. Pedestrian-AEB systems have great potential to mitigate pedestrian injuries and fatalities in traffic accidents [10,11,12]. Cicchino et al. investigated the effects of pedestrian-AEB systems from the analyses of real-world crash data and observed a significant decrease of 25–27% in pedestrian collision risk and 29–30% in pedestrian injury risk [13]. Haus et al. estimated that the risk of pedestrian fatality could be significantly mitigated by pedestrian-AEB systems based on a theoretical AEB model applied to the data of real-world vehicle collisions involving pedestrians [14]. In Japan, vehicles are driven on the left side of the road. For pedestrian fatality caused by vehicles at low speed, turning the vehicle toward the right was the most common behavior under left-hand traffic [15]. At intersections, there are multiple entities, such as pedestrians, bicycles, and other vehicles. In such an environment, when a driver operates the turning maneuver, those entities can cause a delay in the driver’s recognition, which may result in a collision accident [16]. Several advanced safety systems have been developed to prevent accidents involving pedestrians during turning maneuvers [17]. Currently, pedestrian-AEB systems, especially for vehicles turning right, are under development. Cicchino et al. indicated that there was no effective result for pedestrian-AEB systems while the vehicle was turning [13]. Few studies have revealed the features of some of the dangerous situations where turning vehicles encounter pedestrians. In order to develop and evaluate accident prevention safety systems specialized in right-turning vehicle scenarios, it is necessary to understand the dangerous scenarios between right-turning vehicles and pedestrians in situations in which vehicles travel on the left side of the road.
Several methodologies have been used for the research of road-user behaviors at intersections. For example, the method of discrete choice analysis is used for modeling the transportation behavior of choosing among discrete alternatives [18]. Sahu et al. investigated driver behaviors at intersections based on a survey questionnaire [19]. The analysis of traffic accident data is crucial for investigating the cause of accidents, but the amount of data is limited. Near-miss incidents occur more frequently than accidents, for which data have been obtained using a drive recorder mounted on vehicles. Therefore, this study focused on near-miss incidents, which were dangerous situations in which a driver manages to avoid a traffic accident by using the brake. Some studies have been conducted based on data from a drive recorder that analyzes the behaviors of drivers, cyclists, and pedestrians [20,21,22]. Matsui et al. derived similar vehicle-to-pedestrian approaches between fatal pedestrian accidents and near-miss incidents and indicated the effectiveness of using near-miss incident data for understanding dangerous situations [23]. Therefore, this study identified the characteristics of dangerous traffic scenarios between vehicles turning right and pedestrians. To date, studies evaluating road-user behaviors at intersections have been based on modeling, survey questionnaires, accidentology, and near-miss incidents. However, dangerous situations, such as those created between right-turning vehicles and pedestrians at intersections, have not been considered. Aimed at addressing this shortcoming, this study investigated dangerous scenarios between right-turning vehicles and pedestrians using near-miss incidents. Specifically, the characteristics of near-miss incidents in two pedestrian crossing directions were investigated: from the left to the right side (Left-Pedestrian) and from the right to the left side (Right-Pedestrian). The findings of this study can be used to build and evaluate the safety systems for preventing vehicles turning right from collisions with pedestrians at intersections.

2. Materials and Methods

In this study, using near-miss incident data, we investigated the characteristics of dangerous traffic scenarios involving vehicles turning right and pedestrians crossing the road.

2.1. Near-Miss Incident Data

The University of Agriculture and Technology, Japan, has collected near-miss incident data consisting of video recordings, vehicle travel speeds, accelerations, braking signals, and locations on a map [24,25]. These data were obtained from drive recorders installed on taxis (ego vehicles) [24]. A drive recorder consisting of a camera and three-dimensional accelerometers was installed on the inner side of the front window, with the angle of the camera fixed in the forward direction. The camera captured the front view at the rate of 30 frames per second. The data collection is triggered by the sudden braking by a driver at >0.5 G deceleration; the recorder captures data 10 s before and 5 s after the trigger incident. In the current study, we focused on near-miss incidents where a right-turning vehicle traveling on the left side of the road equipped with a drive recorder (hereafter referred to as an ego vehicle) was about to collide with pedestrians. We studied 112 video data (from 2005 to 2019) of right-turning vehicle–pedestrian near-miss incidents captured by drive recorders.

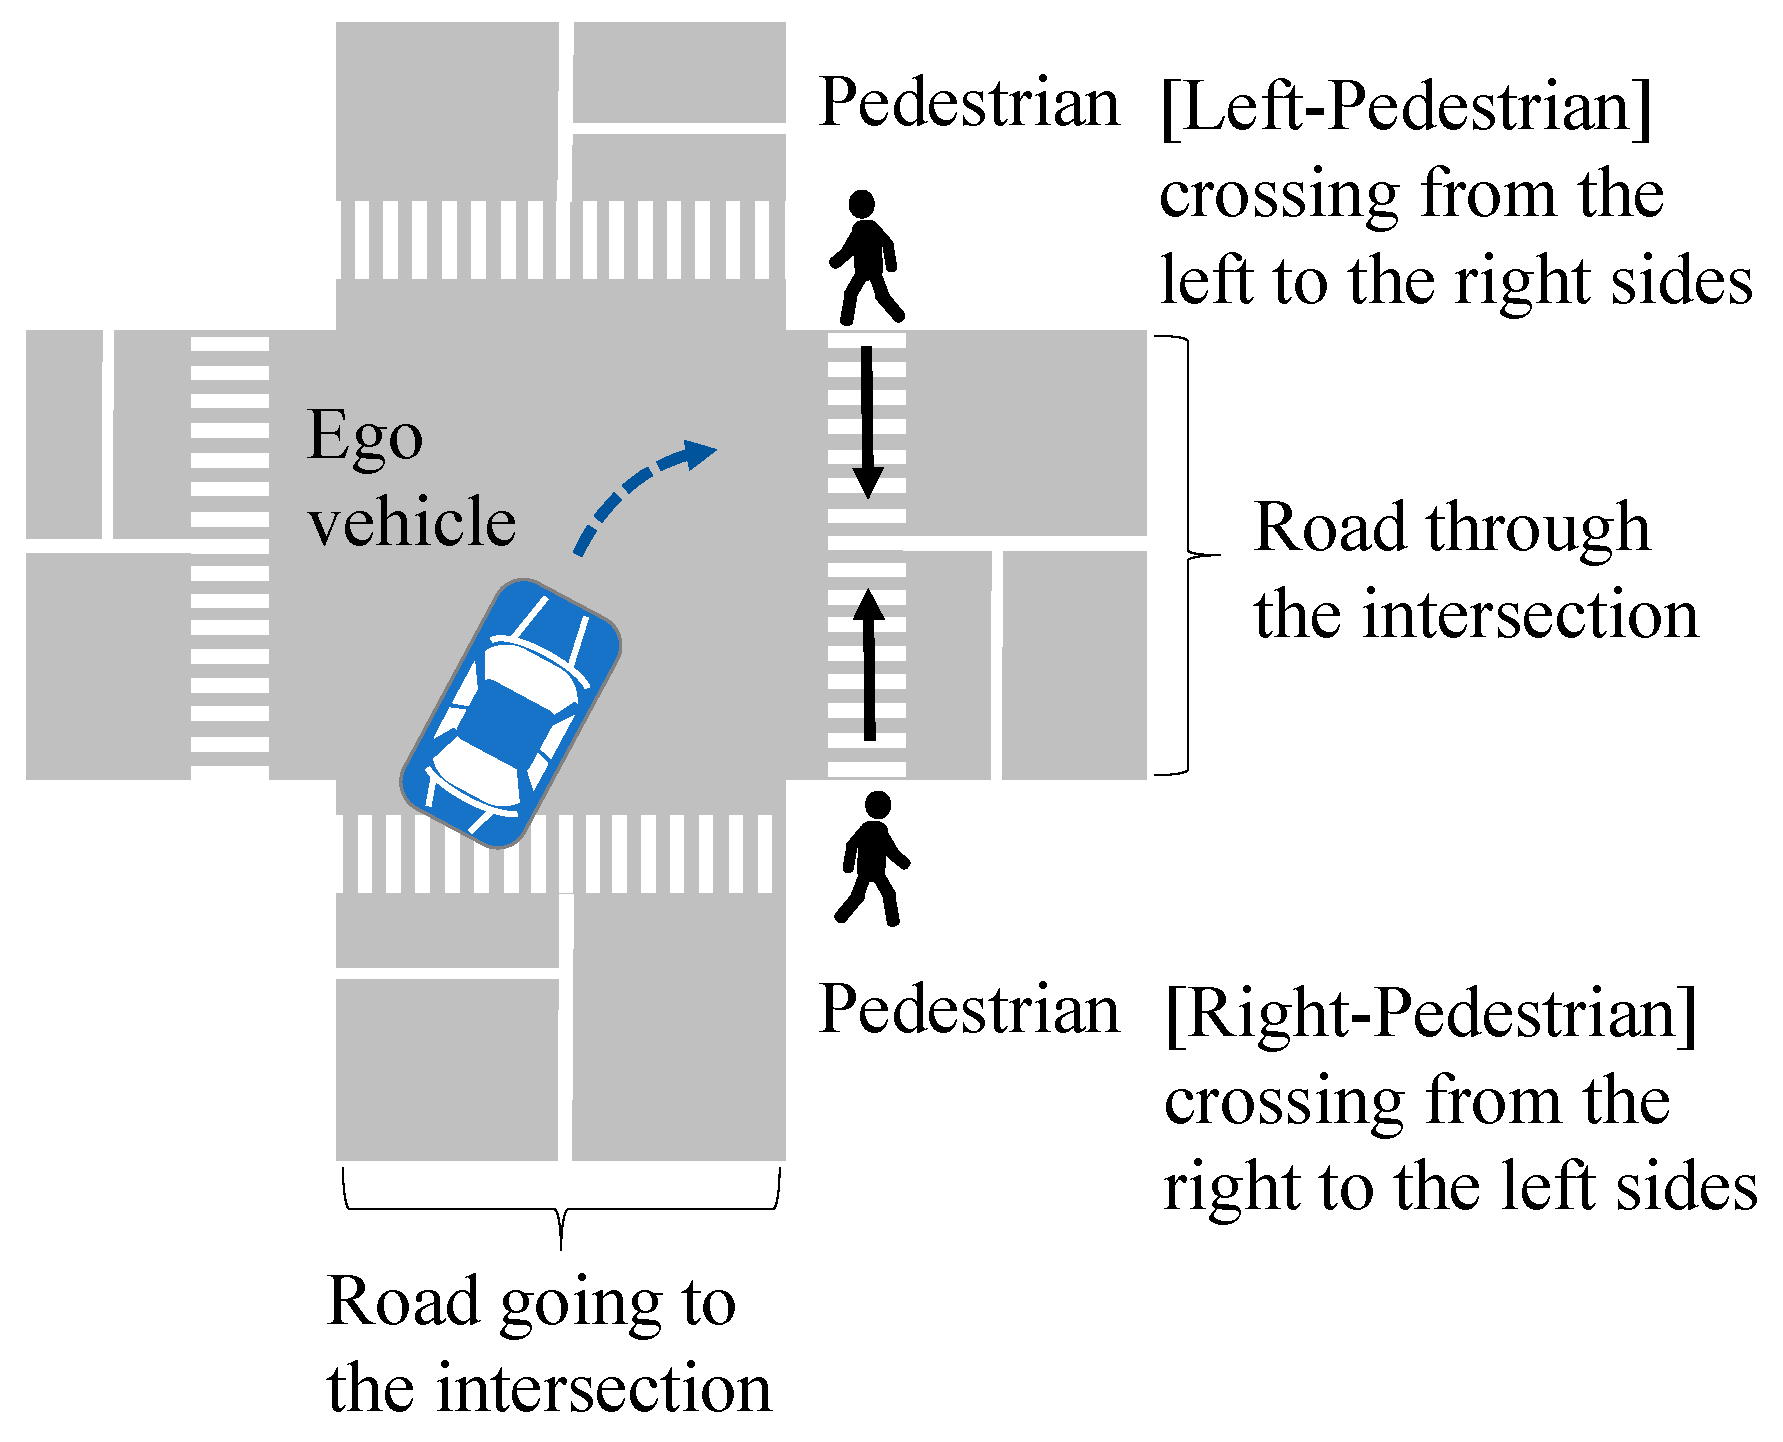
2.2. Road Environment

We investigated the weather, presence or absence of traffic lights for vehicles and pedestrians at intersections, road types, and widths based on the time of day (daytime or night-time). When the headlights of ego vehicles were lit, it was considered “night-time”. All other times were “daytime”.
The weather was classified into three categories: sunny, rainy, and snowy. Rain and snow were determined based on the video images, and all other weather conditions were defined as sunny. Foggy weather was included in the rainy condition. Moreover, we used video images to determine the presence of traffic lights for vehicles and pedestrians at intersections. Road types at intersections were classified into two categories: roads going to (the road before turning right) and through the intersection (the road after turning right) as shown in Figure 1. The width of a road is the total width of all sections (e.g., current lanes plus opposite lanes), regardless of the road type and the presence of median strips. The width of the road was classified into three categories—narrow (<5.5 m), medium (≥5.5 m, <13 m), and wide (≥13 m)—based on the information obtained from drive recorders, such as the images in the video and near-miss incident locations on the map.

2.3. Pedestrian Crossing Directions and Place (Crosswalk/Non-Crosswalk)

We investigated the crossing directions and crossing locations of pedestrians. The crossing directions of pedestrians were classified as Left-Pedestrian or Right-Pedestrian, which was based on the ego vehicle driver’s view, as shown in Figure 1. The pedestrian crossing locations were classified into two types: crosswalk and non-crosswalk. At the moment that the driver applied the brakes, the location was designated to be a “crosswalk” if a pedestrian was on the crosswalk; otherwise, the location was designated to be a “non-crosswalk” (when a pedestrian was not on the crosswalk).

2.4. Ego Vehicle Travel Speed

In near-miss incidents, the driver of an ego vehicle notices a pedestrian just in time to initiate braking. We investigated the vehicle’s speed in near-miss incidents immediately before the driver applied brakes to avoid collisions. Brake initiation was determined by the change in braking signal and deceleration. The vehicle speed was categorized into three ranges: ≤10 km/h for 1–10 km/h, ≤20 km/h for 11–20 km/h, and ≤30 km/h for 21–30 km/h. No incidents were reported at speeds greater than 30 km/h.

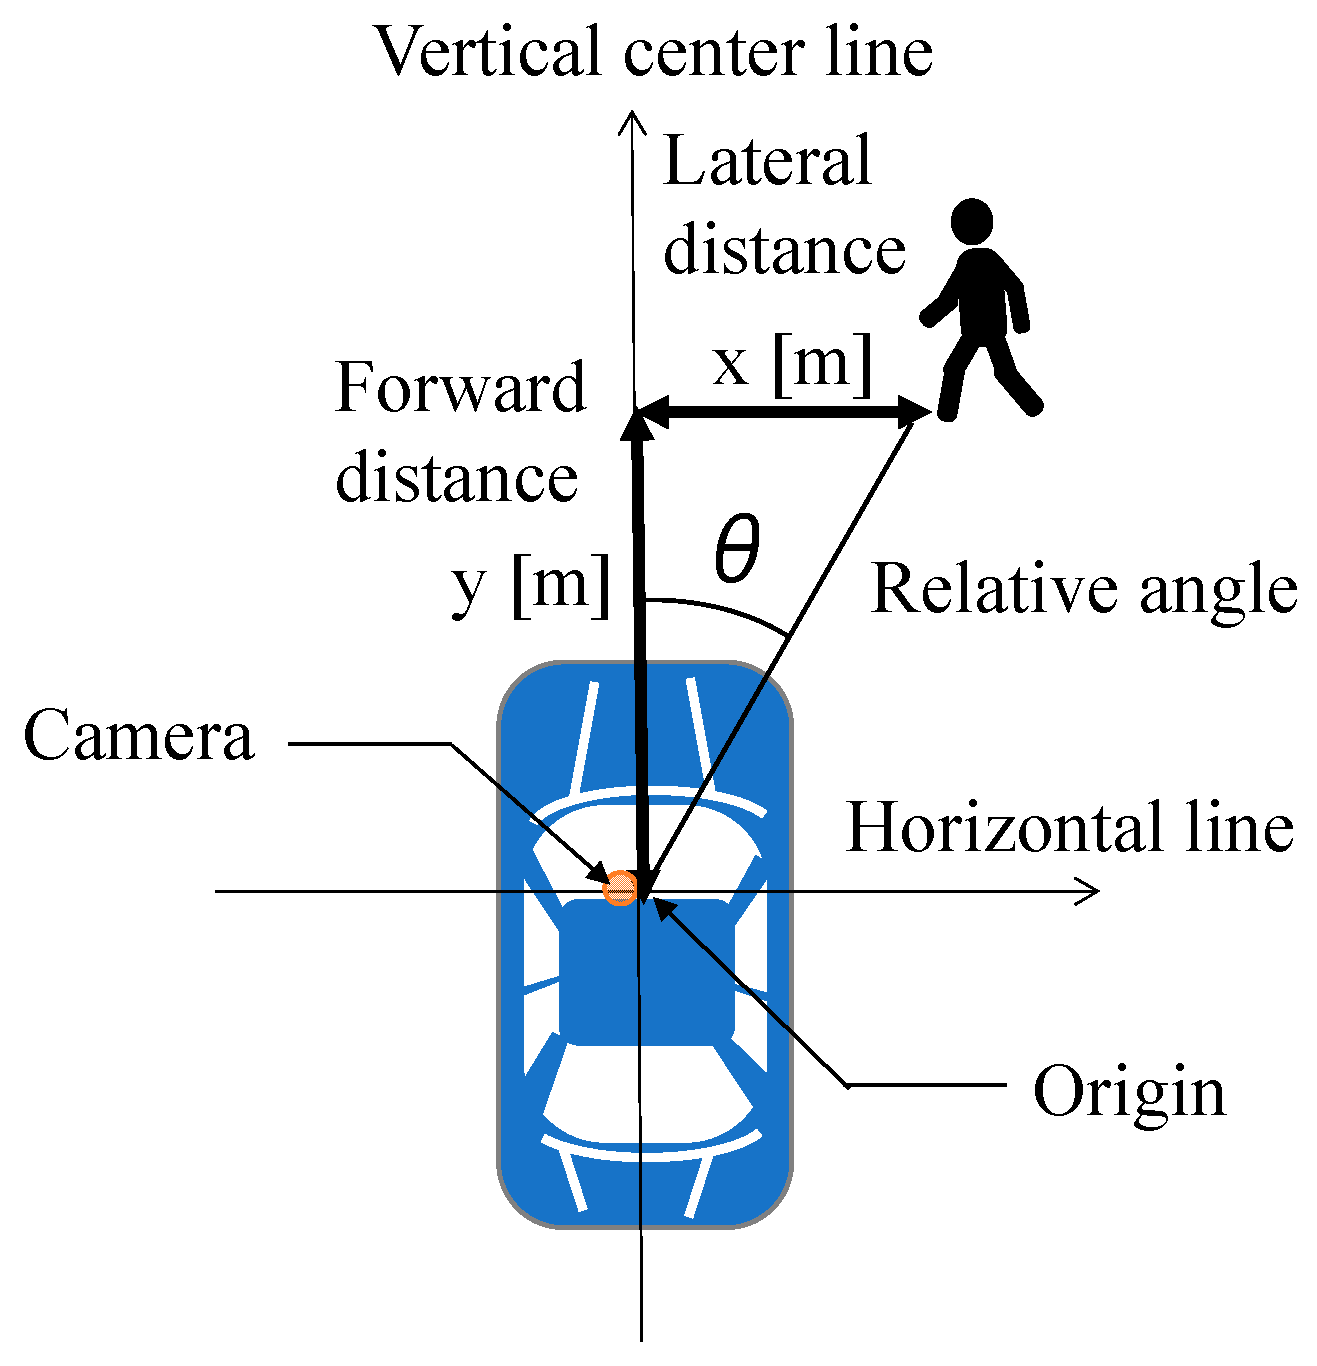
2.5. Relative Position of a Pedestrian from an Ego Vehicle

Using the management tool provided in the database, we investigated the positional relationship between the ego vehicle and the pedestrian when the driver applied the brakes [26]. When the pedestrian’s image was clicked, the management tool automatically provided information of the forward distance and lateral distance of the pedestrian from the ego vehicle [26]. The coordinate origin (x = 0, y = 0) was set as the point where the vertical centerline in the ego vehicle and the horizontal line of the drive recorder camera position crossed, as shown in Figure 2. We measured the distance in the right (positive) or left (negative) direction from the origin for the lateral distance (x [m]) and the forward distance from the origin for the front distance (y [m]) to determine the pedestrian’s relative position from the ego vehicle. The relative angle (θ) was calculated using the lateral and forward distances.

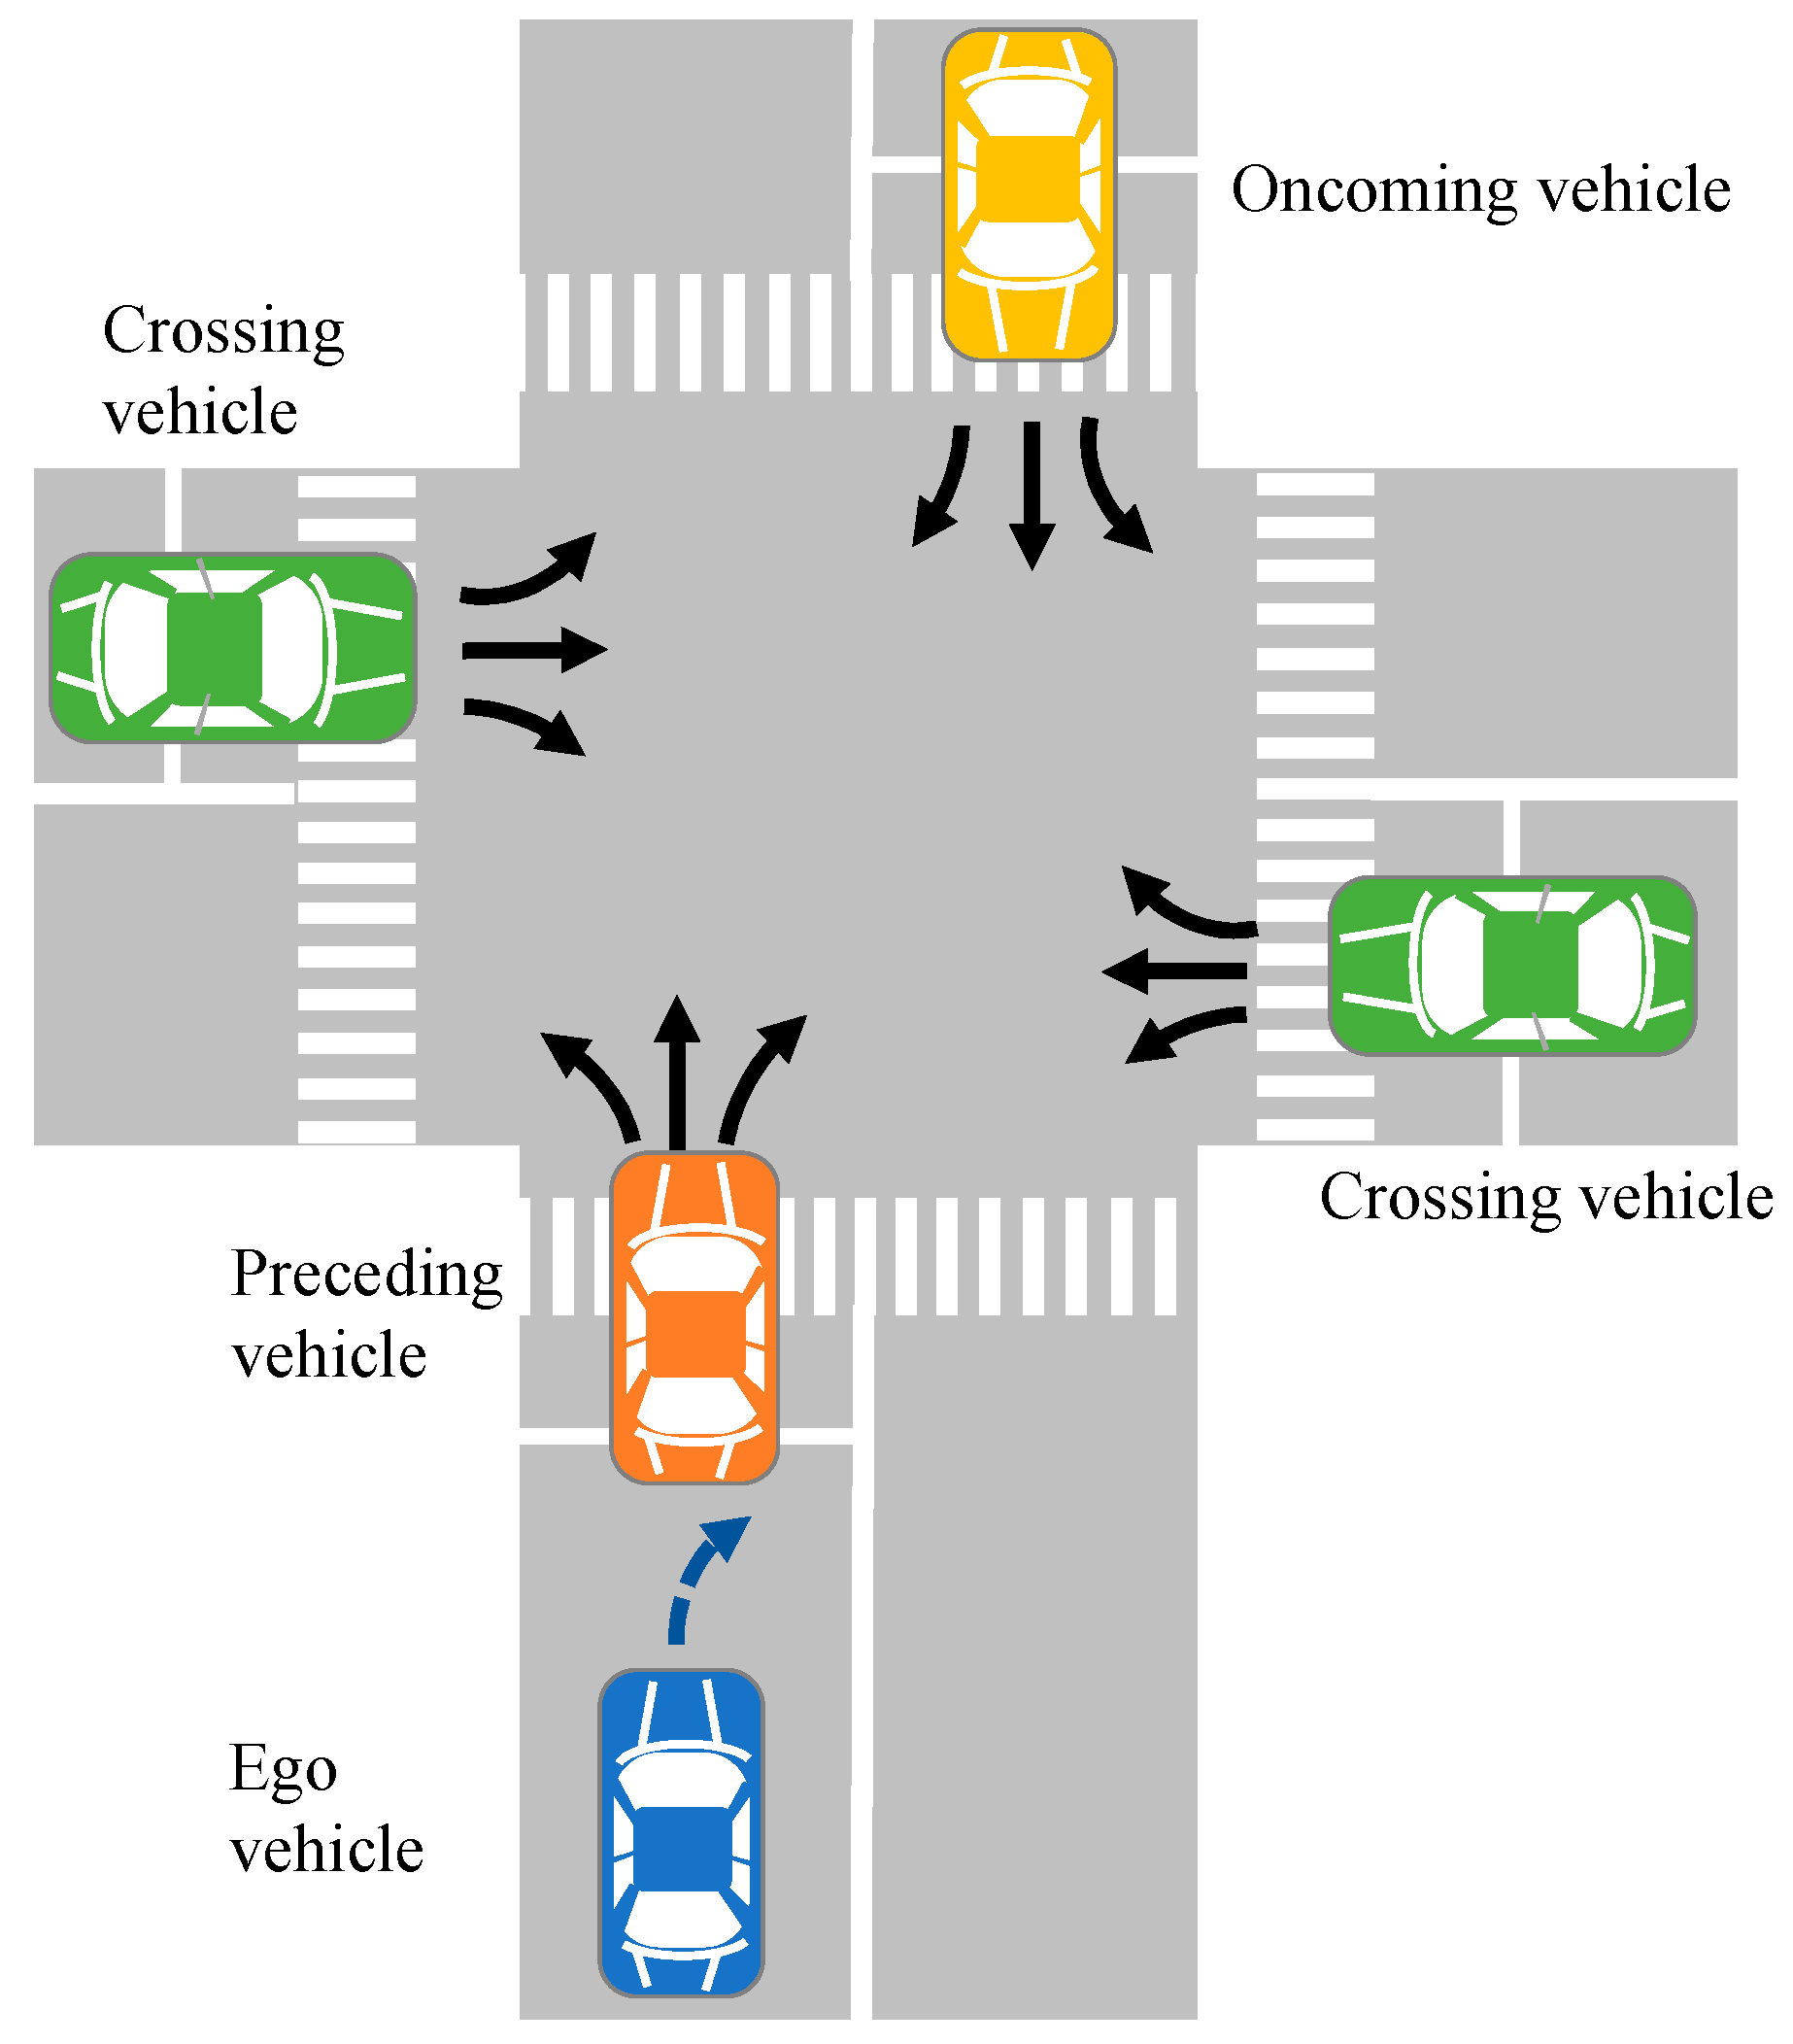
2.6. Existence of Other Vehicles

We examined the presence of other vehicles around a pedestrian in each near-miss incident at the intersection, which could be one of the factors blocking the driver’s view of the pedestrian. The other vehicles were classified into three types, namely preceding, oncoming, and crossing, as shown in Figure 3. A preceding vehicle was categorized as the one that traveled forward in the same lane as the ego vehicle. An oncoming vehicle was defined as the one that passed through the same intersection in the opposite direction to the ego vehicle. A crossing vehicle was the one that passed through the intersection from the left to right or right to left based on the driver’s view of the ego vehicle before entering the intersection.
A single near-miss incident may involve several types of vehicles. Therefore, we classified six other vehicle combinations as follows: preceding vehicles, oncoming vehicles, crossing vehicles, preceding and oncoming vehicles, preceding and crossing vehicles, and oncoming and crossing vehicles. No incidents involving a combination of preceding, oncoming, and crossing vehicles occurred.
Furthermore, we concentrated on incidents in which only preceding or oncoming vehicles existed, focusing on the situations where other vehicles and the ego vehicle moved simultaneously. Crossing vehicles were excluded in this analysis. At the intersection without a traffic light, there were cases wherein the crossing vehicles and the ego vehicle ran simultaneously. However, with a traffic light, crossing vehicles could not run while the ego vehicle was moving. We investigated the number and travel directions of the preceding or oncoming vehicles at the intersection for each incident. The travel directions of the preceding or oncoming vehicles were classified into four types: traveling straight, left-turning, right-turning, and a combination. These types were based on the drivers’ views of preceding or oncoming vehicles, as shown in Figure 4. For example, in an incident, three preceding vehicles were present, of which one turned right and the other two traveled straight. In this case, we classified the number of preceding vehicles as “≥3“ and the travel direction as “combination”.

2.7. Data Analysis

In the data analysis, we compared near-miss incidents based on the time of day and crossing directions of pedestrians, as listed in Table 1. Six items were investigated: (1) near-miss incidents between a right-turning vehicle and a pedestrian; (2) road width; (3) ego vehicle travel speed; (4) existence of other vehicles; (5) relationship of numbers and/or travel directions of other vehicles; and (6) relative positions of ego vehicles and pedestrians. For items (1), (2), and (4), a significant difference was determined using a two-tailed statistical test of sample rates. For item (3), a significant difference was determined using a two-tailed statistical test of sample rates and a two-sample t-test. For item (6), Mann–Whitney U-tests were used to compare the significant difference between Left-Pedestrian and Right-Pedestrian in the lateral distances, forward distances, and relative angles.

3. Results

3.1. Near-Miss Incidents between a Right-Turning Vehicle and a Pedestrian According to Time Zone (Daytime and Night-Time)
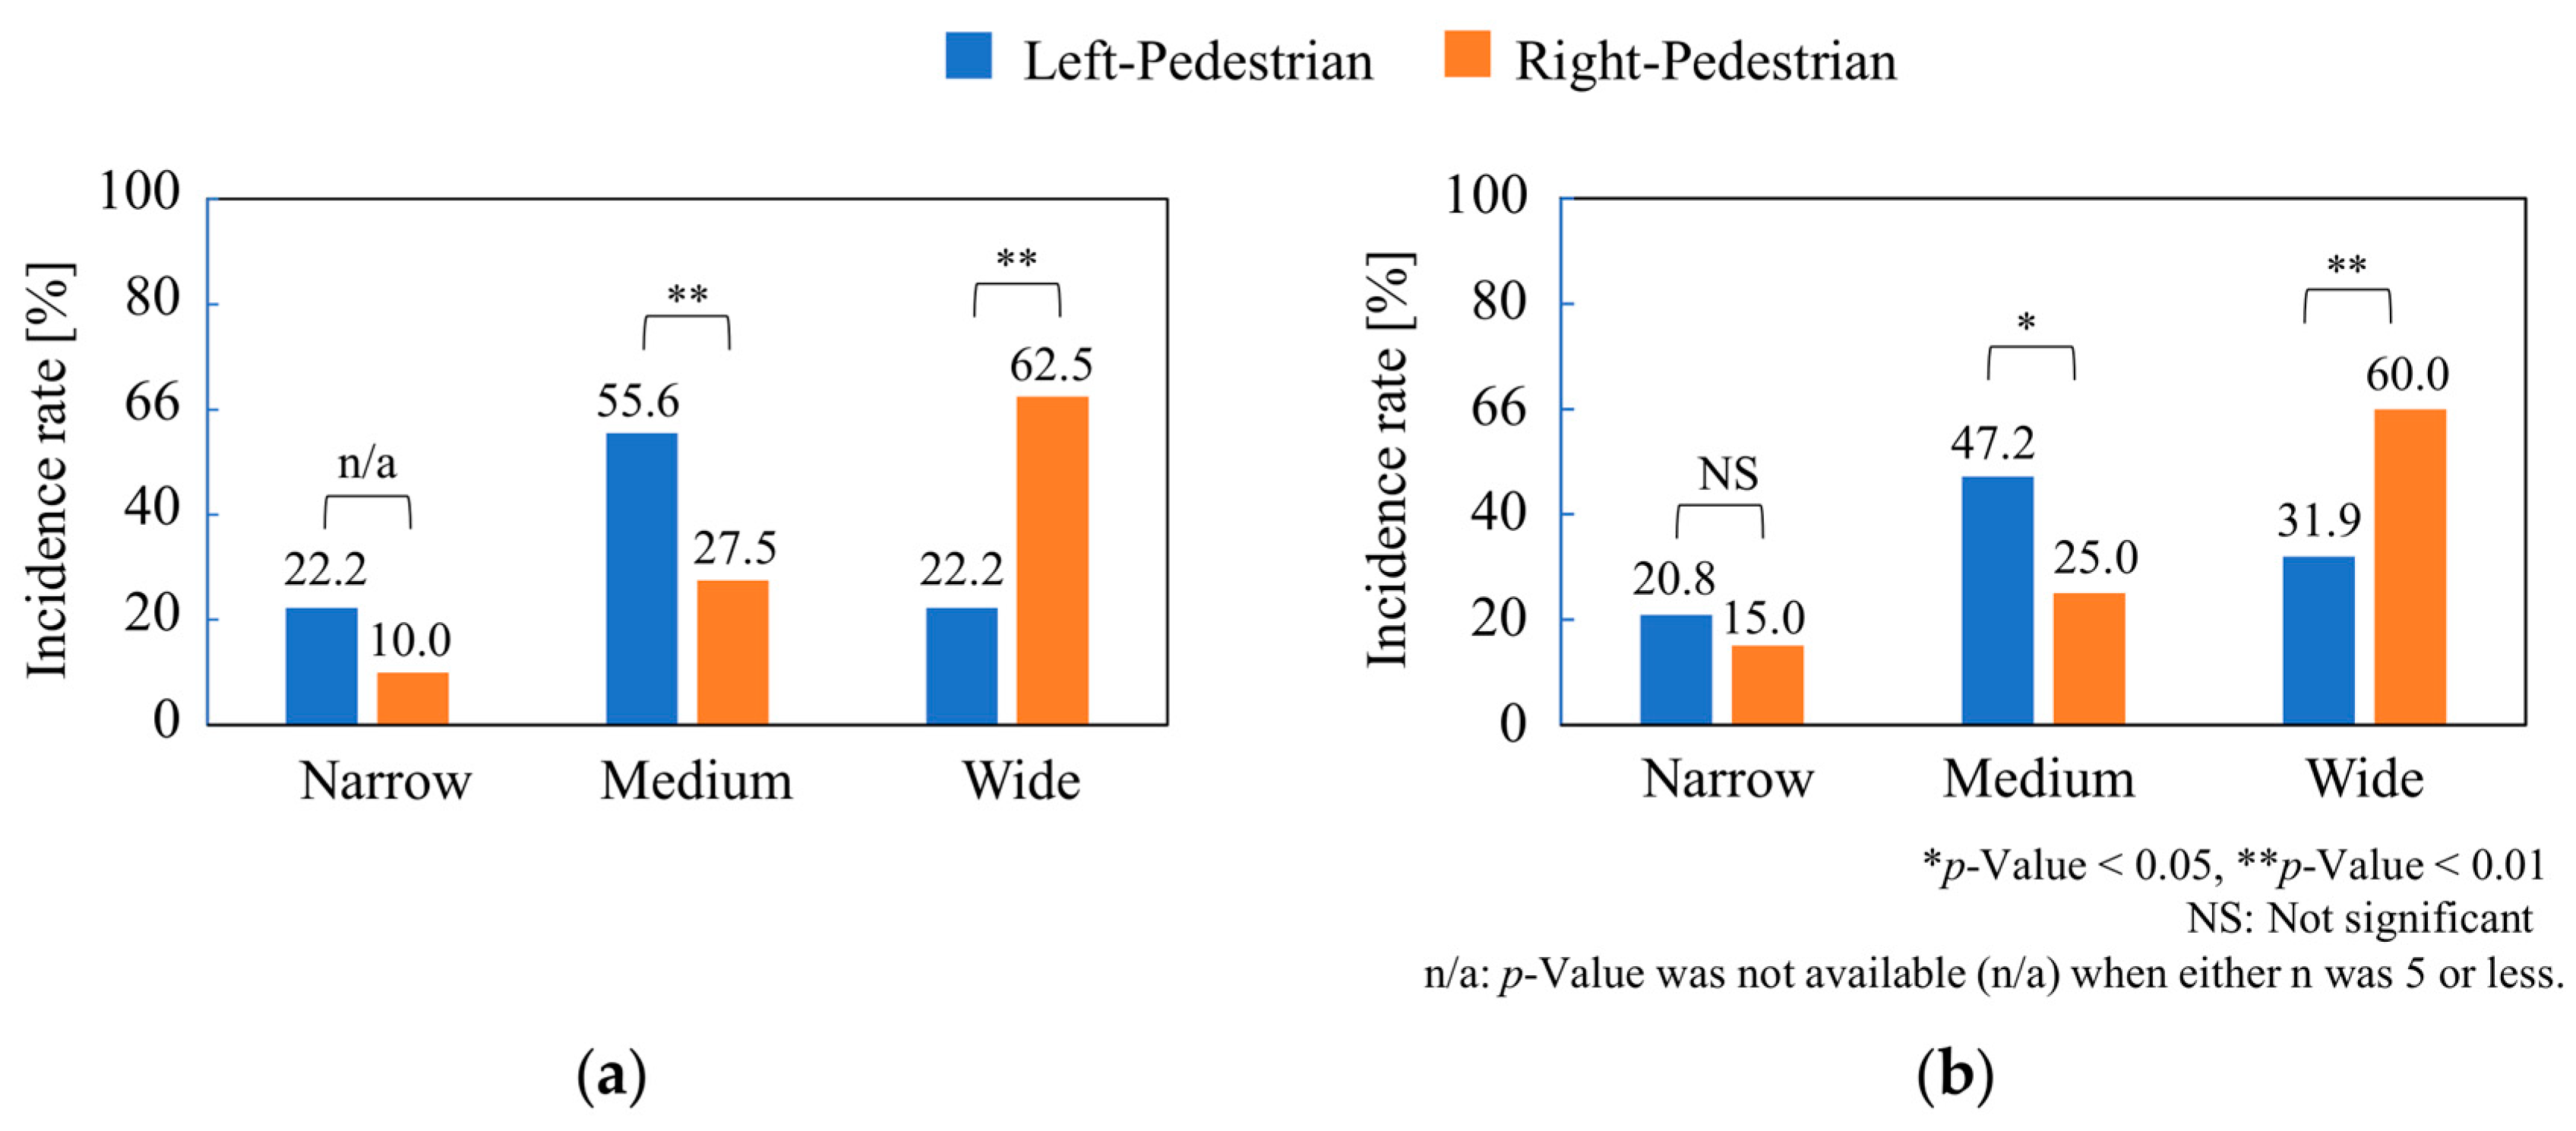
Among the 112 near-miss incidents, there were 43 (38.4%) incidents during the day and 69 (61.6%) incidents at night, as listed in Table 2. Among the daytime and night-time incidents, the highest rates were observed in sunny conditions (81.4% and 76.8%, respectively) and on roads with traffic lights for both vehicles and pedestrians (67.4% and 62.3%, respectively). Considering pedestrians involved in near-miss incidents, the rate of incidents for left-to-right side crossing was higher (65.1% and 63.8%) than that for right-to-left crossing during both daytime and night-time. The rate of incidents at crosswalks was higher (88.4%) than that on non-crosswalks during both daytime and night-time. For roads to intersections, the highest rates of incidents were on medium roads (51.2% and 42.0%), followed by wide roads (34.9% and 37.7%) during both daytime and night-time. For roads through the intersection, the highest rates of incidents were on wide roads (51.2%) followed by medium roads (30.2%) during daytime; meanwhile, the highest rates of incidents occurred on medium roads (44.9%), followed by wide roads (36.2%), at night. The rate of incidents was the highest for the ego vehicle travel speed range ≤20 km/h (58.1% and 50.7%), followed by ≤10 km/h (23.3% and 30.4%) during both daytime and night-time. Owing to the existence of other classified vehicles, the rates of incidents with those vehicles were higher during both daytime (81.4%) and night-time (66.7%). No statistically significant variations between daytime and night-time near-miss incidents were observed in any of the analyzed items. Consequently, we focused on the variations in the pedestrian crossing direction using combined day and night data in the subsequent analysis.

3.2. Road Width

Figure 5 presents a comparison of the incident rates for the Left-Pedestrian (n = 72) and Right-Pedestrian (n = 40) groups based on the classified road width to or through the intersection. For the road width to the intersection, Left-Pedestrian had a higher rate of incidents on medium roads (55.6%) than on narrow and wide roads (22.2%) for both road types. Right-pedestrians were involved in most incidents on wide roads (62.5%), followed by medium roads (27.5%) and narrow roads (10.0%). The incidence rate on medium roads for Left-Pedestrians (55.6%) was significantly higher than that for Right-Pedestrians (27.5%); whereas that on wide roads for Left-Pedestrians (22.2%) was significantly lower than that for Right-Pedestrians (62.5%).
For the road width through the intersection, Left-Pedestrian had the highest rate of incidents on medium roads (47.2%), followed by wide roads (31.9%) and narrow roads (20.8%). Right-Pedestrians had the highest rate of incidents on wide roads (60.0%), followed by medium roads (25.0%) and narrow roads (15.0%). The rate on medium roads for Left-Pedestrians (47.2%) was significantly higher than that for Right-Pedestrians (25.0%), whereas that on wide roads for Left-Pedestrians (31.9%) was significantly lower than that for Right-Pedestrians (60.0%).

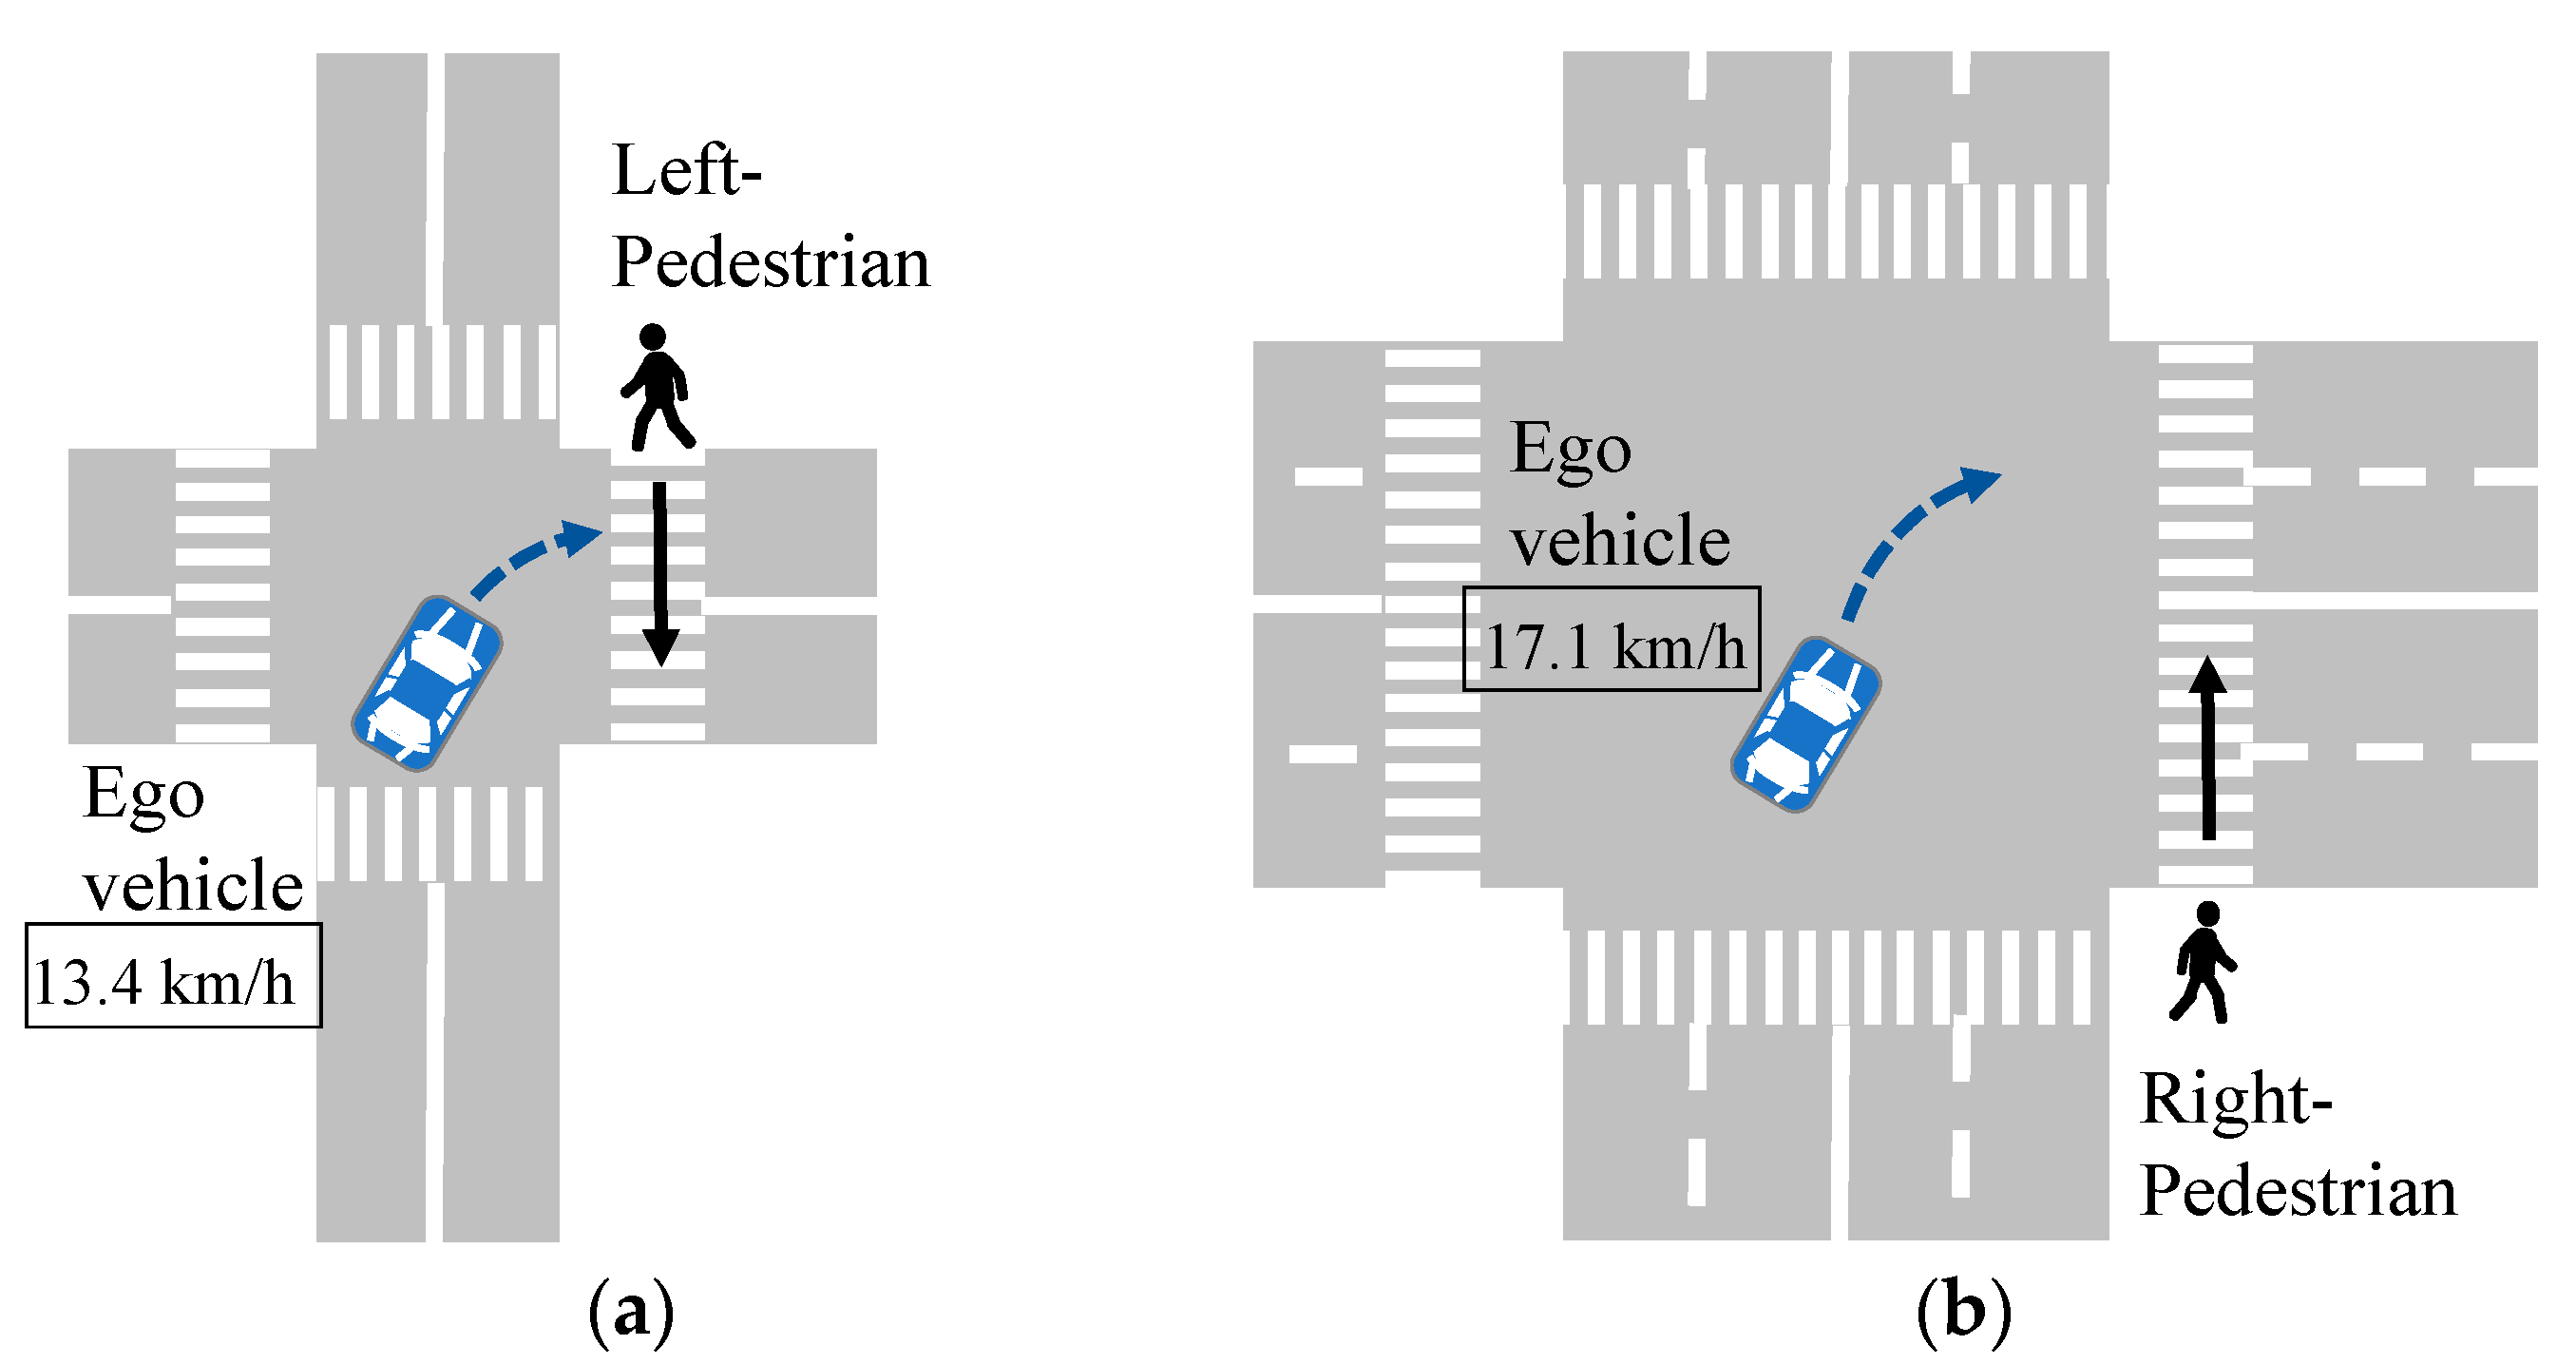
3.3. Ego Vehicle Travel Speed

We investigated the ego vehicle travel speed in near-miss incidents immediately before the driver started braking to avoid a collision. The composition based on the vehicle travel speed range for the Left-Pedestrian and Right-Pedestrian is listed in Table 3. The incidence rate for the Left-Pedestrian was the highest in the ≤20 km/h range (51.4%), followed by the ≤10 km/h range (36.1%). For Right-Pedestrian, the rate was highest in the range of ≤20 km/h (56.1%), followed by ≤30 km/h (31.7%). The rate in the range of ≤10 km/h for Left-Pedestrian (36.1%) was significantly higher than that for the Right-Pedestrian (12.2%), whereas that in the range of ≤30 km/h for the Left-Pedestrian (12.5%) was significantly lower than that for the Right-Pedestrian (31.7%).
Table 4 lists the average ego vehicle travel speeds for the Left-Pedestrian and Right-Pedestrian scenarios. They were 13.4 km/h (SD 6.3 km/h) and 17.1 km/h (SD 5.7 km/h) for the Left-Pedestrian and Right-Pedestrian, respectively. The speeds were significantly slower for Left-Pedestrians than for Right-Pedestrians.

3.4. Existence of Other Vehicles

Table 5 compares the distribution of incidents in each case based on the combination of categorized vehicles and the presence of Left-Pedestrians or Right-Pedestrians. The total rate of incidents with other vehicles was 69.4% (n = 50) for Left-Pedestrians and 77.5% (n = 31) for Right-Pedestrians. For categorized other vehicles for Left-Pedestrian, the rate of incidents with preceding vehicles (23.6%) was the highest, followed by oncoming vehicles (22.2%) and preceding and oncoming vehicles (15.3%). For Right-Pedestrians, the rates of incidents with preceding vehicles (25.0%) and oncoming vehicles (25.0%) were higher than those for the other vehicles categorized. No statistically significant differences were observed in the distribution of Left-Pedestrians and Right-Pedestrians.

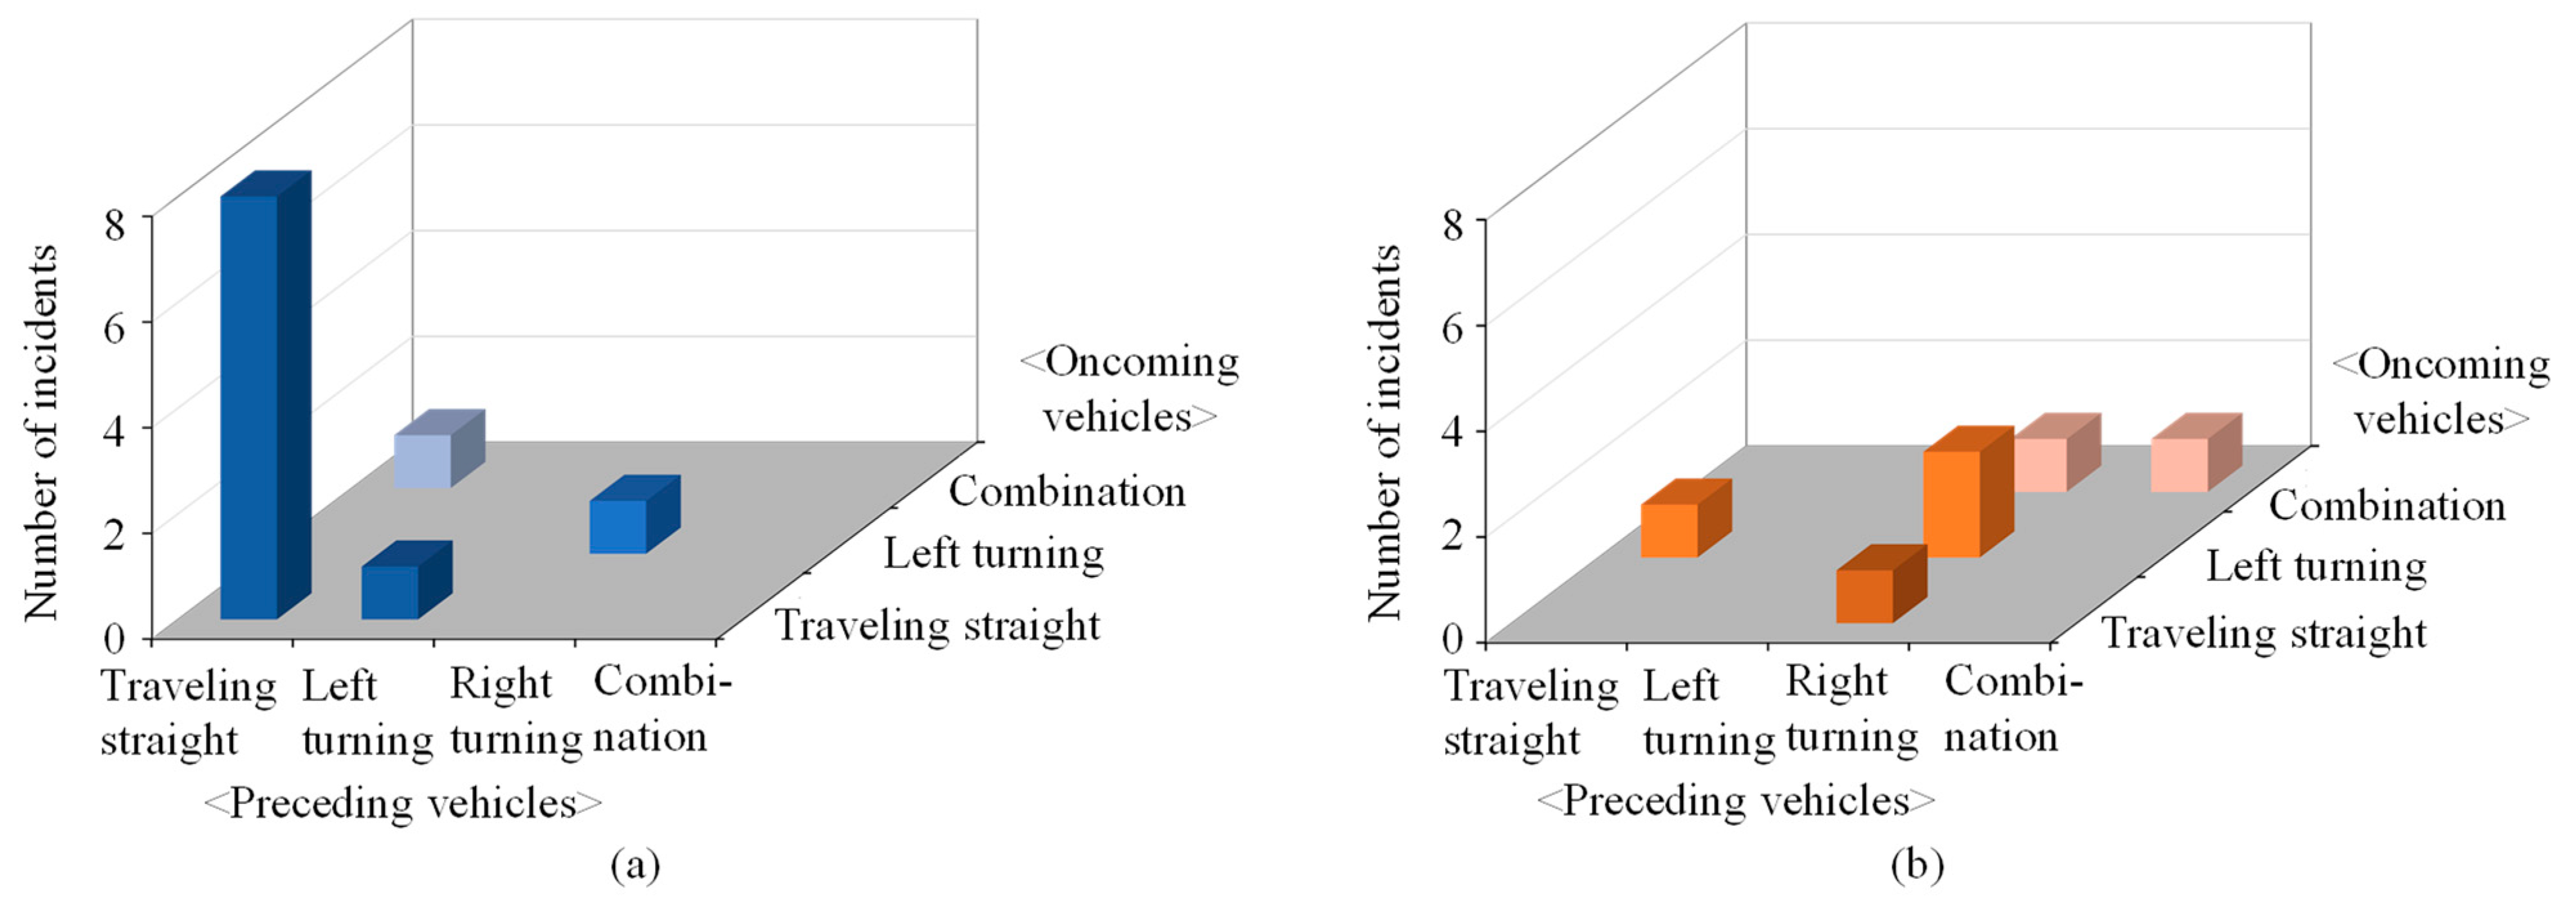
3.5. Relationship of Numbers and/or Travel Directions of Other Vehicles

Considering the higher rates of incidents with other categorized vehicles, as listed in Table 5, we examined near-miss incidents with three types of other vehicles: preceding, oncoming, and preceding and oncoming in each case. Figure 6 shows the relationship for each incident between the number and travel directions through the intersection of preceding or oncoming vehicles. For preceding vehicles, there were more incidents in which one preceding vehicle traveled straight (n = 5) or turned right (n = 7) in the Left-Pedestrian scenario, as shown in Figure 6(1)(a). In the Right-Pedestrian scenario, there were more incidents wherein one preceding vehicle turned right (n = 5), as shown in Figure 6(1)(b). As observed in Figure 6(2), there were more instances of oncoming vehicles traveling straight or turning left in the Left-Pedestrian scenario and traveling straight in the Right-Pedestrian scenario.
For both the preceding and oncoming vehicles traveling in a case, the relationship between travel directions through the intersection in each case is shown in Figure 7. In the Left-Pedestrian scenario, both preceding and oncoming vehicles tended to go straight, whereas in the Right-Pedestrian scenario, leading vehicles tended to turn right regardless of the traveling direction of the oncoming vehicle.

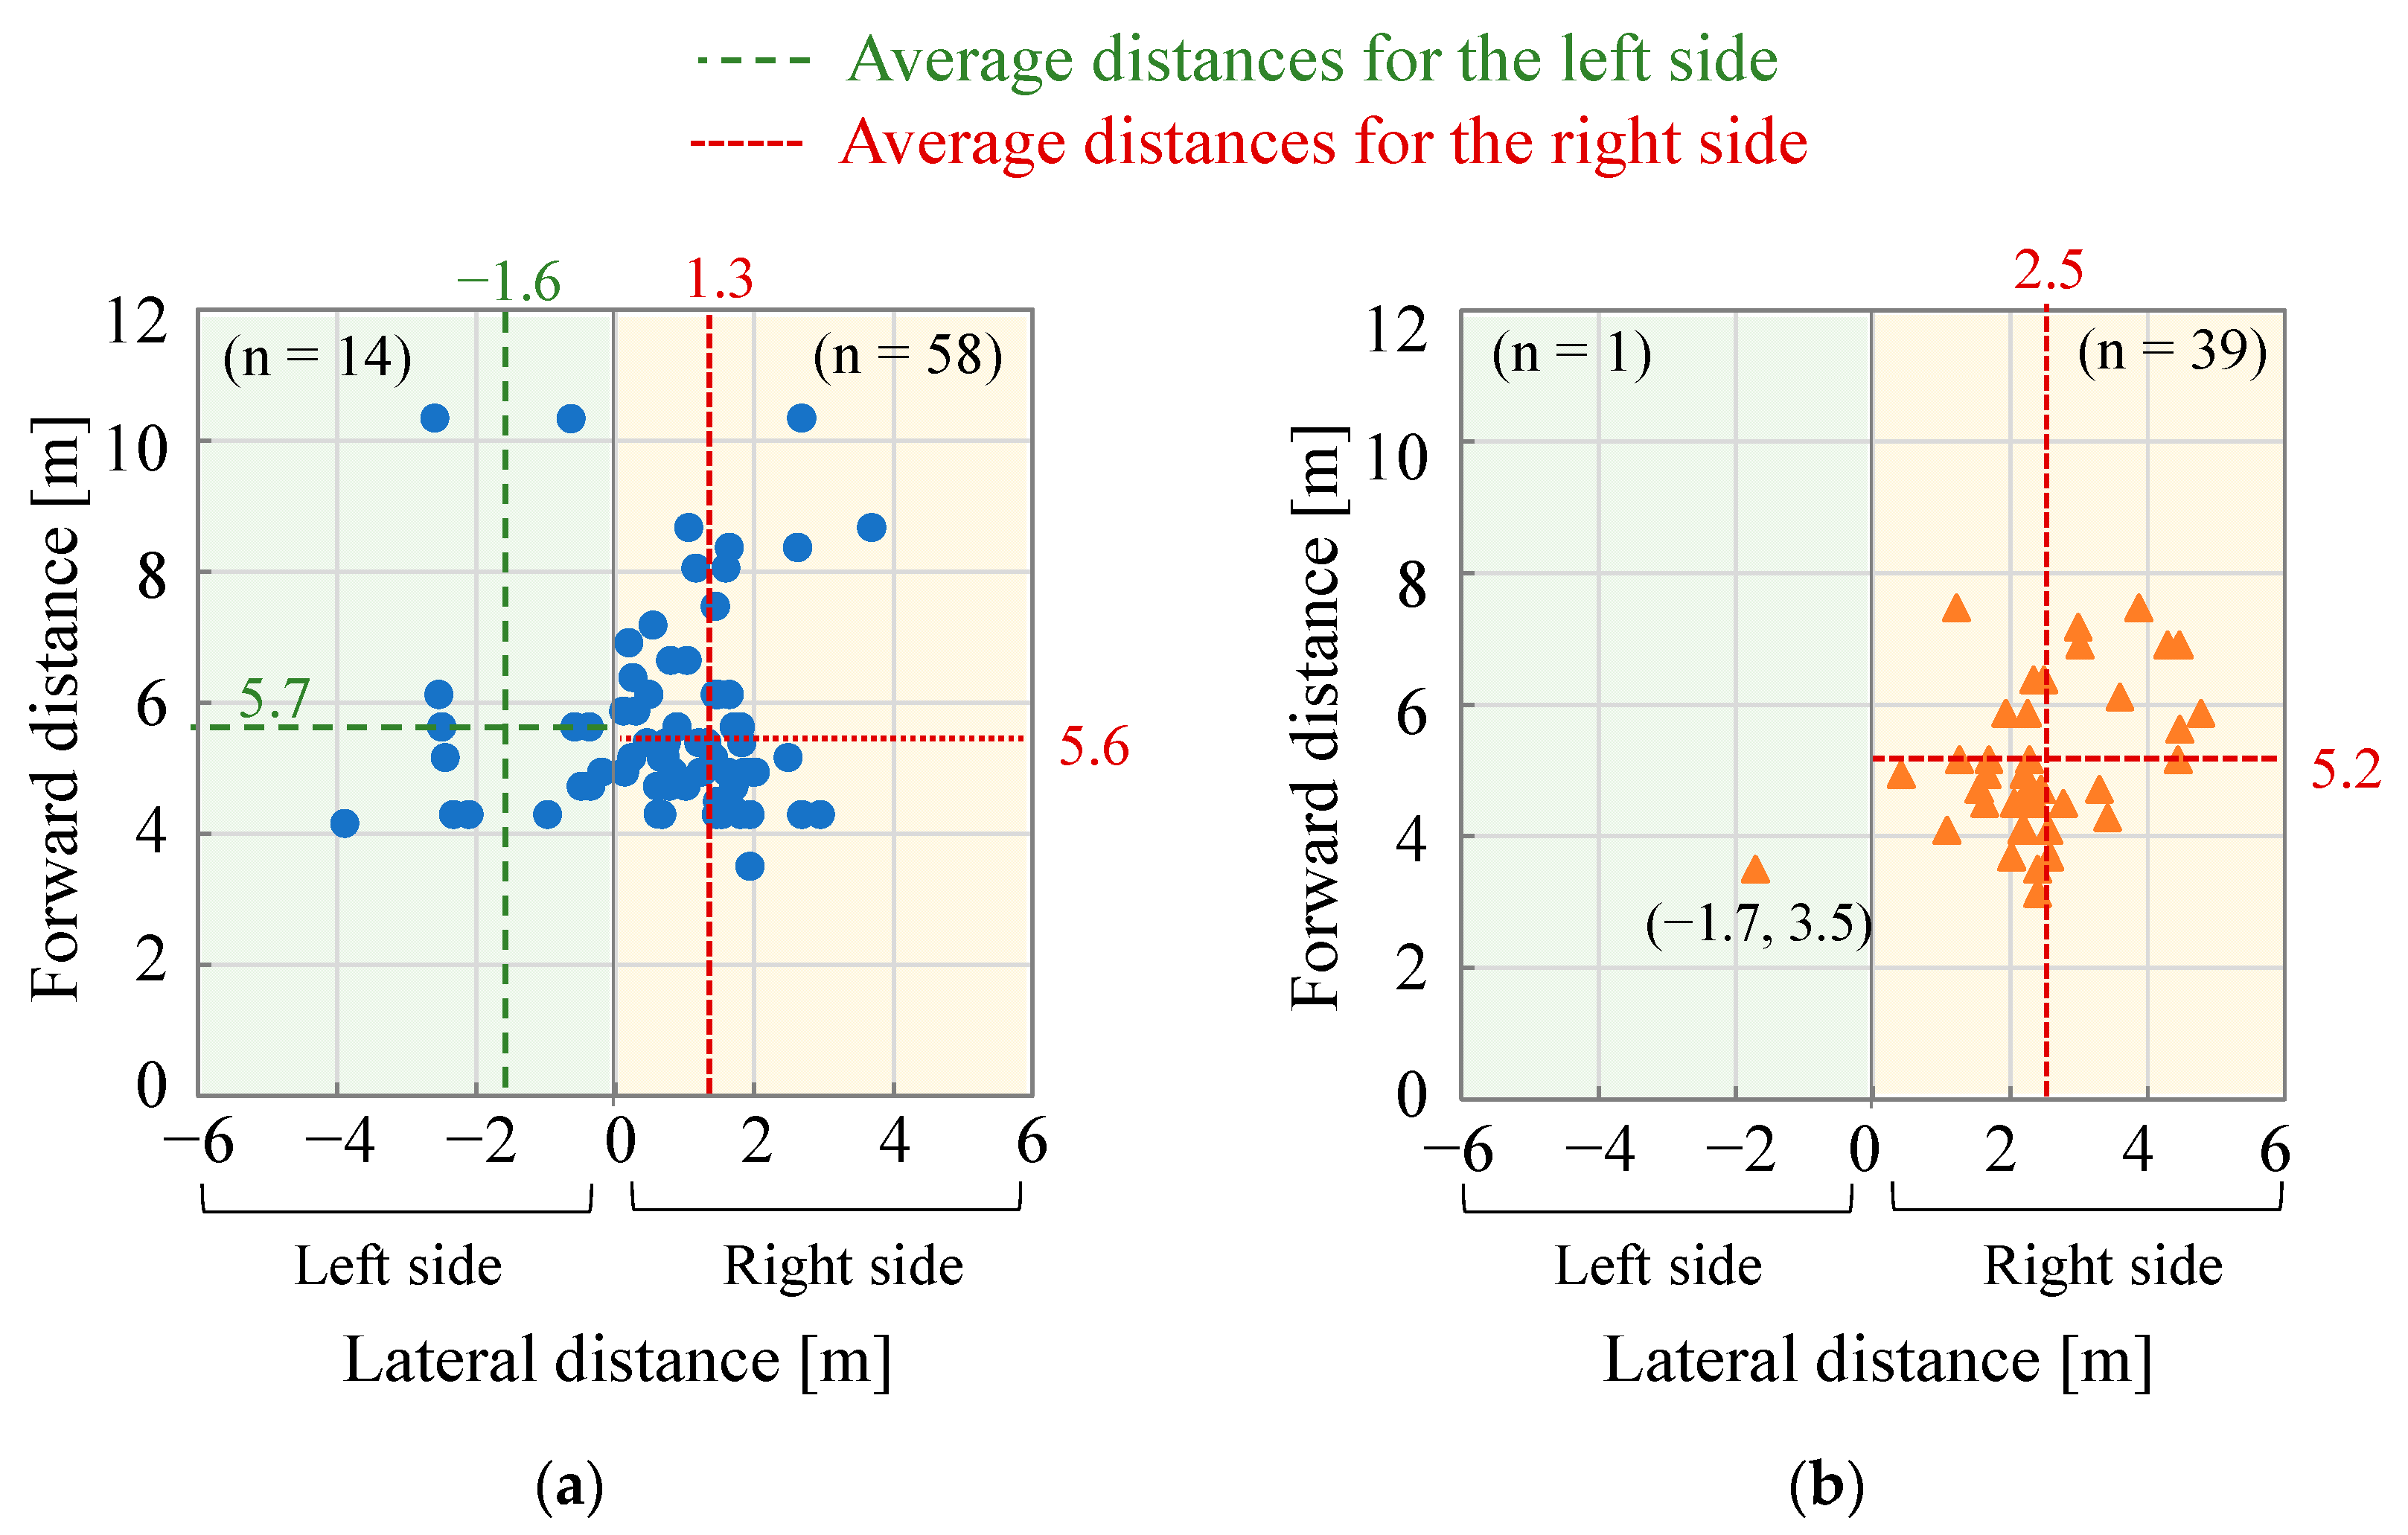
3.6. Relative Positions of Ego Vehicles and Pedestrians

Figure 8 shows the positional distribution between the ego vehicles and pedestrians when the drivers apply the brake. Figure 8a shows that right-side incidents (n = 58, 80.6%) occurred more frequently than left-side incidents (n = 14, 19.4%) for Left-Pedestrians. On the left side, the average lateral distance was 1.6 m (SD 1.2 m) to the left from the vertical centerline of the ego vehicle, and the average forward distance was 5.7 m (SD 2.0 m) from the horizontal line of the drive recorder camera position. On the right side, the average lateral distance was 1.3 m (0.8 m) to the right from the centerline, and the average forward distance was 5.6 m (SD 1.4 m).
Figure 8b shows that right-side incidents (n = 39, 97.5%) occurred more frequently than left-side incidents (n = 1, 2.5%) for Right-Pedestrians. On the right side, the average lateral distance was 2.5 m (SD 1.0 m) to the right from the centerline, and the average forward distance was 5.2 m (SD 1.1 m).
Figure 9 shows the measured lateral and forward distances and angles (θ) between the ego vehicles and pedestrians when the drivers applied the brake. The absolute values of the lateral distances were used in this analysis. The median lateral distance was 1.4 m for the Left-Pedestrian, which was significantly shorter than that of the Right-Pedestrian at 2.3 m. The median front distance was 5.2 m for the Left-Pedestrian and 4.8 m for the Right-Pedestrian. There were no significant differences between the two groups. The median relative angle from the vertical centerline of the ego vehicles to pedestrians was 14° for the Left-Pedestrian, which was significantly smaller than that of the Right-Pedestrian at 26°.

4. Discussion

The results of our study show that 88.4% of the near-miss incidents were crosswalks for the pedestrian crossing locations during both day and night. The percentages of traffic lights were high for pedestrians and vehicles. Those of medium and wide roads were also high. These results imply that near-miss incidents occurred at medium and large-sized intersections. Koh et al. investigated the relationship between the lighting status of traffic lights and behaviors of pedestrians crossing roads [27]. Their results show that 45% of the pedestrians did not complete the crossing before the red-light display when they started crossing during green-light flashing. They also indicated that pedestrians who crossed roads dangerously had higher risks of getting involved in traffic accidents. In near-miss incidents, some pedestrians might behave dangerously even though they were crossing on crosswalks.
Using near-miss incident data, we investigated dangerous traffic situations wherein vehicles turning right at intersections encountered pedestrians. The state-of-the-art reports the features of road environments of accidents between a right-turning vehicle and an oncoming vehicle from actual accident data in Japan [28]. They found that the intersections with traffic lights accounted for 72%, which is comparable to the results of vehicle/pedestrian-traffic lights with high percentages. For the road width, they showed that the highest rates of accidents occurred on medium roads (≥5.5 m, <13 m) to and through intersections (41%), followed by medium roads to and wide roads through intersections (22%) and wide roads to and through intersections (19%). The road environments of medium and wide roads were similar to the ones in our results between a right-turning vehicle and a pedestrian. The collision-potential targets are different between the literature and this study, viz. oncoming vehicles and pedestrians. In the future, it is necessary to investigate the turning-vehicle collisions involving pedestrians using traffic accident data.
As listed in Table 3, the range of ≤30 km/h for Right-Pedestrian (31.7%) was significantly higher than that for Left-Pedestrian (12.5%). The average of ego vehicle travel speeds for the Right-Pedestrian (17.1 km/h) was significantly faster than that for the Left-Pedestrian (13.4 km/h). The impact speed of the striking vehicle affects the rate of pedestrian death in vehicle–pedestrian crashes [29]. Hussain et al. revealed that the odds of pedestrian fatality increase by 11% for a 1 km/h increment [30]. The findings indicate that the width of intersections involving Right-Pedestrians is often greater than that involving Left-Pedestrians. On medium roads (≥5.5 m, <13 m) to and through the intersection, Left-Pedestrians had the highest rates of incidents. In contrast, Right-Pedestrians had the highest rates on wide roads (≥13 m) to and through the intersection (Figure 5). In Japan, medium roads have two lanes, with one lane in each direction, whereas wide roads have at least four lanes, as shown in Figure 10. As the number of lanes increase, the size of the intersection increases. Typically, the turning speed of the vehicle at an intersection depends on the size of the intersection. Because of the higher vehicle speed and the longer distance between the ego vehicle and the Right-Pedestrian, ego vehicle drivers may take longer to recognize Right-Pedestrians than Left-Pedestrians. Furthermore, crossing the road takes longer when a pedestrian walks on a wide road (13 m). Mori and Tsukaguchi found that, for a pedestrian density lower than 1.1 persons/m2, the average pedestrian walking speed is approximately 1.4 m/s. For example, when the crossing distance for pedestrians is greater than 13 m, it takes 9.3 s or longer to cross [31]. Generally, the length of the pedestrian crossing time is directly proportional to the chance of a pedestrian encountering a right-turning vehicle. Therefore, the size of an intersection may have a significant influence on collisions between right-turning vehicles and pedestrians. In 2020, the European New Car Assessment Programme (Euro NCAP) added a new test scenario for AEB systems detecting pedestrians, wherein the target was a pedestrian crossing a road into which a vehicle was turning at an intersection [32]. The road in the Euro NCAP test for each pedestrian side has two lanes in opposite directions, which is the same as that in Figure 10a. The results of the current study support the road width in the Euro NCAP protocol for the Right-Pedestrian condition, where vehicles travel on the right side of the roads, as in European countries (the opposite side in Japan). To improve pedestrian-AEB systems for both right- and left-turning vehicles at intersections, it may be desirable to consider the road width in the test protocol.
When we focused on the existence of other vehicles, the total rates of incidents with other vehicles were relatively high (69.4% for Left-Pedestrian and 77.5% for Right-Pedestrian) in the near-miss incident data, as listed in Table 5. For categorized other vehicles for Left-Pedestrian, the rate of incidents with preceding vehicles (23.6%) was the highest, followed by oncoming vehicles (22.2%) and preceding and oncoming vehicles (15.3%). For Right-Pedestrians, the rates of incidents with preceding vehicles (25.0%) and oncoming vehicles (25.0%) were higher than those for other combinations of vehicles. When preceding and/or oncoming vehicles were traveling in an intersection, the bodies of one or more vehicles could block the line of sight of the ego vehicle driver to the pedestrian. In addition, the driver had to pay attention not only to pedestrians but also to other vehicles. These situations might have caused more dangerous near-miss incidents involving pedestrians, assuming that the time necessary for drivers to recognize pedestrians was reduced. To decrease severe conditions between turning vehicles and pedestrians at intersections, pedestrian-AEB systems that can detect both the movement of other vehicles and pedestrians should be developed. Abdel-Aty et al. indicated that the occlusion time could reduce the effectiveness of AEB systems in detecting pedestrians [33]. In the current Euro NCAP test protocol for pedestrian-AEB systems in turning vehicles at an intersection, no other vehicles exist in the traffic environment. In future, it is expected that the Euro NCAP test protocol will involve the presence of other vehicles, such as preceding and/or oncoming vehicles.
A drive recorder unit with a camera to capture the front image was installed at the center of the upper part of the inner windshield glass. However, the driver’s view of pedestrians crossing the crosswalk from the left is likely to be blocked by A-pillars [34,35,36]. Therefore, the influence of a blind spot caused by the A-pillars on the driver’s visibility of pedestrians could not be verified in the video image captured by the drive recorder unit. Therefore, it is vital to investigate the shielding status of the A-pillars in depth to elucidate the driver’s blind spots.
In the current study, we examined the characteristics of dangerous situations involving ego vehicles and pedestrians when vehicles turn right at an intersection using near-miss data. However, the characteristics of turning left at an intersection may differ from those obtained in the current study. In future, it will be necessary to consider dangerous situations involving ego vehicles and pedestrians when ego vehicles turn left at intersections.
The present study has limitations: we used near-miss data of vehicles driven by taxi drivers. It is conceivable that general drivers have different driving behaviors compared to taxi drivers; for example, in terms of the timing and toe force of braking application. We did not focus on the types of intersections. In future, it is necessary to investigate the driving characteristics of general drivers when vehicles turn right at different types of intersections.

5. Conclusions

Using near-miss incident data from vehicles traveling on the left side of roads, we identified the characteristics of dangerous traffic situations wherein vehicles turning right at intersections encounter pedestrians, focusing on two directions of pedestrian crossing: Left-Pedestrian and Right-Pedestrian. The results reveal that the Left-Pedestrian and Right-Pedestrian scenarios had different features for the width of roads going to and through the intersection. The highest rates of incidents for Left-Pedestrian were on medium roads (≥5.5 m, <13 m) to (55.6%) and through (47.2%) the intersection. However, the highest incidents for Right-Pedestrian incidents occurred on wide roads (62.5%) and through (60.0%) intersections. The average of ego vehicle travel speeds for the Right-Pedestrian (17.1 km/h) was significantly faster than that for the Left-Pedestrian (13.4 km/h). The results revealed that the Left-Pedestrian and Right-Pedestrian scenarios had similar characteristics in terms of the presence of other vehicle categories. The total rate of incidents with other vehicles was 69.4% (n = 50) for Left-Pedestrians and 77.5% (n = 31) for Right-Pedestrians. Among the categorized other vehicles, the rate of incidents with preceding vehicles (23.6%) was the highest for the Left-Pedestrian. For Right-Pedestrians, the rates of incidents with preceding vehicles (25.0%) and oncoming vehicles (25.0%) were higher than those for the other vehicles categorized. When an accident prevention safety system such as an AEB system is used for pedestrian detection during right-turning vehicle maneuvers, the test conditions are expected to reflect the features revealed in this study; that is, the road width and presence of other vehicles, such as preceding and oncoming vehicles. The findings of this study will contribute to the development and evaluation of safety systems for preventing collisions between right-turning vehicles and pedestrians at intersections.

Author Contributions

Conceptualization, Y.M.; investigation, S.O.; writing—original draft, Y.M.; writing—review and editing, S.O. All authors have read and agreed to the published version of the manuscript.

Funding

This research was funded by the Ministry of Land, Infrastructure, Transport, and Tourism (MLIT), Japan, in 2021.

Institutional Review Board Statement

The use of recorded data from the drive recorders employed in this study was approved by the ethics committee of the Tokyo University of Agriculture and Technology in Japan.

Informed Consent Statement

Informed consent was obtained from all the individuals included in this study.

Data Availability Statement

Not applicable.

Conflicts of Interest

The authors declare no conflict of interest.

References

  1. Institute for Traffic Accident Research and Data Analysis of Japan (ITARDA). Annual Traffic Accident Report in 2021; ITARDA: Tokyo, Japan, 2022. (In Japanese) [Google Scholar]
  2. Bagheri, M.; Siekkinen, M.; Nurminen, J.K. Cellular-based vehicle to pedestrian adaptive communication for collision avoidance. In Proceedings of the IEEE international Conference on Connected Vehicles and Exposure, Vienna, Austria, 3–7 November 2014; Available online: https://www.researchgate.net/publication/308835284_Cellular-based_vehicle_to_pedestrian_V2P_adaptive_communication_for_collision_avoidance:450-456 (accessed on 3 February 2022).
  3. Anaya, J.J.; Merdrignac, P.; Shagdar, O.; Nashashibi, F.; Naranjo, J.E. Vehicle to pedestrian communications for protection of vulnerable road users. In Proceedings of the 2014 IEEE Intelligent Vehicles Symposium, Dearborn, Dearborn, MI, USA, 8–11 June 2014; pp. 1037–1042. [Google Scholar] [CrossRef] [Green Version]
  4. Sugimoto, C.; Nakamura, Y.; Hashimoto, T. Development of pedestrian-to-vehicle communication system prototype for pedestrian safety using both wide-area and direct communication. In Proceedings of the International Conference on Advanced Information Networking and Applications (AINA), Gino-wan, Japan, 25–28 March 2008; pp. 64–69. Available online: https://ieeexplore.ieee.org/document/4482690/authors#authors (accessed on 3 February 2022). [CrossRef]
  5. David, K.; Flach, A. Car-2-X and pedestrian safety. IEEE Veh. Technol. Mag. 2010, 5, 70–76. [Google Scholar] [CrossRef]
  6. Wu, X.; Miucic, R.; Yang, S.; Al-Stouhi, S.; Misener, J.; Bai, S.; Chan, W. Cars talk to phones: A DSRC Based vehicle–pedestrian safety system. In Proceedings of the 80th IEEE Veh Technol Conference, Vancouver, BC, Canada, 14–17 September 2014; pp. 1–7. [Google Scholar] [CrossRef]
  7. Themann, P.; Kotte, J.; Raudszus, D.; Eckstein, L. Impact of positioning uncertainty of vulnerable road users on risk minimization in collision avoidance systems. In Proceedings of the 81st IEEE Intelligent Veh Symposium, Glasgow, UK, 11–14 May 2015. [Google Scholar] [CrossRef]
  8. He, S.; Li, J.; Qiu, T.Z. Vehicle-to-pedestrian communication modeling and collision avoiding method in connected vehicle environment. Transp. Res. Rec. 2017, 2621, 21–30. [Google Scholar] [CrossRef]
  9. Lee, I.; Luan, B. Design of Autonomous Emergency Braking System Based on Impedance Control for 3-Car Driving Scenario, Paper (2016-01-1453); World Congress & Exposition; Society of Automotive Engineers: Detroit, MI, USA, 2016. [Google Scholar]
  10. Edwards, M.; Nathanson, A.; Wisch, M. Estimate of potential benefit for Europe of fitting autonomous emergency braking (AEB) systems for pedestrian protection to passenger cars. Traffic Inj. Prev. 2014, 15 (Suppl. S1), S173–S182. [Google Scholar] [CrossRef]
  11. Hamdane, H.; Serre, T.; Masson, C.; Anderson, R. Issues and challenges for pedestrian active safety systems based on real world accidents. Accid. Anal. Prev. 2015, 82, 53–60. [Google Scholar] [CrossRef] [Green Version]
  12. Rosen, E. Autonomous emergency braking for vulnerable road users. In Proceedings of the IRCOBI Conference, Gothenburg, Sweden, 11–13 September 2013; Available online: http://www.ircobi.org/wordpress/downloads/irc13/pdf_files/71.pdf (accessed on 3 February 2022).
  13. Cicchino, J.B. Effects of automatic emergency braking systems on pedestrian crash risk. Accid. Anal. Prev. 2022, 172, 106686. [Google Scholar] [CrossRef] [PubMed]
  14. Haus, S.H.; Sherony, R.; Gabler, H.C. Estimated benefit of automated emergency braking systems for vehicle–pedestrian crashes in the United States. Traffic Inj. Prev. 2019, 20 (Suppl. S1), S171–S176. [Google Scholar] [CrossRef] [Green Version]
  15. Matsui, Y.; Oikawa, S. Situational characteristics of fatal pedestrian accidents involving vehicles traveling at low speeds in Japan. Traffic Inj. Prev. 2019, 20, S1–S6. [Google Scholar] [CrossRef] [PubMed] [Green Version]
  16. Institute for Traffic Accident Research and Data Analysis of Japan (ITARDA). ITARDA Information No. 136; ITARDA: Tokyo, Japan, 2020. (In Japanese) [Google Scholar]
  17. Ding, Z.; Sun, C.; Zhou, M.; Liu, Z.; Wu, C. Intersection vehicle turning control for fully autonomous driving scenarios. Sensors 2021, 21, 3995. [Google Scholar] [CrossRef]
  18. Ben-Akiva, M.; Lermans, S.R. Discrete Choice Analysis: Theory and Application to Travel Demand; The MIT Press: Cambridge, MA, USA, 1985. [Google Scholar]
  19. Sahu, P.; Maji, A.; Nath, B.; Roh, H. Questionnaire based study of drivers’ error and violation at four-legged signalized intersection. Transportat. Lett. Int. J. Transport. Res. 2022, 14, 944–955. [Google Scholar] [CrossRef]
  20. Saito, Y.; Sugaya, F.; Inoue, S.; Raksincharoensak, P.; Inoue, H. A context-aware driver model for determining recommended speed in blind intersection situations. Accid. Anal. Prev. 2021, 163, 106447. [Google Scholar] [CrossRef]
  21. Shen, X.; Raksincharoensak, P. Statistical models of near-accident event and pedestrian behavior at non-signalized intersections. J. Appl. Stat. 2022, 49, 4028–4048. [Google Scholar] [CrossRef] [PubMed]
  22. Min, K.; Ando, A. Analysis on characteristics of dangerous driving events via recorded data of drive-recorder. Transp. Res. Procedia 2020, 48, 1342–1363. [Google Scholar] [CrossRef]
  23. Matsui, Y.; Hitosugi, M.; Takahashi, K.; Doi, T. Situations of car-to-pedestrian contact. Traffic Inj. Prev. 2013, 14, 73–77. [Google Scholar] [CrossRef] [PubMed]
  24. Nagai, M. Current situation in registration and application of drive recorder database. In Proceedings of the Forum in JSAE Spring Convention in 2009 “What the Drive Recorder can contribute for Traffic Safety”, Yokohama, Japan, 20 May 2009. (In Japanese). [Google Scholar]
  25. Near-Miss Incident Database Usage Manual; Drive Recorder Data Center of Smart Mobility Research Center in Tokyo University Agriculture and Technology: Tokyo, Japan, 2021. (In Japanese)
  26. Distance Measurement Tool Manual; Drive Recorder Data Center of Smart Mobility Research Center in Tokyo University Agriculture and Technology: Tokyo, Japan, 2021. (In Japanese)
  27. Koh, P.P.; Wong, Y.D.; Chandrasekar, P. Safety evaluation of pedestrian behaviour and violations at signalized pedestrian crossings. Saf. Sci. 2014, 70, 143–152. [Google Scholar] [CrossRef]
  28. Institute for Traffic Accident Research and Data Analysis of Japan (ITARDA). Behavior Analysis of Ego Vehicles during Right Turning before Impact Events; ITARDA: Tokyo, Japan, 2022. (In Japanese) [Google Scholar]
  29. Matsui, Y.; Oikawa, S.; Sorimachi, K.; Imanishi, A.; Fujimura, T. Association of impact velocity with risks of serious injuries and fatalities to pedestrians in commercial truck–pedestrian accidents. Stapp. Car Crash. J. 2016, 60, 165–182. [Google Scholar]
  30. Hussain, Q.; Feng, H.; Grzebieta, R.; Brijs, T.; Olivier, J. The relationship between impact speed and the probability of pedestrian fatality during a vehicle-pedestrian crash: A systematic review and meta-analysis. Accid. Anal. Prev. 2019, 129, 241–249. [Google Scholar] [CrossRef]
  31. Mori, M.; Tsukaguchi, H. Pedestrian movements on footways. Proc. Jpn. Soc. Civ. Eng. 1977, 1977, 99–108. [Google Scholar] [CrossRef]
  32. Test protocol-AEB/LSS VRS systems version 4.3; European New Car Assessment Programme (Euro NCAP). Available online: https://cdn.euroncap.com/media/75436/euro-ncap-aeb-lss-vru-test-protocol-v43.pdf (accessed on 3 February 2022).
  33. Abdel-Aty, M.; Cai, Q.; Wu, Y.; Zheng, O. Evaluation of automated emergency braking system’s avoidance of pedestrian crashes at intersections under occluded conditions within a virtual simulator. Accid. Anal. Prev. 2022, 176, 106797. [Google Scholar] [CrossRef] [PubMed]
  34. Hu, W.; Cicchino, J.B. Relationship of pedestrian crash types and passenger vehicle types. J. Saf. Res. 2022, 82, 392–401. [Google Scholar] [CrossRef]
  35. Obeidat, M.S.; Altheeb, N.F.; Momani, A.; Al Theeb, N. Analyzing the invisibility angles formed by vehicle blind spots to increase driver’s field of view and traffic safety. Int. J. Occup. Saf. Ergon. 2022, 28, 129–138. [Google Scholar] [CrossRef]
  36. Santos, A.C.; Gerez, A.; Pádua, A.; Genaro, P.; Silva, R.; Ferreira, S. The influence of A-pillar obscuration/location on driver visibility. SAE Tech. Pap. 2020, 2019-36-0062. [Google Scholar] [CrossRef]
Figure 1. Direction of pedestrian crossing.
Applsci 13 04189 g001
Figure 2. Relative position of a pedestrian from an ego vehicle.
Applsci 13 04189 g002
Figure 3. Ego vehicle and other vehicles.
Applsci 13 04189 g003
Figure 4. Traveling directions of other vehicles: (a) preceding and (b) oncoming vehicle.
Applsci 13 04189 g004
Figure 5. Incidence rate according to road width to/through the intersection in the presence of Left-Pedestrian (n = 72) and Right-Pedestrian (n = 40): (a) to the intersection; (b) through the intersection.
Applsci 13 04189 g005
Figure 6. Relationship of number and travel directions through the intersection of preceding vehicles or oncoming vehicles in each incident: (1) Preceding vehicles; (a) Left-Pedestrian (n = 17); (b) Right-Pedestrian (n = 10); (2) oncoming vehicles; (c) Left-Pedestrian (n = 16); (d) Right-Pedestrian (n = 10).
Applsci 13 04189 g006
Figure 7. Relationship of travel directions through the intersection of preceding and oncoming vehicles in each incident: (a) Left-Pedestrian (n = 11); (b) Right-Pedestrian (n = 6).
Applsci 13 04189 g007
Figure 8. Positional distribution of ego vehicles and pedestrians when the drivers applied the brakes: (a) Left-Pedestrian (n = 72); (b) Right-Pedestrian (n = 40).
Applsci 13 04189 g008
Figure 9. Lateral distances, forward distances, and relative angles between ego vehicles and pedestrians when the drivers applied the brakes: (a) lateral distances; (b) forward distances; (c) relative angles.
Applsci 13 04189 g009
Figure 10. Size of the intersection with vehicles traveling on the left side of roads where near-miss incidents are frequently observed: (a) Left-Pedestrian; (b) Right-Pedestrian.
Applsci 13 04189 g010
Table 1. Data analysis items.
Comparison Items
Day vs. night (1) Near-miss incidents between a right-turning vehicle and a pedestrian
Left-Pedestrian vs. Right-Pedestrian (2) Road width
(3) Ego vehicle travel speed
(4) Existence of other vehicles
(5) Relationship of numbers and/or travel directions of other vehicles
(6) Relative positions of ego vehicles and pedestrians
Table 2. Statistical significance of differences in the distribution of near-miss incidents between right-turning vehicles and pedestrians during daytime and night-time.
Situation DaytimeNight-TimeA [%] vs. B [%]
p-Value (1), (2)
nA [%]nB [%]
Day/Night (Total n = 112) 4338.46961.6--
Weather
Sunny 3581.45376.80.565
Rain 716.31521.70.479
Snow 12.311.4n/a
Direction of a pedestrian crossing
Left-to-right side (Left) (Left) mirror 2865.14463.80.885
Right-to-left side (Right) 1534.92536.20.885
Pedestrian crossing location
Crosswalk 3888.46188.40.996
Non-crosswalk 511.6811.6-
Traffic lights
for vehicles/for pedestrians
with/with 2967.44362.30.582
with/without 00.0811.6n/a
without/with 12.300.0n/a
without/without 1330.21826.10.663
Road width
Road to the intersection
Narrow 614.01420.30.394
Medium 2251.22942.00.345
Wide 1534.92637.70.765
Road through the intersection
Narrow 818.61318.80.975
Medium 1330.23144.90.121
Wide 2251.22536.20.119
Ego vehicle travel speed
≤ 10 km/h 1023.32130.40.409
≤ 20 km/h 2558.13550.70.444
≤ 30 km/h 818.61318.80.975
Existence of classified other vehicles
with
without
35
8
81.4
18.6
46
23
66.7
33.3
0.090
-
(1) A significant difference was determined using a two-tailed statistical test of the sample rates. (2) p-value was not available (n/a) when either n of categorized daytime or night-time was 5 or less.
Table 3. Near-miss incidents according to range of vehicle travel speed in the presence of Left-Pedestrian and Right-Pedestrian.
Vehicle Travel SpeedLeft-PedestrianRight-PedestrianA [%] vs. B [%]
[km/h]NA [%]nB [%]p-Value (1)
≤10 km/h2636.1512.20.007 **
≤20 km/h3751.42356.10.534
≤30 km/h912.51231.70.023 *
Total72100.040100.0
(1) A significant difference was determined using a two-tailed statistical test of sample rates. * p-value < 0.05, ** p-value < 0.01.
Table 4. Average of ego vehicle travel speed in the presence of Left-Pedestrian and Right-Pedestrian.
Left-PedestrianRight-Pedestrian
AverageSDAverageSDp-Value (1)
Ego vehicle travel speed
[km/h]
13.46.317.15.70.002 **
(1) A significant difference was determined using a two-sample t-test. ** p-value < 0.01.
Table 5. Comparison of the distribution of near-miss incidents according to the combination of other categorized vehicles in the presence of Left-Pedestrian and Right-Pedestrian.
Categorized Other Vehicles by Combinations in Each Near-Miss Incident Left-PedestrianRight-PedestrianA [%] vs. B [%]
nA [%]nB [%]p-Value (1), (2)
Existing:
Preceding vehicles 1723.61025.00.869
Oncoming vehicles 1622.21025.00.739
Crossing vehicles 34.212.5n/a
Preceding and oncoming vehicles 1115.3615.00.969
Preceding and crossing vehicles 34.225.0n/a
Oncoming and crossing vehicles 00.025.0n/a
Sub total 5069.43177.50.361
No other vehicles 2230.6922.50.361
Total 72100.040100.0
(1) A significant difference was determined using a two-tailed statistical test of sample rates. (2) p-value was not available (n/a) when either n of categorized daytime or night-time was 5 or less.
Disclaimer/Publisher’s Note: The statements, opinions and data contained in all publications are solely those of the individual author(s) and contributor(s) and not of MDPI and/or the editor(s). MDPI and/or the editor(s) disclaim responsibility for any injury to people or property resulting from any ideas, methods, instructions or products referred to in the content.

