Abstract
A new method for evaluating the liquefaction probability of saturated soils is presented in this paper. The existing methods are mainly expressed in equation form, and the evaluation process is always complex. Therefore, to address these shortcomings, a new method based on a tabular form is constructed using a hybrid approach combining the logistic equation and decision trees (classification and regression tree and chi-squared automatic interaction detector) based on the shear wave velocity test databases. The effectiveness of the new method was verified by comparing the predicted liquefaction results with actual liquefaction results. The new method improved the accuracy of the liquefaction evaluation method based on shear wave velocity; the classification was correct for more than 75% of the samples. In addition, the importance of the liquefaction factors was considered during the method construction, which ultimately simplified the evaluation process while ensuring accuracy.
1. Introduction
The liquefaction of saturated soil is a common disaster phenomenon mainly caused by earthquakes. With the development of earthquake investigation methods, a growing number of liquefaction cases have demonstrated potential for causing serious damage. Selecting reasonable methods to evaluate the potential for site liquefaction is crucial for selecting effective anti-liquefaction measures before liquefaction occurs.
At present, various in situ test indices can be used for liquefaction evaluation [1], such as standard penetration, static penetration, and shear wave velocity tests. Of these indices, the shear wave velocity is widely used in engineering because it is easy to obtain. More importantly, the shear wave velocity can be obtained through laboratory tests [2], and it is highly correlated with the soil properties, which is convenient for further research. For example, based on the basic cyclic stress ratio (CSR) theory, Dobry first proposed a method of determining the liquefaction potential of saturated sand using the shear wave velocity [3]. Tokimatsu and Uchida proposed a modified relationship between the liquefaction criticality (Vs) and CSR [4]. Andrus established the critical resistance ratio (CRR) and Vs relationship [5]. Juang proposed shear wave velocity liquefaction probability assessment methods using artificial neural networks [6], logistic regression, and Bayesian mapping. Andrus compared liquefaction evaluation methods using penetration–Vs relationships [7]. Kayen proposed another liquefaction probability assessment method using Bayesian regression [8].
The above liquefaction evaluation methods based on the shear wave velocity can be transformed from deterministic to probabilistic methods. The above liquefaction evaluation methods based on the shear wave velocity can be transformed from deterministic to probabilistic methods. At the same time, machine learning was developed as an auxiliary means, and some new conclusions were obtained. Mahmood Ahmad interpreted the probabilistic reasoning of the robust BBN model investigating the performance of the Bayesian belief network (BBN) and C4.5 decision tree (DT) models to evaluate seismic soil liquefaction potential based on a cone penetration test (CPT) dataset [9]. Chongke Bi proposed a machine learning-based liquefaction disaster assessment method based on a convolutional neural network (CNN) model and a Light Gradient Boosting Machine (Light GBM) model [10]. Yonggang Zhang proposed to optimize the deep neural network (DNN) and decided to train the prediction model by a multi-layer fully connected network (ML-FCN) based on the Vs and SPT dataset [11]. However, the above methods only carry out operations checking calculations for the machine learning model, without providing specific evaluation criteria as a conclusion. Although there has been great progress in the study of liquefaction probability evaluation methods [12], the complicated equation fitting process leads to a complicated form of the liquefaction probability equation, which is not convenient for practical engineering use [13]. To address this issue, in this study, a new modeling method was adopted to construct a convenient liquefaction probability evaluation table. This study was divided into two parts.
Part 1: First, a logistic regression (LR) liquefaction probability evaluation equation was constructed, and then the liquefaction probability of each site in a database was calculated. Finally, the rationality of the liquefaction probability values was evaluated.
Part 2: All the sites in the dataset were divided into three grades based on the liquefaction probabilities. The liquefaction grade and factors were substituted into a decision tree to obtain interpretable classification results of the liquefaction grades of various sites. A new liquefaction probability scale was derived from the decision tree results. Finally, the rationality of the liquefaction evaluation scale was evaluated.
The significance of this study is not only that tabular grading criteria were proposed for the liquefaction potential but also that a decision tree was applied in the study of the liquefaction potential. In the future, this concept can be used to construct liquefaction potential assessment methods based on other in situ test results.
2. Data Source
The data in this study were on-site liquefaction data collected and published by Andrus et al. and Kayen et al. [5,8]. These sites were distributed across six countries and regions around the world, and the time span was from 1906 to 2011. The published data included the site characteristic parameters of liquefied and non-liquefied sites, as shown in Table 1. All data are in the horizontal field, which is also the hypothesis applied in this method.

Table 1.
Site characteristic parameters.
The seismic intensity in Table 1 was determined based on the maximum ground acceleration(amax). The liquefied sites were divided based on the parameter amax following the Chinese Code (GB18306-2015) [14], and the categories are shown in Table 2. In this study, intensities VI, VIII, and IX were considered.
Table 2.
Peak acceleration zones of ground motion.
3. Methods
3.1. Logistic Regression (LR) Model
The LR model is a multivariate statistical analysis method that deals with multifactor categorical variables. Liquefaction is a dichotomous problem, i.e., liquefaction either occurs or it does not. Thus, the LR model is suitable for performing liquefaction evaluation, and it has been widely used in the probabilistic evaluation of liquefaction potential. For example, Liao established a binomial LR equation using the standard penetration test (SPT) and CSR data as independent variables based on the SPT data from 278 sites [15]. Youd and Noble established a set of liquefaction probability equations based on SPT data [16]. Juang et al. compared the probabilities of liquefaction calculated via an LR and a Bayesian mapping based on SPT data [17], cone penetration test (CPT) data, and Vs. Jafarian et al. derived an equation for the liquefaction probability based on the relative state parameter index [18], which was based on SPT and CPT data. Cao et al. used this model to construct a liquefaction evaluation equation for gravelly soils [19].
3.2. Decision Tree
In this study, two decision tree methods were used to transform the liquefaction probability equation into tabular form. These included an importance ranking method which is called variable importance, and the results obtained by this method were used as the basis for selecting evaluation parameters. The application of related methods in liquefaction evaluation is rare and needs further study.
A decision tree is a branch of machine learning that represents a mapping relationship between object attributes and object values. This relationship can be graphically displayed in a tree shape and intuitively understood as a prediction model of target values. Based on trial calculations, two decision trees—a chi-squared automatic interaction detector (CHAID) tree and a classification and regression tree (CRT)—obtained good results in this study. In the calculation process, there are two kinds of target variables. When the importance of the variable is sorted, the target variable specifies whether liquefaction occurred. When constructing the liquefaction possibility scale, the target variable is the pre-classification of the liquefaction probability. All the decision trees were developed using SPSS ver. 22. Below is a brief introduction of CHAID and CRT.
CHAID is a decision tree that uses a multipath split based on a target variable, and each independent variable forms corresponding contingency tables [20,21]. The samples are optimally split based on the chi-squared significance test, and finally, a classification rule in the form of a multi-fork tree is formed. CRT is the other algorithm used to build decision trees in this study [22]. Its purpose is to divide the target variables accurately. When dividing the variables, the training dataset composed of test variables and target variables is cyclically dichotomized, and finally, a binary decision tree is constructed. The algorithm can be used for both the classification of discrete variables and the regression of continuous variables. After trial calculations, it was found that the combination of these two methods could effectively classify the potential grade of liquefaction.
The variable importance module in the CRT algorithm was used to quantitatively evaluate how the parameters influenced the liquefaction in this study. In the process of tree growth, the total dataset is divided into many subsets of different independent variables. The role of the variables in this segmentation is the variable importance (VI), which can measure how much effect a variable has in a particular tree. The variable importance VI(X) of predictor variable X is expressed in terms of a normalized quantity relative to the variable having the largest measure of importance. It ranges from 0 to 100, with the variable having the largest measure of importance scored as 100. The results of this analysis are presented in Section 4.
In the process of generating the decision tree in this study, the target variable is the liquefaction potential, and the test variable represents the influence parameters of liquefaction, such as the intensity of the possible ground motion and the information about the saturated liquefiable soil layer. The influence of the parameters on the occurrence of liquefaction is described quantitatively by the variable importance, and the rules of the decision tree are used to predict the possible categories of liquefaction. The results of this analysis are presented in Section 6.
4. Characteristics of Shear Wave Velocity Data
The liquefaction phenomenon is complex, and the influence factors are varied. In the evaluation process of the liquefaction potential, the more parameters that are selected, the more accurate the prediction will be. However, this will lead to a more complex evaluation process. Striking a balance between an accurate evaluation and one involving fewer parameters is important for engineering practicality and cost savings.
The variable importance module in the CRT algorithm was used to construct the importance ranking of the parameters. During the ranking, “yes or no liquefaction” was taken as the dependent variable, and all the liquefaction influence parameters in different databases were taken as independent variables.
The importance values of the five parameters to be selected were ordered. The results are shown in Figure 1. The earthquake’s destructive power had the strongest effect on liquefaction. As the soil in the site used in the fitting dataset was all saturated soil, the influence of the site conditions on the occurrence of liquefaction was not evident. Therefore, parameters ds and dw, which were the easiest to obtain and the most versatile in terms of the site conditions, were selected as representatives.
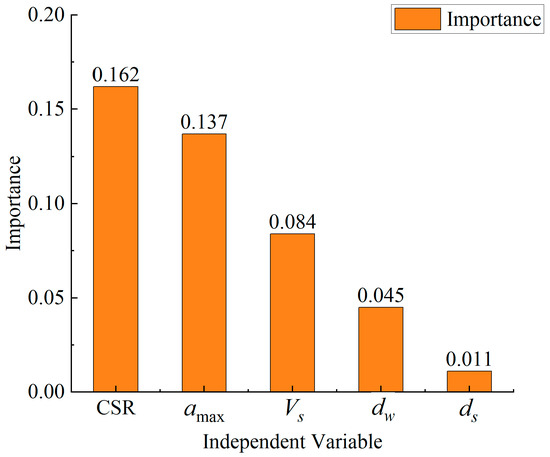
Figure 1.
Ranking of independent variable importance.
Therefore, amax, CSR, Vs, dw, and ds were finally selected as the main input parameters of the shear wave velocity liquefaction probability equation.
5. LR liquefaction Probability Equation
5.1. Construction
In this study, the LR model was selected to construct the liquefaction probability equation. After deleting repeated sites from the databases published by Andrus et al. and Kayen et al., database B was obtained, and this database was used to fit the liquefaction probability equation and construct the liquefaction potential grade criteria, too. The database published by Kayen et al. was used as database C for the verification of the probability equation and the liquefaction potential grade criteria. The database used to construct the equations was database B, which consisted of 473 sets of data. Based on the binary logistic model, the CSR was taken as the transition variable during the fitting process. In other words, in the process of equation fitting, the CSR was used as the fitting parameter. Since the CSR was obtained using parameters such as ds and dw, the final equation does not reflect the CSR, but instead reflects these parameters. The shear wave velocity Vs was used to represent the anti-liquefaction capability of the saturated soil. To enhance the weight of the ground motion intensity in the equation fitting, amax was selected as the weight of the CSR. The following equation was used for the logistic regression:
where θ0, θ1, and θ2 are undetermined coefficients. The dependent variable, PL, was a “yes or no liquefaction” result, where a liquefied site was assigned a value of 1 and a non-liquefied site was assigned a value of 0. The CSR expression was as follows:
For the convenience of calculation, the equation for rd was simplified to rd = 1 − 0.008ds. After simplification, the CSR calculation formula was as follows:
where γs is the sand bulk density, and γw is the water bulk density. Assuming that the soil bulk density was 19 kN/m3, Equation (3) was substituted into Equation (1), and the following equations were finally obtained after fitting:
where PL is the liquefaction probability of the saturated soil, Vs is the measured shear wave velocity (m/s), amax is the peak ground acceleration (g), ds is the buried depth of the liquefiable layer (m), dw is the groundwater depth (m), and Vscr is the critical shear wave velocity for the preset liquefaction probability PL. When the measured shear wave velocity (Vs) was less than Vscr, the soil layer could be identified as undergoing liquefaction for the corresponding liquefaction probability level; otherwise, it did not undergo liquefaction. When this equation was used in the fitting sample, the success rates varied with the preset liquefaction probability, as shown in Figure 2. When PL = 50% was taken as the critical liquefaction probability, the success rate was used to represent the accuracy of the prediction, which was about 70% for the liquefied and non-liquefied sites. As the preset liquefaction probability was varied, the prediction accuracy varied monotonically.
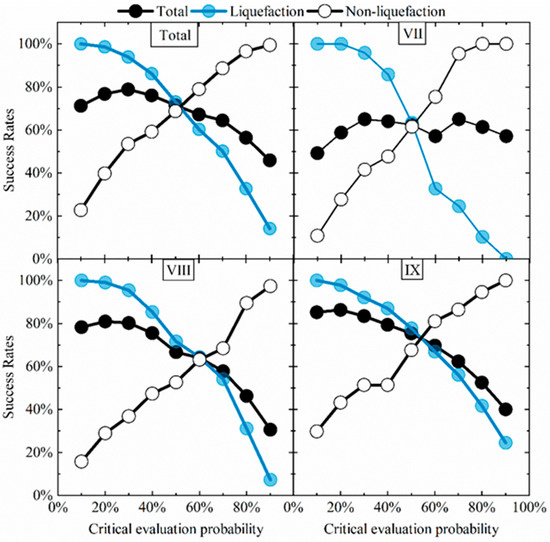
Figure 2.
Success rates of different preset liquefaction probabilities for fitted samples. The data range in the figure is marked at the lower left corner, i.e., all the sites (TOTAL), zone VII, zone VIII, and zone IX.
With different ground motion intervals, the prediction accuracy of a liquefied site and a non-liquefied site changed monotonically with the preset liquefaction probability. With a decrease in the preset liquefaction probability, the prediction accuracy of the liquefied sites increased, while the prediction accuracy of non-liquefied sites decreased. When the prediction results of the three ground motion zones were counted separately, the variations were similar.
For key engineering sites, it is suggested to select the Vscr with a preset probability of liquefaction of 20% for liquefaction evaluation. For this preset probability, the prediction accuracy of the liquefied sites within each seismic interval was over 90%, which can ensure that the liquefaction risk of the predicted sites is extremely low.
5.2. Comparison with Database C
Database C was selected as the verification set, and the Vscr with a preset probability of 50% was used for verification. Statistics on the misjudgments are shown in Table 3.
Table 3.
Retrieval accuracy of the equation for PL = 50%.
In terms of the ground motion zones, the applicability of the logistic regression equation (based on the discrimination accuracy) was higher in the zone VIII and zone IX seismic intervals than in the zone VII seismic intervals. Liquefaction could be accurately predicted for 70% to 80% of the sites in these seismic intervals. The applicability of the logistic equation was directly related to the data distribution in the fitting set. In the fitting set, there was only a small amount of data for the zone VII intensity, and the boundary between the liquefied data and the non-liquefied data was not distinct. When distinguishing the data for the VII intensity, the discrimination accuracy of the equation for a liquefied site was higher than that for a non-liquefied site. For these reasons, the model is safer for engineering use in this case.
Based on the statistics of all the sites, misjudgment cases accounted for 29% of all sites, among which extreme misjudgment cases accounted for 14% of all the sites and 49% of all the misjudgment sites. The statistical results showed that the prediction results of most sites were consistent with the actual site classification. The PL of 51% of the data of the misjudgment cases was concentrated between 33% and 66%, which was near the liquefaction critical line of PL = 50%.
6. Criteria Table of Liquefaction Potential Grade
Liquefaction evaluation is important for practical engineering. The liquefaction evaluation equation for each region described above was scientific and reasonable, and the method was also simple and easy to use. Deterministic methods are the main methods recommended for liquefaction evaluation, but liquefaction probability evaluation methods are more in line with the current development trends. However, compared with deterministic liquefaction evaluation equations, the probabilistic liquefaction evaluation methods often involve complicated equations and calculation processes, and some methods depend on computers. This has resulted in the slow popularization of the probabilistic liquefaction evaluation methods in engineering to a certain extent. If the expression of the probabilistic method is transformed into a simple table, the application convenience of the probabilistic method can be greatly improved.
Machine learning is mainly used in the construction of classification tables. The liquefaction potentials of all the sites were pre-classified according to the calculation results of Equation (4). Then, the classification rules of the liquefaction potential were obtained using the CHAID classification tree method, and the classification rules were finally sorted into tabular form. In this way, the test parameters could be directly substituted into the evaluation table to obtain the liquefaction potential without involving calculations.
6.1. Preliminary Classification
The process for constructing the probabilistic liquefaction potential grading was exploratory, with no specific application under consideration. Therefore, three grades were preliminarily specified. The liquefaction probabilities of 20% and 80% were selected as the limits of the liquefaction potential classification. The liquefaction grades were specified as follows:
If PL < 0.2 low;
If 0.2 < PL < 0.8 medium;
If PL > 0.8 high.
The data distribution after pre-classification is shown in Figure 3. The data with PL values of less than 20% included 40% of the non-liquefied sites and 1% of the liquefied sites. When the PL was greater than 80%, 33% of the liquefied sites and 3% of the non-liquefied sites were included. This pre-classification priority ensured that the data with high and low liquefaction probabilities could be accurately evaluated and that the overall rationality of the final classification method could be guaranteed.
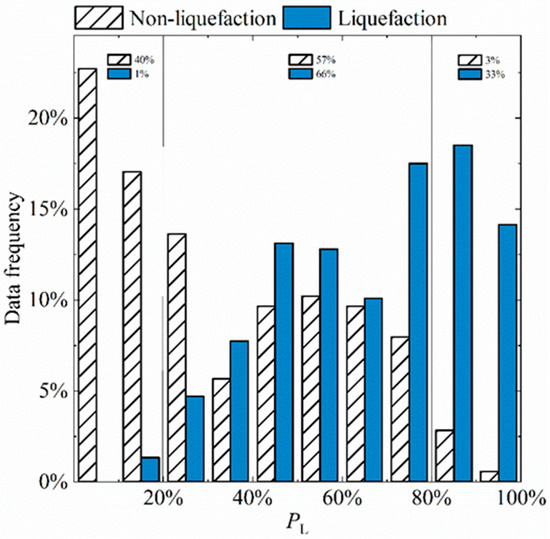
Figure 3.
Histogram of PL versus data frequency for preliminary classification.
6.2. Obtaining Criteria through Decision Tree Method
In the first stage, the CHAID classification tree method was adopted, which is a common decision tree method in machine learning, and SPSS was selected as the analysis software. After several parallel calculations, the tree results that violated the natural laws of soil liquefaction were excluded. In the growth of the tree, the maximum depth was set to two, the minimum number of parent nodes was set to ten, and the number of child nodes was set to ten. The tree result shown in Figure 4 was selected as the final result, which was consistent with the physical soil liquefaction phenomena and adequately subdivided the data. The output of the tree involved two parameters: Vs and amax.
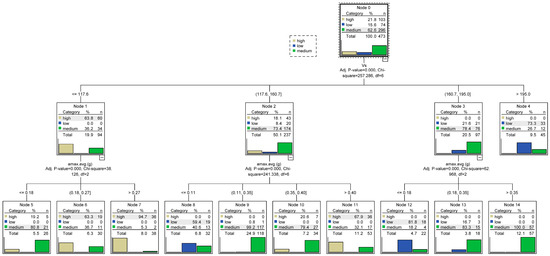
Figure 4.
Decision tree for shear wave velocity liquefaction potential grades.
In the first layer of the tree, the shear wave velocity was taken as the separation parameter, and the database was divided into four parts according to the three cut-off values of the shear wave velocity: 117.6 m/s, 160.7 m/s, and 195.0 m/s. In these four parts, the ground motion acceleration was taken as the separation parameter, and the tree continued to grow. Finally, the tree had eleven final nodes. The purity was relatively high. Therefore, in this study, the result of this tree was chosen as the basis for establishing the classification rules of the liquefaction potential for the three grades.
The tree did not include ds, dw, or other parameters commonly used in existing liquefaction evaluation methods, as ds and dw were not of high importance in the liquefaction classification. After statistical analysis, it was found that the dw values for all the sites in the database were less than or equal to ds; that is, all sites were saturated and had reached the precondition for liquefaction to occur in the saturated soil layer. Liquefaction can occur only when other indices, such as the ground motion intensity, reach certain values. Therefore, the method constructed in this study is suitable for the liquefaction discrimination of saturated soil, and the premise of the method is that the groundwater level was less than the depth of the discriminated layer.
The classification results of the tree described above were analyzed. The recall in Table 4 represents the percentages of true positive samples in the test set that were identified by the tree, and the precision is the percentage of true positive samples in the predicted set. It was found that the recall values of the three grades were all above 80%, especially for the separation of high-grade and low-grade data, for which the recall could approach or surpass 90%. This showed that the model had a good separation effect on these two subsets of the data.
Table 4.
Confusion matrix for three grades.
However, it is worth noting that the range of probabilities of liquefaction across the middle grade was large (20–80%), and the middle grade contained more than 50% of the total data volume. To further distinguish this part of the data (296 data points with ‘medium’ actual values shown in Table 4), in this study, a variety of decision tree methods were attempted, and it was found that the CRT classification tree could distinguish this part of the data more effectively. The partition value was set to PL = 50%. After the division limit was set to PL = 50%, the CRT classification tree result for the further classification of this part of data is as shown in Figure 5.
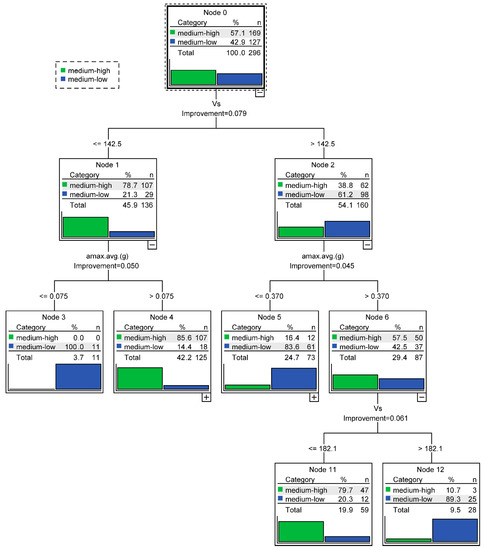
Figure 5.
Tree for shear wave velocity liquefaction potential for medium grade (20% < PL < 80%).
The recall values of the medium-low and medium-high grades in Table 5 were 83.46% and 71.6%, respectively, and the corresponding precision values of the two grades were 68.83% and 82.21%. This indicated that the model could identify the medium-low grade more accurately at the cost of identifying more medium-low-grade samples as medium-high, which showed the conservative degree of the model. In this paper, more than 70% of the data were correctly separated by the decision tree method. However, in a follow-up study, other parameters will be considered to continue to optimize the separation of this subset.
Table 5.
Confusion matrix for medium grade.
6.3. Organized Results in Tabular Form
By integrating the results of the above two trees, the criteria for the liquefaction potential were obtained, as shown in Table 6. These criteria divided the liquefaction potential into four grades, and the liquefaction probabilities from low to high were 1 (low), 2 (medium-low), 3 (medium-high), and 4 (high).
Table 6.
Criteria table of liquefaction potential grade.
Considering the test error of the shear wave velocity, the shear wave velocity values in the first column were rounded to the nearest multiple of ten; that is, 142 m/s was rounded to 140 m/s and 182 m/s was rounded to 180 m/s. Since 317 m/s was the maximum shear wave velocity in the sample set, it was not processed as the upper limit value. The sites with shear wave velocities greater than 317 m/s were assessed as having low liquefaction potentials. After this sorting, the final criterion table of the liquefaction potential grades was obtained, as shown in Table 6.
In the process of using the above liquefaction potential criteria, the shear wave velocity of saturated soil and the site ground motion intensity were used. For example, if the predicted ground motion intensity was 0.1 g and the shear wave velocity of the liquefiable layer was 130 m/s, then the liquefaction potential was identified as grade 1; that is, the liquefaction probability was in the range of 0–20%, and the liquefaction potential was low.
In the liquefaction potential criteria, the variation trends of the Vs of the saturated soil layer and amax of the sites for different liquefaction grades were intuitive; that is, with the increase in Vs or the increase in amax, the liquefaction potential became stronger. This is consistent with the current understanding of liquefaction.
The judgment criteria of the liquefaction potential were applied to the data in the fitting database, and the performance was evaluated based on the accuracy of the liquefaction probability ranges of 0–20%, 20–50%, 50–80%, and 80–100%. The confusion matrix was obtained, as shown in Table 7.
Table 7.
Confusion matrix for verification of liquefaction potential grade criteria.
The accuracy was between 60% and 93% at the four grades of liquefaction. After statistical analysis, it was found that 74% of the misjudgment cases were sites with low liquefaction potential grades that were predicted to be the sites with high liquefaction potential grades.
6.4. Evaluation of Rationality of Liquefaction Potential Grade Criterion
The judgement criteria were applied to the data in database C, which was published by Kayen et al. (2013), for verification, and the obtained discrimination results are shown in Table 8. Of the prediction results, 85% of the sites predicted to be low-grade were originally non-liquefied, and 90% of the sites predicted to be high-grade were originally liquefied. This indicated that the assessment accuracy of the liquefied sites and the non-liquefied sites was high for both low and high grades.
Table 8.
Accuracy of evaluation for the criteria table of liquefaction potential grade.
The 235 sites predicted to be intermediate grade included 150 originally liquefied sites and 85 originally non-liquefied sites. A total of 70% of these liquefied sites were predicted to be medium to high grade, while the non-liquefied sites were predicted roughly evenly to be medium-low and medium-high grades.
As shown in Table 8, the prediction accuracies of the low and high grades were high (more than 85%). After the segmentation of the middle grade, the accuracy of the middle and high grades was also ideal, but the distinction ability between the liquefied and non-liquefied sites of the middle and low grades was not high, which was directly related to the high confusion of the liquefied and non-liquefied sites near the 50% liquefaction probability critical line. In a follow-up study, this part of the data will be deeply analyzed. Other parameters can be further introduced into the judgement criteria to distinguish the middle-grade data more accurately and further improve the practicability and accuracy of the method.
7. Conclusions
(1) Based on the analysis of the shear wave velocity data of existing liquefied sites, it was found that the shear wave velocity did not distinguish the liquefaction of the sites well. The liquefaction potential grade criteria based on the liquefaction probability could effectively improve the applicability of the liquefaction evaluation method based on the shear wave velocity.
(2) After analyzing the database using the importance ranking method, it was found that the ground motion intensity was the main parameter affecting the liquefaction of saturated soil. Based on this conclusion, a liquefaction probability calculation equation of saturated soil was proposed to enhance the influence of the earthquake intensity. A critical value equation of the shear wave velocity liquefaction for different preset probabilities was proposed, and the reliability of the formula was verified.
(3) Based on the CHAID and CRT methods, an evaluation table was proposed to classify the sites into four grades of liquefaction potential: low, medium-low, medium-high, and high. The method is simple in form, and the classification was correct for more than 75% of the samples. This showed that the decision tree method could play a role in the establishment of a shear wave velocity liquefaction evaluation method. However, in the vicinity of critical liquefaction with a probability of 50%, the evaluation effect was not outstanding, and further studies need to be conducted in this range.
This paper explored the application of decision trees for shear wave velocity liquefaction potential assessment. In future studies, with the support of sufficient data, it is necessary to further refine the classification criteria based on the soil type to achieve better assessment results. In addition, the method in this paper is limited to the liquefaction potential of saturated soil, and further study is needed on how to extend it to all sites.
Author Contributions
Conceptualization, Y.Y. and Y.W.; methodology, Y.Y.; software, Y.Y. and Y.W.; validation, Y.Y. and Y.W.; formal analysis, Y.Y. and Y.W.; investigation, Y.Y. and Y.W.; resources, Y.Y. and Y.W.; data curation, Y.Y. and Y.W.; writing—original draft preparation, Y.Y. and Y.W.; writing—review and editing, Y.Y. and Y.W. All authors have read and agreed to the published version of the manuscript.
Funding
This research was funded by Northeast Forestry University.
Institutional Review Board Statement
Not applicable.
Informed Consent Statement
Not applicable.
Data Availability Statement
No new data were created.
Acknowledgments
The authors thank the editor and anonymous reviewers for providing helpful suggestions for improving the quality of this manuscript.
Conflicts of Interest
The authors declare no conflict of interest.
References
- Andrus, R.D.; Arango, I.; Castro, G.; Christian, J.T.; Dobry, R.; Finn, W.D.; Harder, L.F.; Hynes, M.E.; Ishihara, K.; Koester, J.P.; et al. Liquefaction Resistance of Soils: Summary Report from the 1996 NCEER and 1998 NCEER/NSF Workshops on Evaluation of Liquefaction Resistance of Soils. J. Geotech. Geoenvironmental Eng. 2001, 127, 297–313. [Google Scholar]
- Porcino, D.D.; Tomasello, G. Shear wave velocity-based evaluation of liquefaction resistance for calcareous sands of different origin. Soil Dyn. Earthq. Eng. 2019, 122, 235–247. [Google Scholar] [CrossRef]
- Dobry, R.; Ladd, R.S.; Yokel, F.Y.; Chung, R.M.; Powell, D. Prediction of Pore Water Pressure Build up and Liquefaction of Sands during Earthquakes by the Cyclic Strain Method; J. NBS Building Science Series 138; National Bureau of Standards: Gaithersburg, MD, USA, 1982; Volume 138, p. 150. [Google Scholar]
- Tokimatsu, K.; Uchida, A. Correlation Between Liquefaction Resistance and Shear Wave Velocity. Soils Found. 1990, 30, 33–42. [Google Scholar] [CrossRef] [PubMed]
- Andrus, R.D.; Stokoe, K.H.; Chung, R.M.; Juang, C.H. Guidelines for Evaluating Liquefaction Resistance Using Shear Wave Velocity Measurement and Simplified Procedures; US Department of Commerce, Technology Administration, National Institute of Standards and Technology: Gaithersburg, MD, USA, 2003. [Google Scholar]
- Yuan, H.; Lee, D.-H.; Lin, P.-S. Simplified Cone Penetration Test-based Method for Evaluating Liquefaction Resistance of Soils. J. Geotech. Geoenvironmental Eng. 2003, 129, 66–80. [Google Scholar] [CrossRef]
- Andrus, R.D.; Piratheepan, P.; Ellis, B.S.; Zhang, J.; Juang, C.H. Comparing liquefaction evaluation methods using penetration-VS relationships. Soil Dyn. Earthq. Eng. 2004, 24, 713–721. [Google Scholar] [CrossRef]
- Kayen, R.; Moss, R.E.S.; Thompson, E.M.; Seed, R.B.; Cetin, K.O.; Der Kiureghian, A.; Tanaka, Y.; Tokimatsu, K. Shear-Wave Velocity–Based Probabilistic and Deterministic Assessment of Seismic Soil Liquefaction Potential. J. Geotech. Geoenvironmental Eng. 2013, 139, 407–419. [Google Scholar] [CrossRef]
- Ahmad, M.; Tang, X.-W.; Qiu, J.-N.; Ahmad, F. Evaluating Seismic Soil Liquefaction Potential Using Bayesian Belief Network and C4.5 Decision Tree Approaches. Appl. Sci. 2019, 9, 4226. [Google Scholar] [CrossRef]
- Bi, C.; Fu, B.; Chen, J.; Zhao, Y.; Yang, L.; Duan, Y.; Shi, Y. Machine learning based fast multi-layer liquefaction disaster assessment. World Wide Web 2018, 22, 1935–1950. [Google Scholar] [CrossRef]
- Zhang, Y.; Xie, Y.; Zhang, Y.; Qiu, J.; Wu, S. The adoption of deep neural network (DNN) to the prediction of soil liquefaction based on shear wave velocity. Bull. Eng. Geol. Environ. 2021, 80, 5053–5060. [Google Scholar] [CrossRef]
- Juang, C.H.; Zhang, J.; Khoshnevisan, S.; Gong, W. Probabilistic Methods for Assessing Soil Liquefaction Potential and Effect. Geo-Risk 2017, 2017, 122–145. [Google Scholar] [CrossRef]
- Juang, C.H.; Gong, W.; Martin, J.R.; Chen, Q. Model selection in geological and geotechnical engineering in the face of uncertainty—Does a complex model always outperform a simple model? Eng. Geol. 2018, 242, 184–196. [Google Scholar] [CrossRef]
- GB 18306-2015; Seismic Ground Motion Parameters Zonation Map of China. Administration of Quality Supervision, Inspection and Quarantine of People's Republic of China: Beijing, China, 2015.
- Liao, S.S.C.; Veneziano, D.; Whitman, R.V. Regression Models For Evaluating Liquefaction Probability. J. Geotech. Eng. 1988, 114, 389–411. [Google Scholar] [CrossRef]
- Youd, T.L.; Noble, S.K. Liquefaction criteria based on statistical and probabilistic analyses. In Proc., NCEER Workshop on Evaluation of Liquefaction Resistance of Soils; State Univ. of New York: Buffalo, NY, USA, 1997; pp. 201–215. [Google Scholar]
- Juang, C.H.; Jiang, T.; Andrus, R.D. Assessing Probability-based Methods for Liquefaction Potential Evaluation. J. Geotech. Geoenvironmental Eng. 2002, 128, 580–589. [Google Scholar] [CrossRef]
- Jafarian, Y.; Abdollahi, A.S.; Vakili, R.; Baziar, M. Probabilistic correlation between laboratory and field liquefaction potentials using relative state parameter index (ξR). Soil Dyn. Earthq. Eng. 2010, 30, 1061–1072. [Google Scholar] [CrossRef]
- Cao, Z.; Youd, T.L.; Yuan, X.M. Gravelly soils that liquefied during 2008 Wenchuan, China earthquake, Ms=8.0. J. Soil Dyn. Earthq. Eng. 2011, 31, 1132–1143. [Google Scholar] [CrossRef]
- Kass, G. An exploratory technique for investigating large quantities of categorical data. Appl. Stat. 1980, 29, 119–127. [Google Scholar] [CrossRef]
- Biggs, D.; De Ville, B.; Suen, E. A method of choosing multiway partitions for classification and decision trees. J. Appl. Stat. 1991, 18, 49–62. [Google Scholar] [CrossRef]
- Breiman, L.; Friedman, J.H.; Olshen, R.A.; Stone, C.J. Classification and Regression Trees; Chapman & Hall/CRC: New York, NY, USA, 1984. [Google Scholar]


Disclaimer/Publisher’s Note: The statements, opinions and data contained in all publications are solely those of the individual author(s) and contributor(s) and not of MDPI and/or the editor(s). MDPI and/or the editor(s) disclaim responsibility for any injury to people or property resulting from any ideas, methods, instructions or products referred to in the content. |
© 2023 by the authors. Licensee MDPI, Basel, Switzerland. This article is an open access article distributed under the terms and conditions of the Creative Commons Attribution (CC BY) license (https://creativecommons.org/licenses/by/4.0/).