Article

Mechanical Properties and Constitutive Relationship of Cretaceous Frozen Sandstone under Low Temperature

1
Engineering Research Center of Underground Mine Engineering of Ministry of Education, Anhui University of Science and Technology, Huainan 232001, China
2
School of Civil Engineering and Architecture, Anhui University of Science and Technology, Huainan 232001, China
*
Author to whom correspondence should be addressed.
Appl. Sci. 2023, 13(7), 4504; https://doi.org/10.3390/app13074504
Submission received: 16 February 2023 / Revised: 27 March 2023 / Accepted: 29 March 2023 / Published: 2 April 2023
(This article belongs to the Special Issue Artificial Ground Freezing Technology)

Abstract

:
During the construction of coal mine shafts through Cretaceous water-rich stratum using the freezing method, the frozen shaft lining can break and lose stability. Hence, it is necessary to examine the mechanical properties and constitutive relationship of Cretaceous water-rich sandstone under the effect of surrounding rocks. To this end, in this work, the mechanical properties of red sandstone at different confining pressures and freezing temperatures were examined by using a ZTCR-2000 low-temperature triaxial testing system, wherein the 415–418 m deep red sandstone in the Lijiagou air-return shaft of Wenjiapo Mine was taken as the research object. The test results indicated that the stress–strain curves of rock under triaxial compression and uniaxial compression presented four stages: pore compaction, elastic compression, plastic yield, and post-peak deformation. The difference between the two cases was that the post-peak curve of the former was abrupt, while the latter exhibited a post-peak strain softening section. As the freezing temperature was constant, with the raise in the confining pressure, the elastic modulus and peak strength of the rock rose linearly, while the Poisson’s ratio decreased quadratically. As the control confining pressure was constant, the elastic modulus and rock’s peak strength increased with the decrease in the temperature, and under the condition of negative temperature, the two parameters were linearly correlated with the temperature, while the Poisson’s ratio showed the opposite trend. The two-part Hooke’s model and the statistical damage model based on Drucker–Prager (D-P) yield criterion were used to establish the stress–strain relationship models before and after the rock yield point, optimize the model parameters, and optimize the junction of the two models. The results revealed that the optimized model curve was in good agreement with the experimental curve, which suggests that the proposed model can accurately describe the stress–strain characteristics of rock under three-dimensional stress. This verified the feasibility and rationality of the proposed model for examining the constitutive relationship of rocks.

1. Introduction

Coal is still the largest and most reliable source of energy in the world. Since the majority of China’s coal resources are located in the western region, the coal mining operations are being gradually shifted to this region [1,2,3,4]. During the construction of vertical shafts in the western region, the Cretaceous water-rich bedrock section contains a large number of sandstones with low strength and weak cementation, which often leads to the fracture of frozen pipe due to the instability or excessive deformation of surrounding rocks, causing serious engineering accidents [5,6]. Hence, it is of great significance to examine the mechanical properties and constitutive relationship of Cretaceous water-rich sandstone under the effect of surrounding rocks.
To study the mechanical properties of ultra-deep sandstone reservoir rocks, Li Qinghui et al. [7] used a variety of laboratory tests to examine the relationships between the compressive strength, internal friction angle, shear strength, and other mechanical parameters of sandstone and the confining pressure and temperature and compared them with those of shallow sandstone. Tan Wenhui et al. [8] studied the mechanical properties of granite under uniaxial compression by using computerized tomography (CT) scanning technology because of the significant influence of joints and fissures and deduced the constitutive relationship closer to the actual stress state of the sample. Meng Zhaoping et al. [9] studied the impact of lateral pressure on porosity, permeability, deformation, the mechanical properties, and failure mechanism and obtained the fitting equation for the relation between the physical and mechanical properties of sandstone and confining pressure. Although several studies have been conducted on the mechanical properties of rocks under different conditions [10,11,12,13], the mechanical properties of the Cretaceous water-rich sandstone in the western region of China have been rarely examined, and the stress state of sandstone under complex stress conditions needs to be further studied.
The stress state of rock under the crustal stress is very complex, and the rock mechanics basically involves studying the complete stress–strain relationship to characterize the deformation and failure of rocks, i.e., establishing the constitutive relationship of rock [14]. The early studies on the constitutive relationship of rocks were mainly based on the classical continuum mechanics theory. For example, Li Wenting et al. [15] characterized the post-peak elastic modulus obtained during the compressive failure of rock as a function of strain and considered the internal friction angle as the intermediate variable to establish the post-peak nonlinear constitutive relationship on the basis of the Mohr–Coulomb strength criterion. The obtained model accurately described the post-peak mechanical behavior of marble under different confining pressures. Zhang Chunhui et al. [16] introduced the post-peak strength decline index to describe the influence of confining pressure on the post-peak residual strength and secant modulus and established a post-peak strain softening mechanical model of rock by considering the influence of confining pressure. The rationality of the established model was verified by comparing the experimental and numerical simulation results. However, rock is a coherent aggregate of one or more minerals and has complex mechanical properties. On the basis of the continuum theory, the precision of the constitutive model is restricted to the actual working conditions [17].
Subsequently, it was found that the damage constitutive model established by introducing damage mechanics can more accurately describe the stress state of rocks. Cao Wengui et al. [18,19] derived a three-dimensional (3D) damage evolution equation and a damage-softening constitutive equation for rock considering that the micro-element strength of rock obeyed Weibull distribution and normal distribution. Huang Haifeng [20] assumed that the micro-element strength of rock obeyed the improved Harris probability density distribution, established a statistical damage softening model of rock considering the modification of damage variables, and compared the modeling results with the experimental data, proving the applicability and rationality of the proposed model. Considering that there is a compaction section before the peak of weakly cemented sandstone and a strain softening section after the peak, Zhang Weizhong et al. [21] established a parabolic curve linear elastic Duncan hyperbola plastic softening section residual ideal plasticity five-segment model for rock triaxial stress. Combined with the test curve, it was shown that the model could accurately reflect the deformation characteristics of sandstone under triaxial stress, but the multi-segment model had many nodes and complex forms, which is not suitable for engineering applications.
Although the mechanical properties and constitutive relationship of rocks have been extensively examined, there are few reports on the western Cretaceous water-rich sandstone under complex stress conditions. To this end, in this study, the freezing project of the Lijiagou air-return shaft in Wenjiapo Mine was taken as the research background, and a low-temperature triaxial test system was used to investigate the mechanical properties of red sandstone under different confining pressures and different freezing temperatures. On this basis, to accurately describe the obvious crack compaction and strain softening sections of the Cretaceous red sandstone under the action of 3D stress, the stress–strain relationship was established on the basis of the two-part Hooke’s model (TPHM) and the statistical damage model. The findings of this study provide useful insights on the mechanical properties of the Cretaceous sandstone and can serve as a theoretical reference for the constitutive modeling of western water-rich sandstone.

2. Test Plan

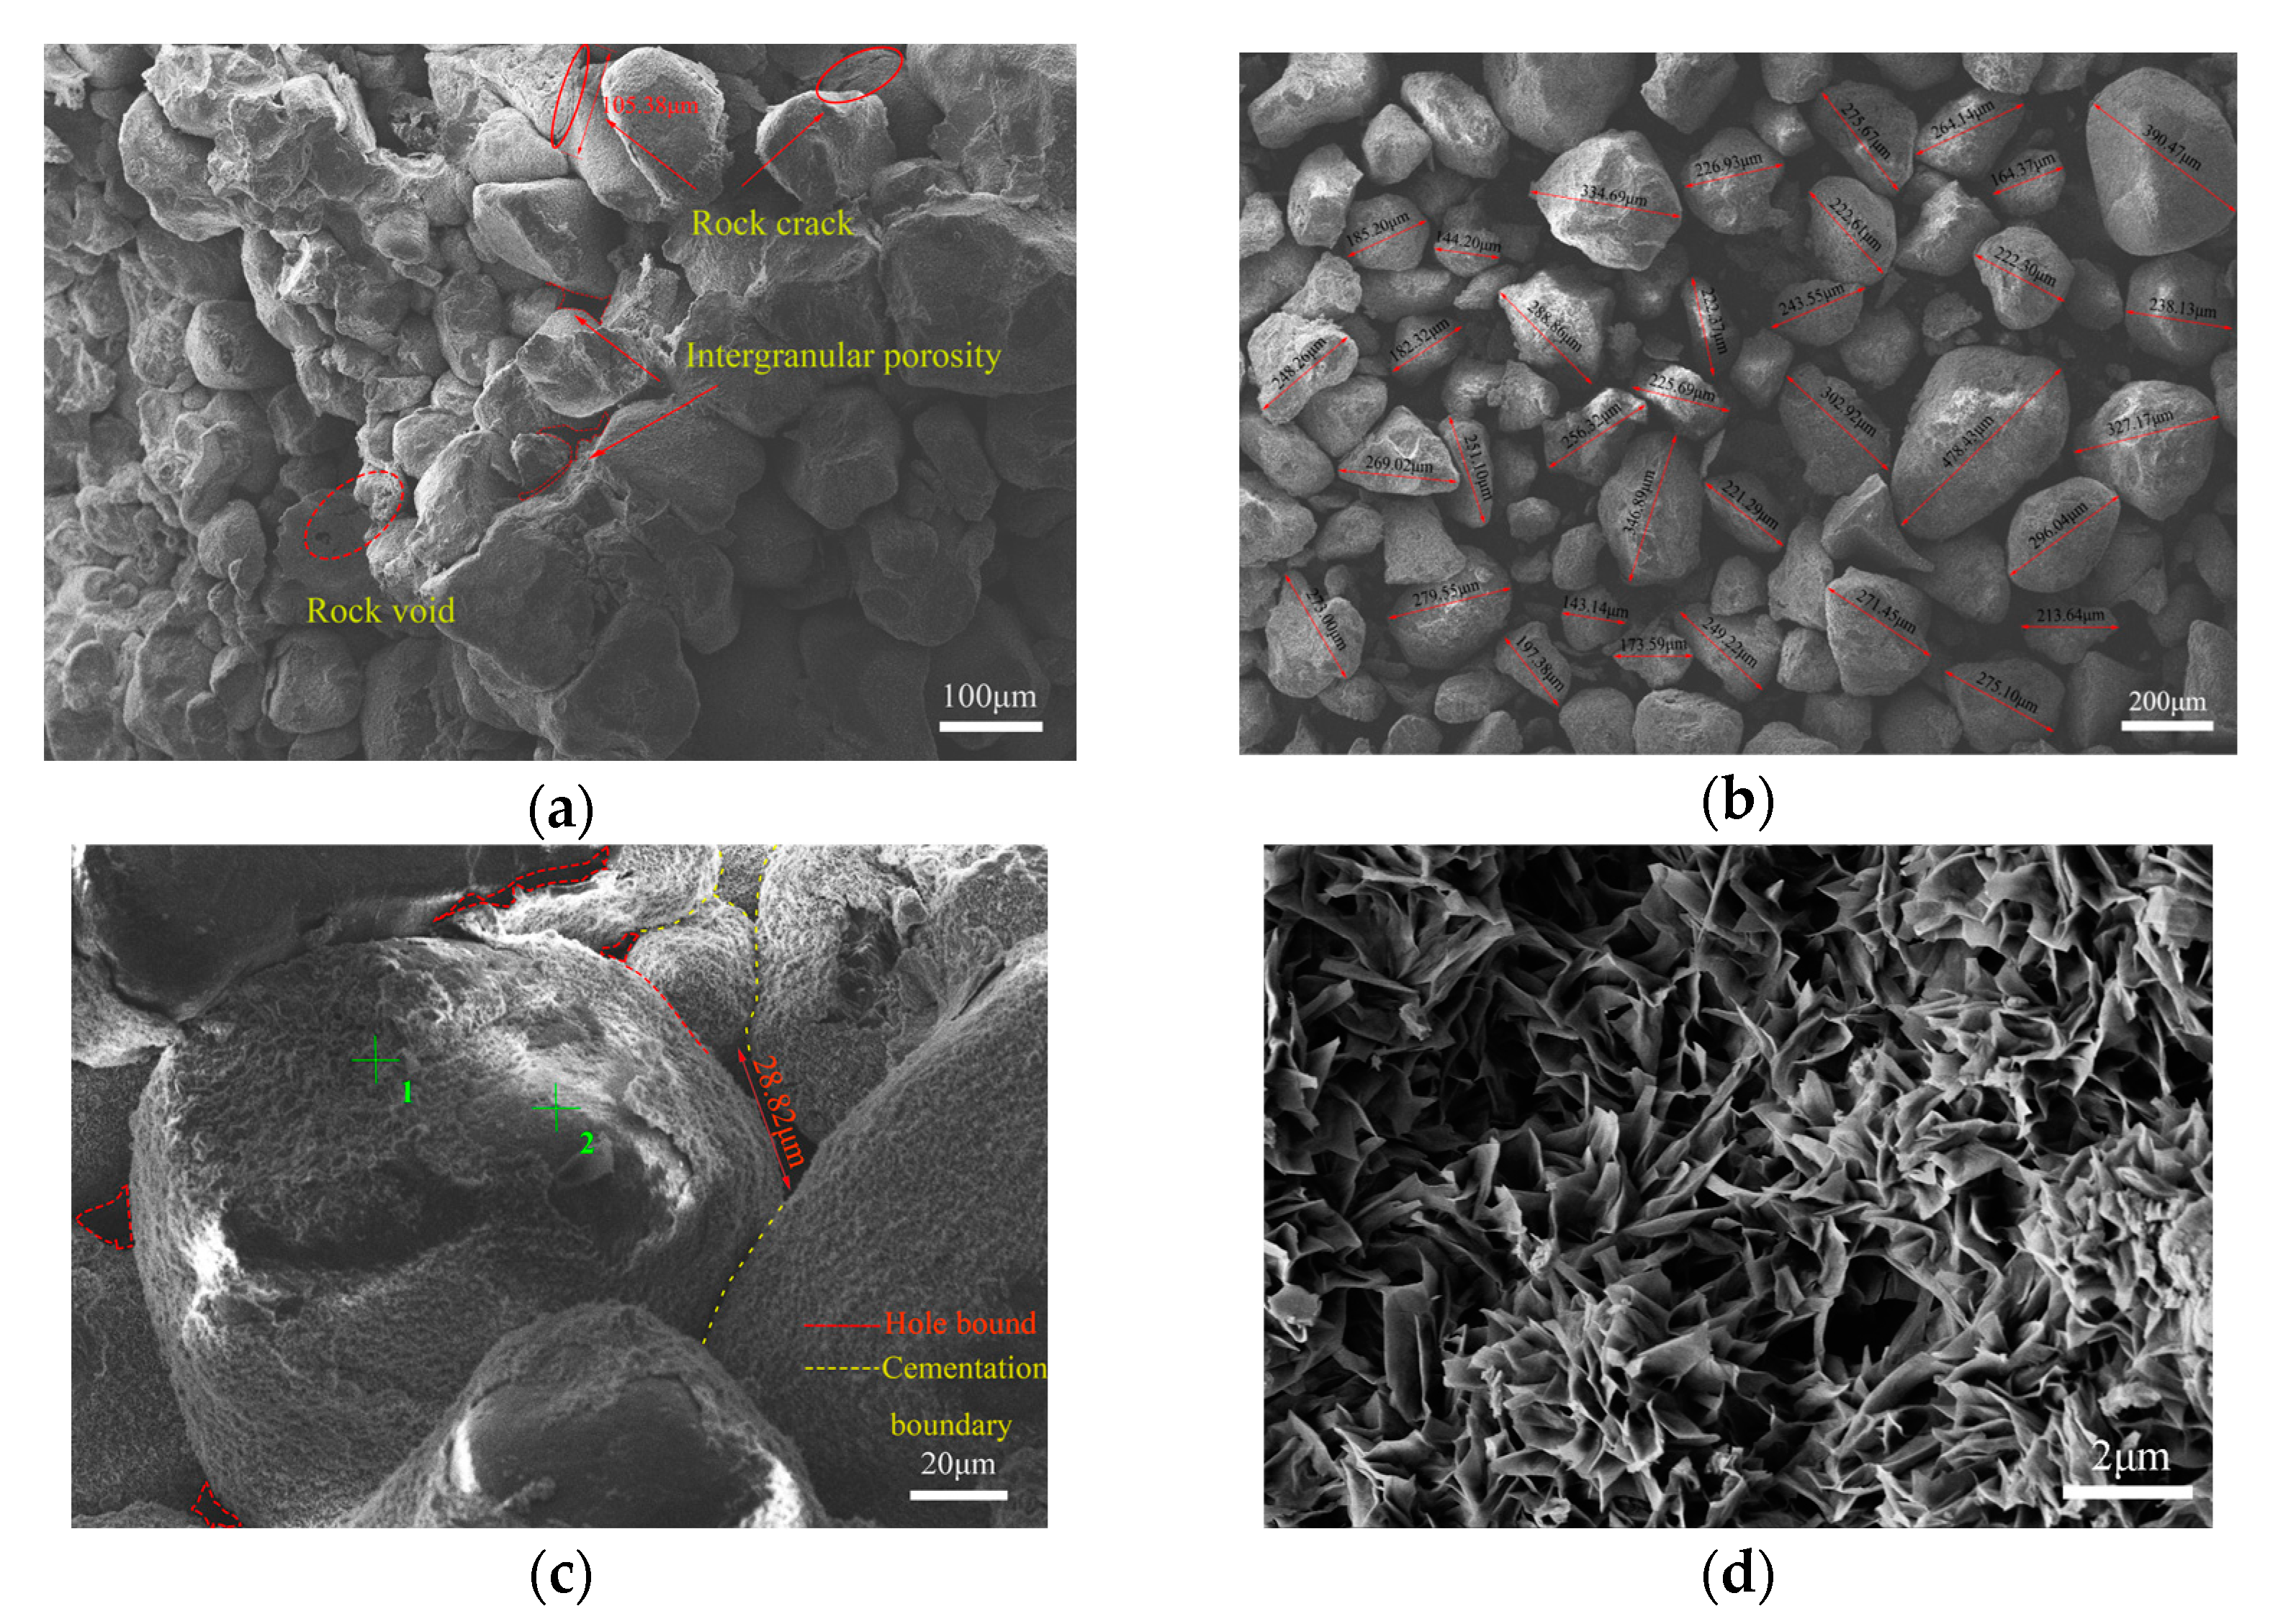
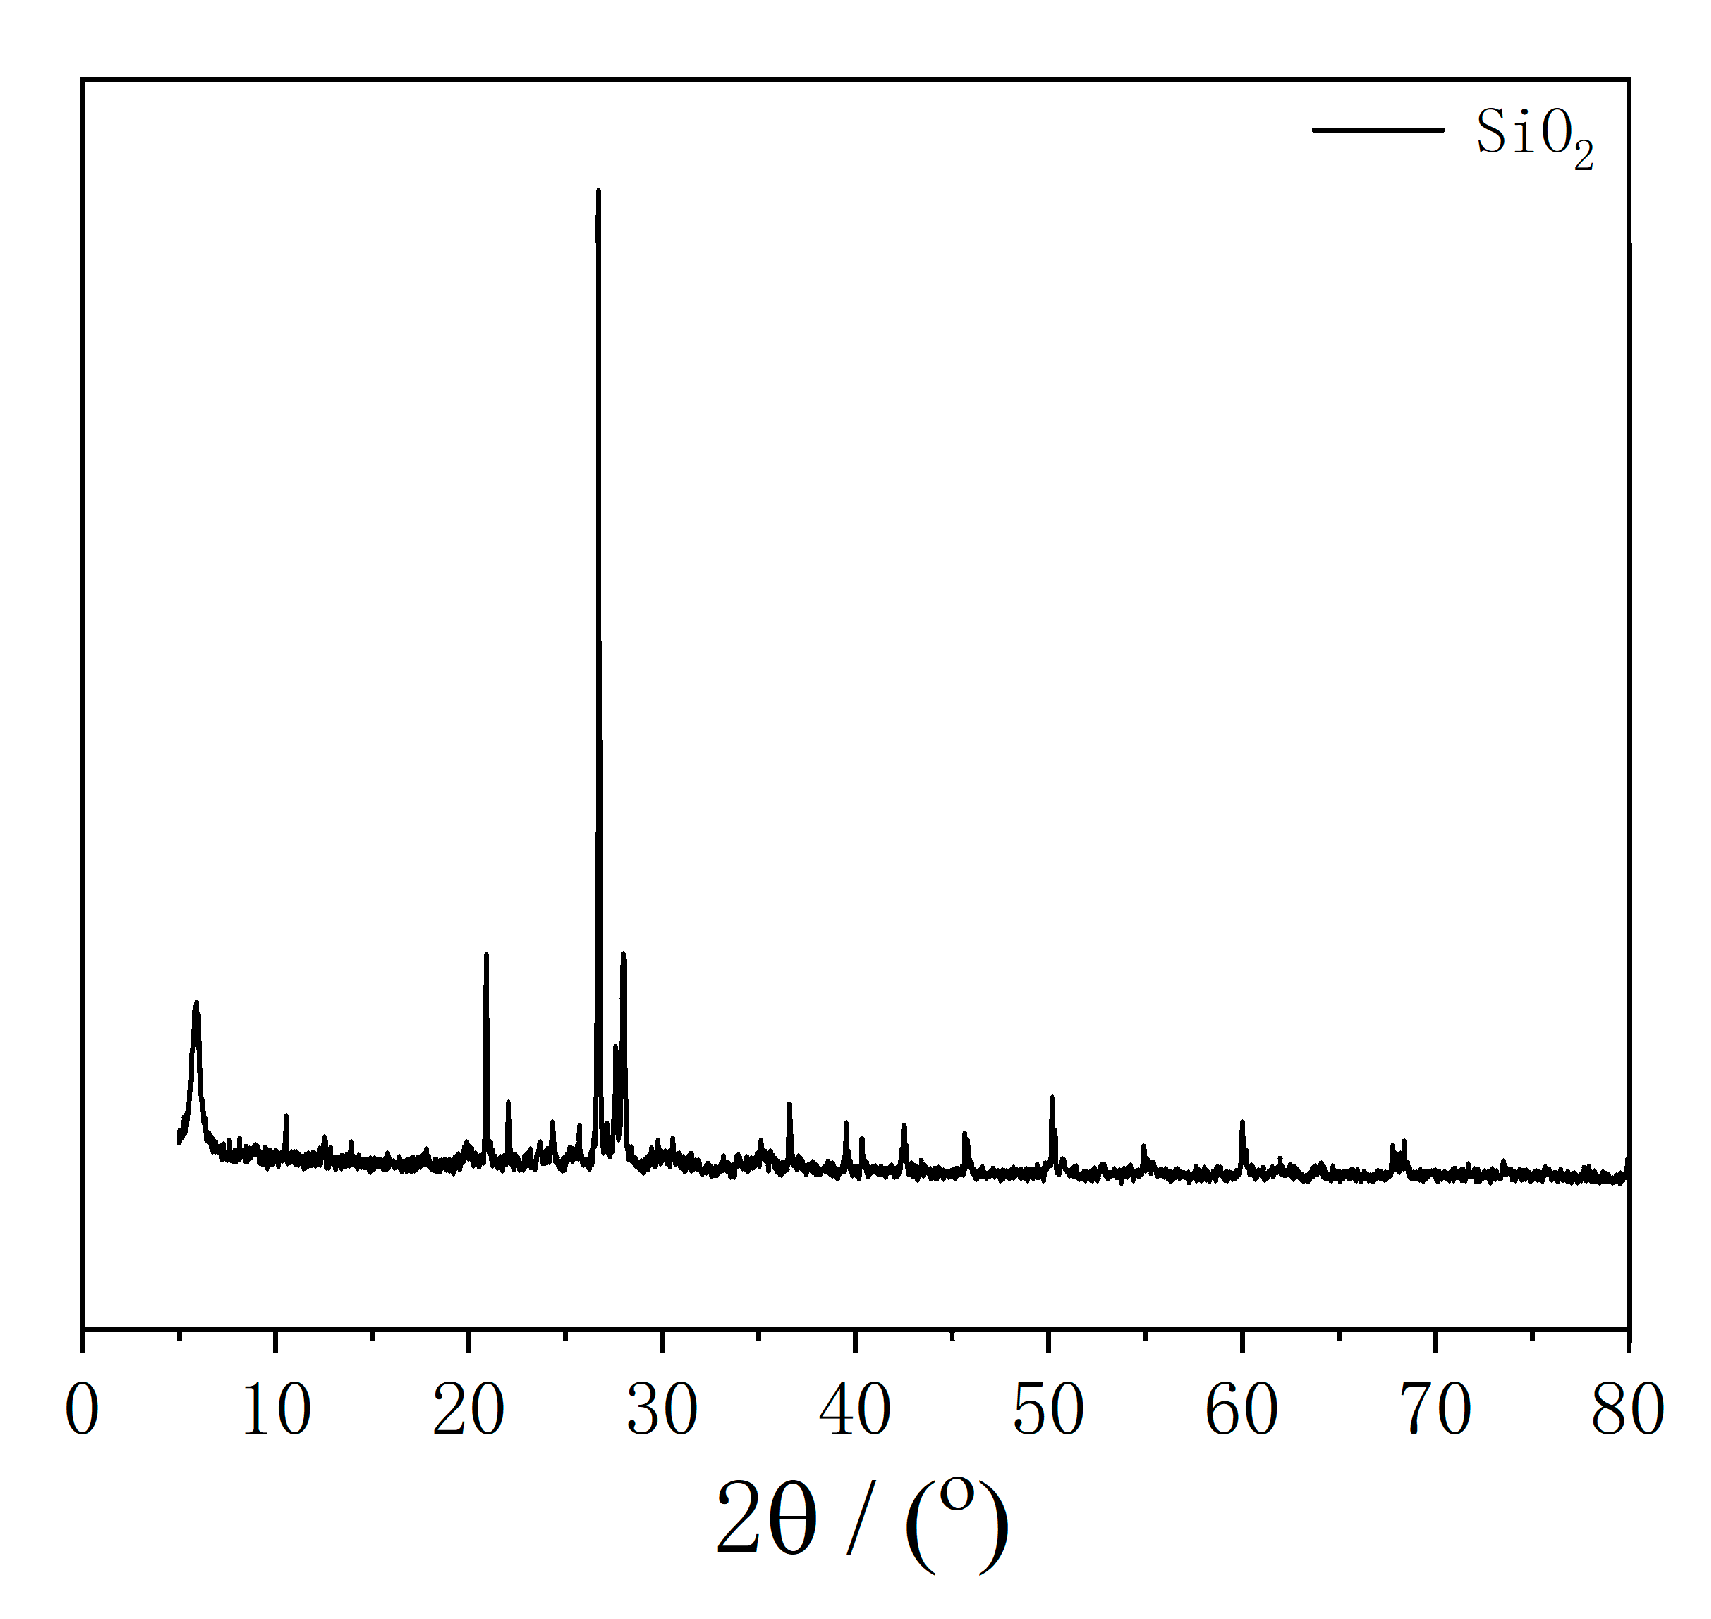
2.1. Sample Preparation
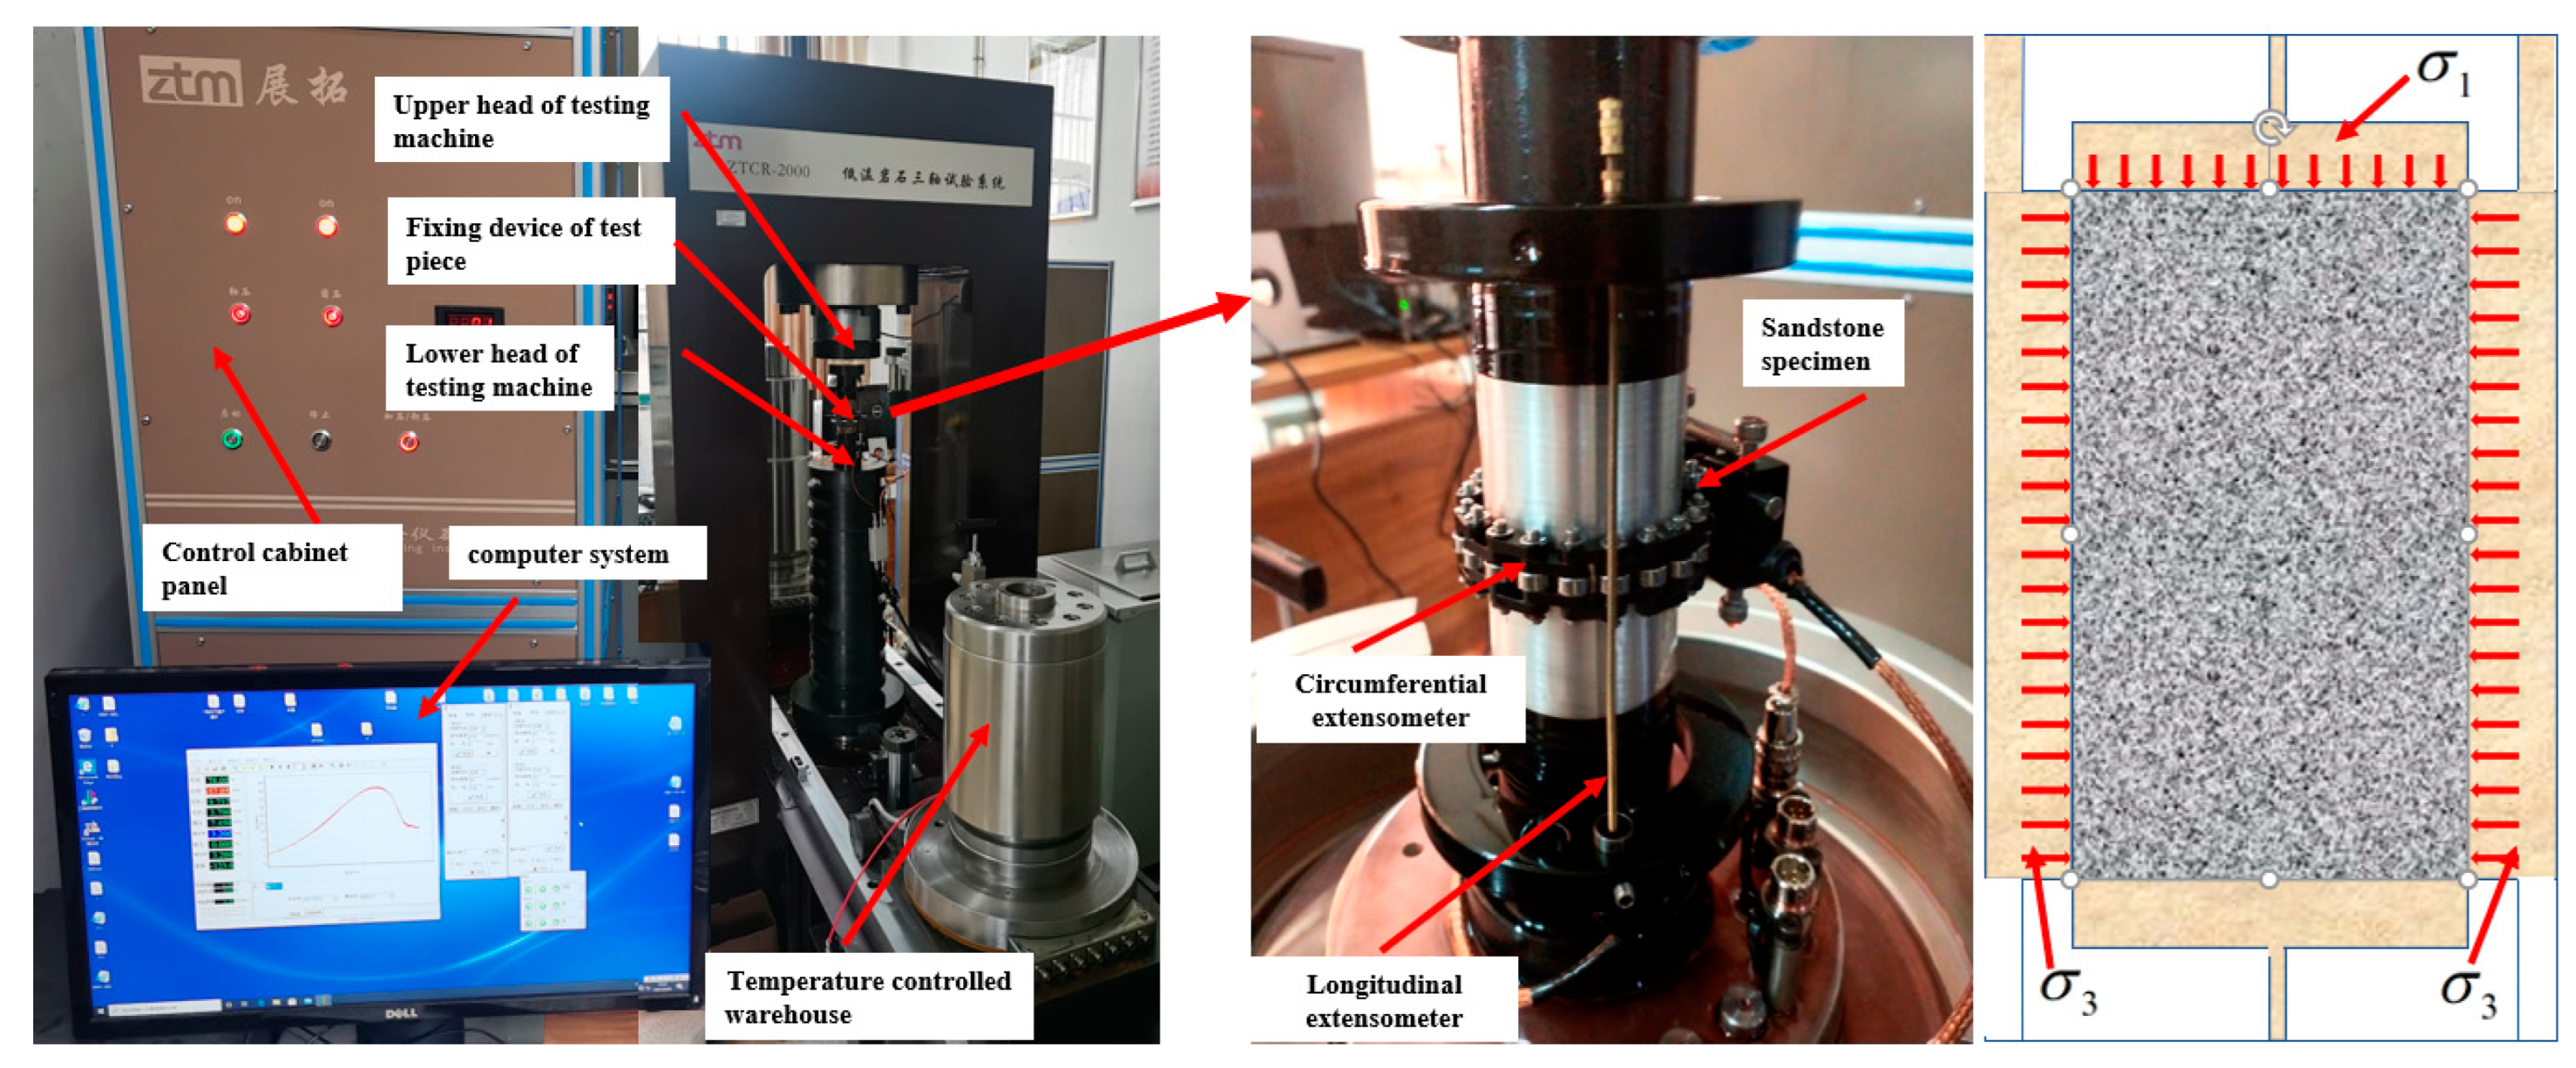
The rock samples in the test were taken from the Lower Cretaceous Luohe Formation of Lijiagou air-return shaft in Wenjiapo Mine, Shaanxi Province, and the burial depth of the rock samples was 415–418 m. A drilling sampler was used to sample the large rocks obtained from the site. After sampling, the rock samples were cut and polished. The diameter and height of the prepared samples were 50 and 100 mm, respectively. The verticality and flatness of the samples were checked on the basis of the relevant specifications of the International Society for Rock Mechanics [22].
The scanning electron microscopy (SEM) images of the rock sample are presented in Figure 1. It is clear from Figure 1a that there were numerous internal cracks in the rock. The rock could be easily broken, and the joints and fissures were relatively developed. When the rock sample was immersed in water, it disintegrated into granules, as depicted in Figure 1b. The particle size of rock was approximately 0.15–0.5 mm, and the particle size distribution was relatively uniform, but there were several pores and cracks in the rock, which corresponded to medium-grained rock characteristics. The rock primarily consisted of cement and mineral particles, wherein the mineral particles were wrapped by cement and connected with adjacent particles, as described in Figure 1c. The microscopic image of the outer cement is depicted in Figure 1d.
Through X-ray diffraction (XRD) analysis, it was found that the rock contained minerals such as quartz, calcite, pyrite, K-feldspar, and clay minerals. Figure 2 shows the X-ray diffraction (XRD) results of the test soil sample, with the main crystal in the soil sample being SiO2. According to the rock classification standard, the rock was red sandstone. The basic physical parameters of the sandstone are shown in Table 1.

2.2. Test Equipment

The experiment equipment mainly included sample preparation and characterization instruments, including a rock drilling sampler (ZS-100), rock cutting machine (DJ-1), double face grinder (SHM-200), electric blast drying oven (DHG9075A), vacuum saturator (NEL-VJH), and non-metallic ultrasonic testing analyzer (NM-4B).
A low-temperature rock triaxial testing system (ZTCR-2000) at the Anhui University of Architecture and Construction was used as the main testing equipment, which included a servo oil source, temperature control system, confining pressure system, axial pressure system, and computer. Presently, it is the most advanced rock testing system in China. The sample installation and working diagram of the rock triaxial compression testing system are shown in Figure 3.

2.3. Test Design

According to the designed burial depth and freezing temperature of rock samples, the test temperatures were 25, −5, −10, and −15 °C, and four confining pressures were considered: 0 (no confining pressure), 2, 4, and 6 MPa. To mark the tested rock samples, the temperature and confining pressure were abbreviated as T and W, respectively. For example, W0T25 implies that the sample was tested at 0 MPa and 25 °C. The specific test scheme is shown in Table 2.
The selected rock samples were placed in a curing box for water retention, and then they were frozen at low temperature. The loading test was only able to be conducted when the temperature of the samples reached the design value and remained stable for at least 24 h. Before the loading test, the test box needed to be cooled to ensure that the ambient temperature of the samples met the test temperature requirements.

3. Mechanical Test Results of Cretaceous Red Sandstone

3.1. Uniaxial Compression Test of Cretaceous Red Sandstone

To examine the mechanical properties of Cretaceous red sandstone under complex crustal stress and different low temperature environments, firstly, uniaxial compression tests were conducted under different ambient temperatures [23,24]. The stress–strain curve of red sandstone under uniaxial compression is depicted in Figure 4. It can be seen that under different temperatures, the stress–strain curve of sandstone included four stages: pore compaction, elastic compression, plastic yield, and post-peak deformation, which were essentially consistent with the typical stress–strain curve of rocks. The difference was that at room temperature (25 °C), the sandstone was destroyed beyond the peak strength point, and the bearing capacity changed suddenly. Under the condition of negative temperature, the sandstone had a residual strength after reaching the peak strength through plastic deformation, which is called the “strain softening stage.” Comparing the stress–strain curves of rock samples under room temperature and three negative temperatures, it was found that with the decrease in the temperature, the elastic modulus and peak strength of the rock increased, but the length of the crack compaction section decreased.

3.2. Triaxial Compression Test of Cretaceous Red Sandstone

The stress–strain curves of red sandstone under triaxial compression at different negative temperatures are provided in Figure 5, and the red sandstone sample under triaxial compression at room temperature was considered the control group. It was evident that under different temperature conditions, the stress–strain curve of red sandstone under triaxial compression was essentially consistent with that under uniaxial compression, conforming to the typical stress–strain curve of rock. Figure 4a demonstrates that at room temperature, with the increase in the confining pressure, the elastic modulus and peak strength were improved. The rock did not have residual strength after the peak strength point, but exhibited a sudden change in the strength, causing rock failure. Under the condition of negative temperature, the triaxial compression strength of sandstone increased with the raise in the confining pressure. Furthermore, with the raise in the confining pressure and the decrease in the temperature, the length of the compaction section decreased. This was because the increase in the confining pressure limited the compression effect of the pores. With the decrease in the temperature, the content of unfrozen water in the rock decreased, and the water in the pores condensed into ice, reducing the pores in the rock.

3.3. Analysis of Mechanical Properties of Rock

Generally, the ground stress of rock in the stratum is relatively complex, usually in the state of three-way loading, and obvious differences also exist due to the influence of temperature during freezing construction. On the basis of the Mohr–Coulomb strength criterion, the peak strength of frozen sandstone under different low temperatures and confining pressures can be obtained from triaxial tests using the values of σmax, Poisson’s ratio μ, and rock’s elastic modulus E. The test results are shown in Table 3.

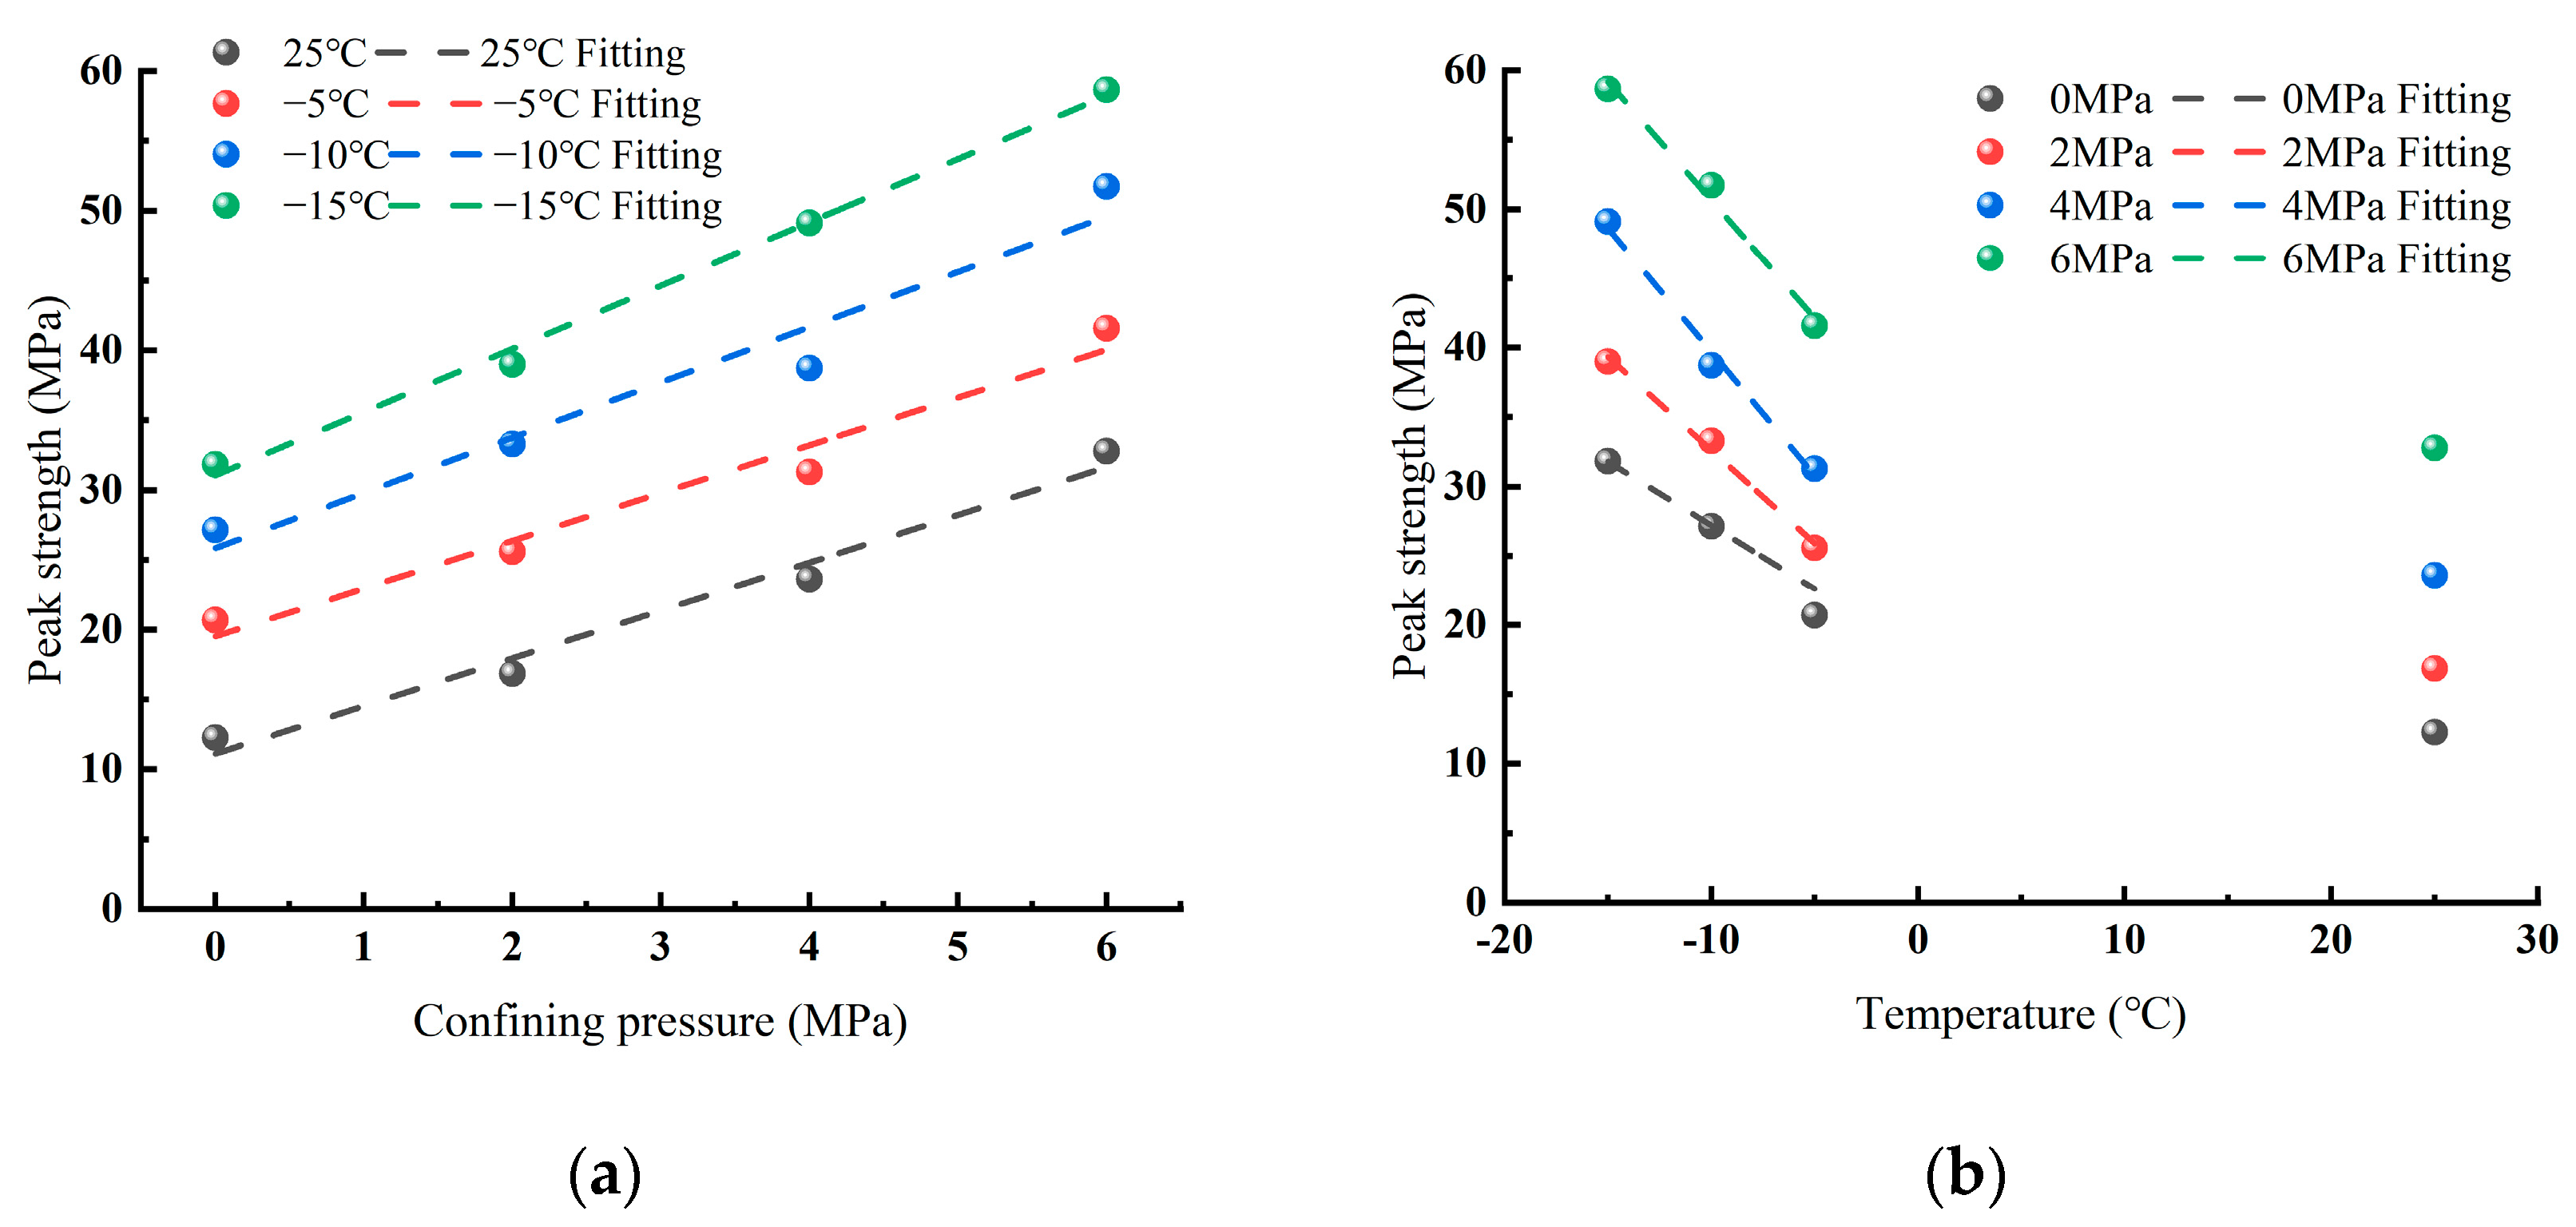
3.3.1. Relationship between the Freezing Temperature/Confining Pressure and the Peak Intensity of Sandstone

The variation in the sandstone peak intensity as a function of the temperature and confining pressure is depicted in Figure 6. It can be seen in Figure 6a that the peak strength of sandstone was linearly proportional to the confining pressure. At room temperature, as the confining pressure of sandstone rose from 0 MPa to 2, 4, and 6 MPa, the corresponding peak strengths increased by 37.45%, 92.87%, and 167.80%, respectively. When the rock temperature was −15 °C, as the confining pressure increased from 0 MPa to 2, 4, and 6 MPa, the peak strengths of sandstone rose by 22.54%, 54.37%, and 84.34%, respectively. When the temperatures of sandstone were 25, −5, 10, and −15 °C, and the applied confining pressure increased from 0 to 6 MPa, the peak strengths increased by 167.80%, 96.33%, 90.64%, and 84.34%, respectively. This indicated that the peak strength of sandstone can be improved by increasing the confining pressure. This is because at a high confining pressure, the lateral deformation of sandstone is constrained, the rock particles are continuously compressed and compacted in the axial direction, and the compacted particles are subjected to axial compression until the rock is sheared.
According to Figure 6b, as the confining pressure was constant, the peak strength linearly increased with the decrease in the negative temperature, but the peak strength at room temperature was different from that at negative temperature. This was because under the condition of negative temperature, the bearing capacity of the rock not only depends on the rock particles, but also on the ice–water mixture generated by the temperature reduction in the rock. The water in the rock can be divided into unfrozen water and ice. The ice not only has a certain strength, but also contributes to the cementation between rock particles, greatly improving the bearing capacity of the rock. As depicted in Figure 6b, as the temperature dropped from room temperature to −5 °C, the peak strengths at the confining pressures of 0, 2, 4, and 6 MPa increased by 40.83%, 34.16%, 24.51%, and 26.84%, respectively. As the confining pressure was 0 MPa, and the temperature dropped from −5 to −15 °C, the growth rates of rock peak strength were 40.83%, 31.09%, and 17.29%, respectively. When the confining pressure was 6 MPa, the corresponding values were 26.84%, 24.35%, and 13.41%, respectively. This shows that under triaxial compression, the strength of rock decreased with the decrease in the negative temperature. This was because with the decrease in the temperature, the content of unfrozen water in the rock decreased gradually, but the water content in the rock was fixed, and the water that can be frozen in the rock gradually decreased, leading to a decrease in the growth rate of rock peak strength.

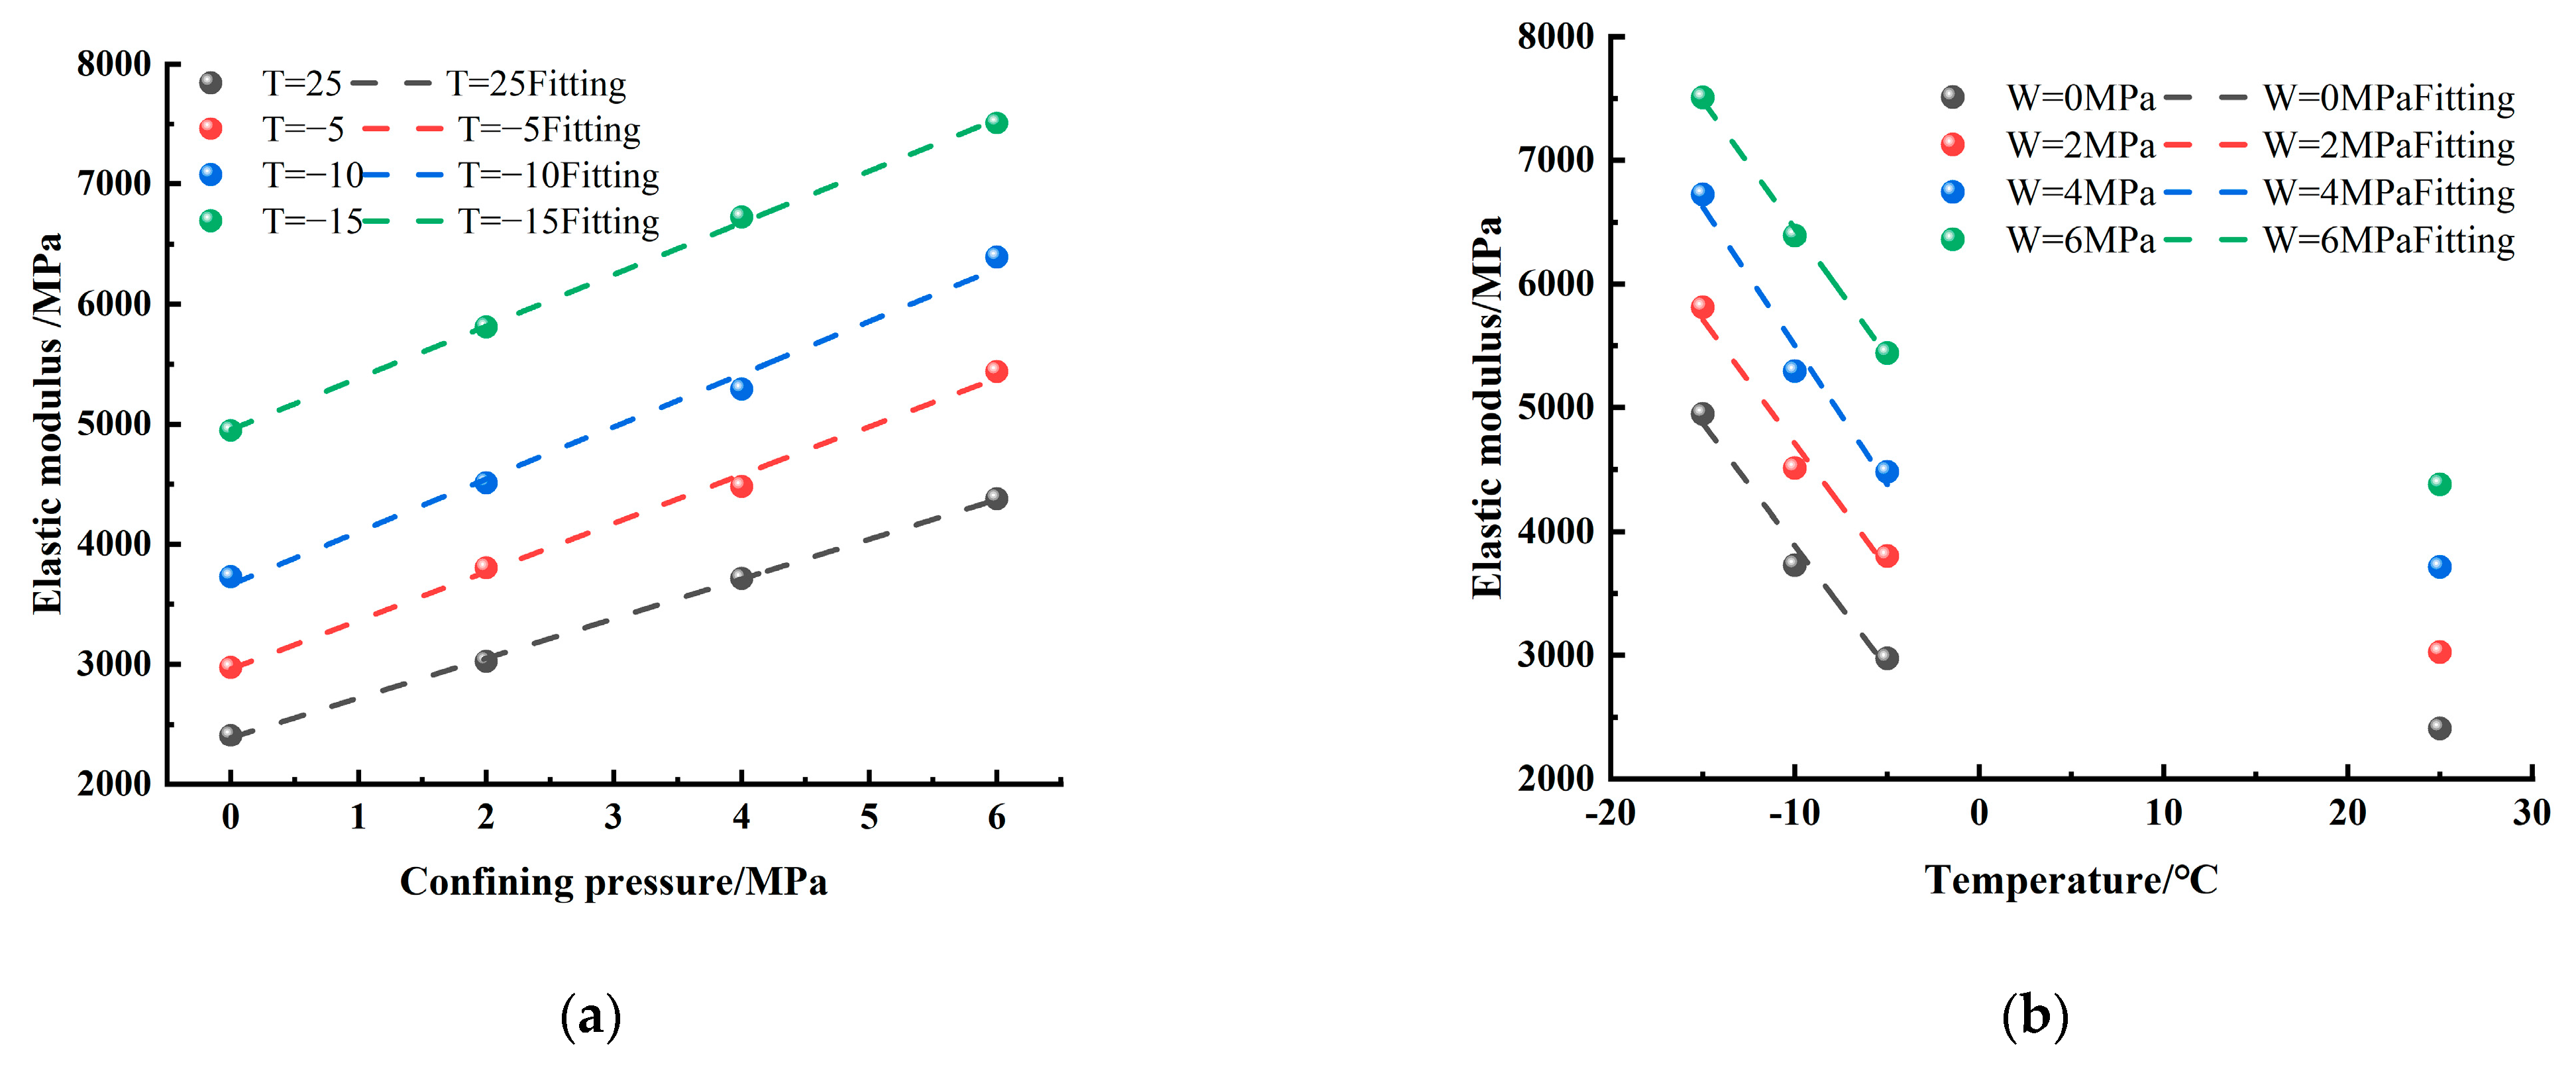
3.3.2. Relationship between the Freezing Temperature/Confining Pressure and the Elastic Modulus of Sandstone

Elastic modulus reflects the ability of rock to withstand elastic deformation. The elastic modulus is essentially the bonding strength between micro atoms or molecules. Any change in the temperature and confining pressure obviously affects the elastic modulus. The variations in the elastic modulus of sandstone as a function of the temperature and confining pressure are depicted in Figure 7. The elastic modulus of rock was linearly proportional to the confining pressure. As the confining pressure of rock increased from 0 to 6 MPa, the elastic modulus measured at 25, −5, −10, and −15 °C increased by 123.04%, 108.19%, 64.89%, and 45.88, respectively. This was because as the confining pressure increased, the lateral constraint increased, and the lateral strain of rock decreased, which undoubtedly had a restraining effect on the destruction of rock and improved its resistance to deformation.
It can be seen in Figure 7a that with the decrease in the temperature, the variation trend of the elastic modulus was similar to that of the peak strength, i.e., the elastic modulus of rock increased as the temperature decreased. As the test temperature of rock decreased from room temperature to negative temperature, the elastic modulus corresponding to the confining pressures of 0, 2, 4, and 6 MPa increased by 23.51%, 25.64%, 10.88%, and 15.28%, respectively. When the test temperature dropped from −5 to −15 °C, the elastic modulus of rock under different confining pressures increased to a higher extent, and the corresponding growth rates from low to high confining pressures were 73.09%, 52.75%, 72.21%, and 39.82%, respectively. The above results are mainly attributed to the fact that a part of pore water in the rock under negative temperature froze into ice, which had a certain strength, and its cementation improved the ability of rock mass to resist deformation. Therefore, the elastic modulus of rock was not only determined by the rock skeleton but also by the ice in the pores.

3.3.3. Relationship between the Freezing Temperature/Confining Pressure and Poisson’s Ratio of Sandstone

The variations in the Poisson’s ratio of sandstone as a function of the confining pressure and temperature are depicted in Figure 8. It is clear that the Poisson’s ratio of rock quadratically decreased with the rise in the confining pressure. This was because the lateral deformation was restrained with the rise in the confining pressure. According to the formula of Poisson’s ratio, the lateral strain decreases, and it is more influenced by the confining pressure than the axial strain. Therefore, the Poisson’s ratio decreases in a quadratic manner with the in the confining pressure [25,26]. As displayed in Figure 8b, the Poisson’s ratio of rock decreased as the temperature was reduced at the same confining pressure, which was quite different from the relation between temperature and the rock’s elastic modulus.

4. Constitutive Relationship

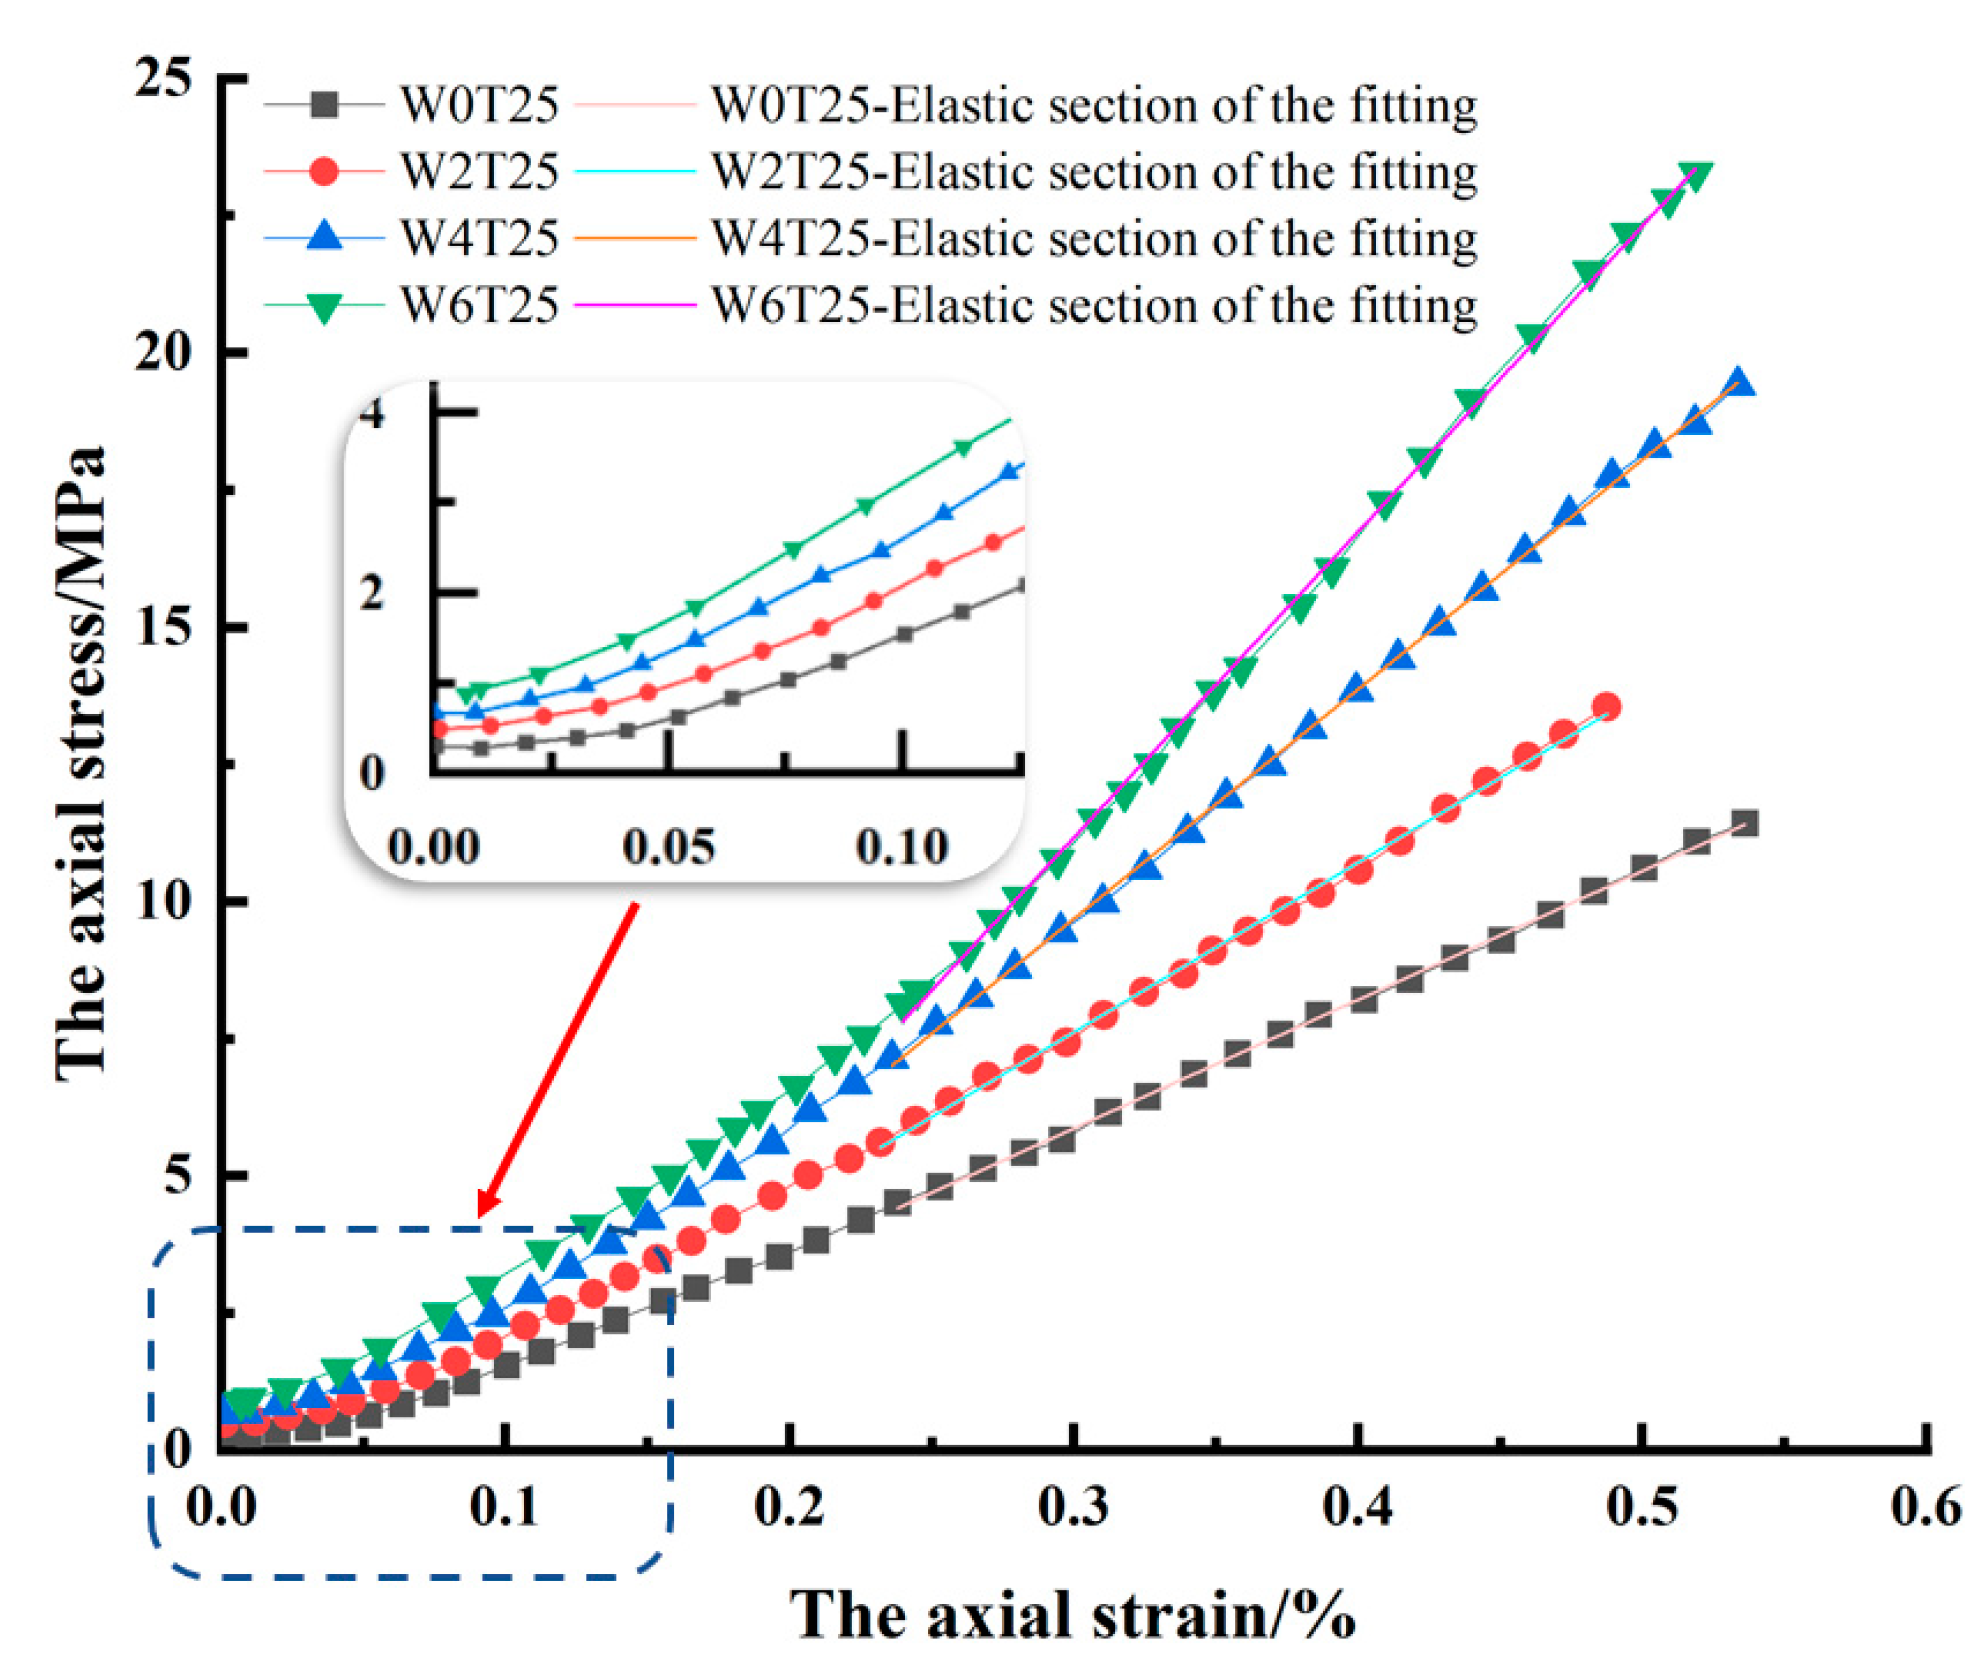
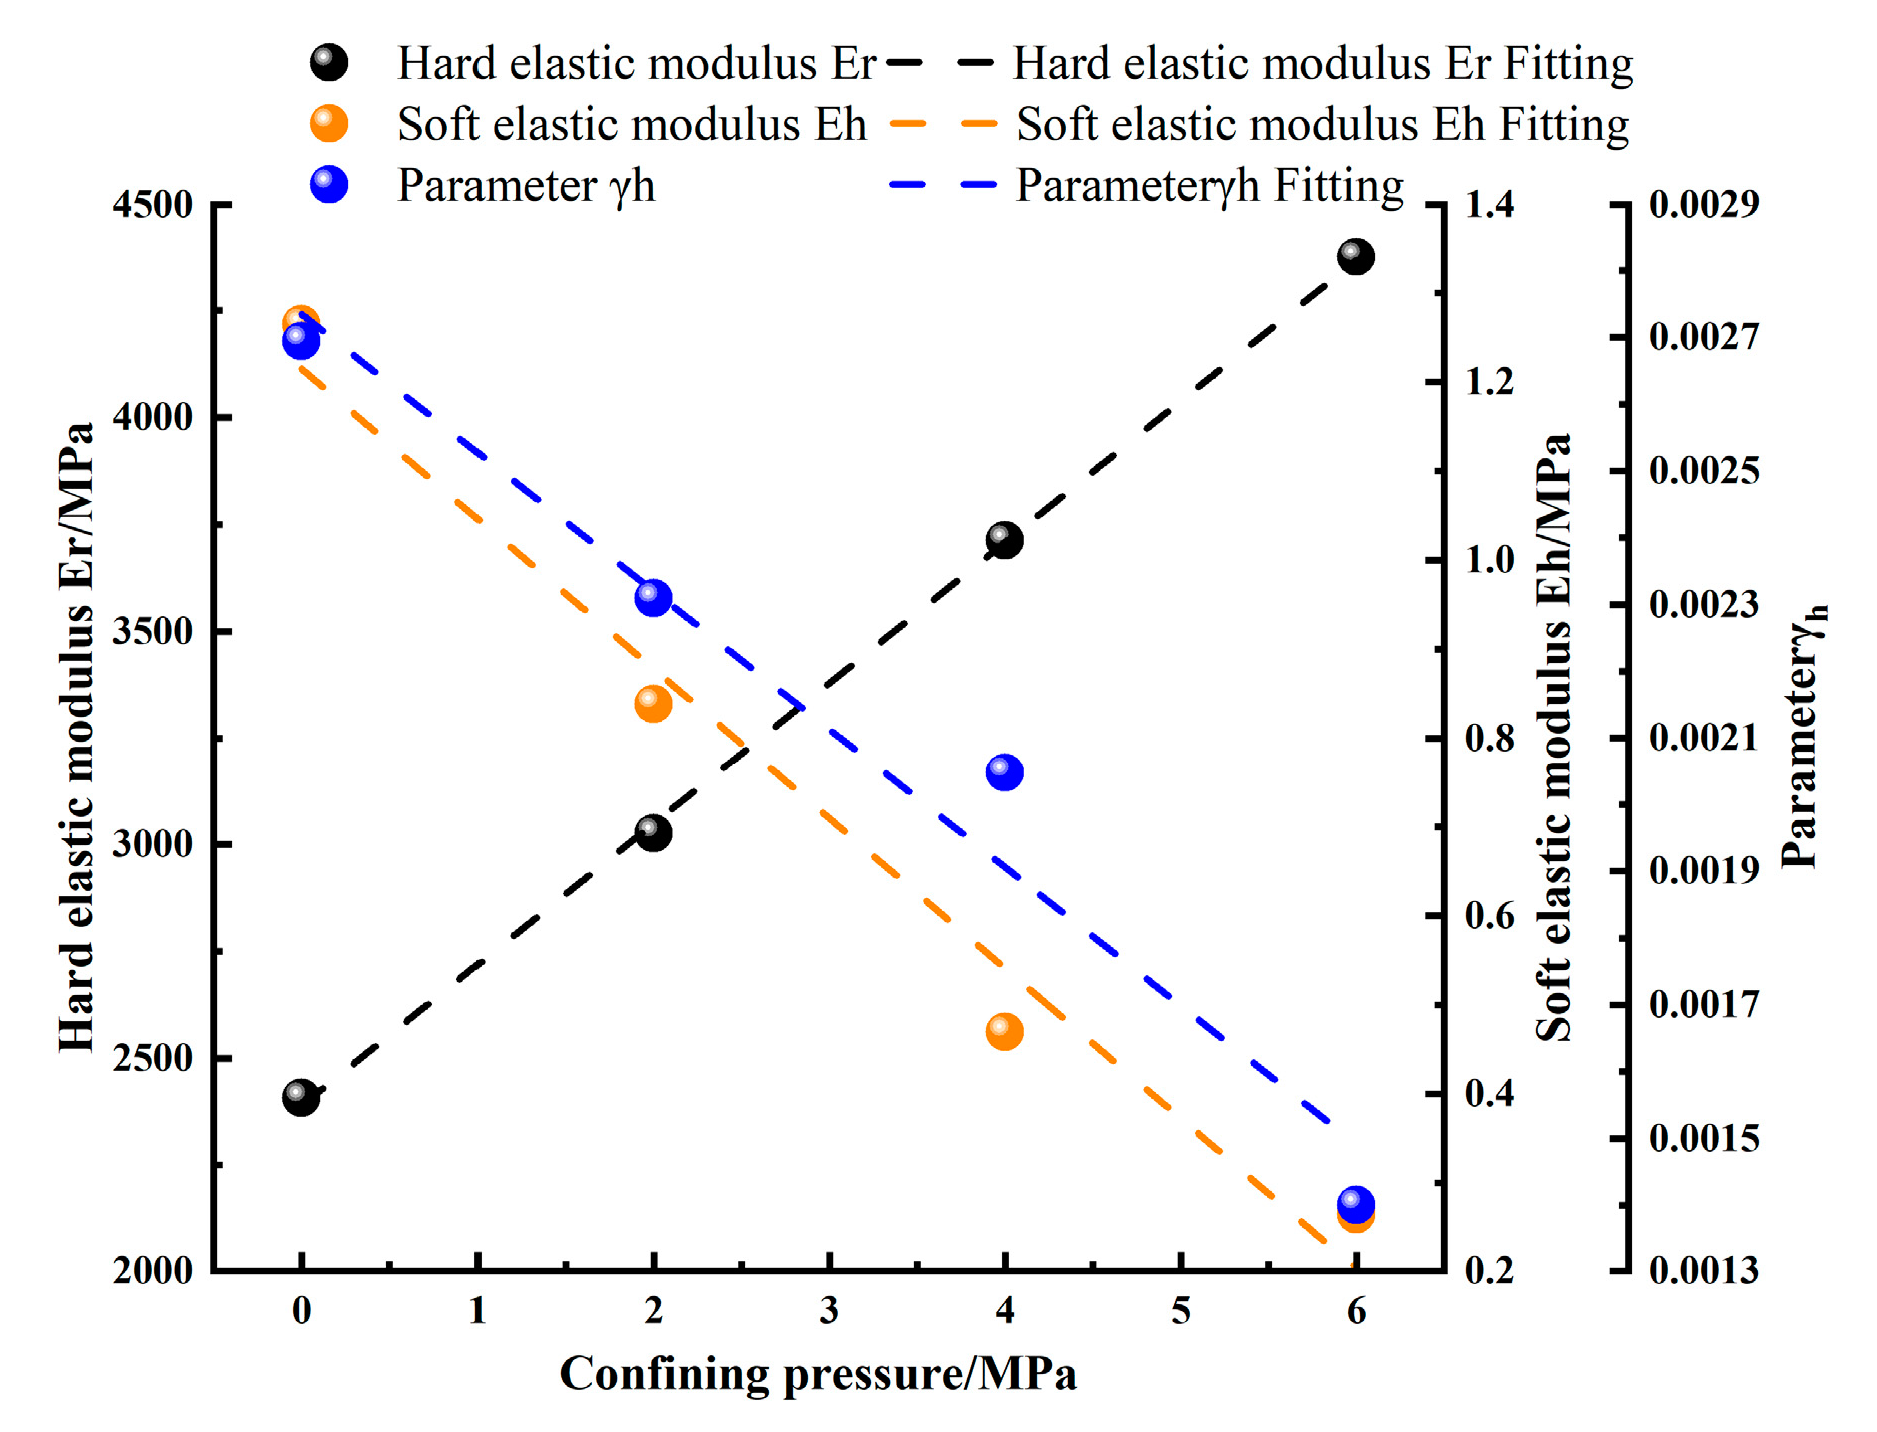
4.1. Constitutive Relationship before Yield Point

According to the above tests, the room-temperature triaxial compression test was selected, and the stress–strain curve before the yield point was obtained, as depicted in Figure 9. It can be seen that the pores and cracks in the red sandstone were compacted at the onset of compression, and the strain vs. stress curve had a concave parabolic shape. The compaction of pores and cracks led to a large degree of deformation of the rock. Then, the internal defects were compacted, and the rock particles bore the 3D stress. The rock skeleton was able to bear a small deformation, and the stress–strain curve in this phase showed a linear growth.
For accurately describing the constitutive relationship in the two stages, the TPHM [27,28] was used. Hooke’s law based on natural strain was used to describe the crack compaction section, while Hooke’s law based on engineering strain was used to describe the elastic stage.
ε 1 = 3 - γ h 3 E r [ σ 1 μ ( σ 2 + σ 3 ) ] + γ h 3 [ 1 exp ( σ 1 E h ) ] ε 2 = 3 - γ h 3 E r [ σ 2 μ ( σ 1 + σ 3 ) ] + γ h 3 [ 1 exp ( σ 2 E h ) ] ε 3 = 3 - γ h 3 E r [ σ 3 μ ( σ 1 + σ 2 ) ] + γ h 3 [ 1 exp ( σ 3 E h ) ]
where ε1, ε2, and ε3 are the strains measured in the triaxial test of rock. σ1, σ2, and σ3 are the corresponding nominal principal stresses. Er and Eh represent the modulus of elasticity of the hard and soft components, respectively (soft components refers to the pores and fractures in the rock, and hard components corresponds to the rock particle skeleton, except the soft components), and γh is the proportion of soft components in the rock, and μ represents the Poisson’s ratio of the hard components.
Under the triaxial stress σ2 = σ3, ε2 = ε3 = 0, the principal strain of rock under triaxial confining pressure can be obtained as follows:
ε 1 = 3 - γ h 3 E r [ σ 1 μ ( σ 2 + σ 3 ) ] + γ h 3 [ 1 exp ( σ 1 E h ) ]
Equation (2) is the constitutive equation of sandstone before the yield point. The axial strain and stress can be measured by the test. The crucial step is the determination of three parameters: γh, Er, and Eh. To determine each parameter, the ratio γ r of the hard components to the whole rock mass and the ratio γ h of the soft components to the whole rock mass are introduced. The sum of the two is 1, and the proportional relationship between γ r and γ h can be expressed as
γ h = γ h 3
On the basis of the stress–strain curve acquired from this test, the value of 3 E r 3 γ h in Equation (2) can be determined from the slope of the straight line in the elastic stage of the rock. The intersection point of the extension of the straight line in the elastic section and the strain axis is γ h . After determining the parameters γh and Er, the value of Eh can be obtained according to the low stress stage, i.e., the stress and strain data points of the compaction section are substituted in Equation (2). The stress–strain curve and the parametric solution of the TPHM model are depicted in Figure 10.
It can be seen in Figure 8 that the slope of the elastic stage of sandstone obviously increased with the increase in the confining pressure. Further, the value of γ h decreased. Therefore, it can be concluded that the parameters of TPHM model were related to the stress state of sandstone. The constitutive equation established by using the above single test curve is not universal. Therefore, to reduce the error of the constitutive equation, the triaxial stress–strain curve under different temperatures was obtained on the basis of the parametric solution of the TPHM model. The variations in the γh, Er, and Eh as a function of the confining pressure are presented in Figure 11.
Further, the corresponding fitting equations are obtained by linear fitting:
E r = 329.78 σ 3 + 2389.26
E h = 0.16849 σ 3 + 1 . 21486
γ h = 0.000207 σ 3 + 0.00273
By substituting the fitting equations into Equation (2), a double-strain Hooke constitutive model of red sandstone with only three basic mechanical parameters can be obtained as follows:
ε 1 = 0.000207 σ 3 + 2.99727 989.34 σ 3 + 7167 . 78 ( σ 1 2 μ σ 3 ) + - 0.000207 σ 3 + 0.00273 3 [ 1 exp ( σ 1 - 0.16849 σ 3 + 1.21486 ) ]
The stress–strain curves under the confining pressures of 0, 2, 4, and 6 MPa were obtained by using the above constitutive equations, as shown in Figure 12. Compared with the other models, the optimized TPHM was simpler and allowed for higher-level simulation. It was able to reflect the crack compaction and elastic deformation phases before the yield point more effectively. However, it is a macro-scale approximation, and it is based on Hooke’s laws of natural and engineering strains. Moreover, it cannot reflect the stress–strain relationship beyond the yield point.

4.2. Constitutive Relationship after the Yield Point

On the basis of the Lemaitre strain equivalence hypothesis [29,30,31,32,33,34], the rock damage constitutive equation can be established as follows:
[ σ ] = [ E ] [ 1 D ] [ ε ] = [ 1 D ] [ σ * ]
where [σ] and [σ*] are the stress matrix and the effective stress matrix, respectively. [E] is the elastic matrix, [ε] is the axial strain matrix, (1 − D) is the relative area of the rock that can effectively bear the internal force during compression, and D is the rock damage parameter.
Assuming that the number of damaged micro-elements during rock compression is Nh, the damage parameter D is defined as the ratio of Nh to the total number of micro-elements N [35,36,37], i.e.,
D = N h N
According to Figure 1, the red sandstone contains many internal pores and fissures, and there are weak layers with different micro-element strengths in the rock. Considering the continuous damage of rock during triaxial compression, it is assumed that the micro-element strength and micro-element force are isotropic and obey Hooke’s Law. Before rock failure, the distribution variable F of the micro-element intensity follows Weibull distribution, and the probability density function is defined as follows:
P ( F ) = m F 0 ( F F 0 ) m 1 exp [ ( F F 0 ) m ]
where m and F0 represent the Weibull distribution parameters.
Hence, the number of destroyed micro-elements in the interval [F, F + dF] can be expressed as NP(y)dy. When the rock is loaded to some degree F, the number of damaged micro-elements can be obtained as follows:
N h ( F ) = 0 F N P ( y ) d y = N { 1 exp [ ( F F 0 ) ] }
Substituting the above equation into Equation (9), the rock damage evolution equation can be derived as
D = N h N = 1 exp [ ( F F 0 ) m ]
According to Equation (12), the micro-element strength F must be calculated to determine the damage parameter D. The traditional method is to use uniaxial strain as the distribution variable, which cannot describe the influence of rock stress state on the micro-element strength. Therefore, the distribution variable of the micro-element intensity is used to establish the failure criterion of rock. On the basis of the simple parametric form of Drucker–Prager (D-P) criterion, the infinitesimal strength can be obtained.
F = f ( σ ) = α I 1 + J 2
where α is the cohesion, and φ is the internal friction angle of rock. Further, the first and second invariants of the stress tensor are represented by I1 and J2, respectively.
α = 3 sin φ 3 3 + sin 2 φ I 1 = σ * x + σ * y + σ * z = σ * 1 + σ * 2 + σ * 3 J 2 = 1 6 [ ( σ * 1 σ * 2 ) 2 + ( σ * 2 σ * 3 ) 2 + ( σ * 3 σ * 1 ) 2 ]
where σ1*, σ2*, and σ3* are the effective stress values of rock under compression, and the corresponding nominal stress values are σ1, σ2, and σ3. The nominal stress of rock can be measured by triaxial test, and σ1* = σ2*, σ1 = σ2. According to the Hooke’s Law and the concept of stress tensor,
I 1 = E ε 1 ( σ 1 + 2 σ 3 ) σ 1 2 μ σ 3 J 2 = E ε 1 ( σ 1 σ 3 ) 3 ( σ 1 2 σ 3 )
Combining Equations (8), (12), and (13) and Hooke’s law, and using the D-P strength criterion, the damage constitutive equation of rock is derived as follows:
σ 1 = E ε 1 ( 1 D ) + 2 μ σ 3 = E ε 1 exp [ ( α I 1 + J 2 F 0 ) m ] + 2 μ σ 3
It can be seen from the established damage constitutive relationship (16) that the Weibull distribution parameters F0 and m need to be determined in advance, and the peak point of the stress–strain curve under triaxial compression can be used to obtain the parameter m, while the function F0 is related to F [38,39,40,41,42], and the specific expression is
m = 1 ln E ε 1 0 ( σ 1 ) max μ ( σ 2 + σ 3 )
F 0 = F 1 m ln E ε 1 0 ( σ 1 ) max μ ( σ 2 + σ 3 ) 1 m
where (σ1)max is the peak stress of the stress–strain curve, ε10 is the strain value corresponding to the peak stress, and F10 is the micro-element strength at the peak point.
To prove the validity of the constitutive model, the internal friction angle of sand is considered to be 28.56° according to the triaxial freezing test. Using Equations (17) and (18), the values of model parameters m and F0 can be determined. The constitutive model equation of soft rock damage is derived by substituting m and F0 into Equation (16). The constitutive model curve is compared with the test curve in Figure 13.
The following inferences can be drawn by comparing the test results with the modeling results.
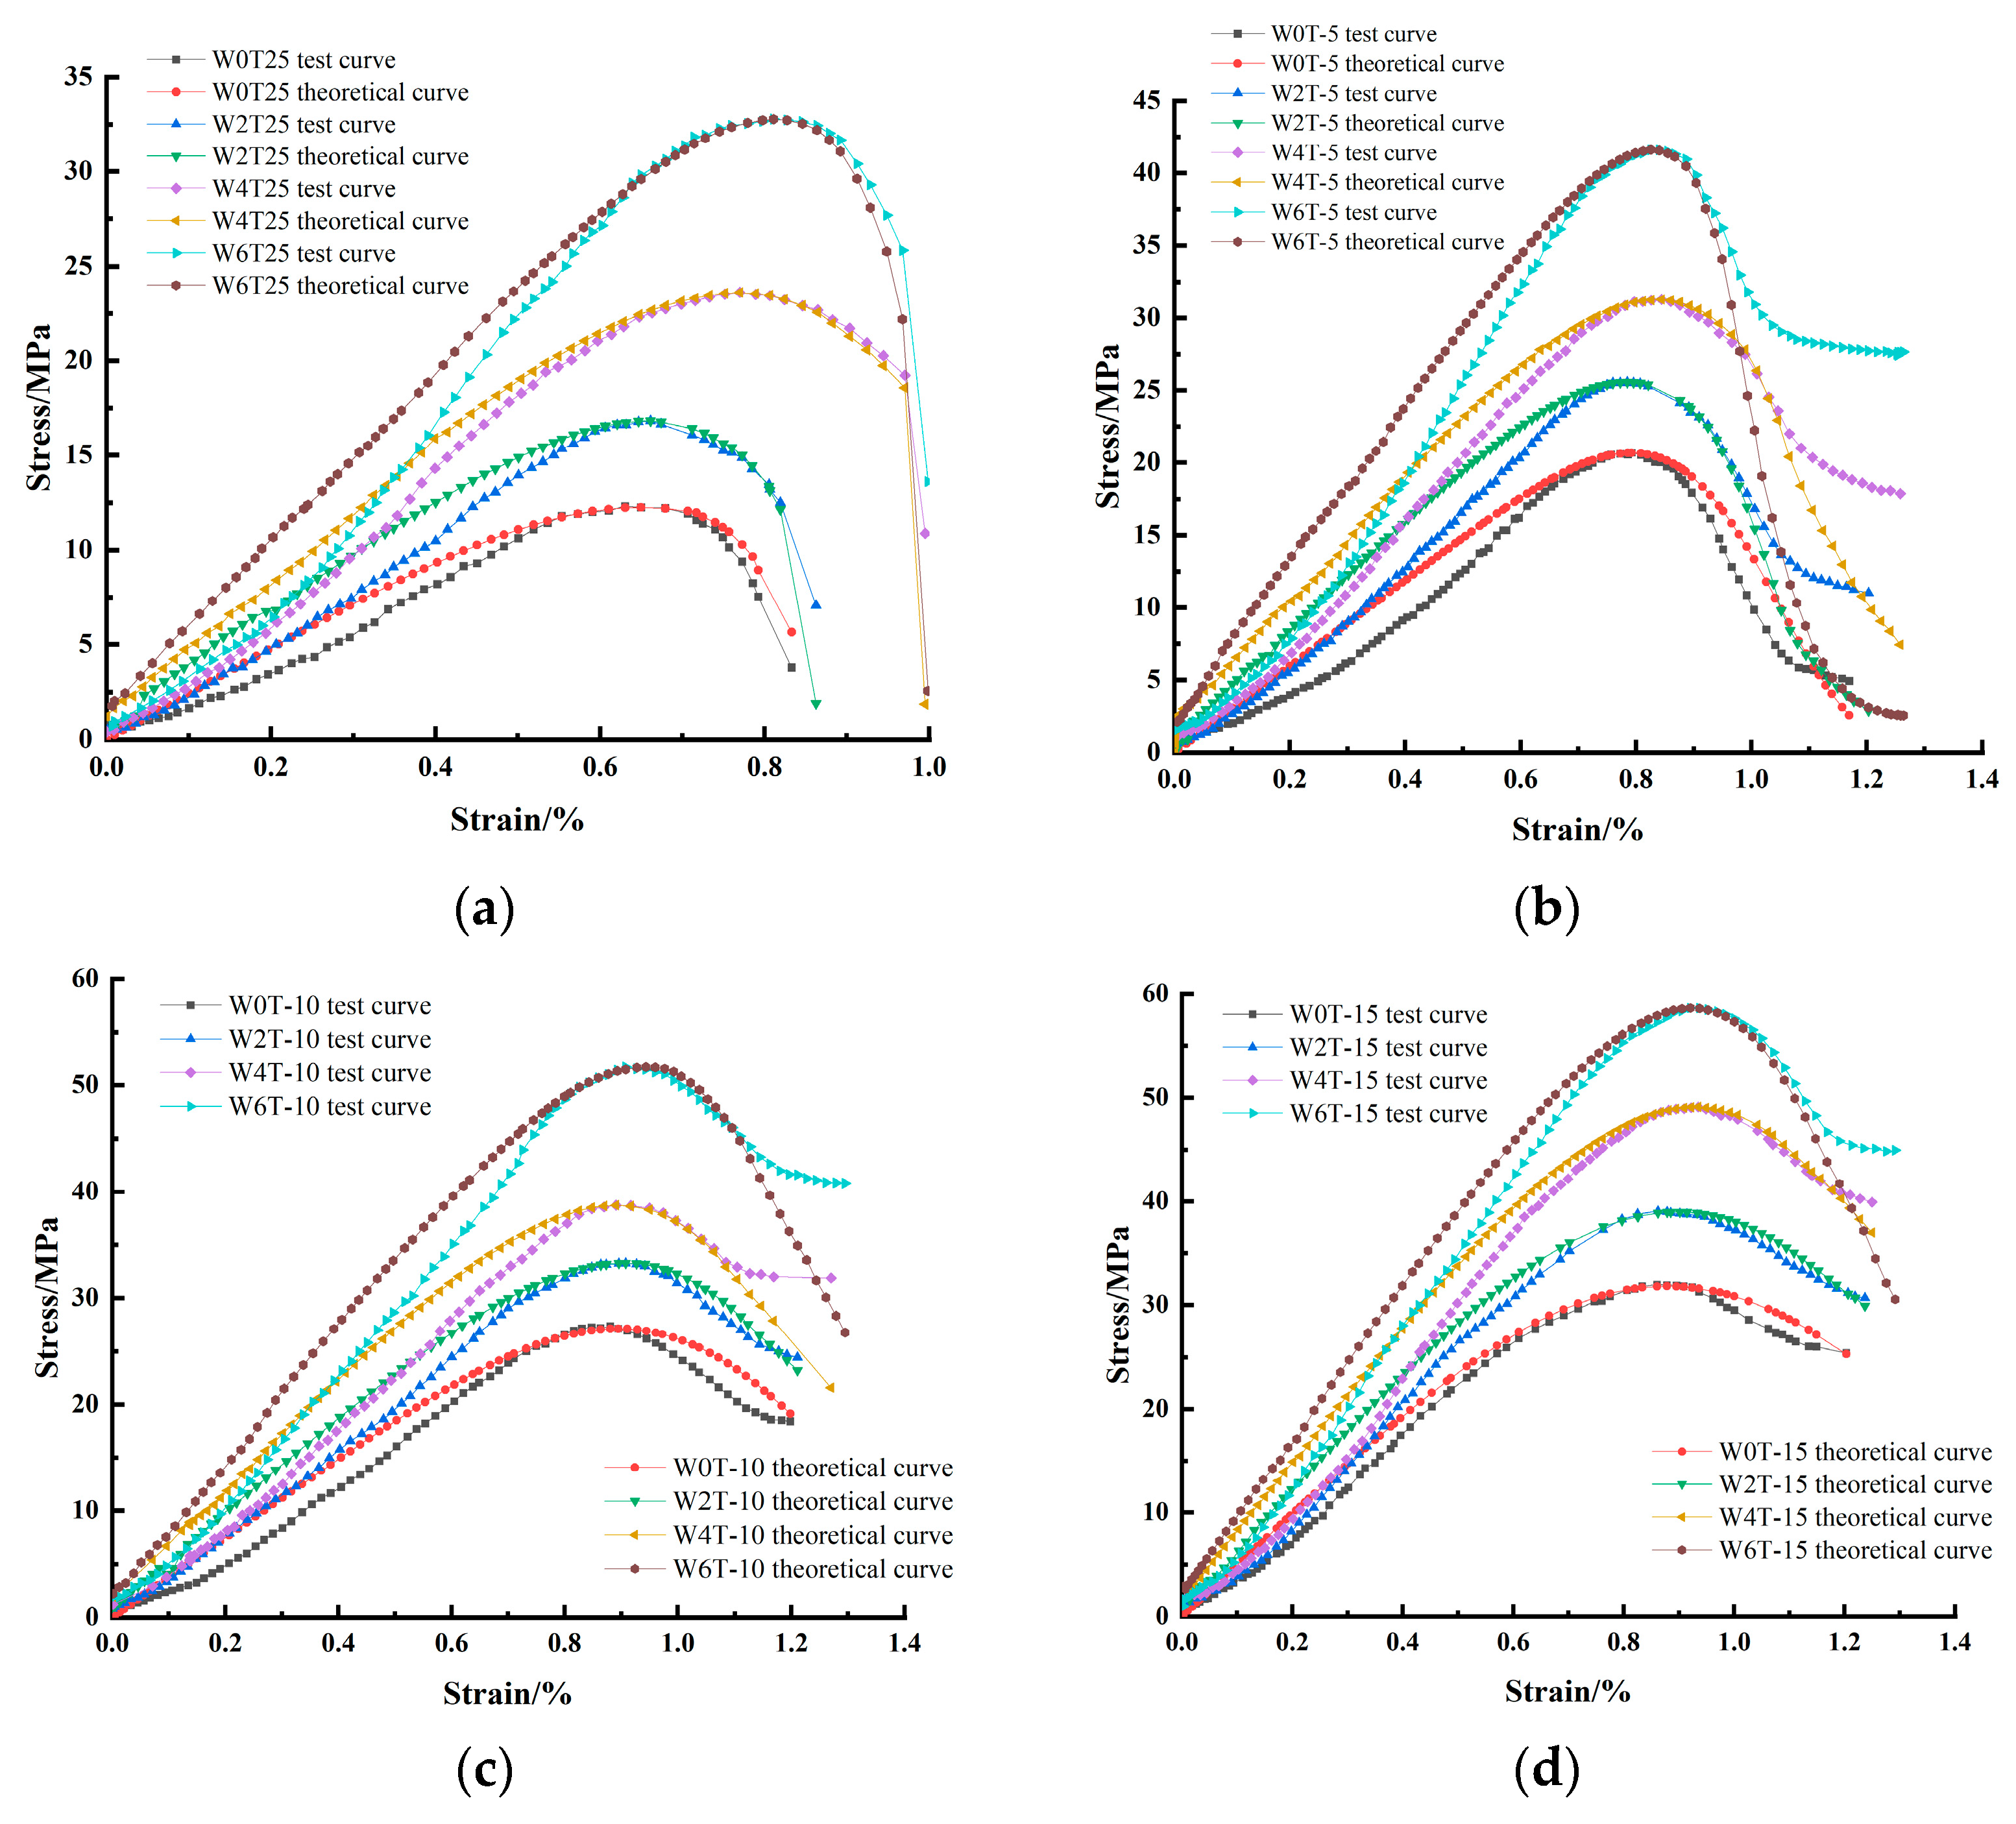
  • On the basis of the D-P strength criterion, the damage-softening constitutive model of rock is more suitable for describing the stress–strain curve of rock, especially beyond the yield point, with a high fitting degree.
  • The stress before the yield point described by the constitutive relation is generally high, and it cannot be used to accurately describe the crack compaction and elastic deformation stages of Cretaceous red sandstone under 3D stress.
  • Compared with the test curve under high confining pressure, the model curve is more consistent with the test stress–strain curve obtained under low confining pressure, and under the negative temperature state, the fitting degree of the model curve rises with the decrease in the temperature, which may be ascribed to the increase in the elastic modulus of rock as the temperature decreases.

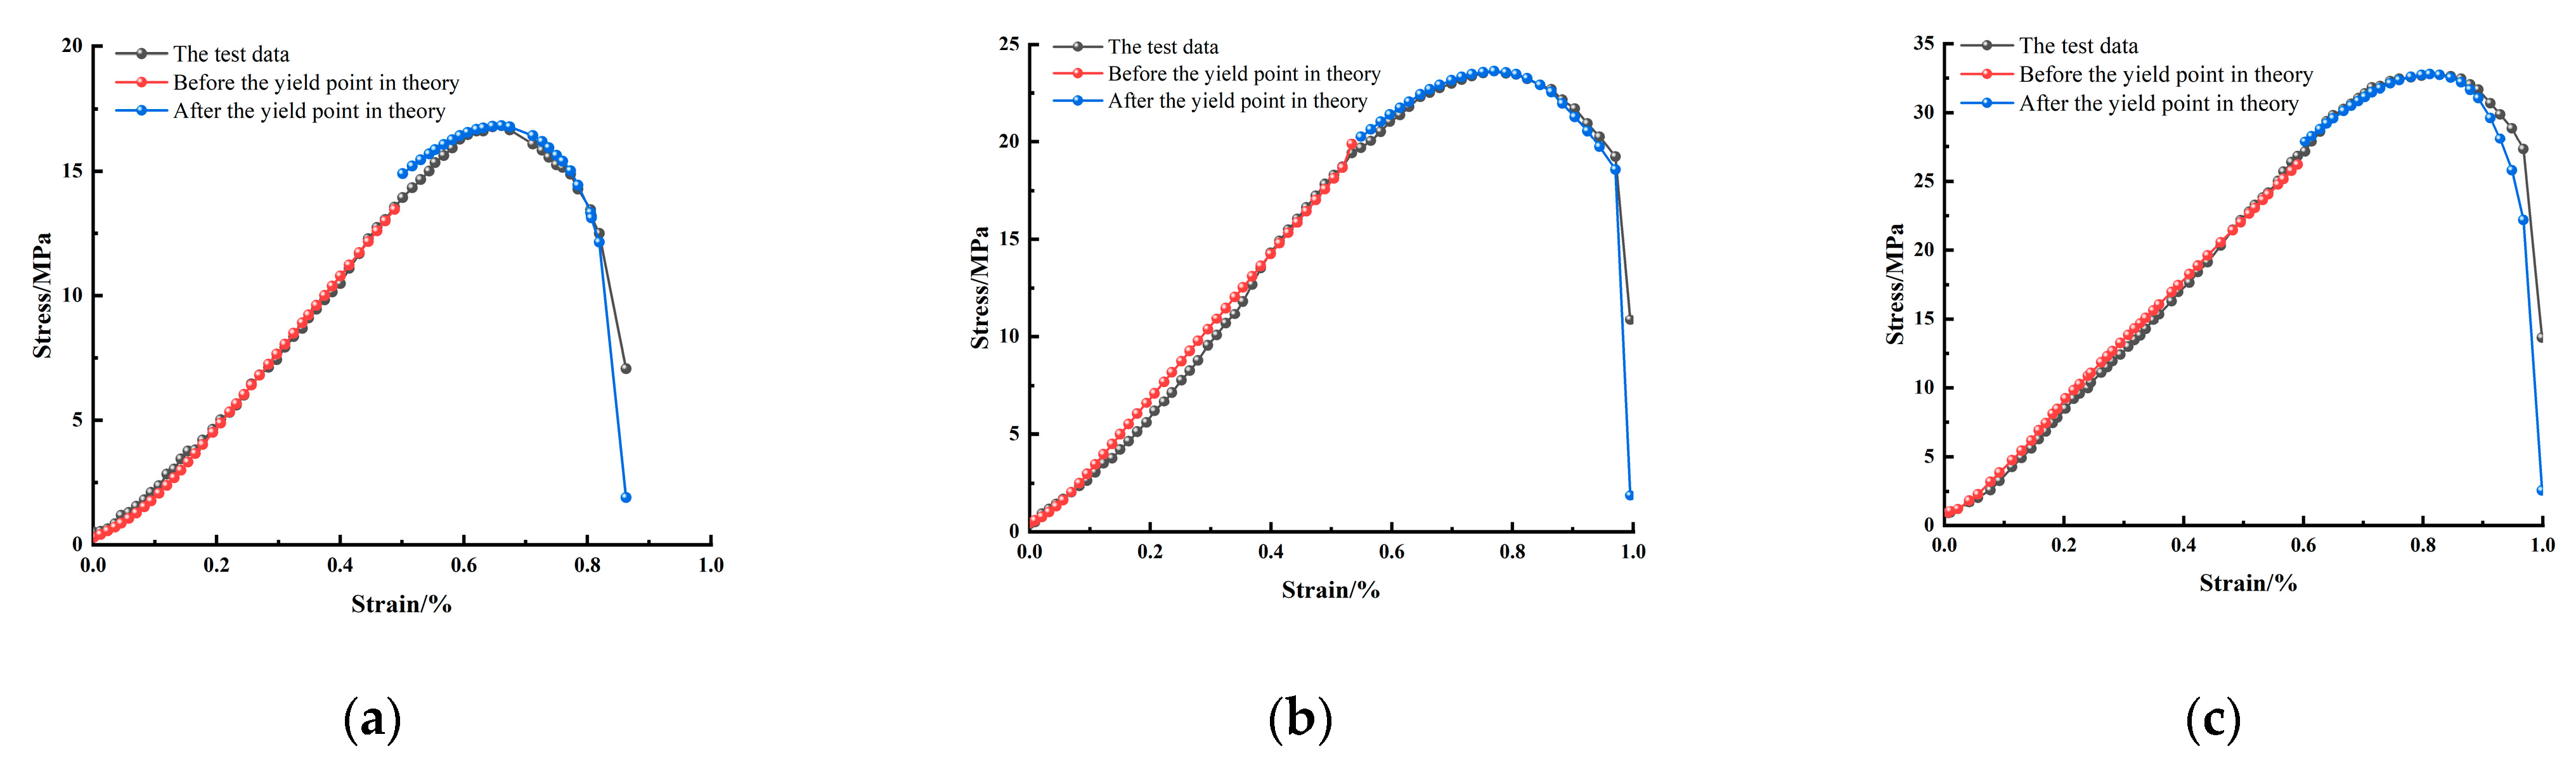
4.3. Model Validation

Cretaceous rock is different from ordinary rocks. It contains a large number of pore structures. The stress–strain curve under triaxial stress had an obvious crack compression section, and a strain softening section was observed under negative temperature. The double strain Hooke constitutive model can effectively describe the stress and strain state before the yield point, but it cannot reveal these characteristics after the yield point. However, the stress–strain curve obtained by the damage constitutive model on the basis of the D-P criterion was in good agreement with the test stress-strain curve after the rock yield point. Therefore, the constitutive relationship of red sandstone can be more accurately described by establishing the constitutive model in sections. However, there is no unified standard for determining the rock yield point. The peak point of the stress–strain curve, namely, the peak stress, is generally regarded as the yield stress of rock in classical rock theory, which can not only lead to the underestimation of rock plastic deformation, but also affect the calculation of hardening parameters [43,44,45,46,47,48,49].
In fact, the rock is damaged only when it reaches a certain stress state under the 3D compression process. According to previous studies, the yield stress value of sandstone under various conditions is 73–78% of the peak stress value before the peak point. For simplifying the calculations, 78% of the peak stress value before the peak point was selected as the yield point in this study. On the basis of the experimental results under different confining pressures at room temperature, the established constitutive relationship before and after the yield point was compared with the test results, as shown in Figure 14.
It is clear from Figure 14 that the established model can competently fit the stress–strain curve under different confining pressures. However, the model did not predict the sudden drop of stress at the point of rock failure, and there was no good contact between the joints in the segmented model, especially the fitting curve when the confining pressure was 2 MPa. The difference between the theoretical values of the two models at the joint was 1.4 MPa, which was strongly related to the failure of the established damage constitutive model to better fit the elastic stage. To quantify the fitting degree of the model, the model deviation was analyzed, and the specific expressions are as follows:
δ = i = 1 n σ i * σ i n
δ ¯ = i = 1 n σ i * σ i i = 1 n σ i × 100
where δ and δ ¯ are the absolute deviation and relative deviation between the modeling and experimental results, respectively, and σ i and σ i * are the corresponding test stress and theoretical stress values, respectively (i = 1, 2, 3…). n represents the number of data points. The model parameters obtained from the above equation are listed in Table 4.
According to the above results, the absolute deviation of the established rock constitutive model did not exceed 1 MPa, and the relative deviation was less than 5%, which indicates that the model was able to accurately describe the stress–strain behavior of Cretaceous red sandstone under triaxial stress.

5. Conclusions

In this study, the mechanical properties and constitutive relationship of Cretaceous water-rich sandstone at different freezing temperatures and confining pressures were examined under the effect of surrounding rocks. The main results of the study are summarized as follows:
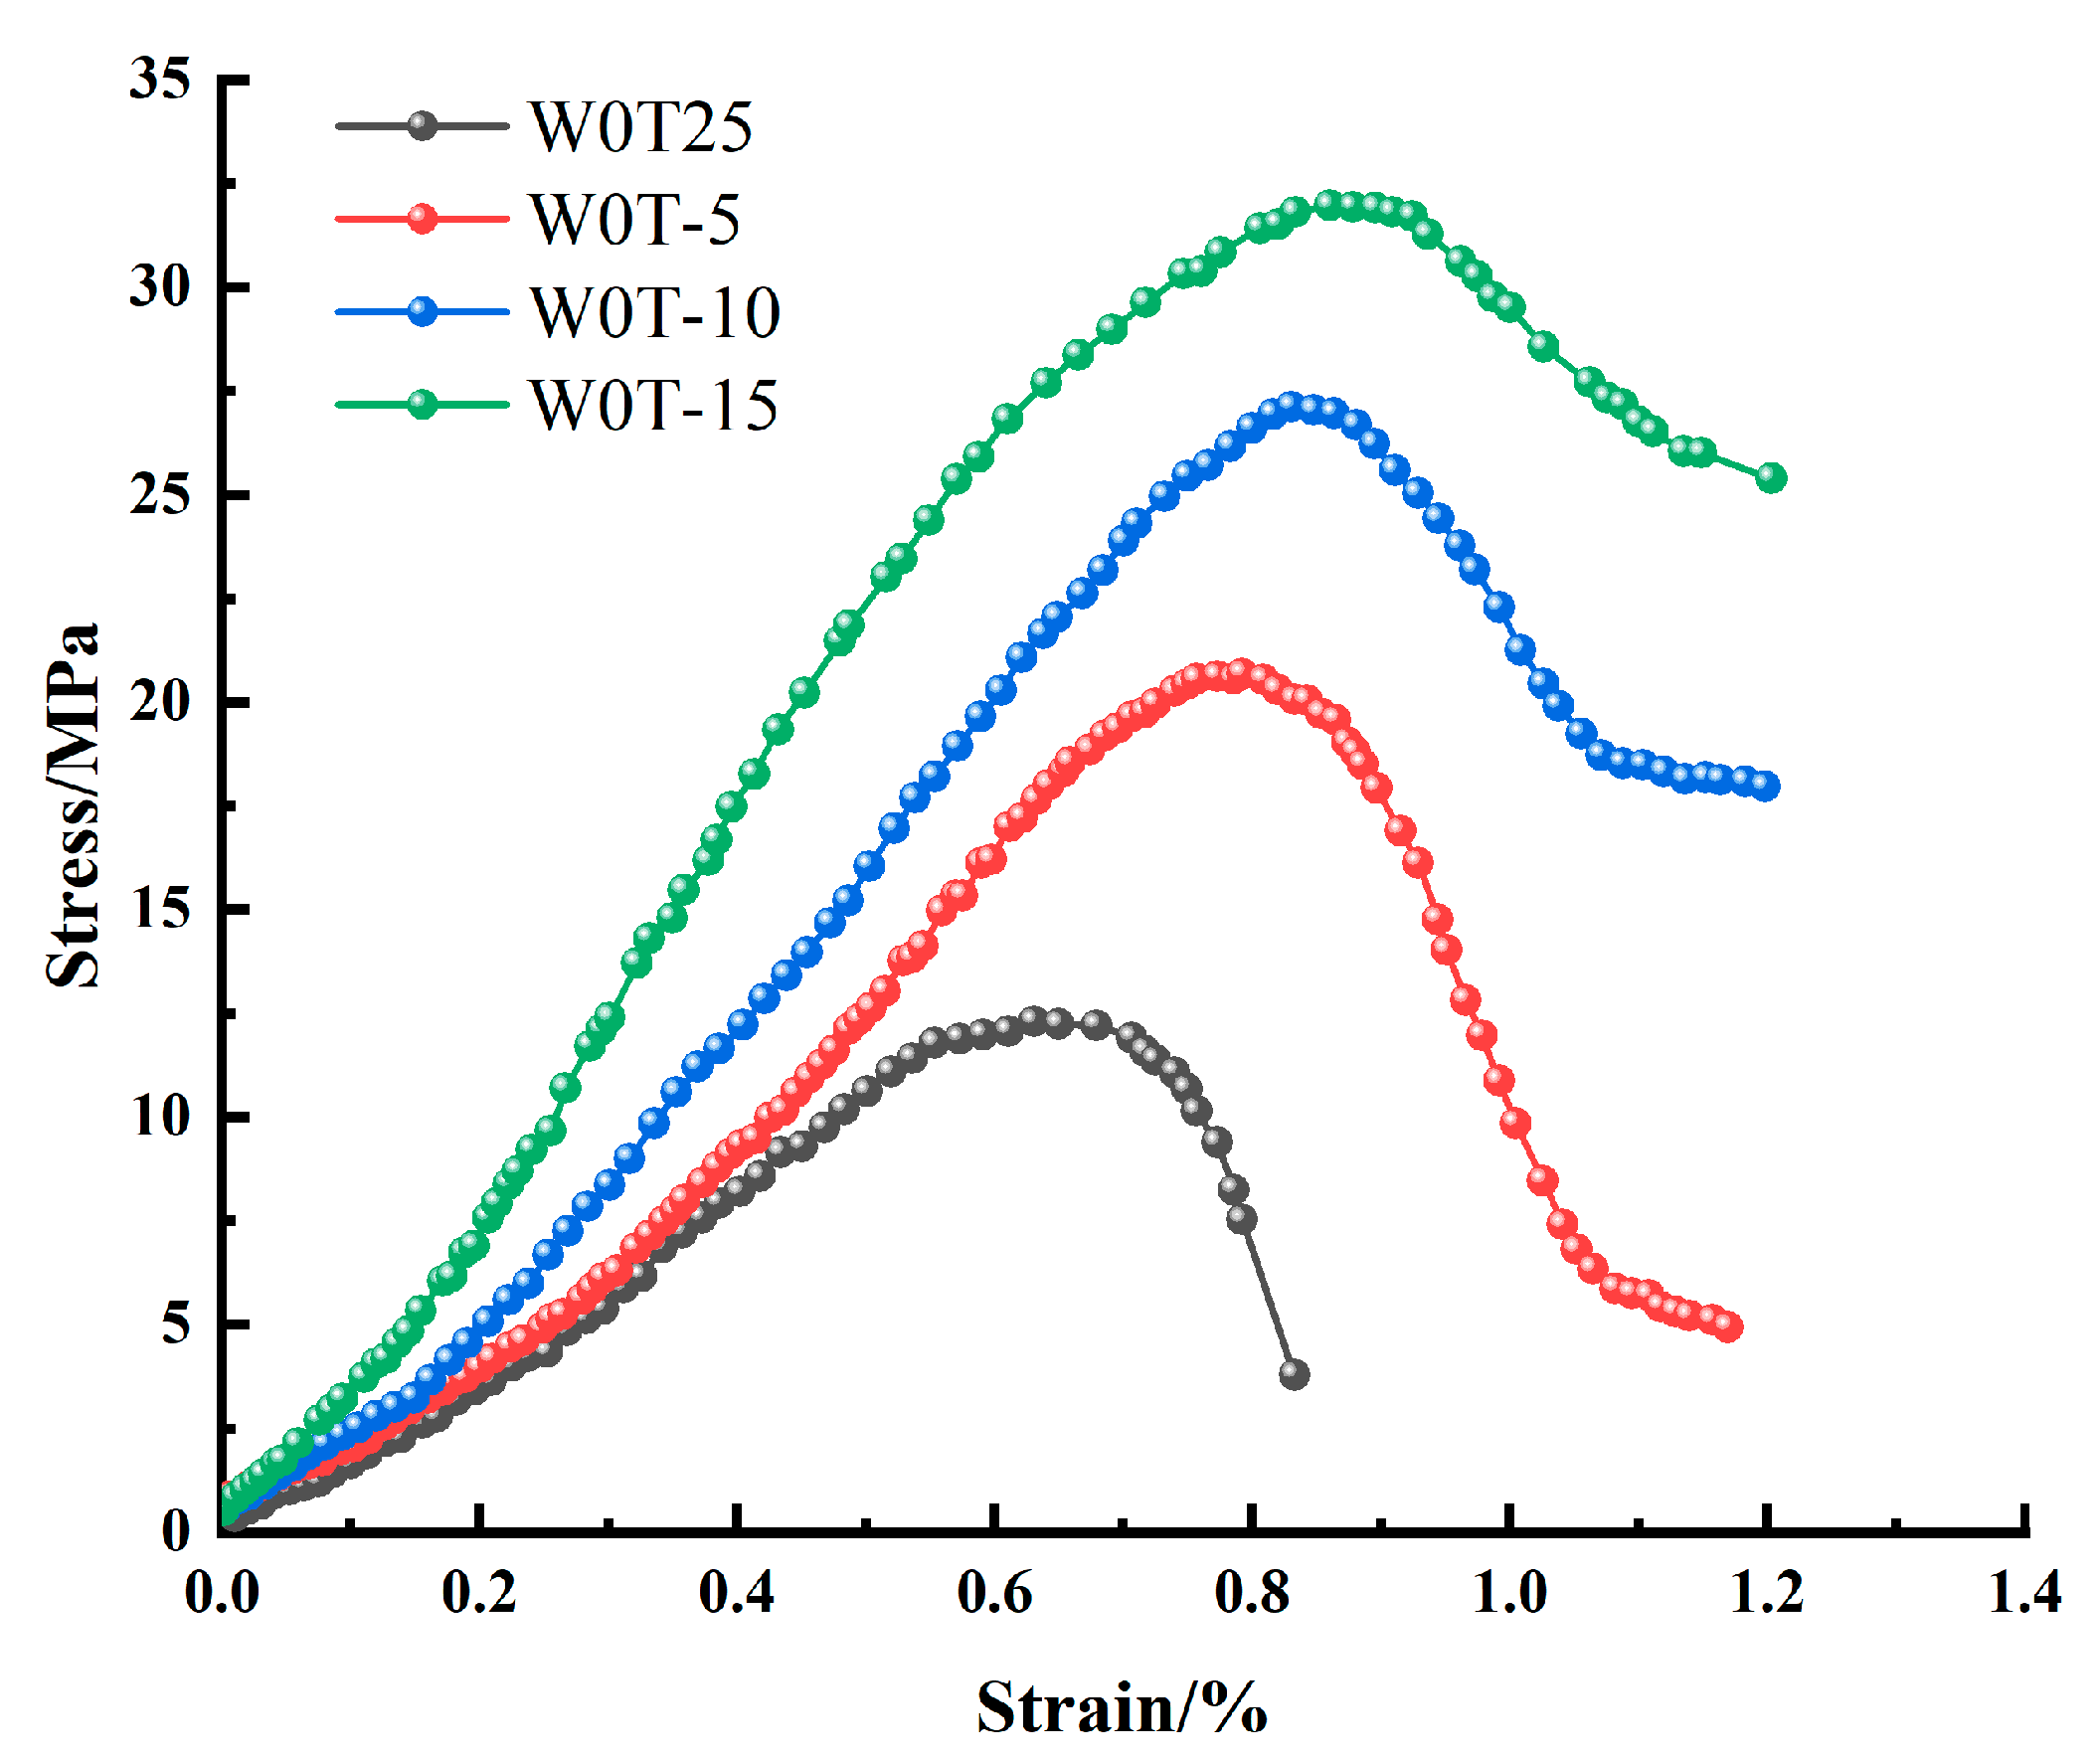
  • Triaxial compression tests were conducted on the frozen samples of weakly cemented red sandstone in the Luohe Formation of Lower Cretaceous in Lijiagou air-return shaft of Wenjiapo Mine under different confining pressures. The stress–strain curves of rock subjected to triaxial compression exhibited four phases: crack compaction, elastic deformation, yielding phase, and failure phase. Different from the deformation characteristics under confining pressure, there was no strain-softening stage behind the peak of rock under uniaxial compression, which manifested as a sudden stress drop and rock failure.
  • The peak strength and the elastic modulus of rock increased with the decrease in the temperature when the confining pressure was constant and showed a linear growth trend under negative temperature conditions, but the rate of growth gradually decreased. When the test temperature was constant, as the confining pressure increased, the peak strength and the elastic modulus increased, while the Poisson’s ratio decreased.
  • The TPHM was able to effectively describe the constitutive relationship of rock before the yield point. On the basis of the Lemaitre strain equivalence hypothesis, the micro-elements in the sandstone were assumed to obey Weibull distribution. According to the D-P criterion, the damage constitutive relationship of rock was established to describe the stress–strain relationship after the yield point.
  • The results based on the constitutive relationship were compared with the test results. The absolute error between the two was not more than 1 MPa, and the relative error was less than 5%. This indicated that the established constitutive model was not only better able to describe the rock fracture compression and elastic stages before the yield point, but also revealed the post-peak strain softening section, verifying the applicability and rationality of the model.

Author Contributions

Conceptualization, Z.Y. and S.S.; methodology, S.S. and Z.Y.; software, S.S., Y.X., C.W. and K.H.; validation, S.S., Y.X., and K.H.; formal analysis, Y.X.; investigation, Y.X., C.W. and S.S.; resources, Z.Y.; data curation, S.S.; writing—original draft preparation, S.S.; writing—review and editing, Y.X., C.W. and Z.Y.; visualization, K.H. and C.W.; supervision, Z.Y. and C.W.; project administration, Z.Y. and C.W.; funding acquisition, Z.Y. All authors have read and agreed to the published version of the manuscript.

Funding

This research was funded by the Anhui Provincial Fund: Temperature Crack Control in Winter Prefabrication Construction of Drilling Shaft Lining in Alpine Region (YJS20210410).

Institutional Review Board Statement

Not applicable.

Informed Consent Statement

Not applicable.

Data Availability Statement

Not applicable.

Conflicts of Interest

The authors declare no conflict of interest.

References

  1. Li, Y.L.; Lu, B.; Yang, R.S.; Lin, H.; Wang, S.S.; Liu, C.H. Cemented backfilling mining technology with continuous mining and continuous backfilling method for underground coal mine and typical engineering cases. J. China Coal Soc. 2022, 47, 1055–1071. (In Chinese) [Google Scholar]
  2. Chen, Y.L.; Cui, H.D.; Li, M.; Pu, H.; Liu, F.M.; Zhang, L.Y. Dynamic mechanical properties and failure mechanism of saturated coal-measure sandstone in open pit mine with damage under real-time low-temperature conditions. J. China Coal Soc. 2022, 47, 1168–1179. (In Chinese) [Google Scholar]
  3. Yao, Z.S.; Cheng, H.; Rong, C.X. Shaft structural design and optimization of deep freezing bedrock shaft in west area. J. China Coal Soc. 2010, 35, 760–764. (In Chinese) [Google Scholar]
  4. Yuan, L. Theory and technology considerations on high-quality development of coal main energy security in China. Bull. Chin. Acad. Sci. 2023, 38, 11–22. (In Chinese) [Google Scholar]
  5. Dong, S.N.; Liu, H.X.; Wang, H. Reserch status and prospect on the mechanism of dynamic sand inrush at weakly cemented strata in working face with thick bedrock. J. China Coal Soc. 2022, 47, 274–285. (In Chinese) [Google Scholar]
  6. Li, H.; Li, J.; Li, L.; Xu, H.; Wei, J. Prevention of water and sand inrush during mining of extremely thick coal seams under unconsolidated Cenozoic alluvium. Bull. Eng. Geol. Environ. 2020, 79, 3271–3283. [Google Scholar] [CrossRef]
  7. Li, Q.H.; Li, S.X. Experimental study on mechanical properties of ultra-deep sandstone. Chin. J. Rock Mech. Eng. 2021, 40, 948–957. [Google Scholar]
  8. Tan, W.H.; Wang, P.F.; Wang, J.L.; Liu, J.J.; Ma, X.W. Mechanical properties of granite under uniaxial compression based on CT technology. J. Basic Sci. Eng. 2020, 28, 1489–1498. (In Chinese) [Google Scholar]
  9. Meng, Z.P.; Peng, S.P.; Zhang, S.H. Triaxial test on physical and mechanical properties of sandstone for different diagenesis degree. Chin. J. Geotech. Eng. 2003, 25, 140–143. (In Chinese) [Google Scholar]
  10. Meng, Q.B.; Liu, J.F.; Xie, L.X.; Pu, H.; Yang, Y.G.; Huang, B.X.; Qian, W. Experimental mechanical strength and deformation characteristics of deep damaged–fractured rock. Bull. Eng. Geol. Environ. 2021, 81, 32. [Google Scholar] [CrossRef]
  11. Zhou, Z.; Ma, W.; Zhang, S.; Mu, Y.; Li, G. Experimental investigation of the path-dependent strength and deformation behaviours of frozen loess. Eng. Geol. 2020, 265, 105449. [Google Scholar] [CrossRef]
  12. Li, Q.L.; Wang, M.; Fu, Q.; Li, T.; Liu, D.; Hou, R.; Li, H.; Cui, S.; Ji, Y. Short-term influence of biochar on soil temperature, liquid moisture content and soybean growth in a seasonal frozen soil area. J. Environ. Manag. 2020, 266, 110609. [Google Scholar] [CrossRef]
  13. Yoshikawa, T.; Noda, T. Triaxial test on water absorption compression of unsaturated soil and its soil-water-air-coupled elastoplastic finite deformation analysis. Soils Found. 2020, 60, 1151–1170. [Google Scholar] [CrossRef]
  14. Zhang, C.; Yang, C.Q.; Bai, Y. Investigation of damage evolution and its model of rock-like brittle materials. Rock Soil Mech. 2021, 42, 2344–2354. (In Chinese) [Google Scholar]
  15. Li, W.T.; Li, S.C.; Feng, X.D.; Li, S.C.; Yuan, C. Study of post-peak strain softening mechanical properties of rock based on mohr-coulomb criterion. Chin. J. Rock Mech. Eng. 2011, 30, 1460–1466. (In Chinese) [Google Scholar]
  16. Zhang, C.H.; Zhao, Q.S.; Huang, L.; Ye, S.; Yu, Y.J. Post-peak strain softening mechanical model of rock considering confining pressure effect. Rock Soil Mech. 2010, 31, 193–197. (In Chinese) [Google Scholar]
  17. Lu, Y.H.; Chen, M.; Yuan, J.B.; Jin, Y.; Teng, X.Q. Borehole instability mechanism of a deviated well in anisotropic formations. Acta Pet. Sin. 2013, 34, 563–568. (In Chinese) [Google Scholar]
  18. Cao, W.G.; Zhao, M.H.; Tang, X.J. Study on simulation of statistical damage in the full process of rock failure. Chin. J. Geotech. Eng. 2003, 34, 184–187. (In Chinese) [Google Scholar]
  19. Cao, W.G.; Fang, Z.L.; Tang, X.J. A study of statistical constitutive model for soft and damage rocks. Chin. J. Rock Mech. Eng. 1998, 17, 628–633. (In Chinese) [Google Scholar]
  20. Huang, H.F.; Ju, N.P.; Li, L.; Xiao, J.W.; Li, M.; Bai, J.; Lv, X.T. Improved Harris function based statistical damage softening model for rocks. J. Eng. Geol. 2018, 26, 520–527. (In Chinese) [Google Scholar]
  21. Zhang, W.Z.; Chen, C.X.; Yu, M.Y. Study of mechanical properties and constitutive relation of weathered sandstone. Rock Soil Mech. 2009, 30, 33–36. (In Chinese) [Google Scholar]
  22. Muralha, J.; Grasselli, G.; Tatone, B.; Blümel, M.; Chryssanthakis, P.; Jiang, Y.J. ISRM suggested method for laboratory determination of the shear strength of rock joints: Revised version. Rock Mech. Rock Eng. 2014, 47, 291–302. [Google Scholar] [CrossRef]
  23. Wang, J.B.; Zhang, Q.; Song, Z.P.; Zhang, Y.W. Creep properties and damage constitutive model of salt rock under uniaxial compression. Int. J. Damage Mech. 2020, 29, 902–922. [Google Scholar] [CrossRef]
  24. Yan, Z.Q.; Li, Z.; Tan, Y.Z.; Ma, L.J.; Yu, L.Y.; Li, H.Y. Coupling effects of strain rate and low temperature on the dynamic mechanical properties of frozen water-saturated sandstone. Water 2022, 14, 3513. [Google Scholar] [CrossRef]
  25. Yu, J.; Fu, G.F.; Chen, X.; Guo, X.Y. Experimental study on mechanical properties of sandstone after freezing-thawing cycles under triaxial confining pressure unloading. Chin. J. Rock Mech. Eng. 2015, 34, 2001–2009. (In Chinese) [Google Scholar]
  26. Zhang, H.M.; Meng, X.Z.; Liu, X.Y. Establishment of constitutive model and analysis of damage characteristics of frozen-thawed rock under load. Arab. J. Geosci. 2021, 14, 1277. [Google Scholar] [CrossRef]
  27. Li, L.C.; Zhao, Y. Investigation on nonlinear elastic behaviour of rocks based on a two-part hooke’s model. Chin. J. Rock Mech. Eng. 2012, 31, 2119–2126. (In Chinese) [Google Scholar]
  28. Zhao, Y.; Liu, H.H. An elastic stress–strain relationship for porous rock under anisotropic stress conditions. Rock Mech. Rock Eng. 2012, 45, 389–399. [Google Scholar] [CrossRef]
  29. Azam, S.; Hojjatollah, R.; Ali, N. An anisotropic continuum damage mechanics model for the simulation of yield surface evolution and ratcheting. Int. J. Appl. Mech. 2022, 14, 2250044. [Google Scholar]
  30. Peng, Z.X.; Zeng, Y.W. Microcrack propagation-based damage mechanics model of rock. J. Northeast. Univ. (Nat. Sci.) 2022, 43, 1784–1791. (In Chinese) [Google Scholar]
  31. Hou, J.L.; Lv, J.N.; Ricoeur, A.; Hu, Y.F.; Zuo, H.; Chen, Y.H.; Li, Q. The M-integral in fracture and damage mechanics: A review of developments and applications. Eng. Fract. Mech. 2022, 273, 108741. [Google Scholar] [CrossRef]
  32. Zhao, S.L.; Yang, Z.J.; Fu, X.D.; Fang, Z. Shear damage mechanism of coarse-grained materials considering strain localization. Rock Soil Mech. 2023, 44, 31–42. (In Chinese) [Google Scholar]
  33. Morro, A. A phase-field approach to continuum damage mechanics. Materials 2022, 15, 7671. [Google Scholar] [CrossRef] [PubMed]
  34. Lemaitre, J. How to use damage mechanics. Nucl. Eng. Des. 1984, 80, 233–245. [Google Scholar] [CrossRef]
  35. Krajcinovic, D.; Silva, M.A.G. Statistical aspects of the continuous damage theory. Int. J. Solids Struct. 1982, 18, 551–562. [Google Scholar] [CrossRef]
  36. Zhao, G.J.; Chen, C.; Yan, H. A thermal damage constitutive model for oil shale based on weibull statistical theory. Math. Probl. Eng. 2019, 2019, 4962586. [Google Scholar] [CrossRef] [Green Version]
  37. Bu, P.; Li, Y.L.; Li, Y.; Wen, L.F.; Wang, J.; Zhang, X. Creep damage coupling model of concrete based on the statistical damage theory. J. Build. Eng. 2023, 63, 105437. [Google Scholar] [CrossRef]
  38. Liu, C.X.; Yang, L.D.; Cao, W.G. A statistical damage softening constitutive model for rock and back analysis of parameters. Chin. J. Undergr. Space Eng. 2007, 3, 453–457. (In Chinese) [Google Scholar]
  39. Huang, H.F.; Ju, N.P.; Lan, K.W.; Li, M.; Kong, W.; Guo, L.Y. Statistical damage softening model for rock and back analysis of its parameters. J. Yangtze River Sci. Res. Inst. 2018, 35, 102–106. (In Chinese) [Google Scholar]
  40. Pan, J.L.; Guo, Q.F.; Tian, L.M.; Wu, X.; Wang, M. Study on rock statistical damage softening constitutive model and its parameters based on the unified strength theory. Min. Res. Dev. 2019, 39, 38–42. (In Chinese) [Google Scholar]
  41. Walton, G.; Sinha, S. Challenges associated with numerical back analysis in rock mechanics. J. Rock Mech. Geotech. Eng. 2022, 14, 2058–2071. [Google Scholar] [CrossRef]
  42. Zhao, H.B.; Chen, B.R.; Li, S.J.; Li, Z.; Zhu, C. Updating the models and uncertainty of mechanical parameters for rock tunnels using Bayesian inference. Geosci. Front. 2021, 12, 230–242. [Google Scholar] [CrossRef]
  43. Liu, X.S.; Ning, J.G.; Tan, Y.L.; Gu, Q.H. Damage constitutive model based on energy dissipation for intact rock subjected to cyclic loading. Int. J. Rock Mech. Min. Sci. 2016, 85, 27–32. [Google Scholar] [CrossRef]
  44. Pan, J.L.; Cai, M.F.; Li, P.; Guo, Q.F. A damage constitutive model of rock-like materials containing a single crack under the action of chemical corrosion and uniaxial compression. J. Cent. South Univ. 2022, 29, 486–498. [Google Scholar] [CrossRef]
  45. Zhu, Z.N.; Tian, H.; Wang, R.; Jiang, G.S.; Dou, B.; Mei, G. Statistical thermal damage constitutive model of rocks based on Weibull distribution. Arab. J. Geosci. 2021, 14, 495. [Google Scholar] [CrossRef]
  46. Fang, Y.; Yao, Z.S.; Huang, X.W.; Li, X.W.; Diao, N.H.; Hu, K.; Li, H. Permeability evolution characteristics and microanalysis of reactive powder concrete of drilling shaft lining under stress-seepage coupling. Constr. Build. Mater. 2022, 331, 127336. [Google Scholar] [CrossRef]
  47. Li, H.C.; Zhang, S. A constitutive damage model of rock based on the assumption of modified Lemaitre strain equivalence hypothesis. Rock Soil Mech. 2017, 38, 1321–1326, 1334. (In Chinese) [Google Scholar]
  48. Shi, Z.M.; Li, J.T.; Wang, J.; Chen, J.; Lin, H.; Cao, P. Experimental and numerical study on fracture characteristics and constitutive model of sandstone under freeze-thaw-fatigue. Int. J. Fatigue 2023, 166, 107236. [Google Scholar] [CrossRef]
  49. Fang, Y.; Yao, Z.S.; Huang, X.W.; Li, X.W.; Xu, Y.J.; Hu, K.; Shu, S.Y. Durability analysis and damage constitutive modeling of fiber-reinforced reactive powder concrete of drilling shaft in porous water-bearing rock stratum. Case. Stud. Constr. Mater. 2023, 18, e01911. [Google Scholar] [CrossRef]
Figure 1. SEM images of rock: (a) 100 μm; (b) 200 μm; (c) 20 μm; (d) 2 μm.
Applsci 13 04504 g001
Figure 2. XRD of sandstone.
Applsci 13 04504 g002
Figure 3. Stress diagram of the triaxial test system and test piece.
Applsci 13 04504 g003
Figure 4. Stress–strain curve of red sandstone under uniaxial compression.
Applsci 13 04504 g004
Figure 5. Stress–strain curve of red sandstone under triaxial compression. (a) T = 25 °C; (b) T = −5 °C; (c) T = −10 °C; (d) T = −15 °C.
Applsci 13 04504 g005
Figure 6. Sandstone peak intensity and the relationship between confining pressure and temperature. (a) Relationship between peak strength and confining pressure. (b) Relationship between peak strength and temperature.
Applsci 13 04504 g006
Figure 7. Sandstone elastic modulus and the relationship between confining pressure and temperature. (a) Relationship between elastic modulus and confining pressure. (b) Relationship between elastic modulus and temperature.
Applsci 13 04504 g007
Figure 8. Poisson’s ratio of sandstone and the relationship between confining pressure and temperature. (a) Relationship between Poisson’s ratio and confining pressure. (b) Relationship between Poisson’s ratio and temperature.
Applsci 13 04504 g008
Figure 9. Stress–strain curve before yield point.
Applsci 13 04504 g009
Figure 10. Relationship between model parameter solution and stress–strain curve.
Applsci 13 04504 g010
Figure 11. Relationship between model parameters and confining pressure.
Applsci 13 04504 g011
Figure 12. Comparison between experimental data and model data.
Applsci 13 04504 g012
Figure 13. Comparison between experimental data and model data. (a) T = 25 °C; (b) T = −5 °C; (c) T = −10 °C; (d) T = −15 °C.
Applsci 13 04504 g013
Figure 14. Comparison between experimental data and model data. (a) W = 2 MPa; (b) W = 4 MPa; (c) W = 6 MPa.
Applsci 13 04504 g014
Table 1. Basic physical parameters of sandstone.
Natural Moisture Content/%Saturated Water Content/%Dry Density/g·cm−3Saturation Density/g·cm−3Porosity/%
5.188.692.122.2323.61
Table 2. Test scheme and number.
Experimental TemperatureConfining Pressure
0 MPa (No Confining Pressure)2 MPa4 MPa6 MPa
25 °CW0T25W2T25W4T25W6T25
−5 °CW0T-5W2T-5W4T-5W6T-5
−10 °CW0T-10W2T-10W4T-10W6T-10
−15 °CW0T-15W2T-15W4T-15W6T-15
Table 3. Test results.
Specimen Numberσmax/MPaE/MPaμ
W0T2512.2422407.360.249
W0T-520.6892973.210.239
W0T-1027.1223728.390.230
W0T-1531.8124947.370.210
W2T2516.8273026.180.234
W2T-525.5573802.130.226
W2T-1033.2774507.640.216
W2T-1538.9815807.880.197
W4T2523.6113713.070.222
W4T-531.2764478.780.216
W4T-1038.7045292.020.204
W4T-1549.1096723.260.187
W6T2532.7844376.910.213
W6T-541.5825439.730.207
W6T-1051.7066390.490.196
W6T-1558.6427507.740.180
Table 4. Results of model deviation.
Confining Pressure/MPaAbsolute Deviation δ /MPa Relative   Deviation   δ ¯ /%
20.3123.28
40.5263.82
60.7063.68
Disclaimer/Publisher’s Note: The statements, opinions and data contained in all publications are solely those of the individual author(s) and contributor(s) and not of MDPI and/or the editor(s). MDPI and/or the editor(s) disclaim responsibility for any injury to people or property resulting from any ideas, methods, instructions or products referred to in the content.

