
Analysis of Dynamic Characteristics of Low-Floor Train Passing Switch in Facing Direction with Bad Alignment Irregularity Ahead of the Turnout

Abstract
:1. Introduction
2. Field Test and Dynamic Model of Low-Floor Train Passing Switch
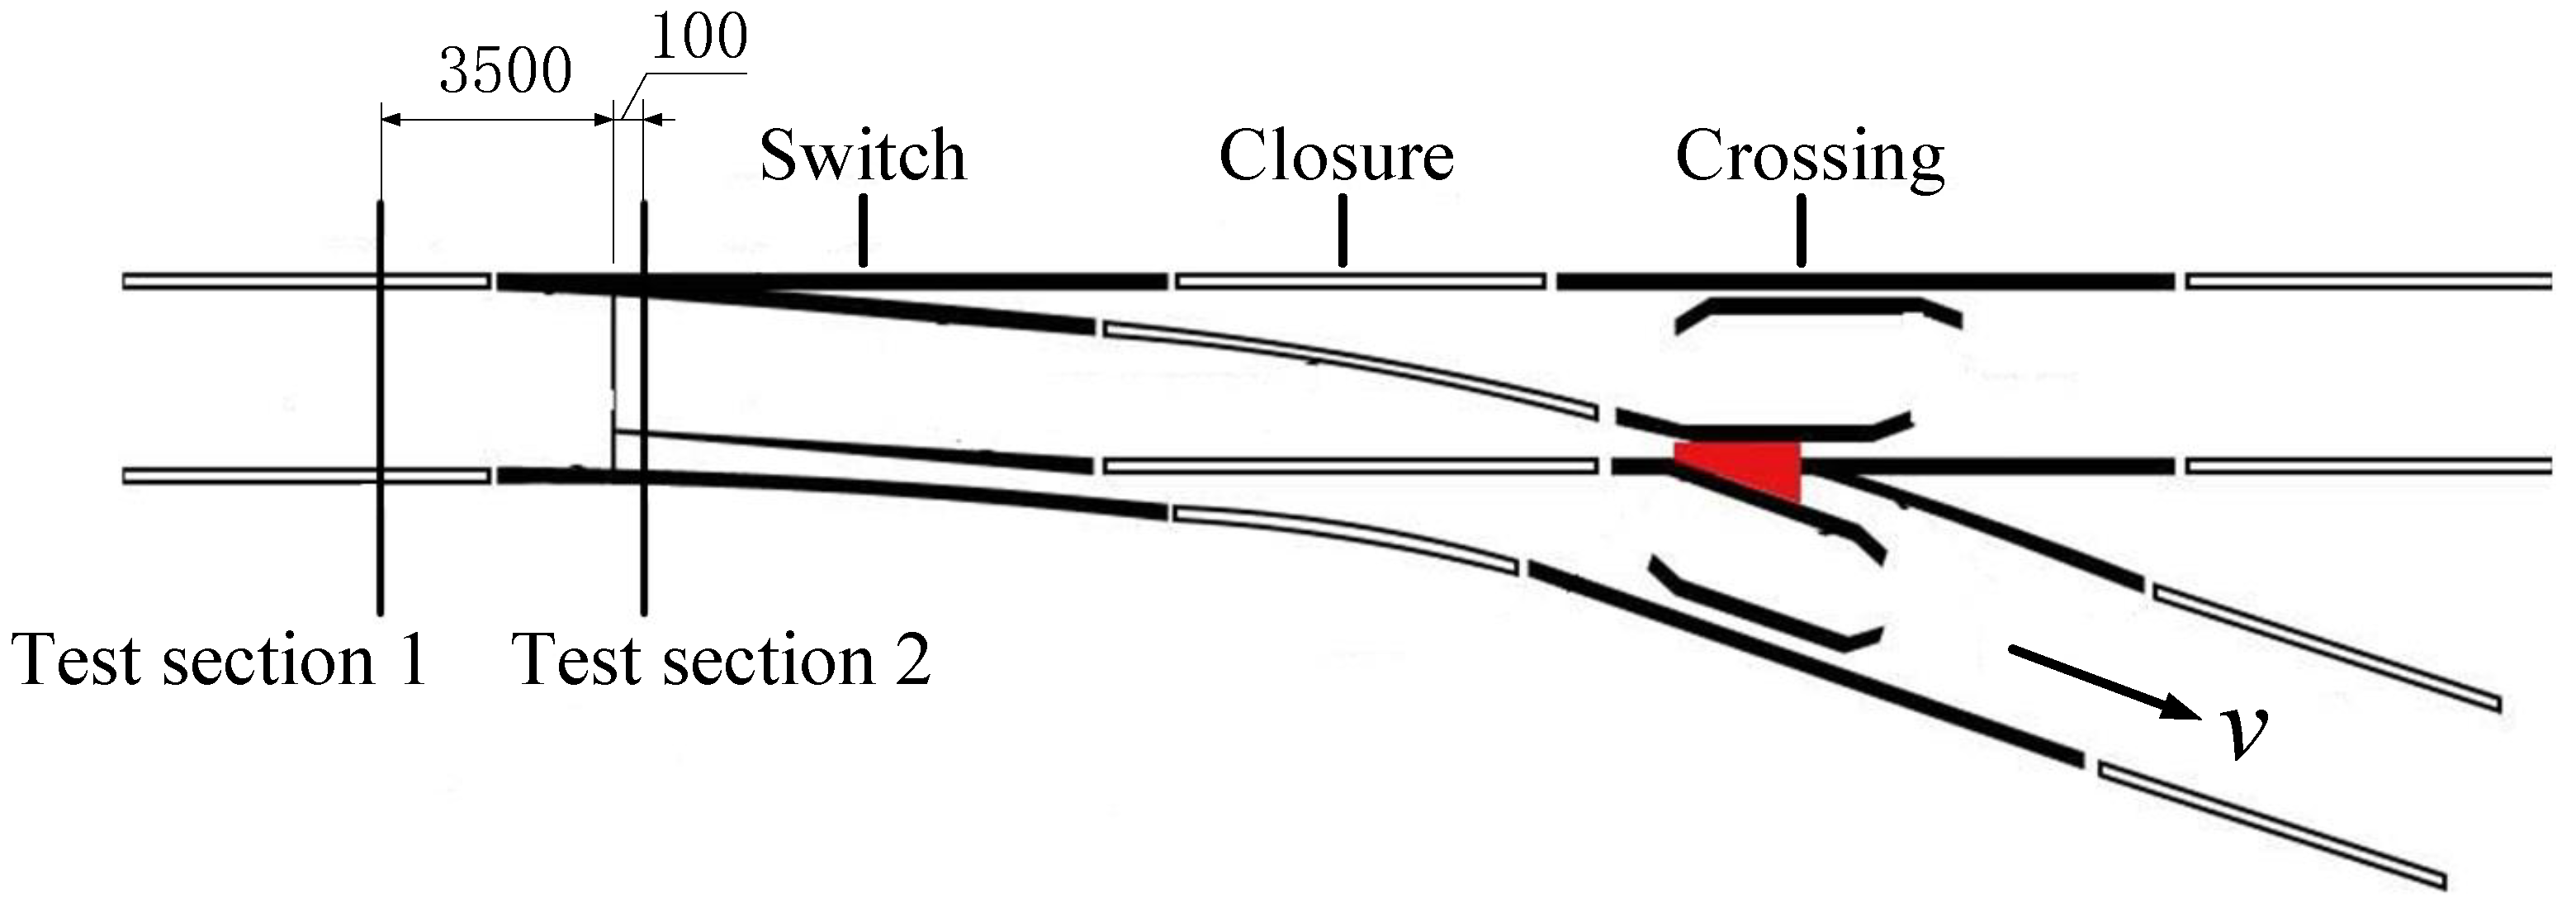
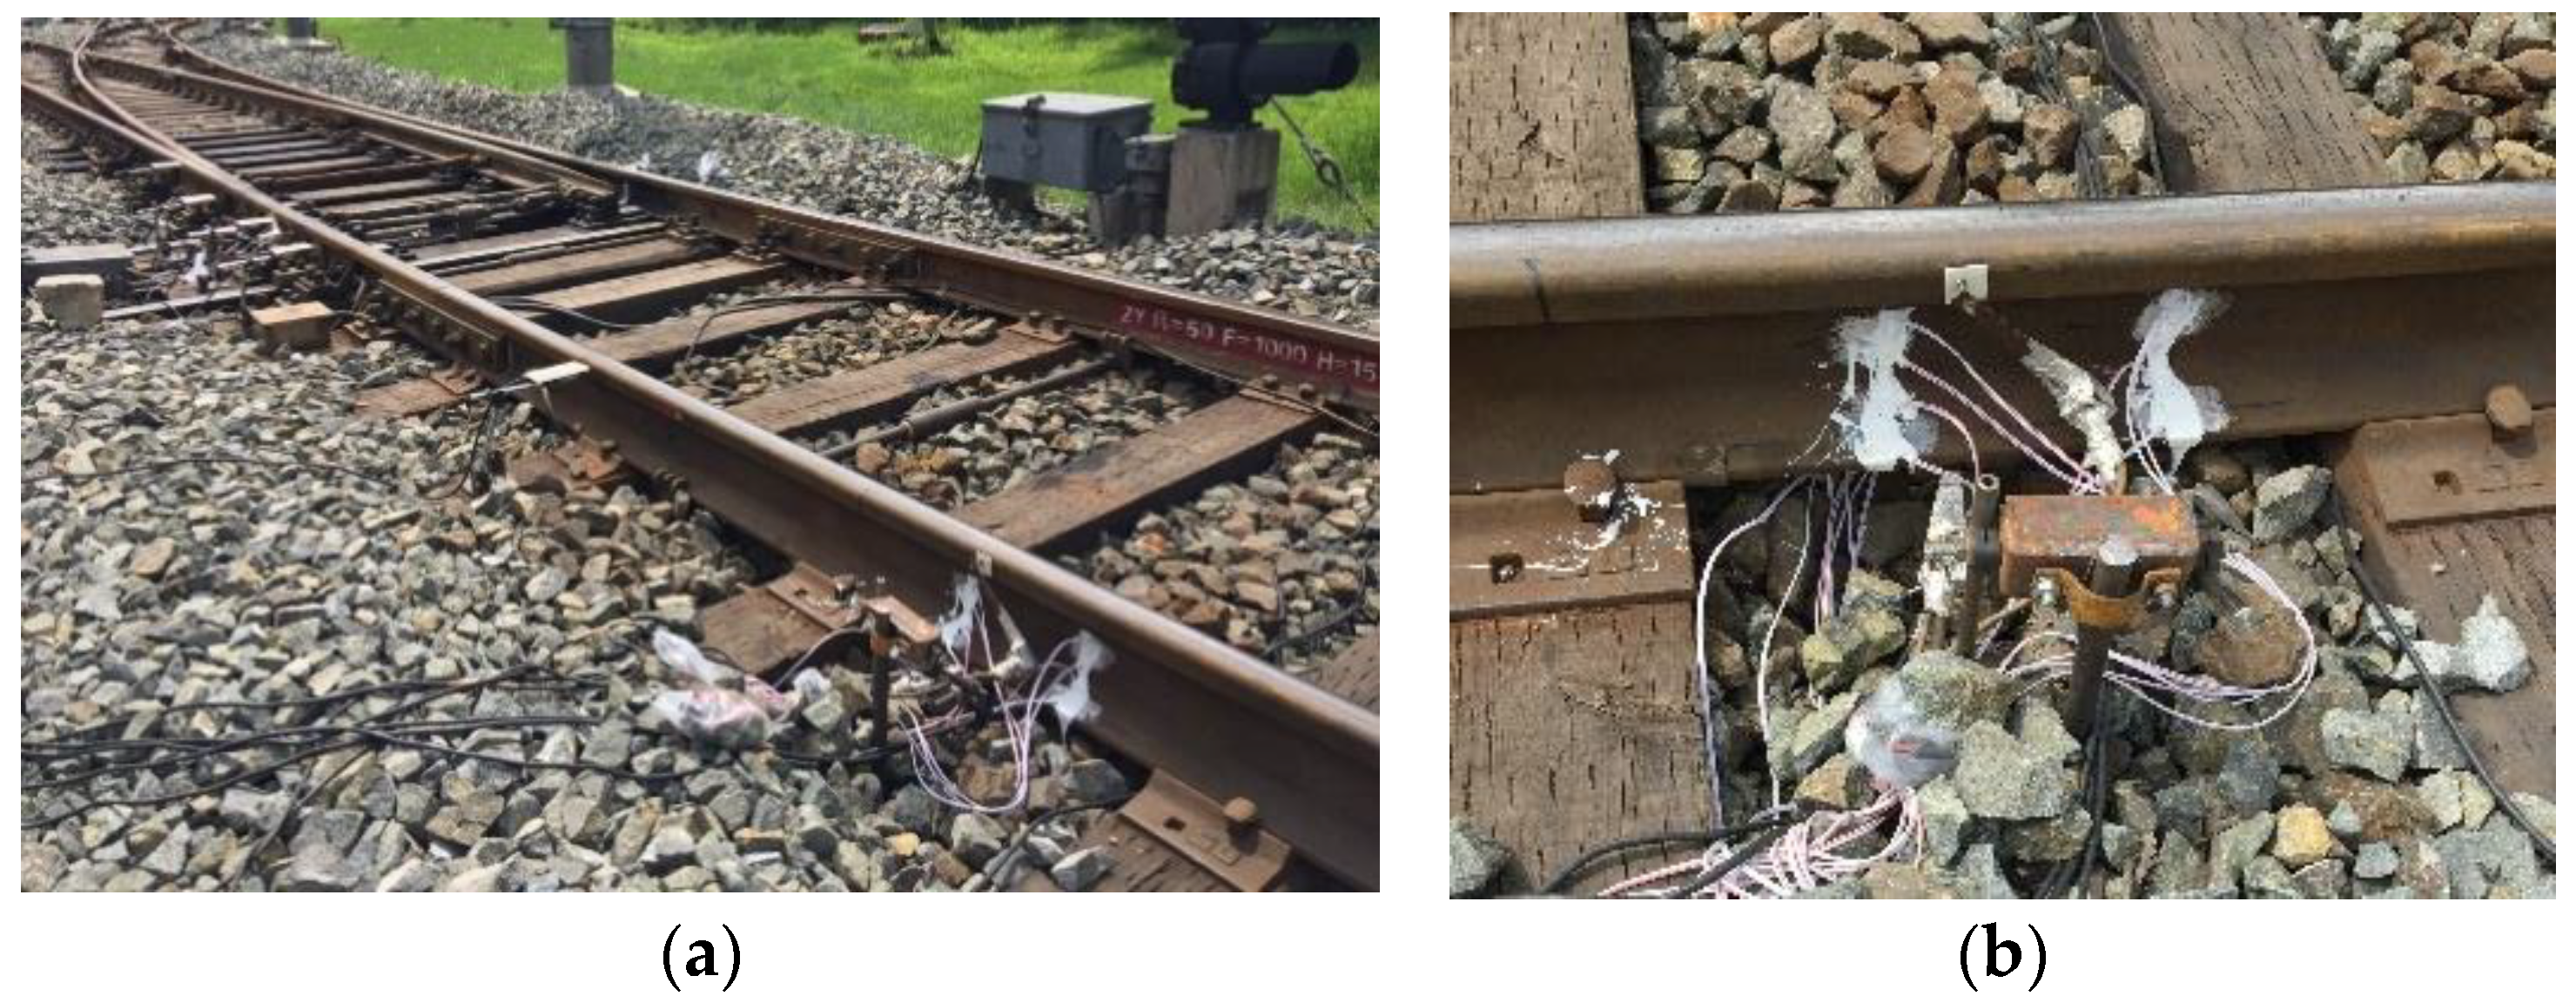
2.1. Field Test
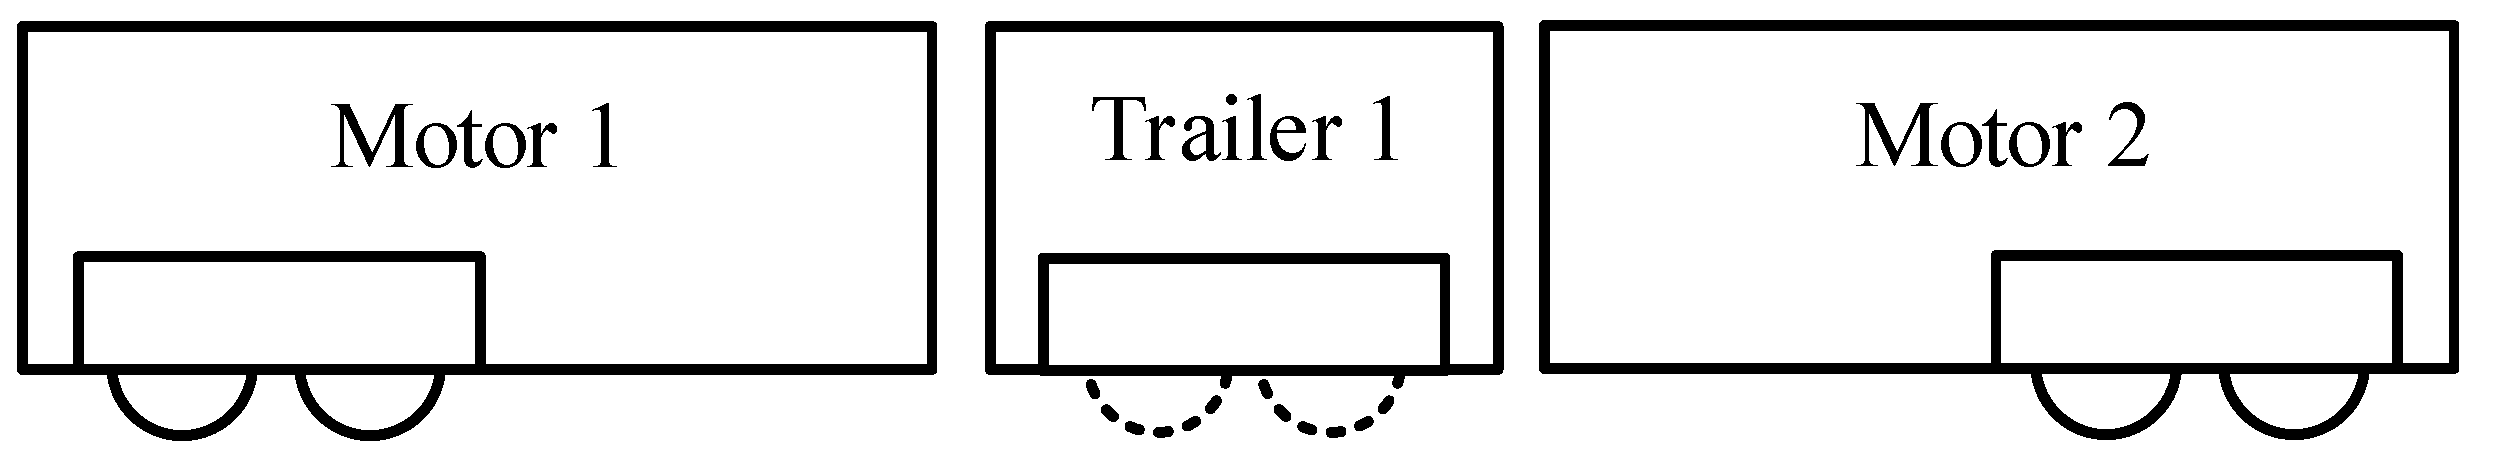
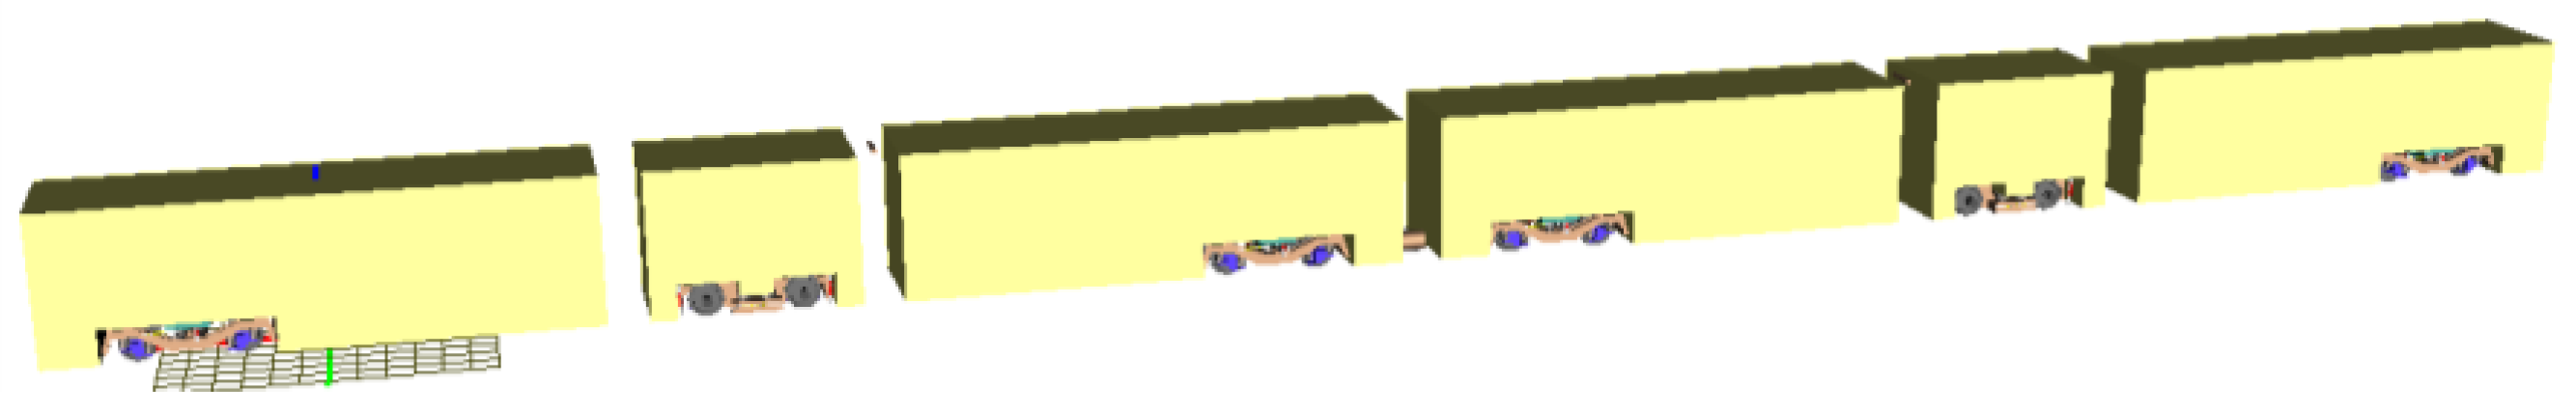
2.2. Coupling Dynamic Model of Low-Floor Trains and Turnout Switch
3. Model Validation
4. Analysis of Influence Factors
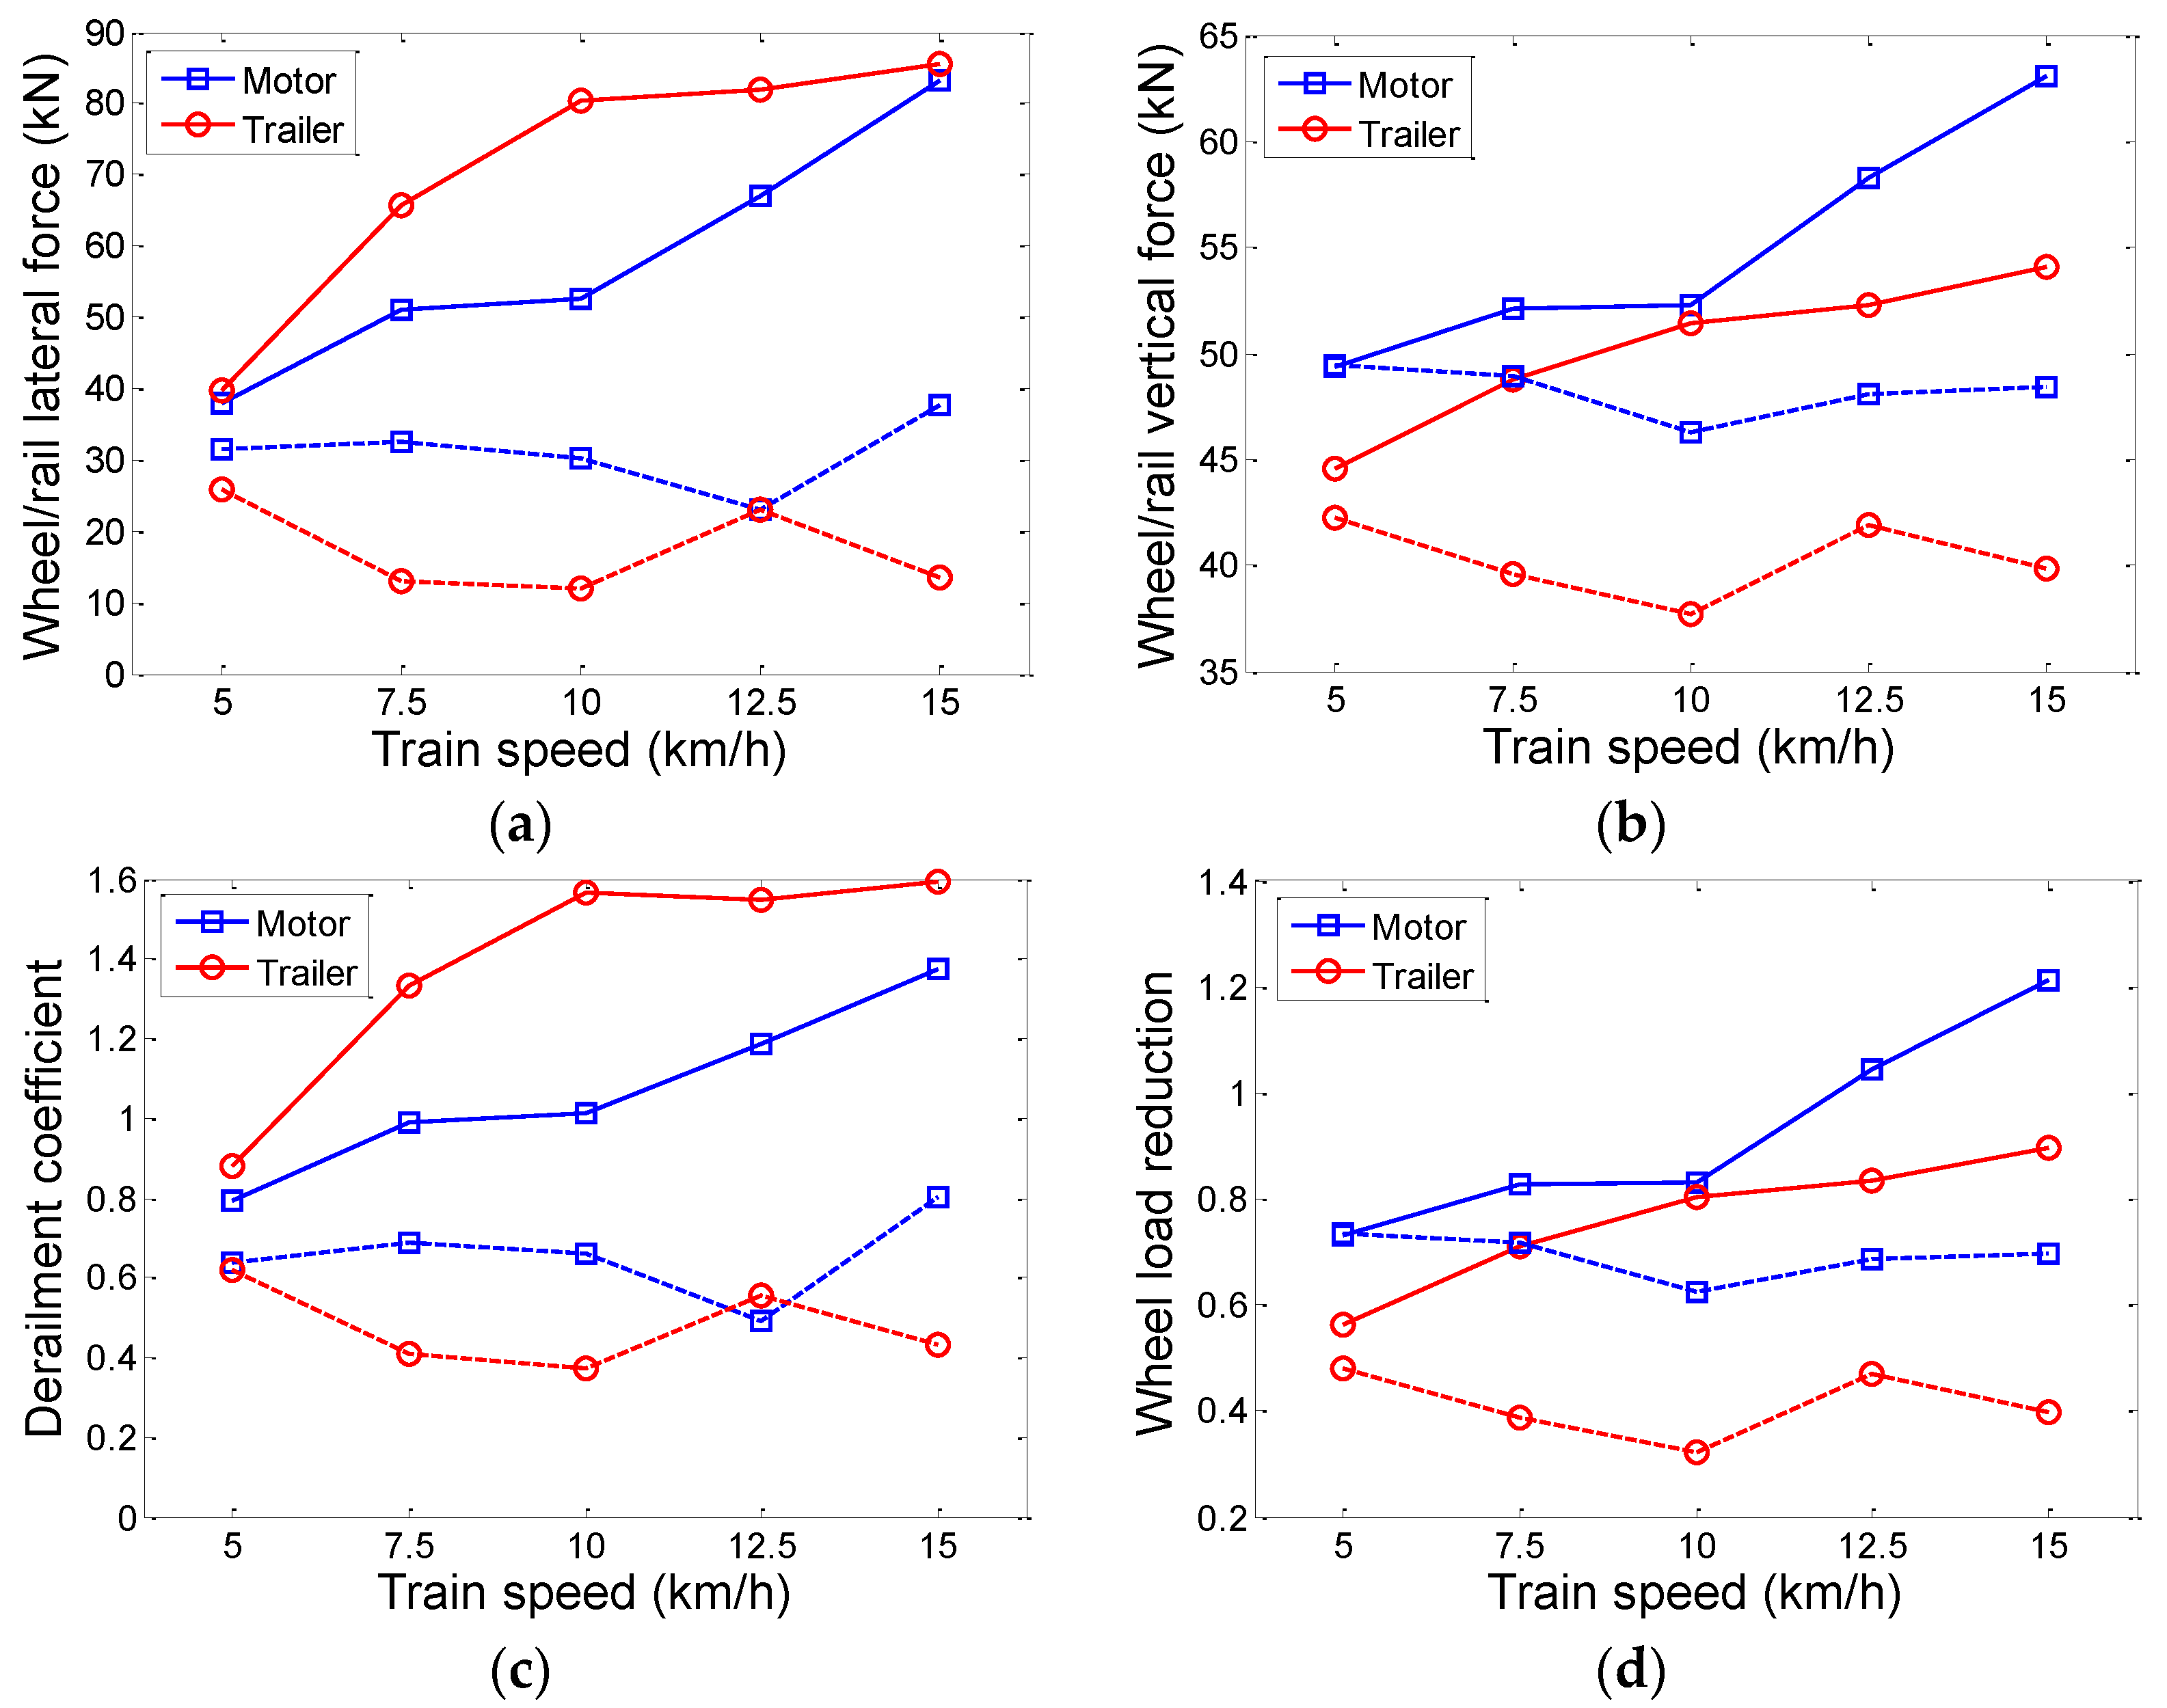
4.1. Train Speed
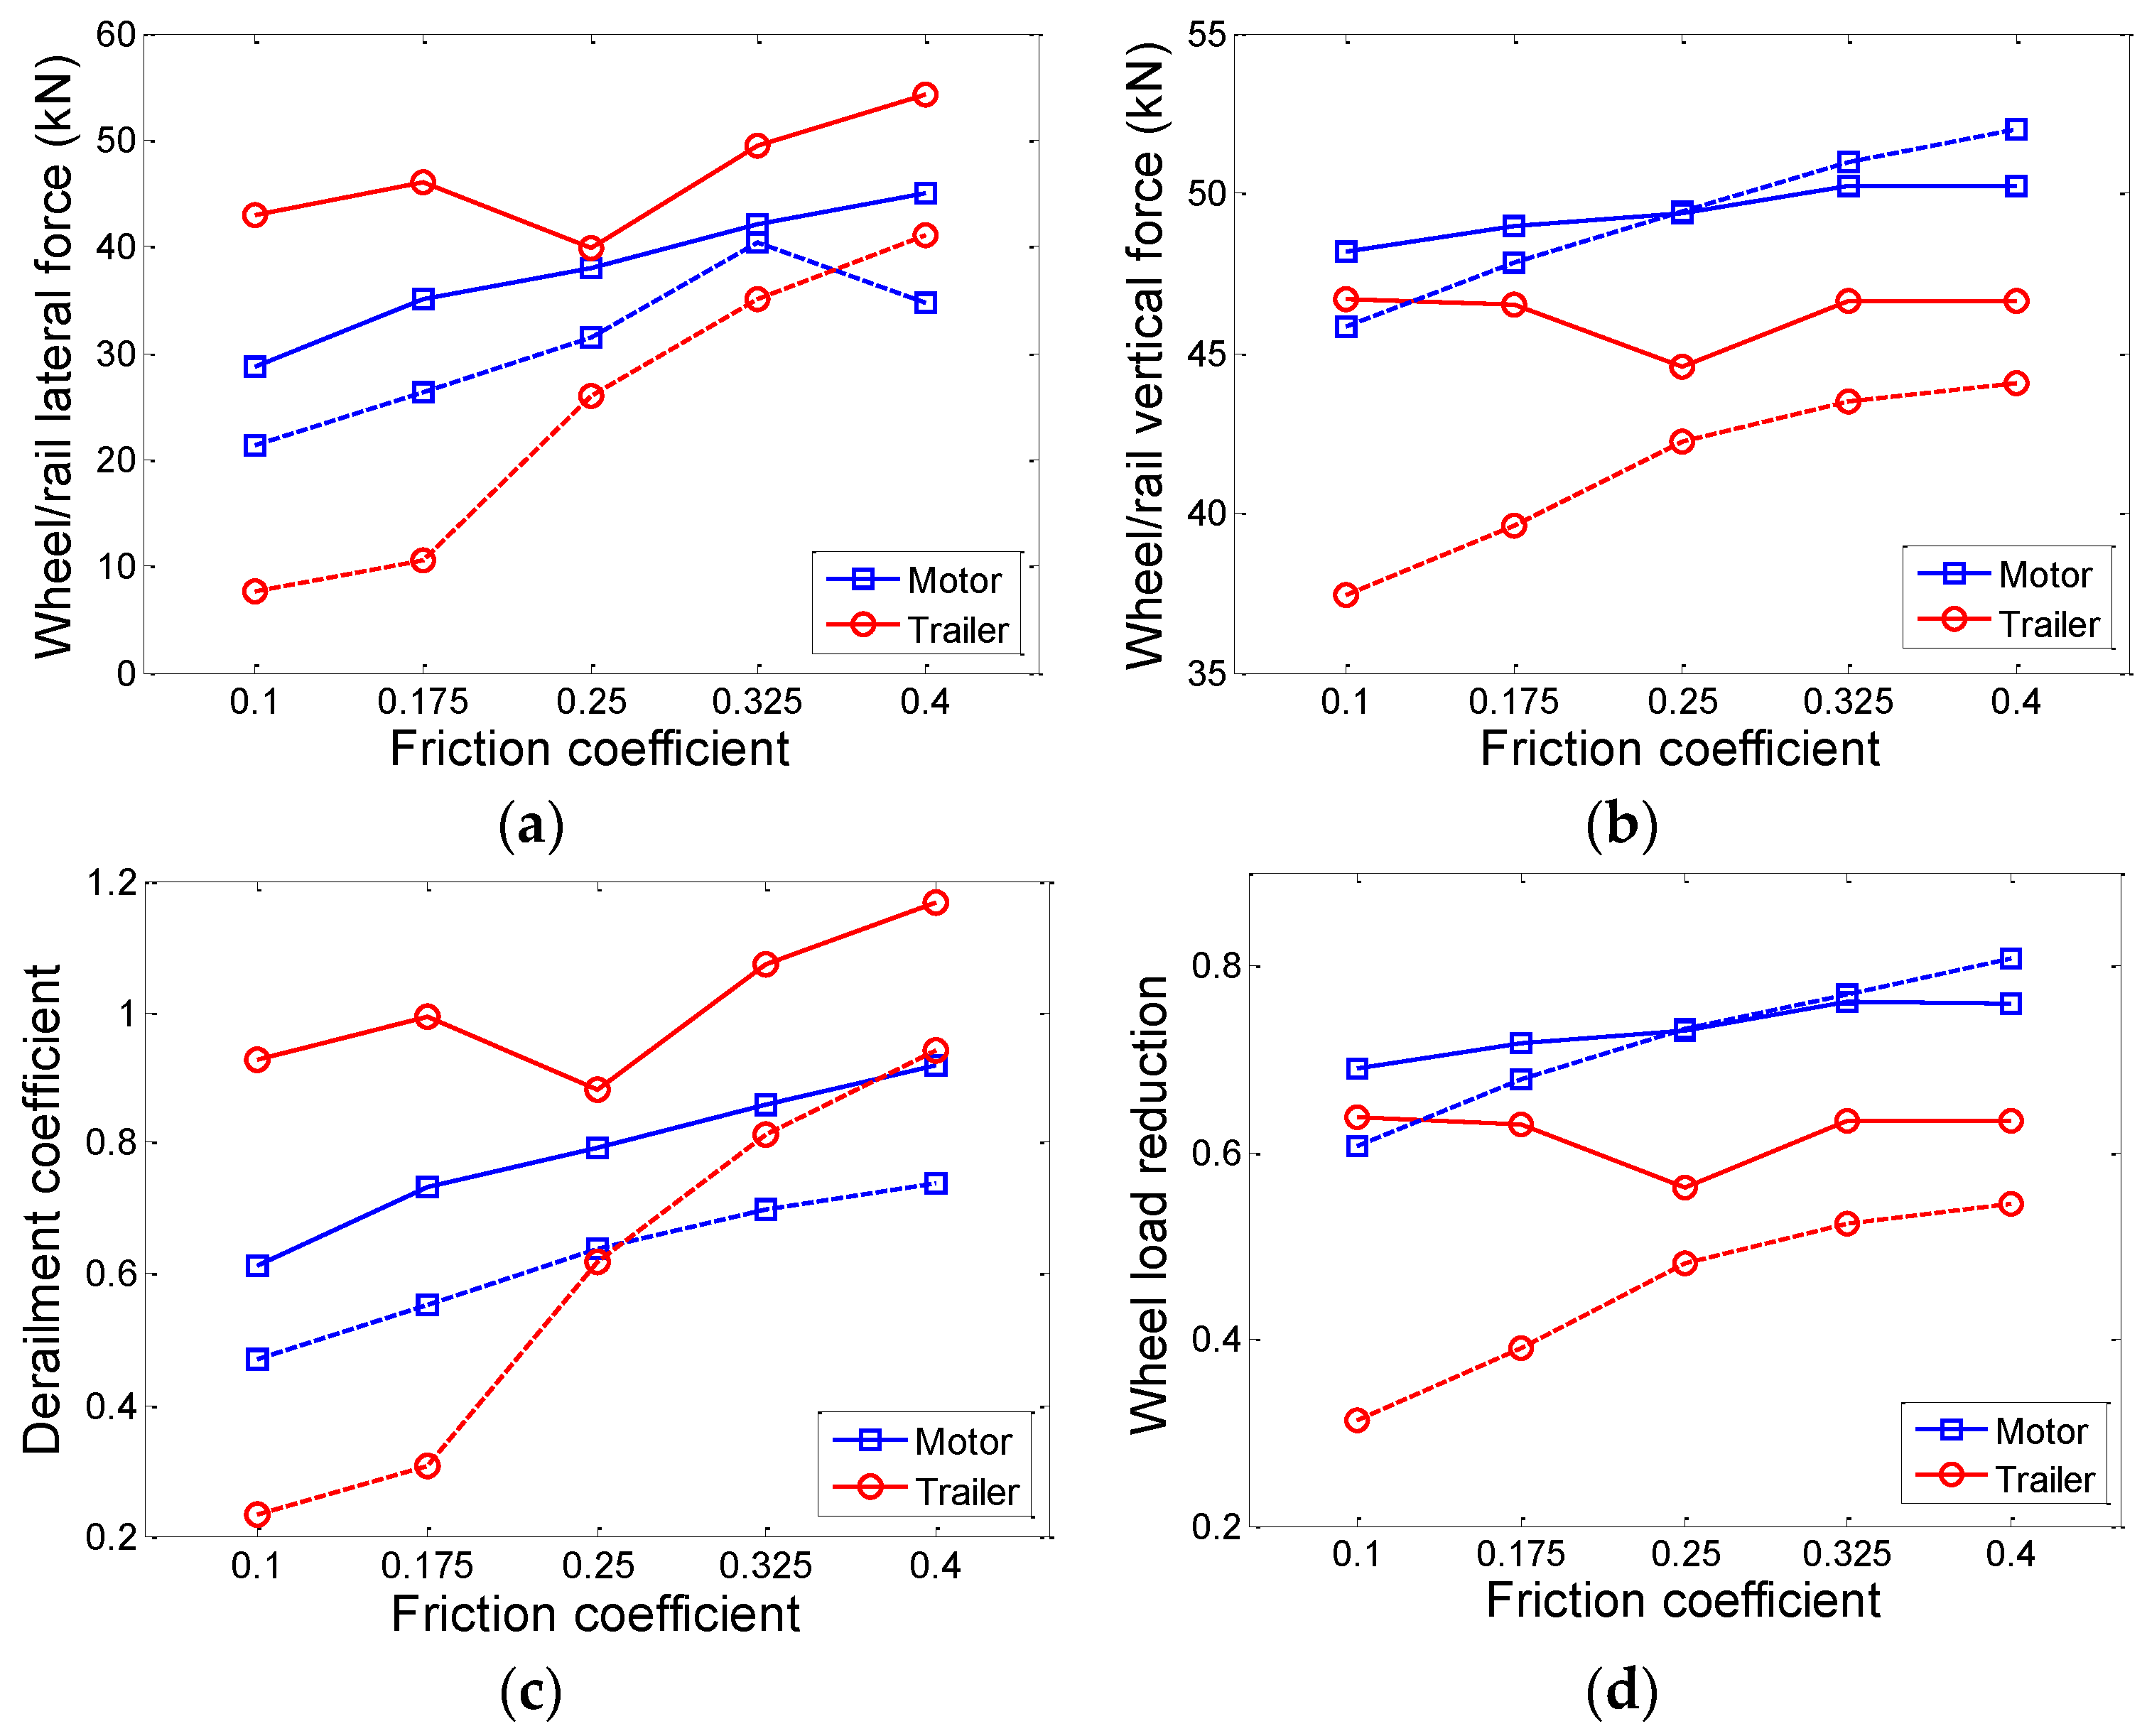
4.2. Wheel–Rail Friction Coefficient
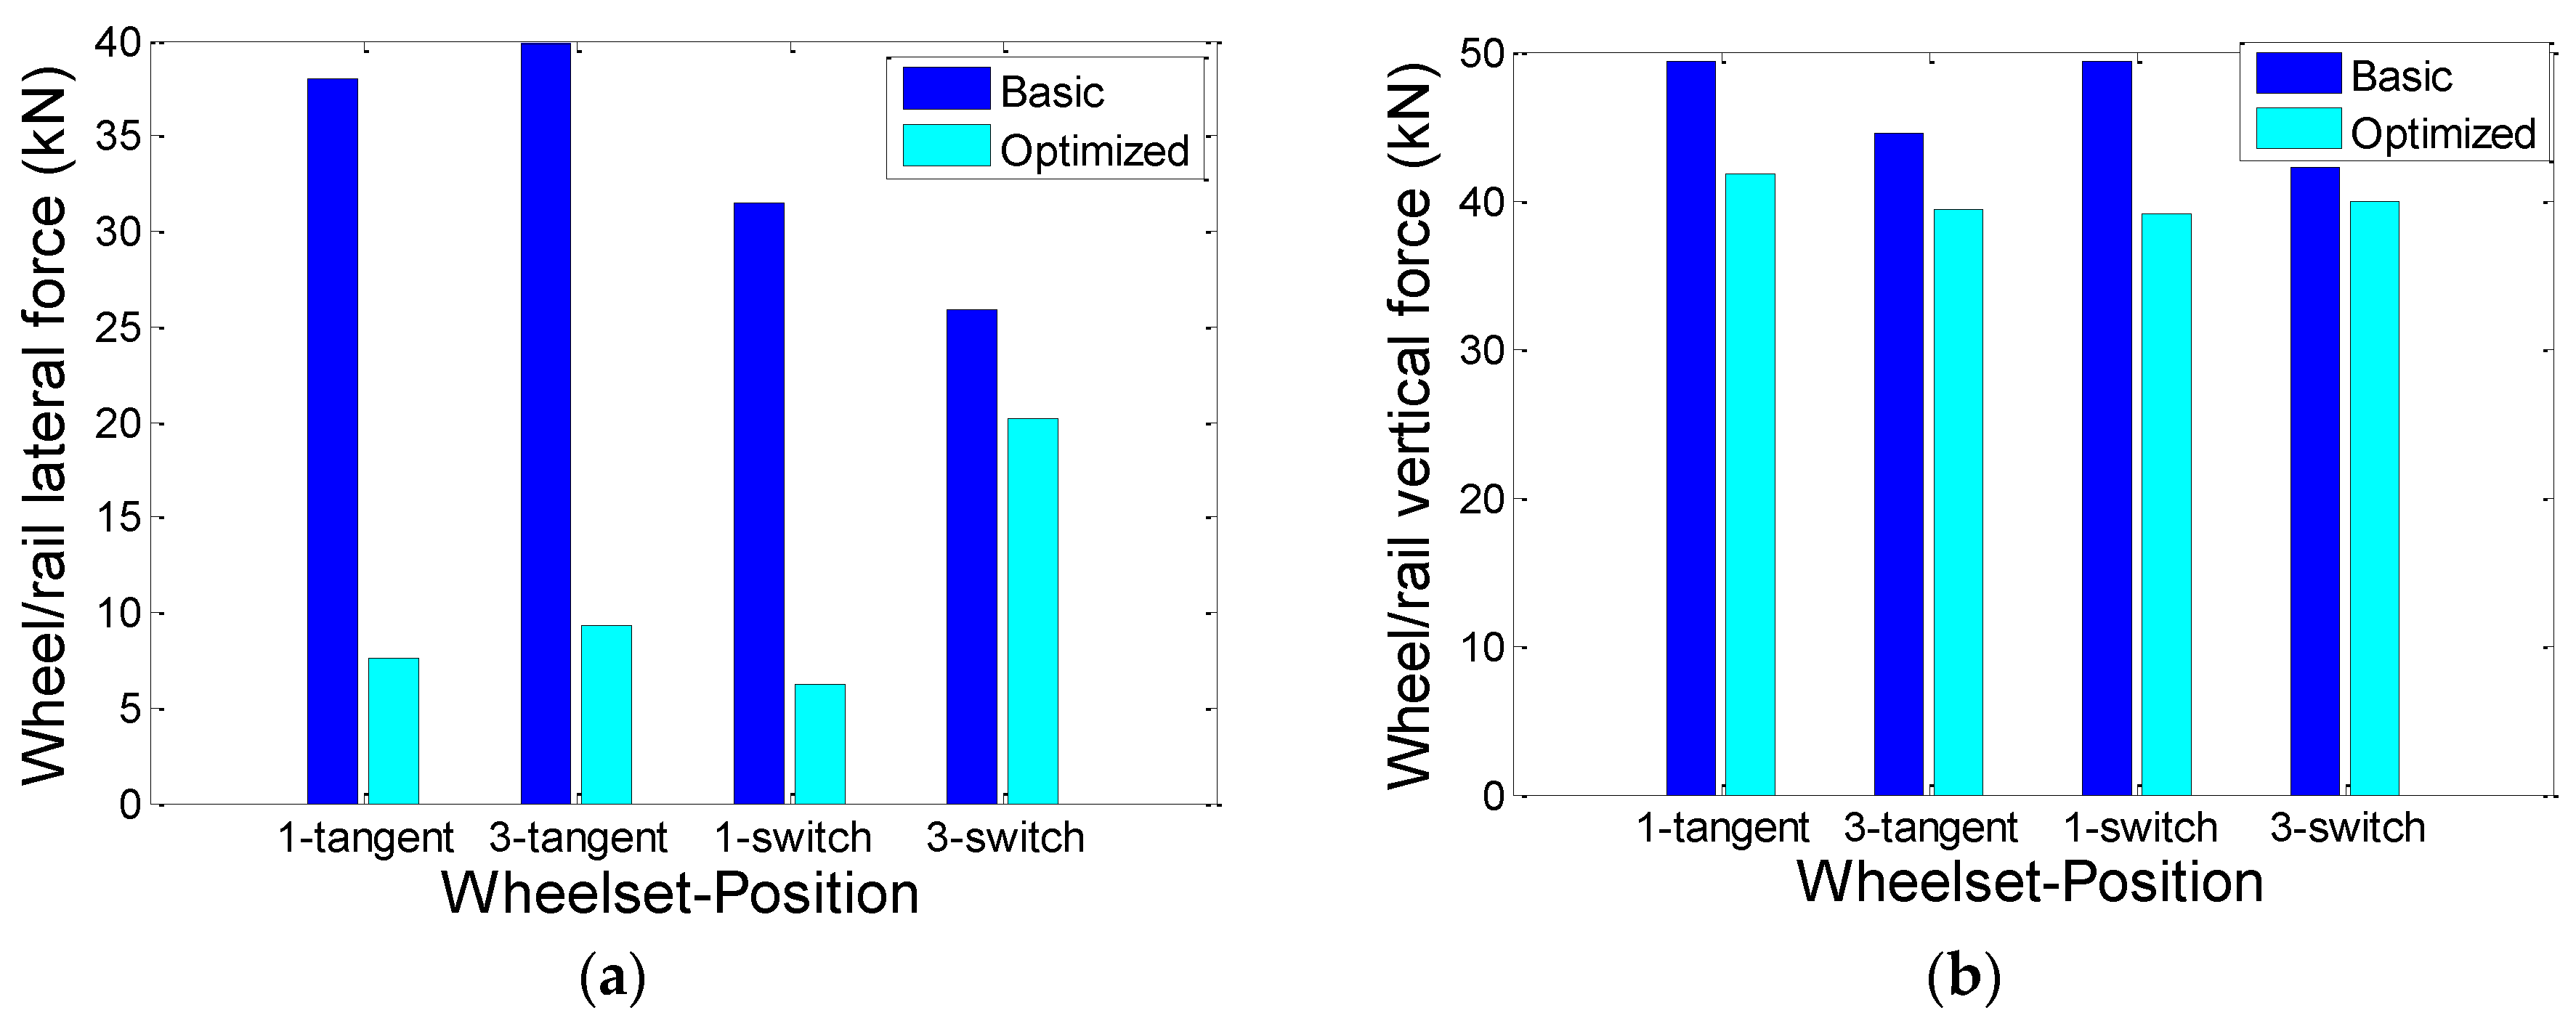
4.3. Alignment Adjustment
5. Conclusions and Future Work
- (1)
- When there is bad alignment irregularity in the tangent before the turnout, the wheel–rail dynamic performance in the tangent is worse than that in the switch; the dynamic indexes of the integrated wheelset and the independently rotating wheelset increase with the train speed increasing, but at different increase rates. In the switch, the dynamic indexes of the integrated wheelset decrease first and then increase with the increase in speed, while those of independently rotating wheelset first decrease, then increase and eventually decrease.
- (2)
- The dynamic indexes of the integrated wheelset in the tangent with alignment irregularity increase with the increase in the friction coefficient, while the dynamic indexes of the independently rotating wheelset will increase both under the condition of smaller and larger friction coefficients, but tend to decrease under an intermediate friction coefficient. The vertical force of the motor wheel in the switch zone exceeds that in the tangent as the friction coefficient increases. The variation trends of the derailment coefficient and wheel load reduction are inconsistent with the trends of the lateral force and vertical force, respectively. In the switch, the dynamic indexes of both wheelsets increase as the friction coefficient increases, and the lateral force and derailment coefficient of the independently rotating wheelset increase remarkably.
- (3)
- Eliminating alignment irregularities before the switch can effectively improve the dynamic performance of the integrated wheelset in the switch, and the lateral forces of the outer wheels of these two vehicles are reduced by about 80%, the derailment coefficients are reduced by about 70%, the vertical force reduced by about 10–20% and the wheel load is reduced by approximately 30%. Due to keeping in flange contact with the outer rail entering the switch, the independent wheelset has a rather limited promotion in dynamic performance when passing the switch.
Author Contributions
Funding
Institutional Review Board Statement
Informed Consent Statement
Data Availability Statement
Conflicts of Interest
References
- Li, C.H. Railway Track; Southwest Jiaotong University Press: Chengdu, China, 2012. [Google Scholar]
- Wang, P. A Spatial Coupling Model for Railway Turnouts and Its Application. J. Southwest Jiaotong Univ. 1998, 33, 284–289. [Google Scholar]
- Wang, P. A Study on Variation Regularity of Wheel Load on Switch of Turnout. J. Southwest Jiaotong Univ. 1999, 5, 550–553. [Google Scholar]
- Ren, Z. Multi-Point Contact of the high-Speed vehicle-Turnout system dynamics. Chin. J. Mech. Eng. 2013, 26, 518–525. [Google Scholar] [CrossRef]
- Ren, Z.; Sun, S.G.; Xie, G. A method to determine the two-Point contact zone and transfer of wheel-Rail forces in a turnout. Veh. Syst. Dyn. 2010, 48, 1115–1133. [Google Scholar] [CrossRef]
- Chen, R. Theory and Application of Vehicle-Turnout-Bridge Coupling Vibration in High Speed Railway. Ph.D. Thesis, Southwest Jiaotong University, Chengdu, China, 2009. [Google Scholar]
- Schmid, R.; Endlicher, K.O.; Lugner, P. Computer-Simulation of the dynamical behavior of a railway-Bogie passing a switch. Veh. Syst. Dyn. 1994, 23, 481–499. [Google Scholar] [CrossRef]
- Elias, K.; Nielsen, J.O. Dynamic interaction between train and railway turnout: Full-Scale field test and validation of simulation models. Veh. Syst. Dyn. 2008, 46, 521–534. [Google Scholar]
- Pletz, M.; Daves, W.; Ossberger, H. A wheel passing a crossing nose: Dynamic analysis under high axle loads using finite element modelling. Proc. Inst. Mech. Eng. Part F J. Rail Rapid Transit 2012, 226, 603–611. [Google Scholar] [CrossRef]
- Alfi, S.; Bruni, S. Mathematical modelling of train–Turnout interaction. Veh. Syst. Dyn. 2009, 47, 551–574. [Google Scholar] [CrossRef]
- Xu, J.; Ma, Q.; Wang, X.; Chen, J.; Chen, R.; Wang, P.; Wei, X. Investigation on the motion conditions and dynamic interaction of vehicle and turnout due to differential wheelset misalignment. Veh. Syst. Dyn. 2022, 60, 2587–2607. [Google Scholar] [CrossRef]
- Ma, X.; Wang, P.; Xu, J.; Xu, J.; Chen, R. Effect of rail straightening irregularity on vertical dynamic characteristics of vehicle-turnout coupling system. J. Southwest Jiaotong Univ. 2017, 48, 1942–1950. [Google Scholar]
- Chang, W.; Cai, X.; Wang, Q.; Tang, X.; Sun, J.; Yang, F. The Influence of track irregularity in front of the turnout on the dynamic performance of vehicles. Appl. Sci. 2022, 12, 4169. [Google Scholar] [CrossRef]
- Zakeri, J.; Esmaeili, M.H.; Mazraeh, A.; Shadfar, M. Impact of heavy urban rail vehicles running over light rail turnouts. Proc. Inst. Mech. Eng. Part F J. Rail Rapid Transit 2021, 235, 300–312. [Google Scholar] [CrossRef]
- Chen, M.; Luo, Y.Y.; Zhang, B. Dynamic characteristic analysis of irregularity under turnout by vehicle-Turnout rigid-Flexible coupling model. Adv. Mater. Res. 2014, 945, 591–595. [Google Scholar] [CrossRef]
- Björn, A.P. A parameterized turnout model for simulation of dynamic vehicle-Turnout interaction with an application to crossing geometry assessment. Adv. Dyn. Veh. Roads Tracks 2020, 8, 351–358. [Google Scholar]
- Chiou, S.B.; Yen, J.Y. Modeling of railway turnout geometry in the frog area with the vehicle wheel trajectory. Proc. Inst. Mech. Eng. Part F J. Rail Rapid Transit 2018, 232, 1598–1614. [Google Scholar] [CrossRef]
- Sun, X.; Wang, P.; Chen, J.Y.; Hao, C.J.; Xu, J.M. Analytical representations of inherent structural irregularities in turnout crossing with moveable point. Veh. Syst. Dyn. 2022, 12, 1086–1104. [Google Scholar] [CrossRef]
- Zhou, C.; Chi, M.; Liang, S.; Wu, X.; Jiang, Y.; Wu, L. Dynamic Behavior Analysis of Urban Light Rail Low Floor Train with Different Wheelset Passing Turnout Area. J. Mech. Eng. 2019, 55, 98–106. [Google Scholar] [CrossRef]
- Zhai, W.M. Vehicle-Track Coupled Dynamics; Science Press: Beijing, China, 2015. [Google Scholar]


| Parameters | Motor Vehicle | Trailer Vehicle |
|---|---|---|
| Wheelset mass/kg | 1500 | 560 (Single wheel) |
| Bogie mass/kg | 2970 | 1971 |
| Carbody mass/kg | 18 | 6.6 |
| Wheel radius/m | 0.33 | 0.33 |
| Wheel base/m | 1.492 | 1.492 |
| Primary longitudinal stiffness/(N∙m−1) | 4 × 10⁶ | 4.5 × 10⁶ |
| Primary lateral stiffness/(N∙m−1) | 4 × 10⁶ | 4.5 × 10⁶ |
| Primary vertical stiffness/(N∙m−1) | 8.9 × 10⁵ | 7.46 × 10⁵ |
| Primary longitudinal damping/(N∙s/m) | 5000 | 5000 |
| Primary lateral damping/(N∙s/m) | 5000 | 5000 |
| Primary vertical damping/(N∙s/m) | 10,000 | 10,000 |
| Secondary longitudinal stiffness/(N∙m−1) | 1.2 × 10⁶ | 1.2 × 10⁶ |
| Secondary lateral stiffness/(N∙m−1) | 1.2 × 10⁶ | 1.2 × 10⁶ |
| Secondary vertical stiffness/(N∙m−1) | 4.5 × 10⁵ | 6.1 × 10⁵ |
| Secondary longitudinal damping/(N∙s/m) | 1000 | 1000 |
| Secondary lateral damping/(N∙s/m) | 1000 | 1000 |
| Secondary vertical damping/(N∙s/m) | 2000 | 2000 |
| Wheel–Rail Force | Relative Error/% | |
|---|---|---|
| Section 1 | Section 2 | |
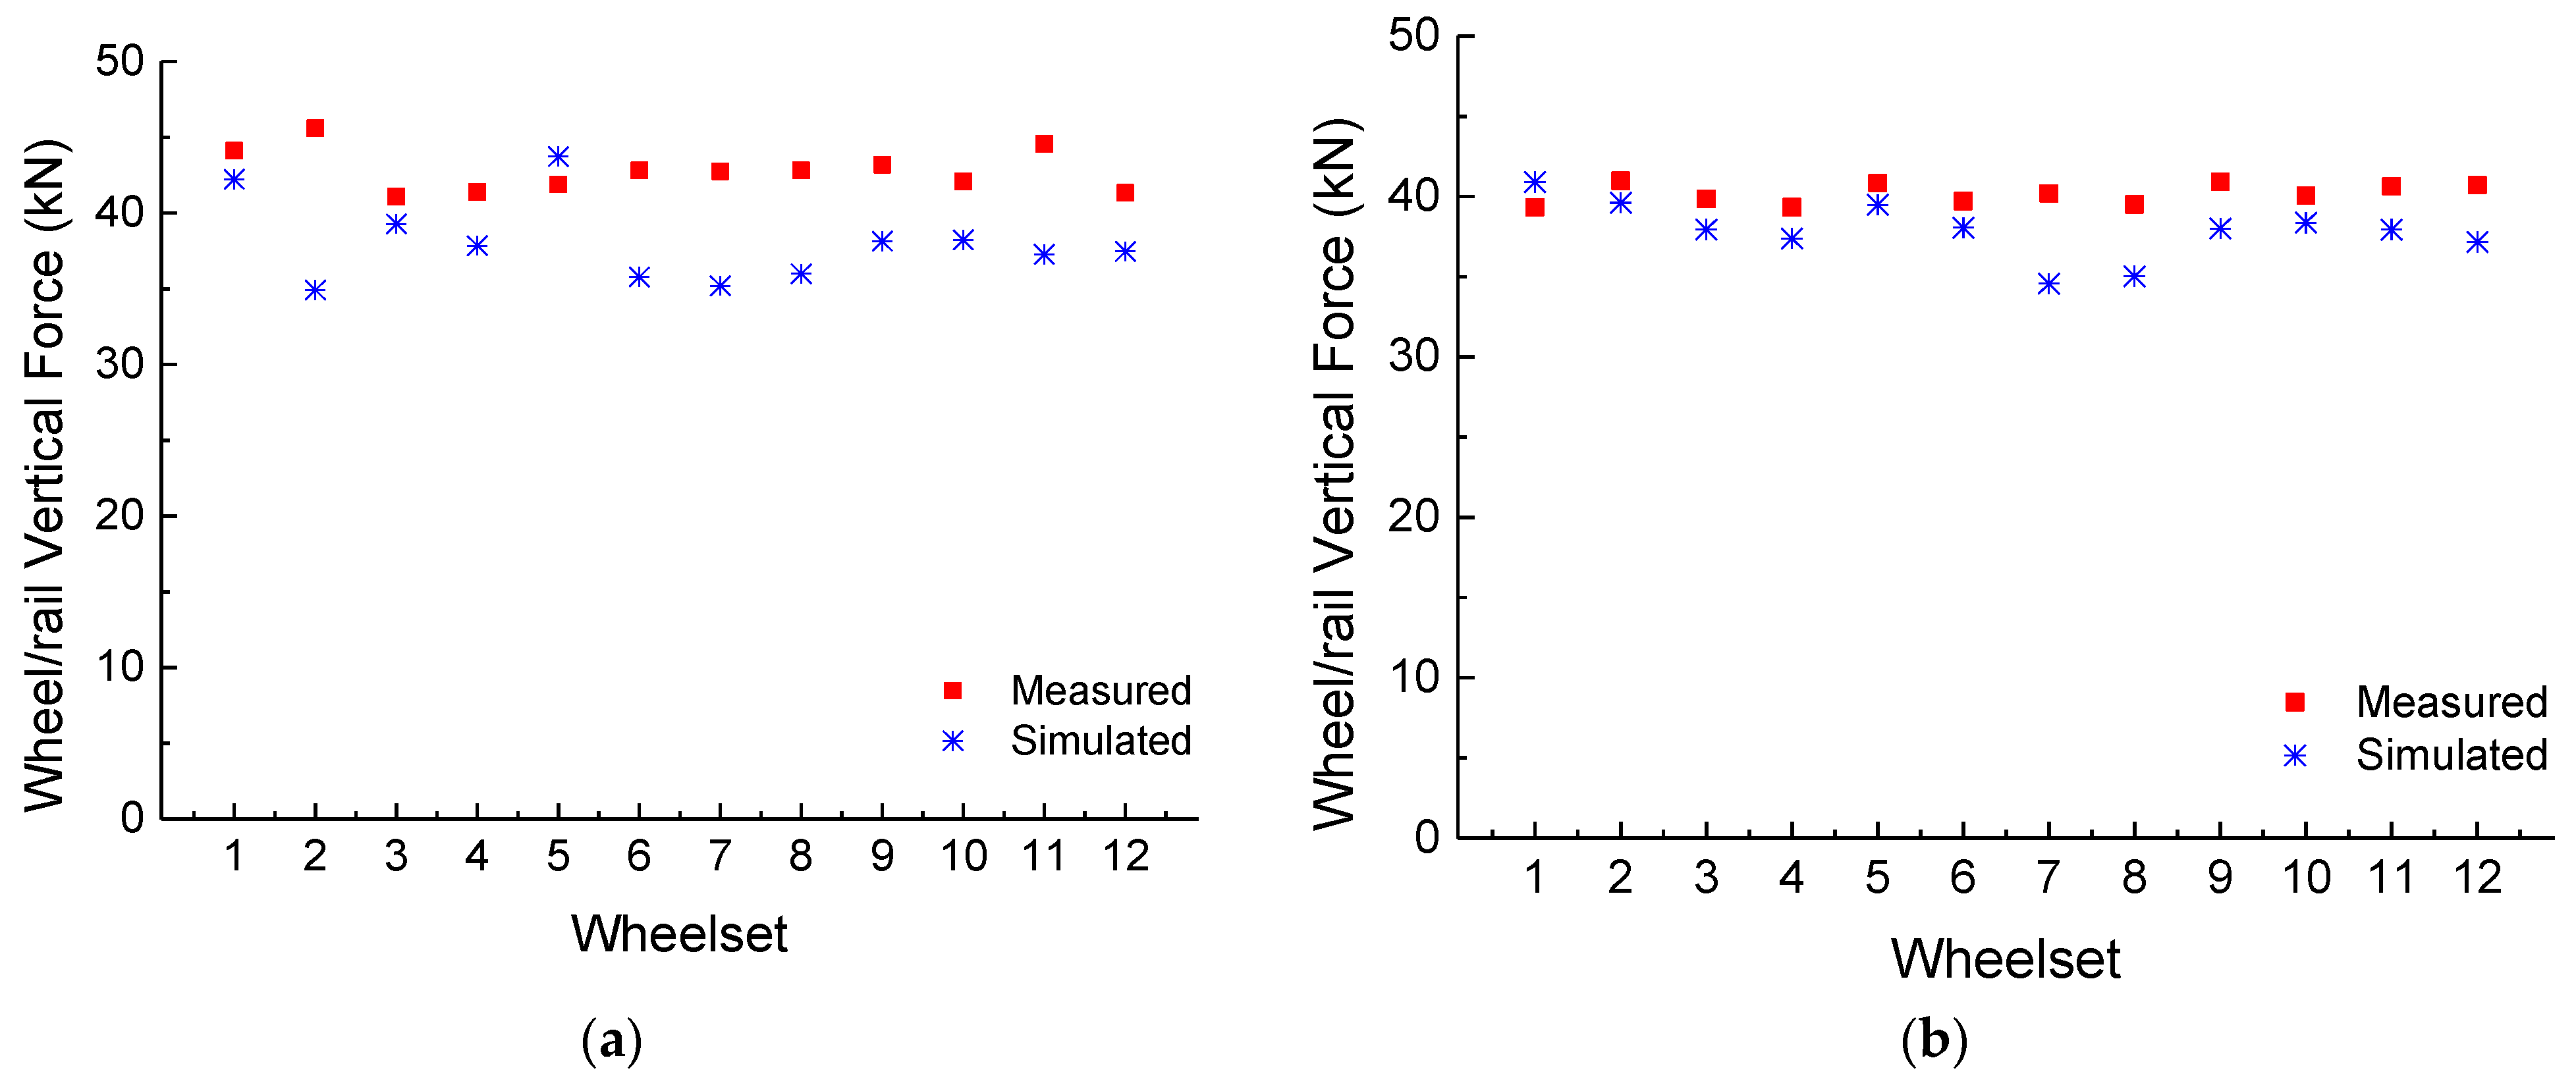
| Vertical force | 8.43 | 4.29 |
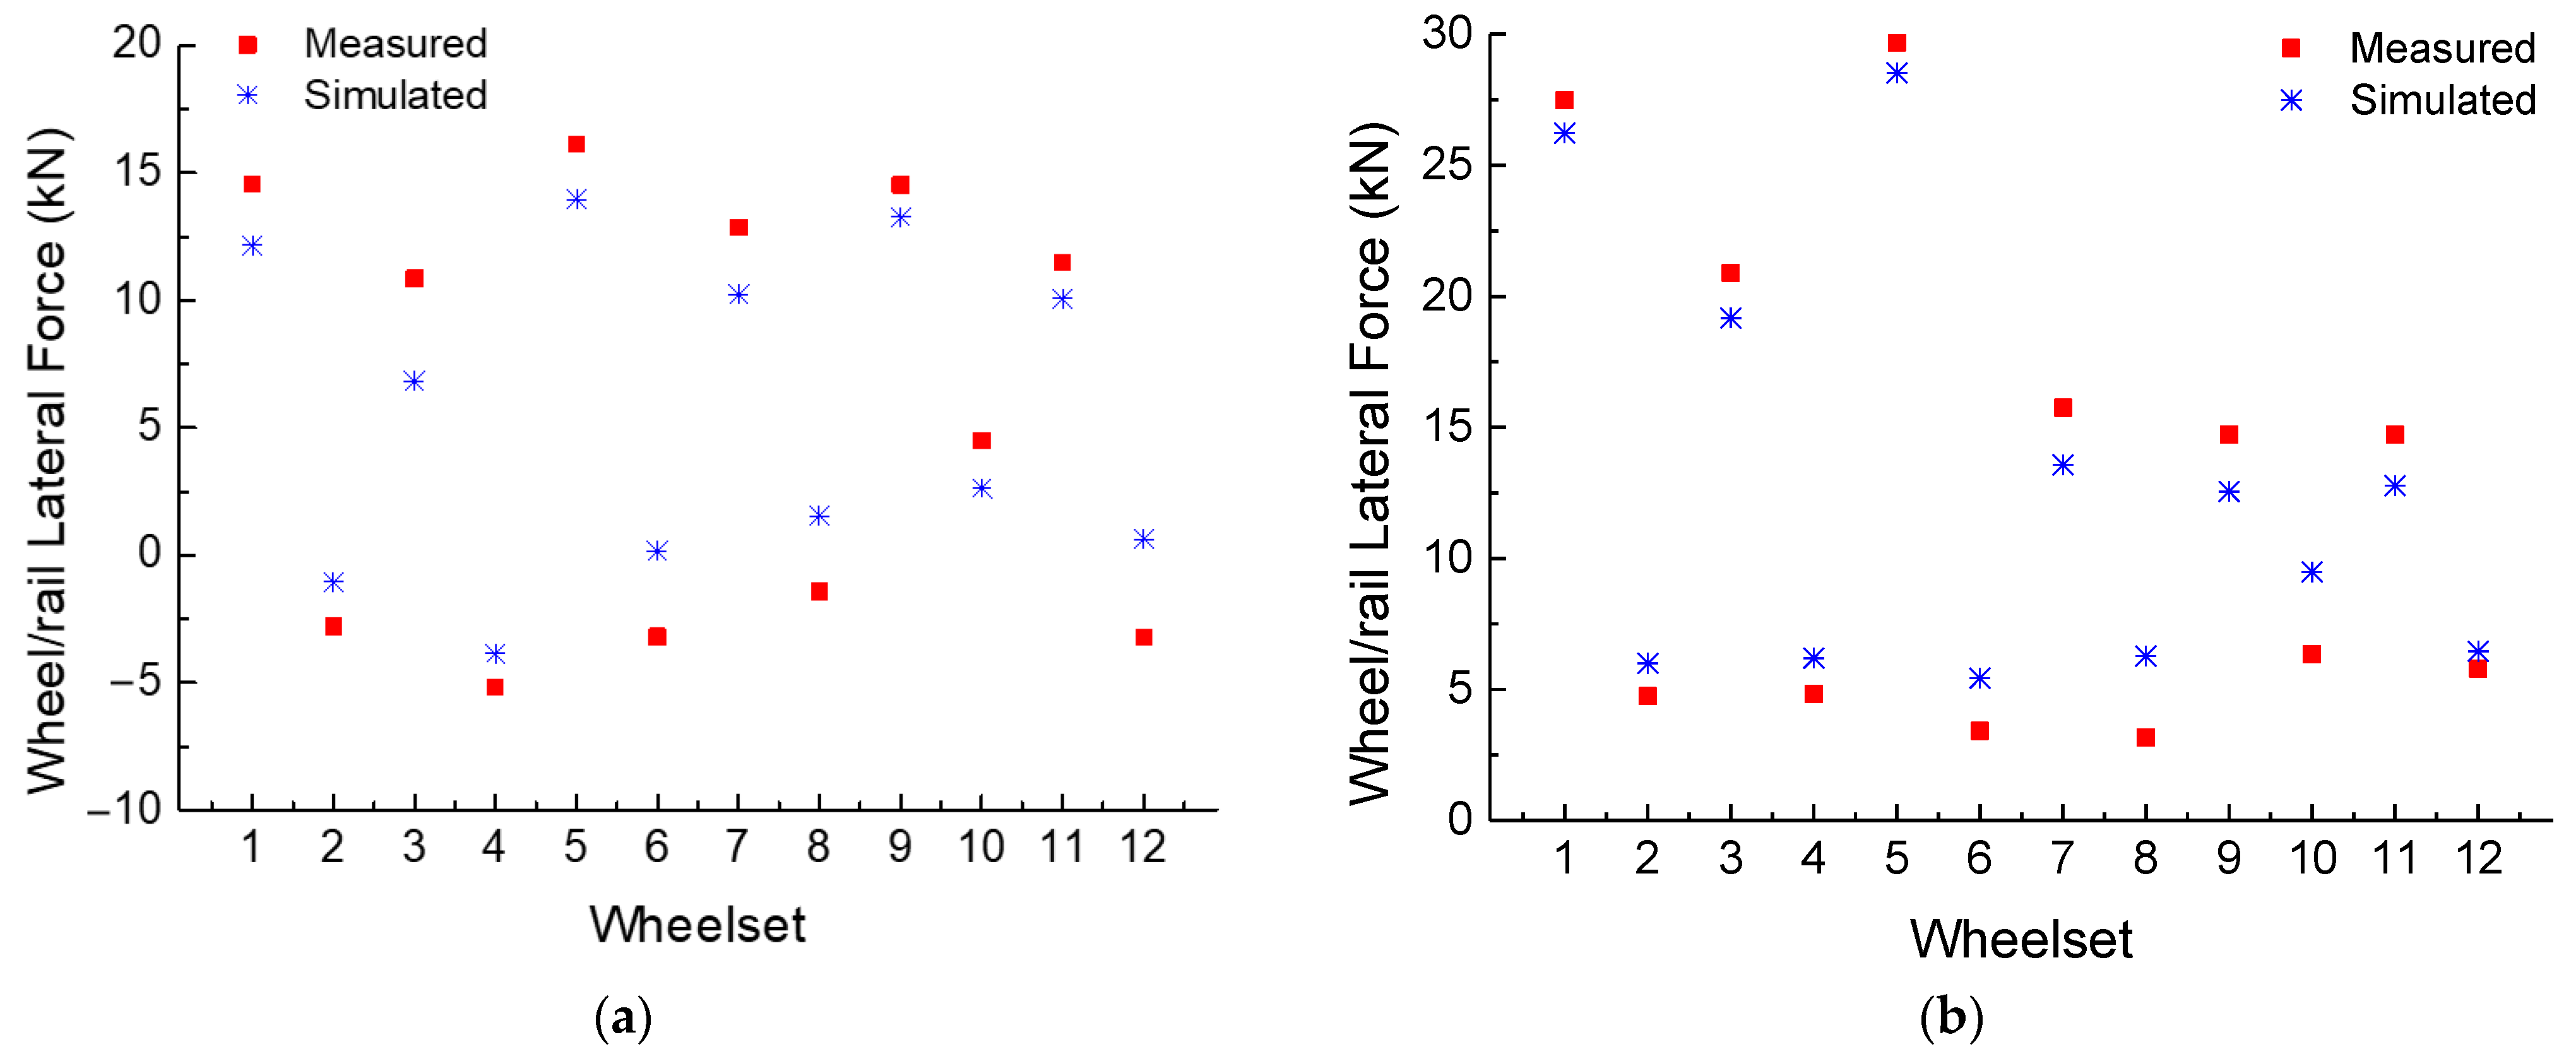
| Lateral force | 5.14 | 5.78 |
Disclaimer/Publisher’s Note: The statements, opinions and data contained in all publications are solely those of the individual author(s) and contributor(s) and not of MDPI and/or the editor(s). MDPI and/or the editor(s) disclaim responsibility for any injury to people or property resulting from any ideas, methods, instructions or products referred to in the content. |
© 2023 by the authors. Licensee MDPI, Basel, Switzerland. This article is an open access article distributed under the terms and conditions of the Creative Commons Attribution (CC BY) license (https://creativecommons.org/licenses/by/4.0/).
Share and Cite
Jia, X.; Yang, X.; Shi, G. Analysis of Dynamic Characteristics of Low-Floor Train Passing Switch in Facing Direction with Bad Alignment Irregularity Ahead of the Turnout. Appl. Sci. 2023, 13, 4560. https://doi.org/10.3390/app13074560
Jia X, Yang X, Shi G. Analysis of Dynamic Characteristics of Low-Floor Train Passing Switch in Facing Direction with Bad Alignment Irregularity Ahead of the Turnout. Applied Sciences. 2023; 13(7):4560. https://doi.org/10.3390/app13074560
Chicago/Turabian StyleJia, Xiaohong, Xinwen Yang, and Guangtian Shi. 2023. "Analysis of Dynamic Characteristics of Low-Floor Train Passing Switch in Facing Direction with Bad Alignment Irregularity Ahead of the Turnout" Applied Sciences 13, no. 7: 4560. https://doi.org/10.3390/app13074560
APA StyleJia, X., Yang, X., & Shi, G. (2023). Analysis of Dynamic Characteristics of Low-Floor Train Passing Switch in Facing Direction with Bad Alignment Irregularity Ahead of the Turnout. Applied Sciences, 13(7), 4560. https://doi.org/10.3390/app13074560