1. Introduction
The China Loess Plateau (CLP) has been a pivotal region for the Chinese government in implementing strategies for environmental protection and sustainable development [
1,
2,
3,
4]. It spans over 640,000 km
and has a population of nearly 100 million. The surface of CLP is characterized by thick loess, complex geomorphology, aridity, and low rainfall, resulting in a fragile natural ecological environment (EE). Moreover, its urbanization process lags behind the east and central regions of China, and its land resources are relatively poor and unevenly distributed, despite its abundant underground coal and other mineral resources.
Since the beginning of the 21st century, the CLP has been a primary region for the implementation of China Western Development [
5,
6]. The region is characterized by mountains, plateaus, hills, gullies, and river valley plains. China Western Development was initiated by the Chinese government in 2000 to promote sustainable and balanced economic and social development. Its major programs include the Grain for Green Project (GGP) [
7,
8,
9,
10], coal mining [
11], and urbanization [
2,
12,
13], among others.
The GGP includes two aspects: Firstly, planting trees and forests instead of cultivating sloped ground in the loess hilly-gully regions, and secondly, hill-closing and afforestation of mountainous areas to restore forest vegetation. Since 2002, CLP has invested more than 50 billion RMB in the GGP and reforested an area of 52,000 km
, with one-third of the reforestation on arable land and the rest on barren hills and wastelands, as well as hill-closing and afforestation [
14]. The growth rate of vegetation cover in CLP from 2000 to the present is much higher than the national average, resulting in significantly less sediment entering the Yellow River and reduced soil erosion, making CLP a leader in China’s greening efforts. The utilization of coal resources is the pillar industry of economic development in the CLP. Since 2000, several coal production bases have been built in the region, and annual coal production now exceeds 2 billion tons, accounting for about 1/4 of global coal production, making CLP the major coal production base in China and the world [
15]. The rapid development of four provincial capitals in the CLP’s river valley plain has been supported by the Chinese government for the past 20 years, and a large number of rural and suburban areas have been transformed into urban areas, significantly increasing the region’s development. After nearly three decades of resource development and EE construction, the CLP has become a key center for China’s chemical and energy industry, as well as an ecological barrier for the entire northern region.
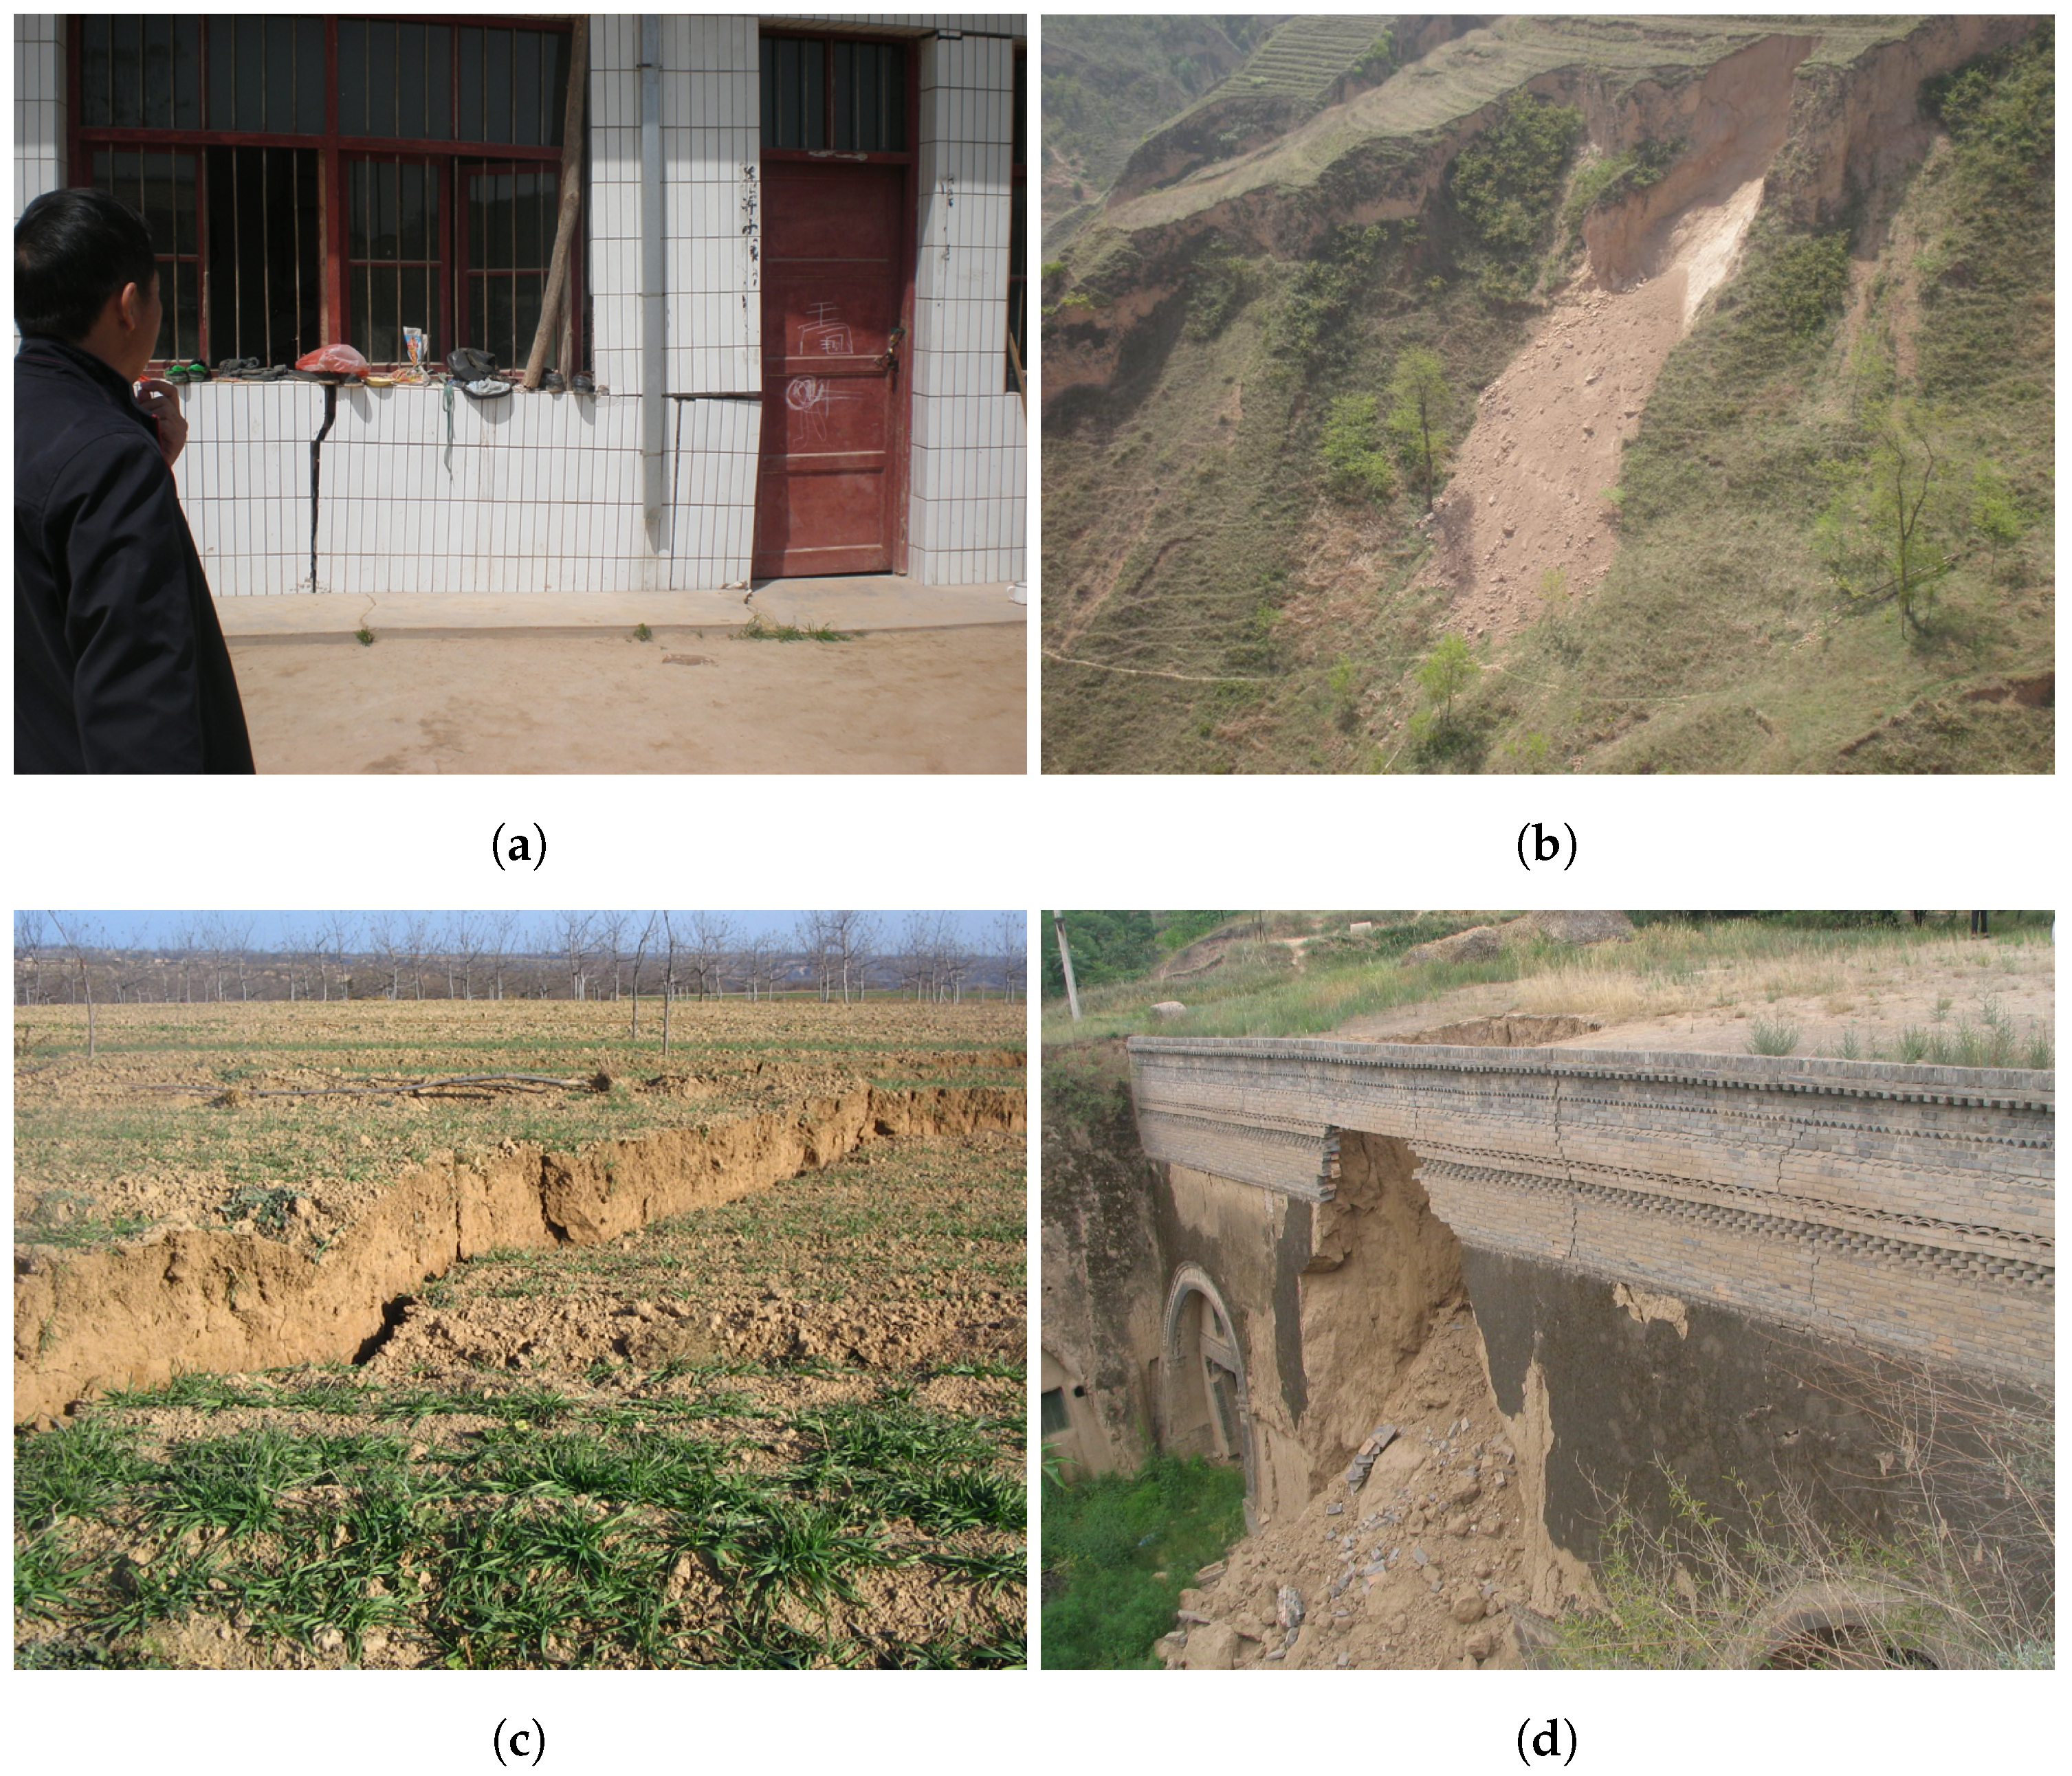
Due to the complex geomorphology and frequent human projects in CLP, it is currently poorly understood how the EE of CLP has changed over the last 20 years. GGP promotes the growth of vegetation cover and EE improvement in CLP, while coal mining damages the overlying strata, resulting in surface subsidence, collapse, and cracks, which cause EE deterioration [
16]. Urbanization has caused arable or forest land to be turned into building land, resulting in serious ecological impacts [
17,
18]. Due to the significant temporal and spatial divergence of these three human projects in the last 20 years, the EE characteristics of CLP have become complex and unknown. Previous studies on the EE of CLP have mainly focused on the impacts of geographical and meteorological factors on the EE of a certain region, while scientific and quantitative studies on the impact of human projects on the EE of CLP are still lacking [
19,
20].
Remote sensing provides new tools for evaluating EE, especially those of ecosystems that include mining areas, forests, grasslands, and urban areas [
21,
22,
23,
24,
25]. In the early stages of EE modeling, only single indicators were used [
26,
27,
28]. However, due to the complexity of EE, it is insufficient to describe them using only one index. To overcome this, Xu et al. extracted indicators of greenness, heat, dryness, and wetness, and constructed a Remote Sensing Ecological Index (RSEI) based on Principal Component Analysis (PCA) [
29]. This model has been successfully applied to different ecological scenarios [
30,
31,
32,
33]. However, EE faces challenges due to the large data size and difficulty in processing. The Google Earth Engine (GEE) can process large amounts of geospatial data and is a useful tool for large-scale and long-term ecological evaluation [
34,
35].
Currently, research on the EE evaluation of CLP remains insufficient. For example, Hou et al. evaluated the EE of the coal mining area in Datong, Shanxi Province, China by integrating RS, GIS, and field survey methods [
36]. Zhou et al. analyzed land-use and land-cover changes caused by the GGP in China’s CLP [
37,
38]. Xiang et al. constructed an urbanization index using nighttime lighting data and examined the spatial and temporal evolution of urbanization in CLP [
39]. Previous studies on EE in the CLP have primarily focused on analyzing the impact of individual factors on a specific region or the entire region. However, there has been limited research examining the impact of multiple factors on EE. Given the diverse landforms of the Loess Plateau, which includes numerous mining and urban regions, it is important to select representative areas for detailed analysis, especially in light of the GGP.
Due to the variability of CLP’s geomorphology, the ecological impact of GGP varies significantly in different geomorphological units. For example, hilly and gully regions are generally where GGP is implemented, while river valley plain regions are mostly urbanization expansion regions, and coal mining affects the variation of EE in nearby regions. In this study, we comprehensively analyzed the temporal and spatial characteristics of ecological environment (EE) changes in typical regions of the China Loess Plateau (CLP) from 2002 to 2022. We used MODIS time-series images and the Remote Sensing Ecological Index (RSEI) constructed through principal component analysis (PCA) to analyze the temporal characteristics of EE changes. Additionally, we evaluated the spatial characteristics of EE variations in the entire study area and investigated the impacts of coal mining and urbanization on EE in sample regions such as the Dafosi mine and the Guanzhong Plain urban agglomeration in CLP. Based on the long RSEI time series, we predicted the EE evolution trend. Finally, to verify the conclusions made in this paper, we introduced Geodetector to perform an attribution analysis of the factors resulting in EE evolution in CLP.
In summary, the authors studied the temporal–spatial variation of EE in the study area since 2002 under the influence of GGP, coal mining, and urbanization. The results support the achievement of green and sustainable development in the relatively underdeveloped region in northwestern China.
3. Methods
3.1. RSEI
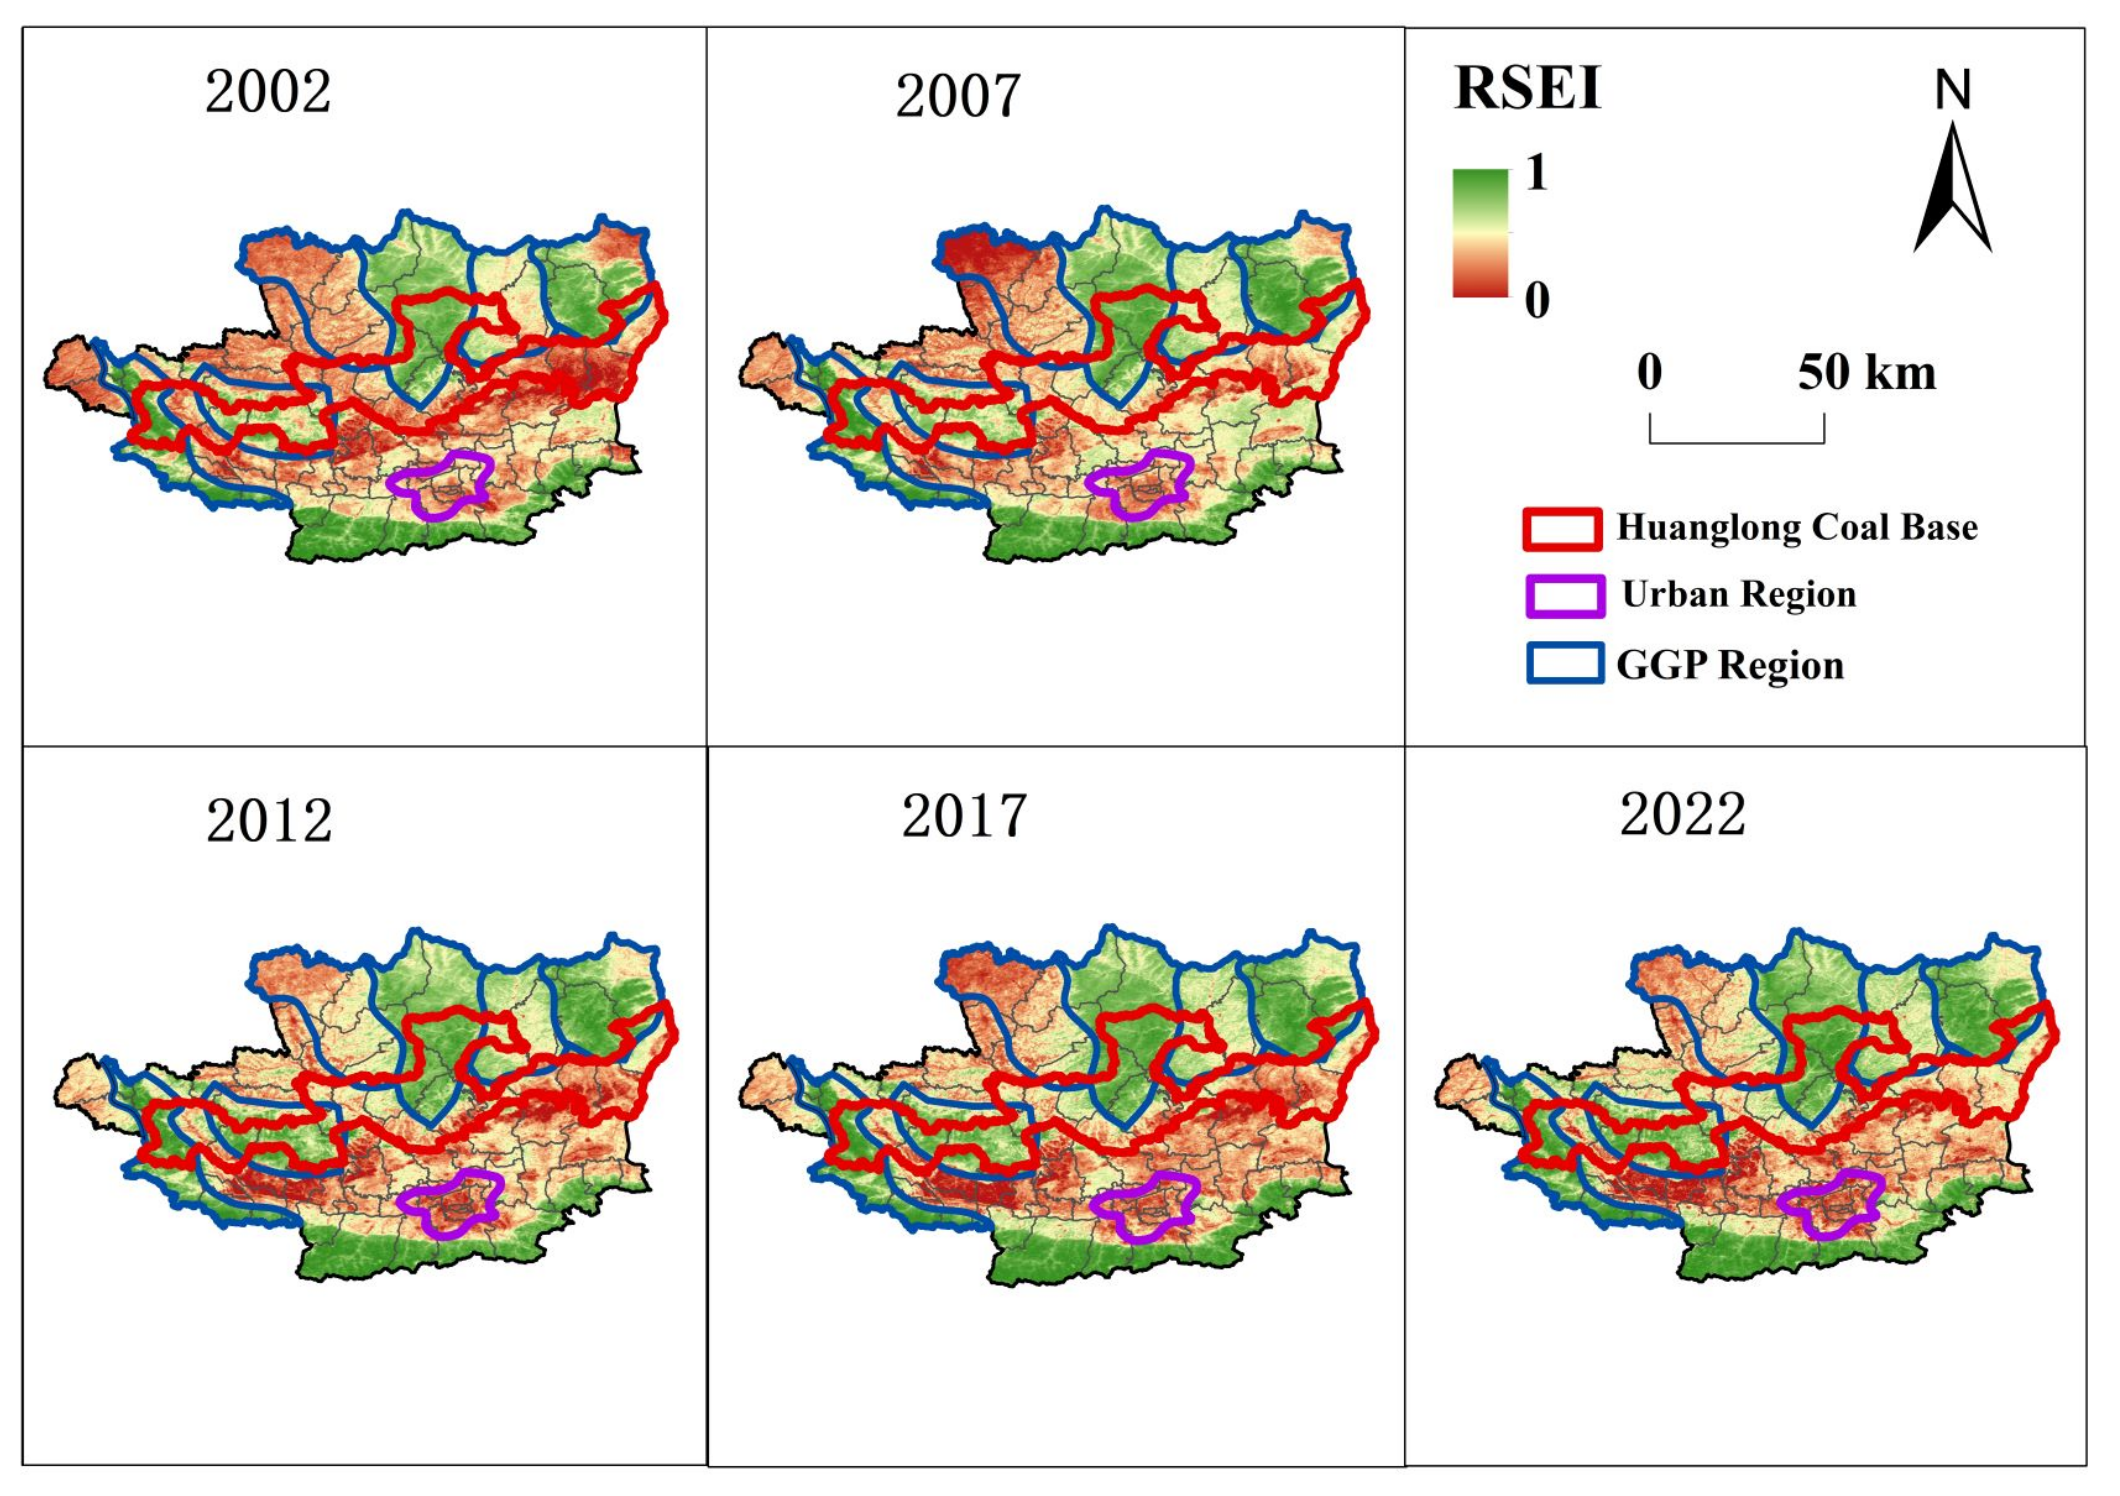
Using MODIS remote sensing data to describe the EE level [
22], the RSEI takes a value ranging from 0 to 1, where a low value indicates a poor ecological condition, a high value represents a good ecological condition, and a value of 1 signifies a perfect ecological condition. MODIS remote sensing data collected between June and October in 2002, 2007, 2012, 2017, and 2022 were used to calculate the RSEI. The four indicators utilized in the RSEI are greenness (NDVI for vegetation), wetness (WET for soil wetness), heat (LST for temperature), and dryness (NDBSI for floor area). By coupling and integrating the four indicators and using the PCA, the weights of each indicator are automatically determined, avoiding any interference from human-determined weights. Then, the first principal component (PC1) is obtained, and the RSEI assessment model is constructed. The RSEI is expressed as:
Greenness can be calculated by:
where
and
are the near-infrared (NIR1) and red bands of the MODIS 8-day reflectance image (MOD09A1), respectively.
Wetness is calculated using the following equation [
45]:
Here, B1 to B7 represent bands 1 to 7, namely, red, NIR1, blue, green, NIR2, shortwave infrared 1 (SWIR1), and SWIR2 bands of the MODIS images, respectively.
Heat is expressed as:
where
represents the grayscale value of the surface temperature.
Dryness is expressed as follows:
The Building Index (IBI) and Bare Soil Index (SI) can be calculated as follows:
where
,
,
,
,
represent the reflectance in the
blue,
green,
red, the near-infrared and short-infrared bands1, respectively.
PCA: Since the four indicators have non-uniform magnitudes, calculating the PCA directly would result in unbalanced weights for each indicator. Therefore, before conducting PCA, these indicators should be normalized first, and their magnitudes should be unified to the range
using the following equation:
where
is the normalized indicator value,
is the indicator value in quadrant
i,
is the maximum indicator value, and
is the minimum indicator value.
After normalization, PC1 can be calculated using the four indicators. In order to ensure that a larger PC1 value represents a better condition, PC1 is subtracted by 1 to obtain the initial ecological indicator
. The calculation is as follows:
Because PC1 usually explains more than 80% of the total variation in the dataset, it is used to calculate the RSEI, then the bias due to subjective weighting during the calculation is avoided. The RSEI calculation results for each indicator for 2002, 2007, 2012, 2017, and 2022 are shown in
Table 2.
The ecological quality of the study area is classified into five levels based on the normalized RSEI values: Level 1 (0–0.2) representing poor ecological quality, level 2 (0.2–0.4) representing fair ecological quality, level 3 (0.4–0.6) representing moderate ecological quality, level 4 (0.6–0.8) representing good ecological quality, and level 5 (0.8–1) representing excellent ecological quality.
Table 3 presents the ecological quality classes and the corresponding area changes in the study area for different years.
3.2. Change Vector Analysis (CVA)
The method assumes that the images at two different time phases can be represented as vectors
and
, respectively. It quantifies the degree of change by calculating the difference vector between
and
. A threshold value is then used to filter out regions where changes occur between the two phases [
22].
where
n denotes the indicator number or the RSEI levels. The transformation vector is determined by the following equation.
The magnitude of the change
can be calculated using Equation (
13). The greater the
, the greater the likelihood that the RSEI in the region will change.
To identify changes in the metrics, a multi-threshold approach is employed:
In this equation, represents the average of the transformed vector for the jth term, is the standard deviation of , and is an adjustable coefficient with a value range of .
3.3. Spatial Auto-Correlation
The Global Moran’s index is used to analyze the global spatial correlation of EE, while the local Moran’s index is employed to analyze the local spatial aggregation characteristic. These indices can be calculated using the following equations [
46,
47,
48]:
The deviation of the RSEI value at spatial cell
i from its mean value, denoted as
, is used in the formula, where
is the mean value of the RSEI. The spatial weight matrix is represented by
,
n is the total number of elements, and
represents the aggregation of all spatial weights.
The Moran index I ranges from −1 to 1, and a higher absolute value indicates a stronger spatial autocorrelation. A positive I value implies a positive correlation, while a negative value implies a negative correlation. An I value of 0 indicates no spatial correlation. The local Moran index, calculated using the Local Indicators of Spatial Association (LISA), is used to assess the degree of local spatial correlation. LISA plots are categorized into five groups: Insignificant, high–high (HH), low–low (LL), low–high (LH), and high–low (HL).
3.4. RSEI Transfer Matrix
In order to accurately depict the variation of RSEI levels over time, area, and location, a transfer matrix is utilized to describe the changes in the amount of EE on a temporal scale and the changes in location on a spatial scale [
49]. The RSEI transfer matrix is constructed by overlaying RSEI values from different time periods, and can be expressed as:
The RSEI levels at the beginning and end of the study are denoted by i and j (), respectively. The area where the ith RSEI level at the beginning of the study is transferred to the jth RSEI level at the end of the study period is represented by .
3.5. Geodetector-Based Driving Force Analysis
The present study employs the Geodetector to undertake the analysis of driving forces and quantitative attribution of EE, where the factor detector is utilized. Within the factor detector, the q value is introduced as a metric to indicate the explanatory ability of different factors on the degree of spatial differentiation of the dependent variable. The
q value is bound within the range
, where a larger value indicates a more influential factor.
where
refers to the sum of squares within the strata, while
represents the total sum of squares of RSEI in the study area. The variable
i denotes the stratification of each influencing factor, where
i takes values from 1 to k. Moreover,
N and
refer to the sample sizes of the entire study area and each stratum
i, respectively. Lastly,
and
denote the variances of the whole study area and each stratum
i, respectively.
3.6. EE Trend Analysis
R/S analysis, also known as rescaled range analysis, is a statistical test applied to a time series [
50]. The R/S analysis utilizes the least squares method, and the slope of the regression line equation represents the Hurst exponent (
H). The Hurst exponent is linearly fitted using the least squares method, and relevant conclusions are drawn based on the results. The Hurst index can be used to analyze a set of time-series data, which change randomly with time. In this study, we utilize the Hurst index to monitor the variation of RSEI [
51].
The basic principle of R/S analysis: For a time series , where is the total number of subseries in the time series .
The Hurst index
H is defined based on the asymptotic behavior of the rescaled extreme difference range as a function of the time span of the time series.
where
denotes the rescaled extreme deviation range,
C is a constant,
n is the series length, and
H is the Hurst index with a value domain of
. In this study, we selected RSEI data from 2002–2022 for Hurst index analysis. When
, the time series are completely independent; when
, the future change is opposite to the past, and the closer
H is to 0.0, the stronger the inverse persistence; when
, the future change is consistent with the past change, and the closer
H is to 1.0, the stronger the persistence.
3.7. Technical Pathway and Workflow
This paper comprises two parts. The first part involves the analysis of temporal variations in the EE in typical regions of CLP from 2002 to 2022, while the second part concerns the analysis of the spatial characteristics of the EE in these regions. To calculate NDVI, WET, NDBSI, and LST, MODIS data was utilized with the aid of GEE. After normalizing the four indicators to values between 0 and 1, the RSEI was computed using PCA. With RSEI serving as a measure of the EE, the study followed the analytical framework outlined below as
Figure 3:
On the temporal scale, the changes in EE in the study area since 2002 were evaluated. Specifically, the years 2002, 2007, 2012, 2017, and 2022 were chosen, and the EE was divided into five levels, with the area of each level counted. The change in EE between two years was obtained by CVA. Additionally, the trend analysis method was employed using the long RSEI time series results from 2002–2022 to obtain the slope index, and the Hurst index was used to analyze the trends in EE.
Three typical regions (the coal mining region, the urban region, and the GGP region) were chosen for the local spatial change analysis of the EE. The global spatial change characteristics of the EE in the whole study area were analyzed by the Moran index, Lisa clustering, and transfer matrix. Geodetector was introduced to analyze and verify the study results.
5. Discussion
5.1. Validation Based on Geodetector
In this study, it was concluded that the GGP has a major influence on the EE, while urbanization and coal mining have limited influence. It is known that meteorological factors usually have a significant impact on the EE, with temperature and precipitation having a direct correlation with plant growth, and vegetation can promote EE improvement. To verify whether the GGP has the greatest driving force on the EE, we added temperature and precipitation as dependent variables, all five driving factors we selected can be found in
Table 5 And the results are shown in
Figure 17. The curves of RSEI and each driving factor with time are shown in
Figure 18.
In the study area from June to October, X1 represents the average annual temperature, and X2 represents the average annual precipitation. The three types of human projects are represented by the X3 afforestation area, X4 annual coal production, and X5 GDP per capita, respectively. The results show that the factor with the greatest driving force on the EE is the Chinese government’s policy of GGP with a q value of 0.881, and the factor with the least driving force on the EE is the coal production in recent years with a q value of 0.617. Temperature and GDP per capita also significantly influence EE. Based on these findings, it can be concluded that GGP has the most significant impact on improving the EE of CLP.
5.2. Trend Analysis of Ecological Changes in the Study Area
The trends of EE from 2002 to 2022 were analyzed statistically at the pixel scale. The geomorphological maps of the study area were then superimposed according to
(indicating that the trend of EE is the same as in the past) and
(indicating that the trend of EE is opposite to the past) after combining the slope index and significance test. This was performed to determine the spatial distribution of the Hurst index of different EE from 2002 to 2022, see
Figure 19. To predict the EE trend, the slope index and Hurst index were combined, and the results are shown in
Figure 20.
According to the trend analysis graph, the majority of the area has a Hurst index of less than 0.5, indicating that most regions in the study area have an opposite trend of ecological change in the future compared to the past. The detail can be found in
Table 6. The highest percentage of the region is moving from the state of past ecological improvement to the state of future ecological degradation, accounting for 51.94%. The area of regions with continuous improvement and the region from a past degradation state to possible future improvement state were 19% and 20.87%, respectively. From a geomorphological aspect, the EE of the river valley plain region still has potential for future improvement due to recent urbanization, while the vegetation cover of the loess hilly-gully region has already reached saturation and will enter the ecological succession stage in the future.
5.3. Comprehensive Analysis and Research Limitation
The spatial variation of EE quality in the typical CLP region generally agrees with the NDVI and WET indicators. The initial implementation of the GGP from 1999 to 2005 led to changes in vegetation types, but did not provide sufficient ecological benefits for soil water retention. However, due to the lagging effect of the GGP, vegetation cover in the typical CLP region increased and the EE quality significantly improved by around 2010.
Large-scale underground coal mining activities take place every year in the Huanglong coal base, causing significant subsidence on the surface. The groundwater level in the mining region and surrounding buffer zone has dropped significantly, and soil nutrients have been lost, resulting in the destruction of the levelness and water storage functions of arable land, causing farmers to abandon farming and impairing vegetation growth or causing it to die. According to statistics, the subsidence regions in the Huanglong coal base are not continuously distributed, and the area of subsidence regions formed by mining in each mine each year generally does not exceed 5 km. Therefore, the impact of coal mining activities on the EE is small in area and spatially discontinuous. It should be noted that with the Chinese government’s increasingly stringent requirements for environmental protection in mining areas, coal mining enterprises have begun to carry out land remediation and ecological restoration in subsidence regions since 2015. Additionally, the recovery effect of rising temperatures and increased rainfall on the EE of subsidence regions has helped to mitigate the damage caused by coal mining activities, so the scope of the EE damage caused by coal mining activities is relatively small.
Since 2000, the Chinese government has proposed the China Western Development initiative, which has increased support for the Guanzhong district. The excessive economic development and population growth coincided with an increase in construction areas, leading to the occupation of nearby arable land and the expansion of industrial activities, increasing environmental pressures. The urbanization process has accelerated due to the creation of economic and high-tech zones, and the rapid growth of GDP per capita reflects the significant development achieved in the last two decades. The river valley plain area, with Xi’an as its central city, has experienced significant ecological degradation due to rapid urbanization, becoming the economic development center in western China. As a result, construction land and roads have expanded into grasslands and arable land. In 2012, the government proposed a strategy to promote ecological civilization, placing increasing emphasis on developing eco-cities [
56]. The number of green belts and urban parks within the city has increased, contributing to the removal of urbanization’s harmful effects on the local ecology [
57].
Regarding landform, the EE of the loess hilly-gully region in the Loess Plateau mining area improved the most. Although coal mining has an impact on the nearby region, the GGP greatly improved the EE of the loess hilly-gully region, which entered the ecological succession stage at around 2020. Conversely, urban development led to EE deterioration in the river valley plain region, but thanks to the local government’s urban environmental protection policies, published roughly in 2020, the EE of the river valley plain region has gradually improved and will continue to do so in the future.
It should be noted that this study mainly used RSEI to evaluate the EE quality in the typical region of CLP, which still has some limitations in terms of evaluation indices and data reliability. The study utilized MODIS remote sensing data with a spatial resolution of 500 m, and higher resolution remote sensing images will be utilized for future studies. Additionally, for EE prediction, the trend prediction will be changed to predicting the time period in the future to make the prediction more accurate.


 ,
, 


