
Gloss-Bridge: A Method to Reduce the Visual Perception Gap between Real-World Glossiness and PBR Reflectance Properties in Virtual Reality


Abstract
:1. Introduction
2. Experiment 1
2.1. Methodology
2.1.1. Participants
2.1.2. Appliances
2.1.3. Stimuli
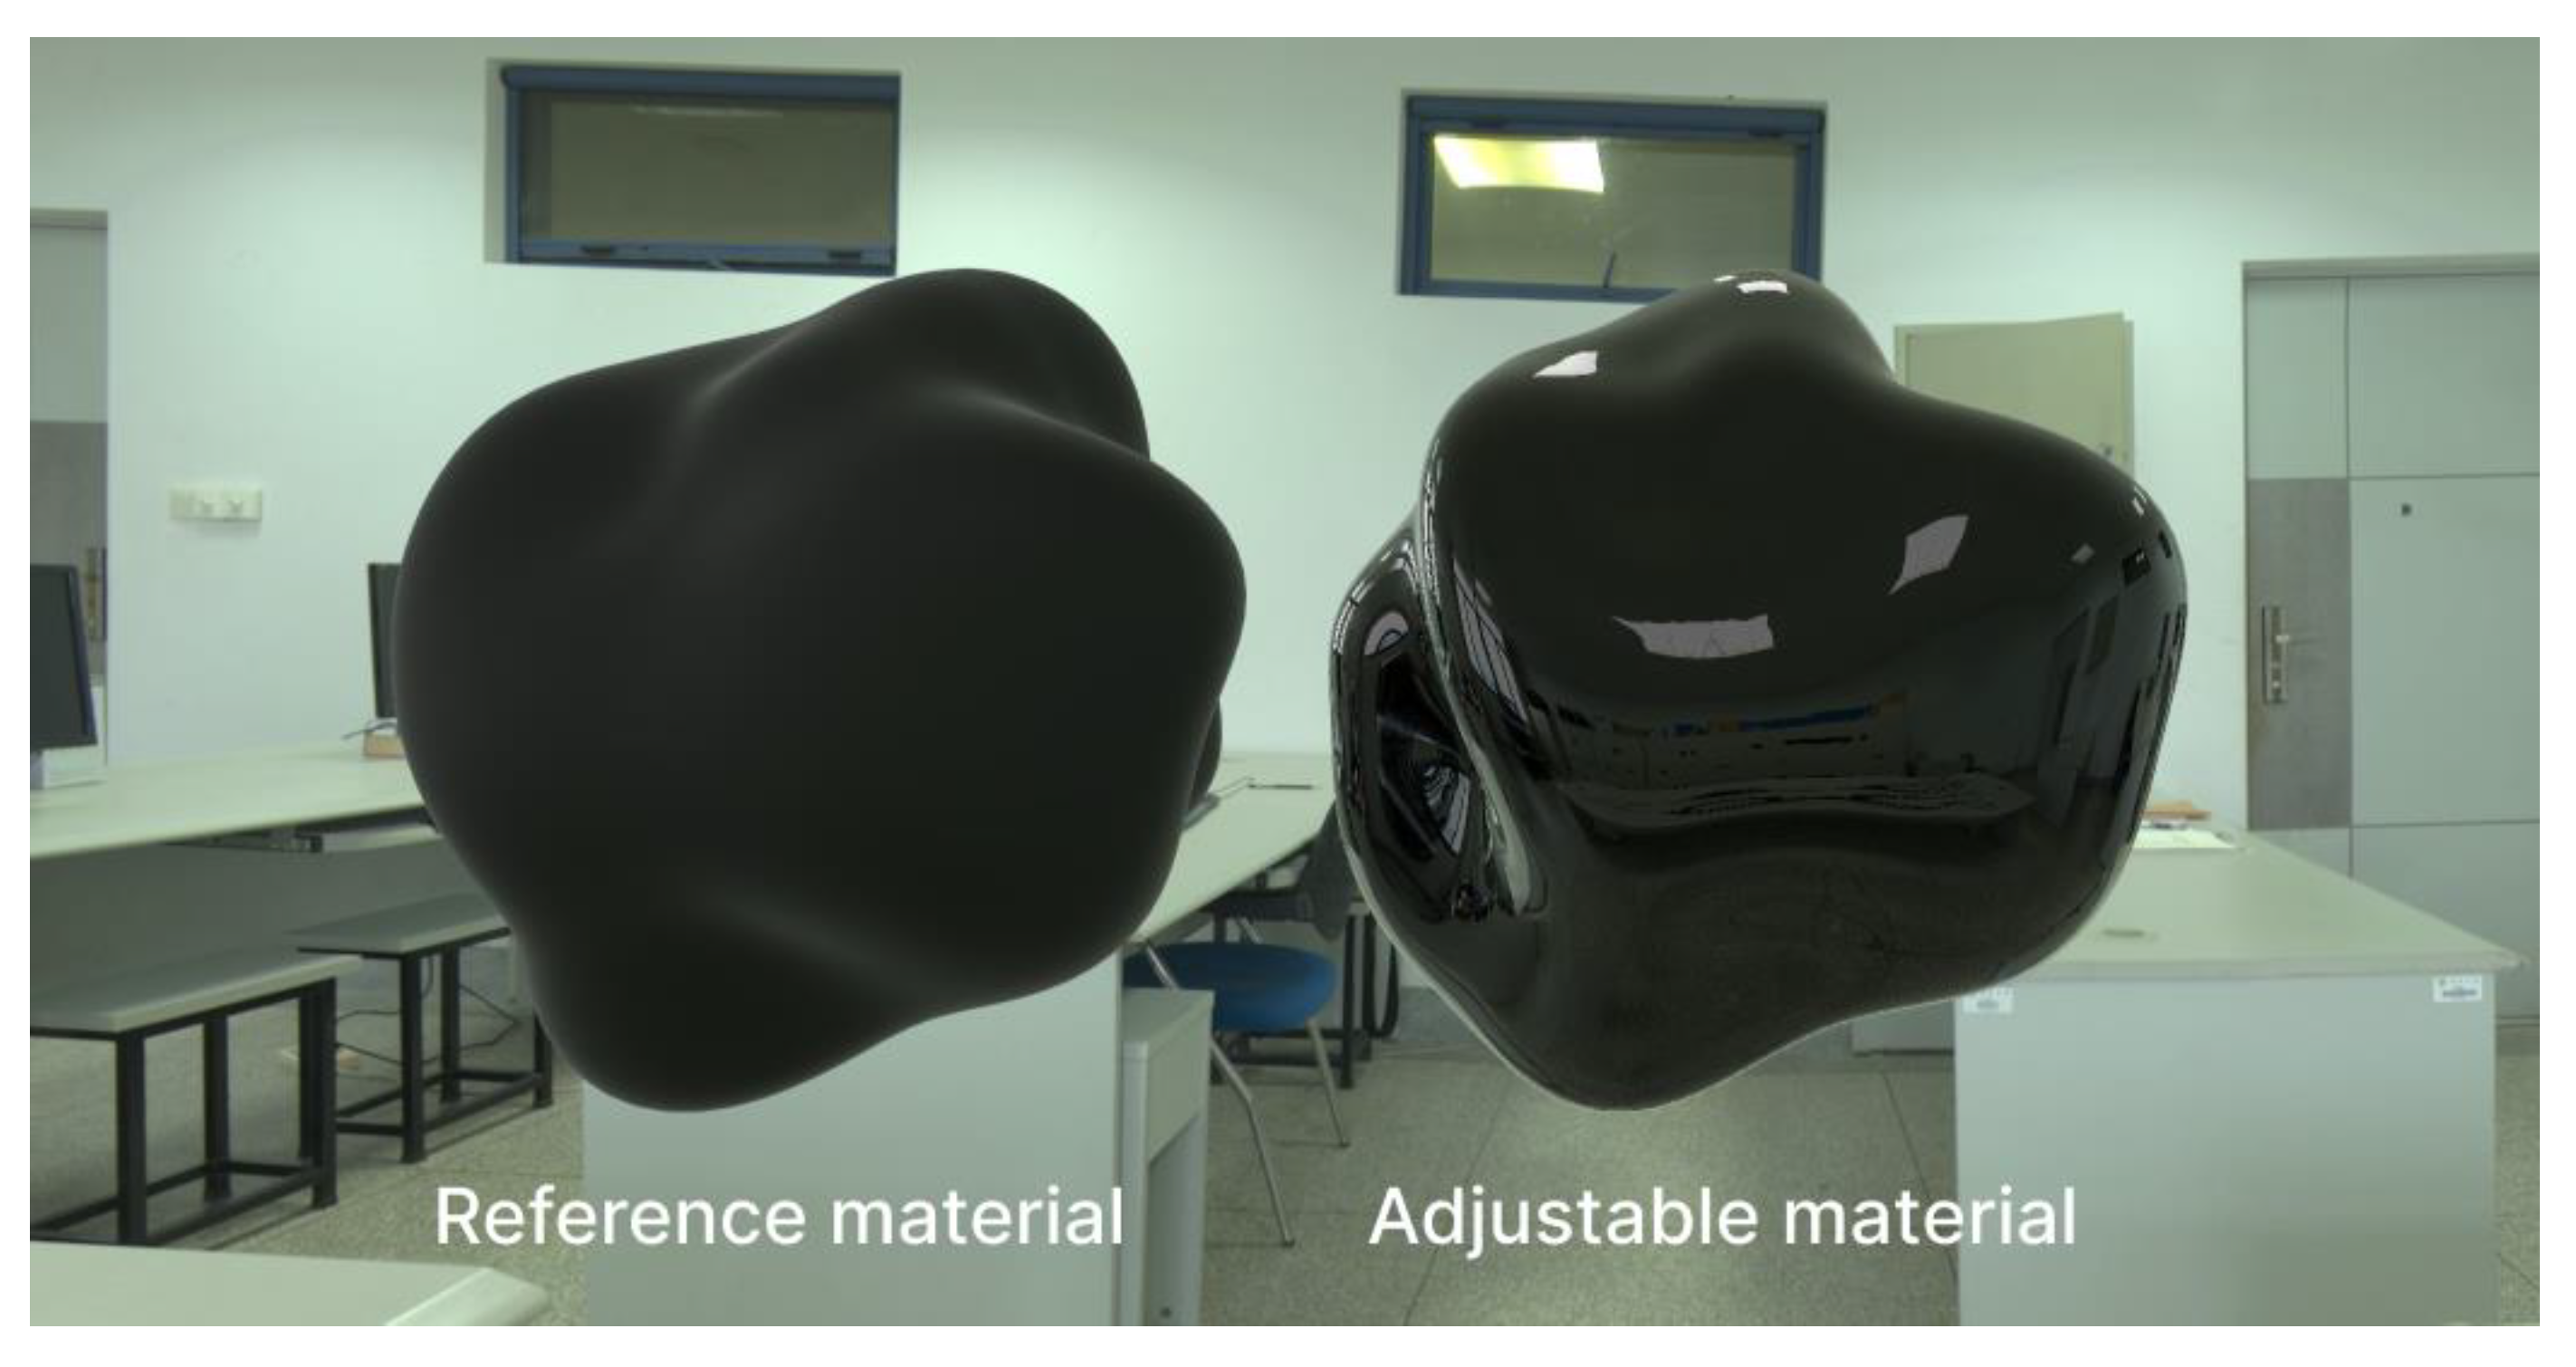
2.1.4. Procedural
2.2. Results and Discussion
2.2.1. MLDS Analysis
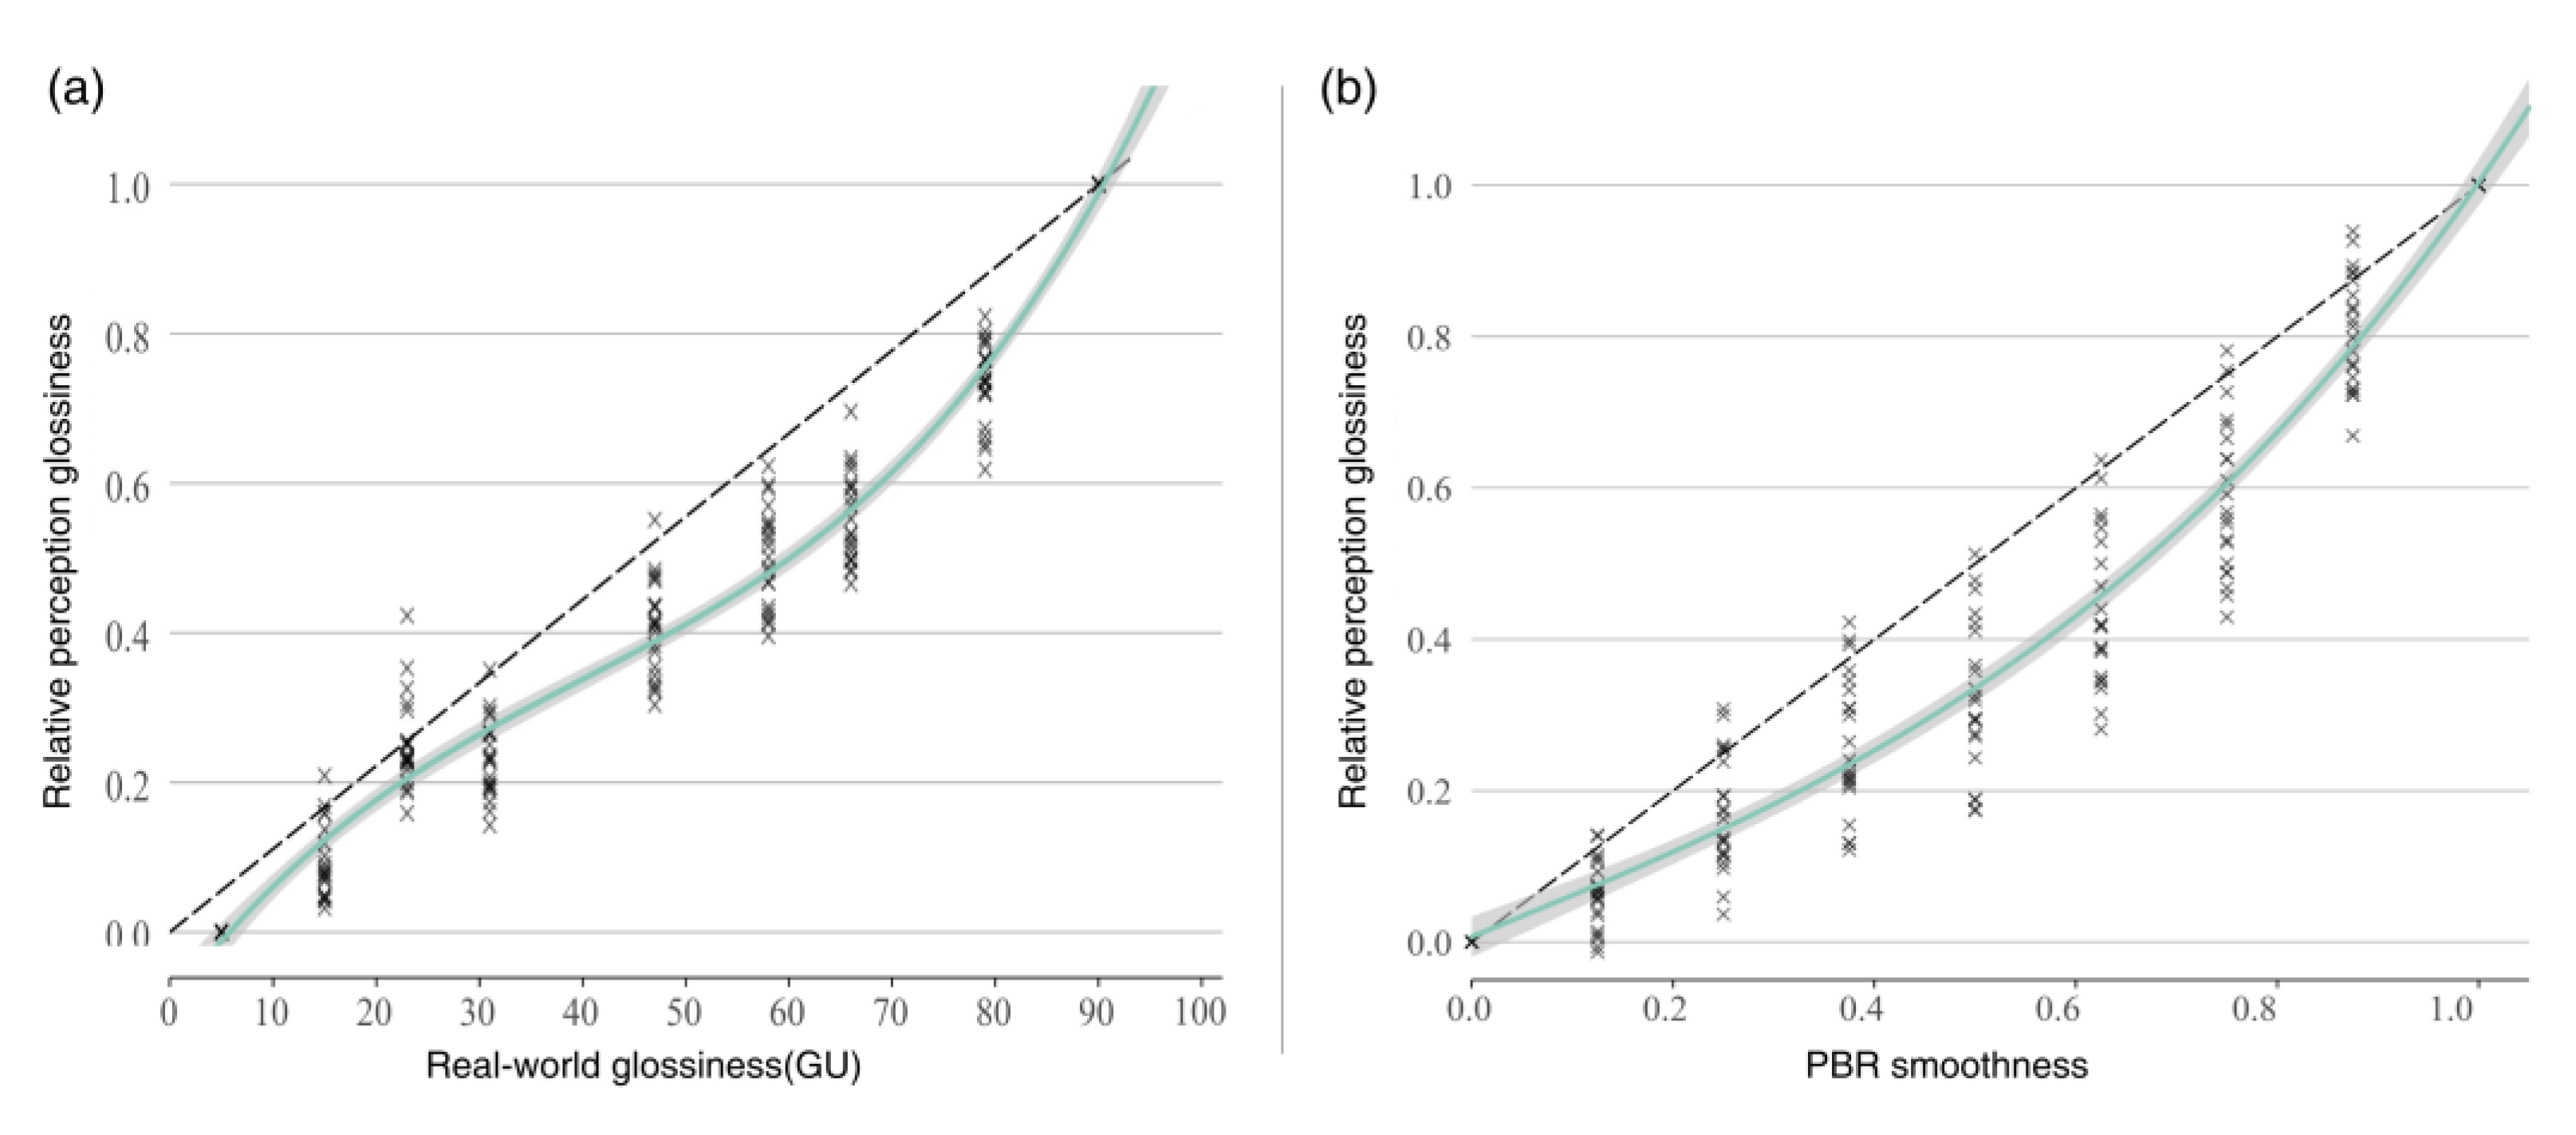
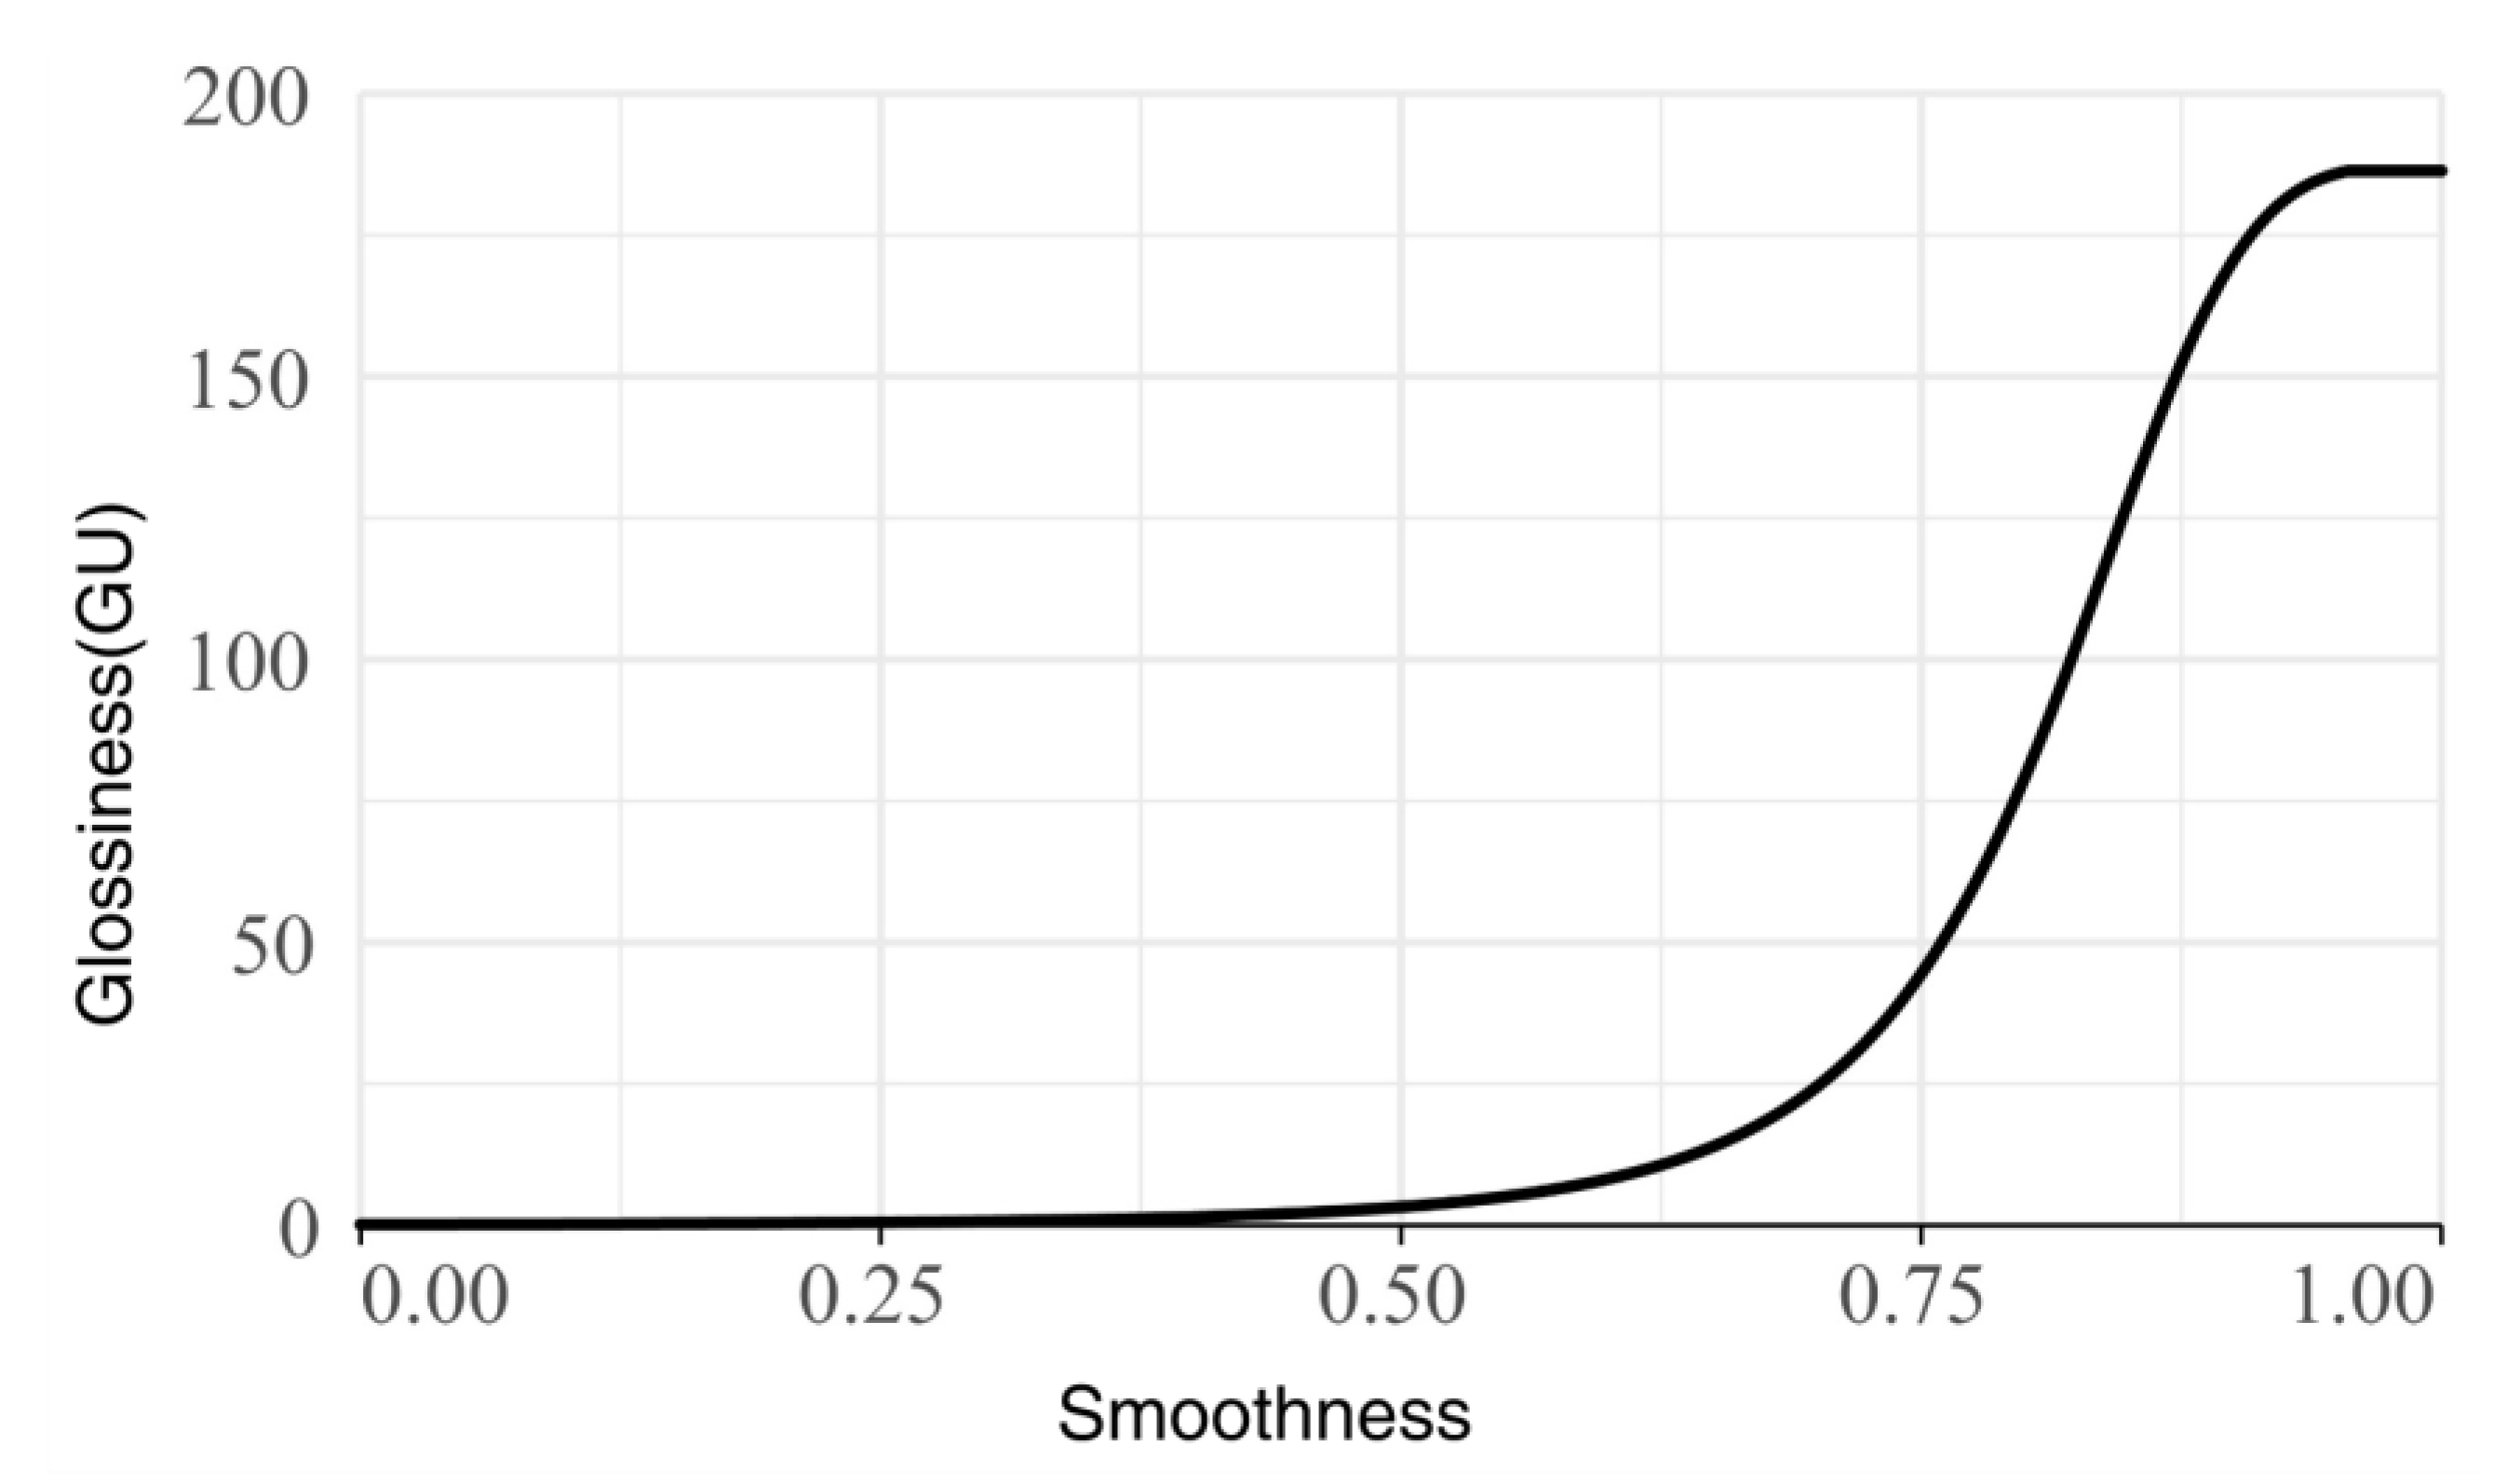
2.2.2. Psychological Scale Fitting
3. Experiment 2
3.1. Methodology
3.1.1. Participants
3.1.2. Appliances
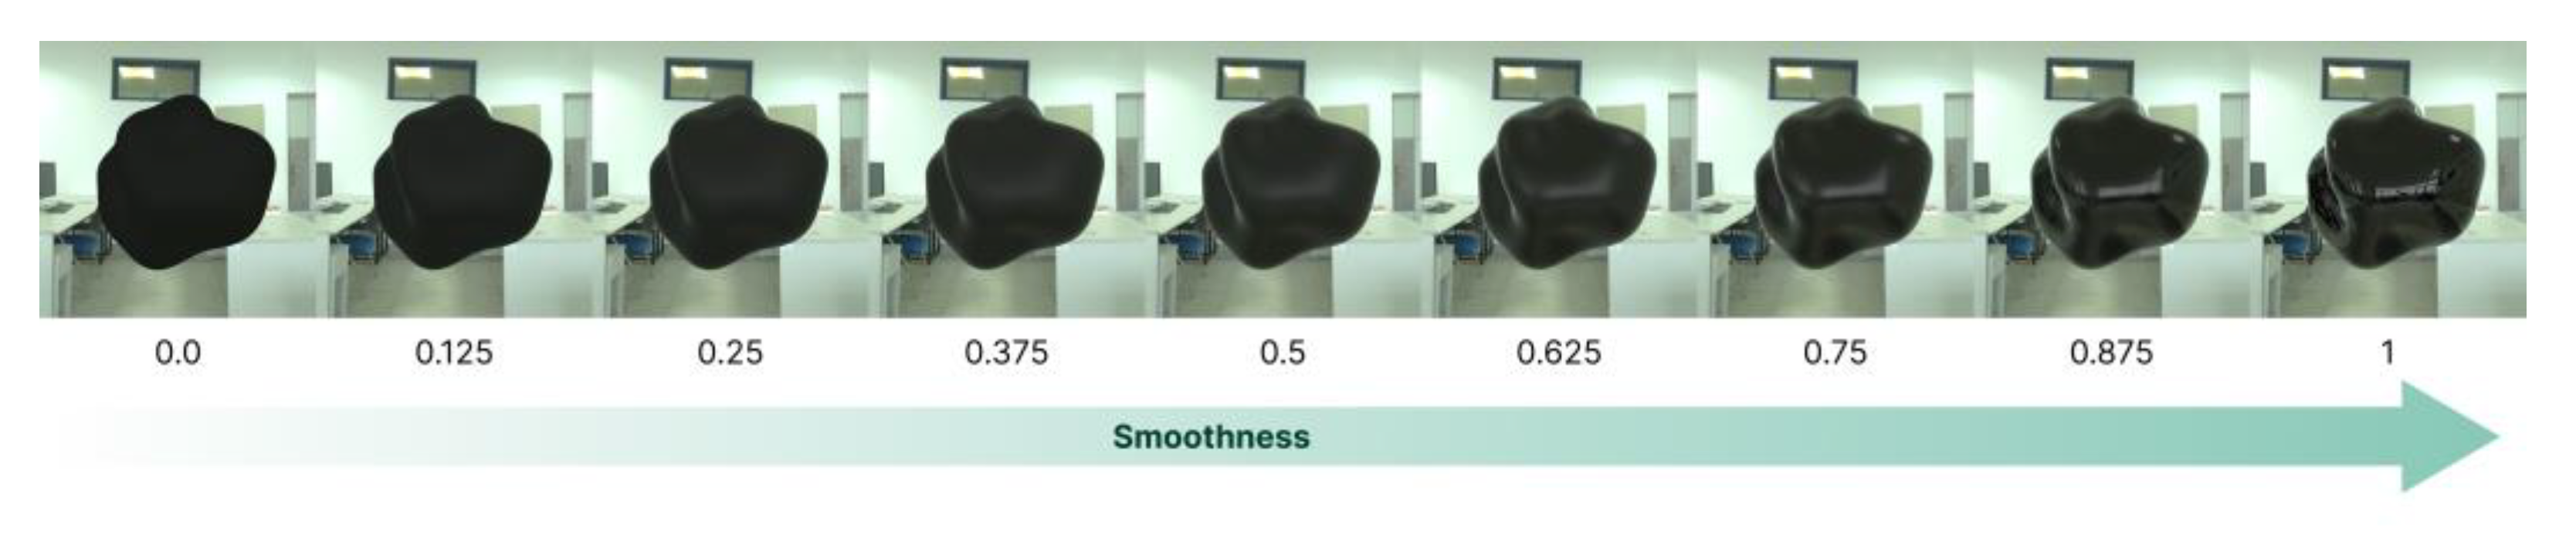
3.1.3. Stimuli
3.1.4. Procedural
3.2. Results and Discussion
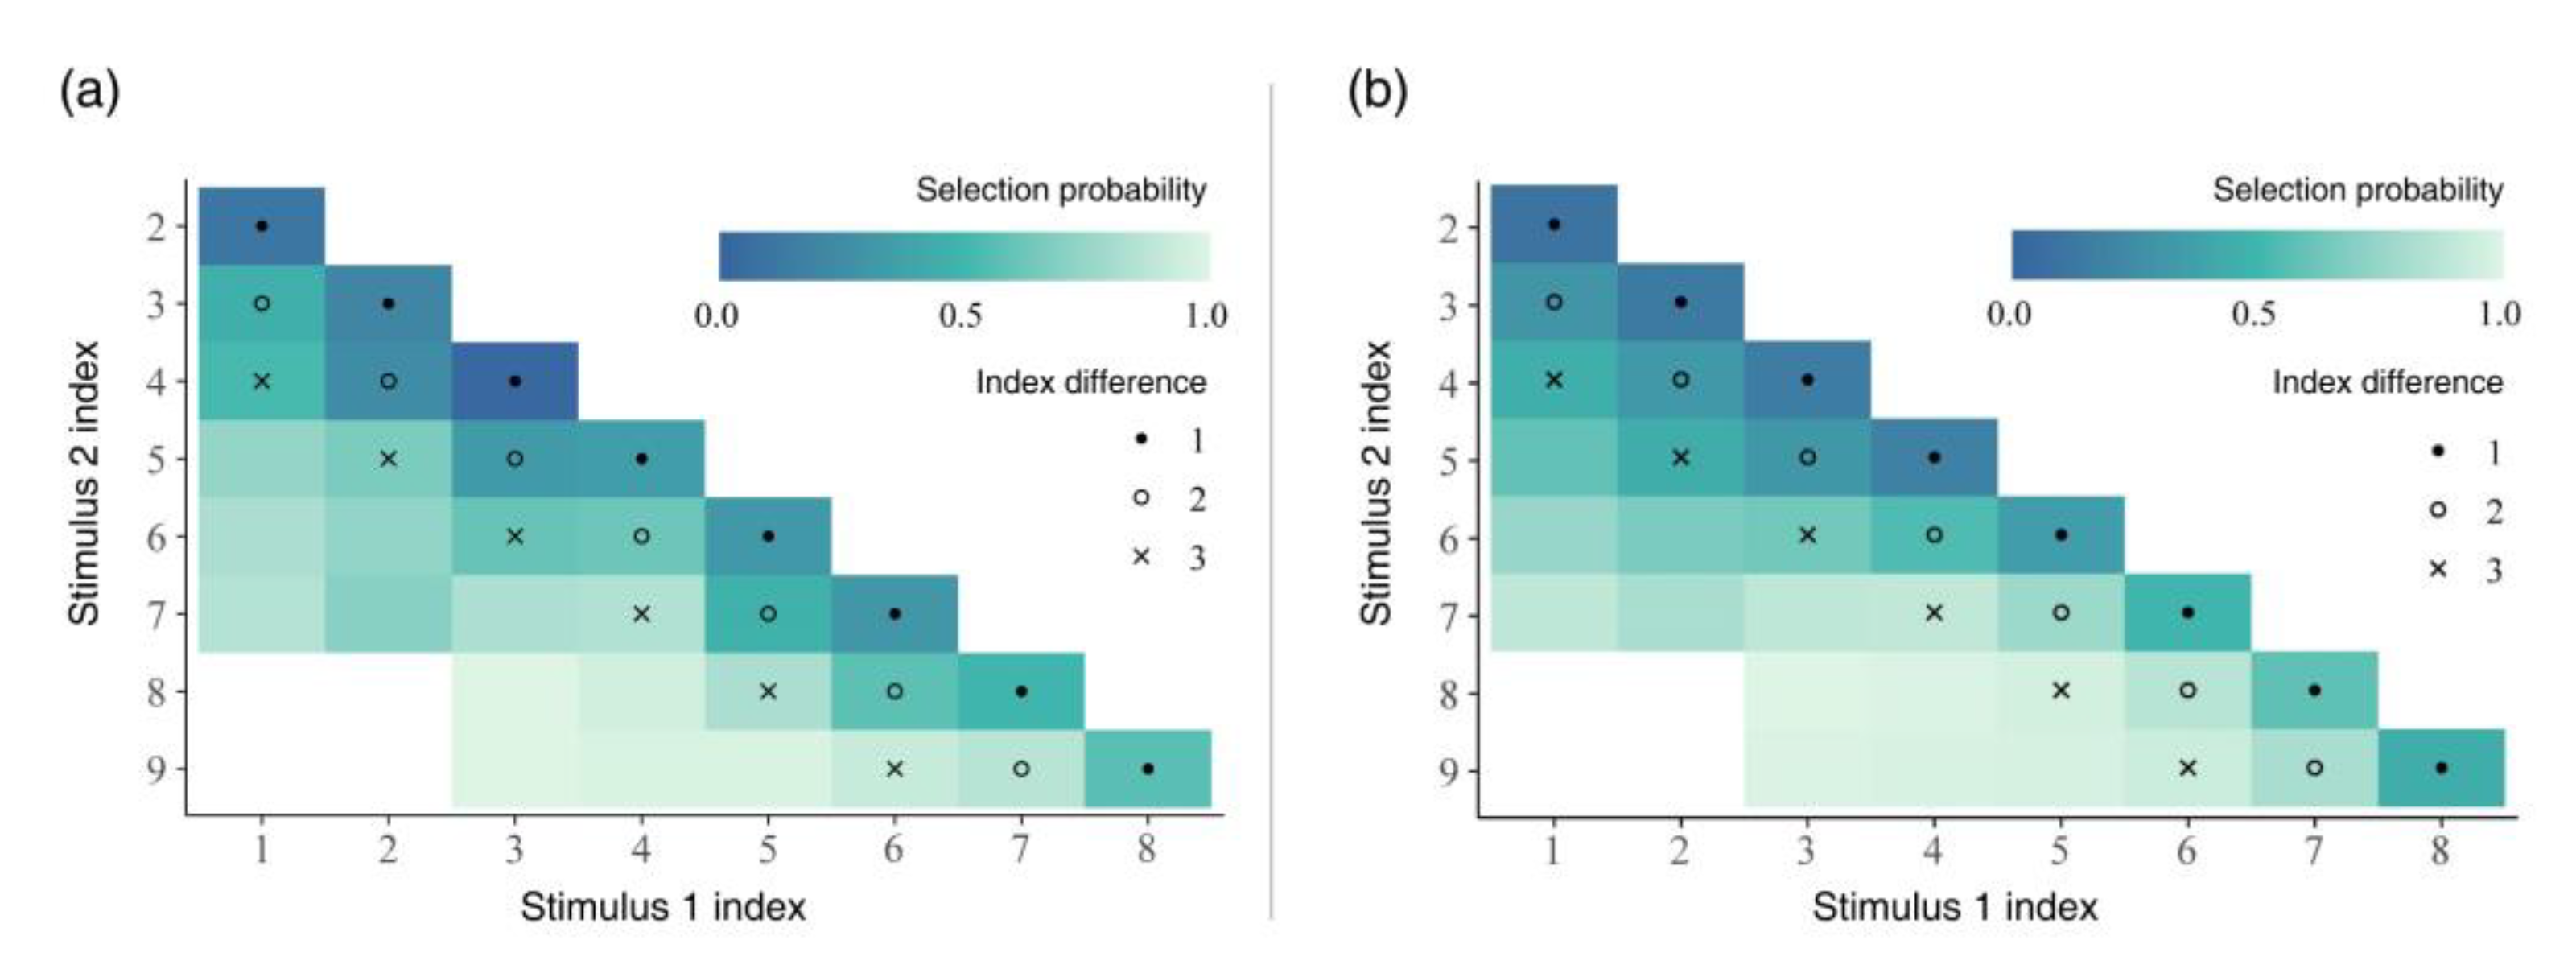
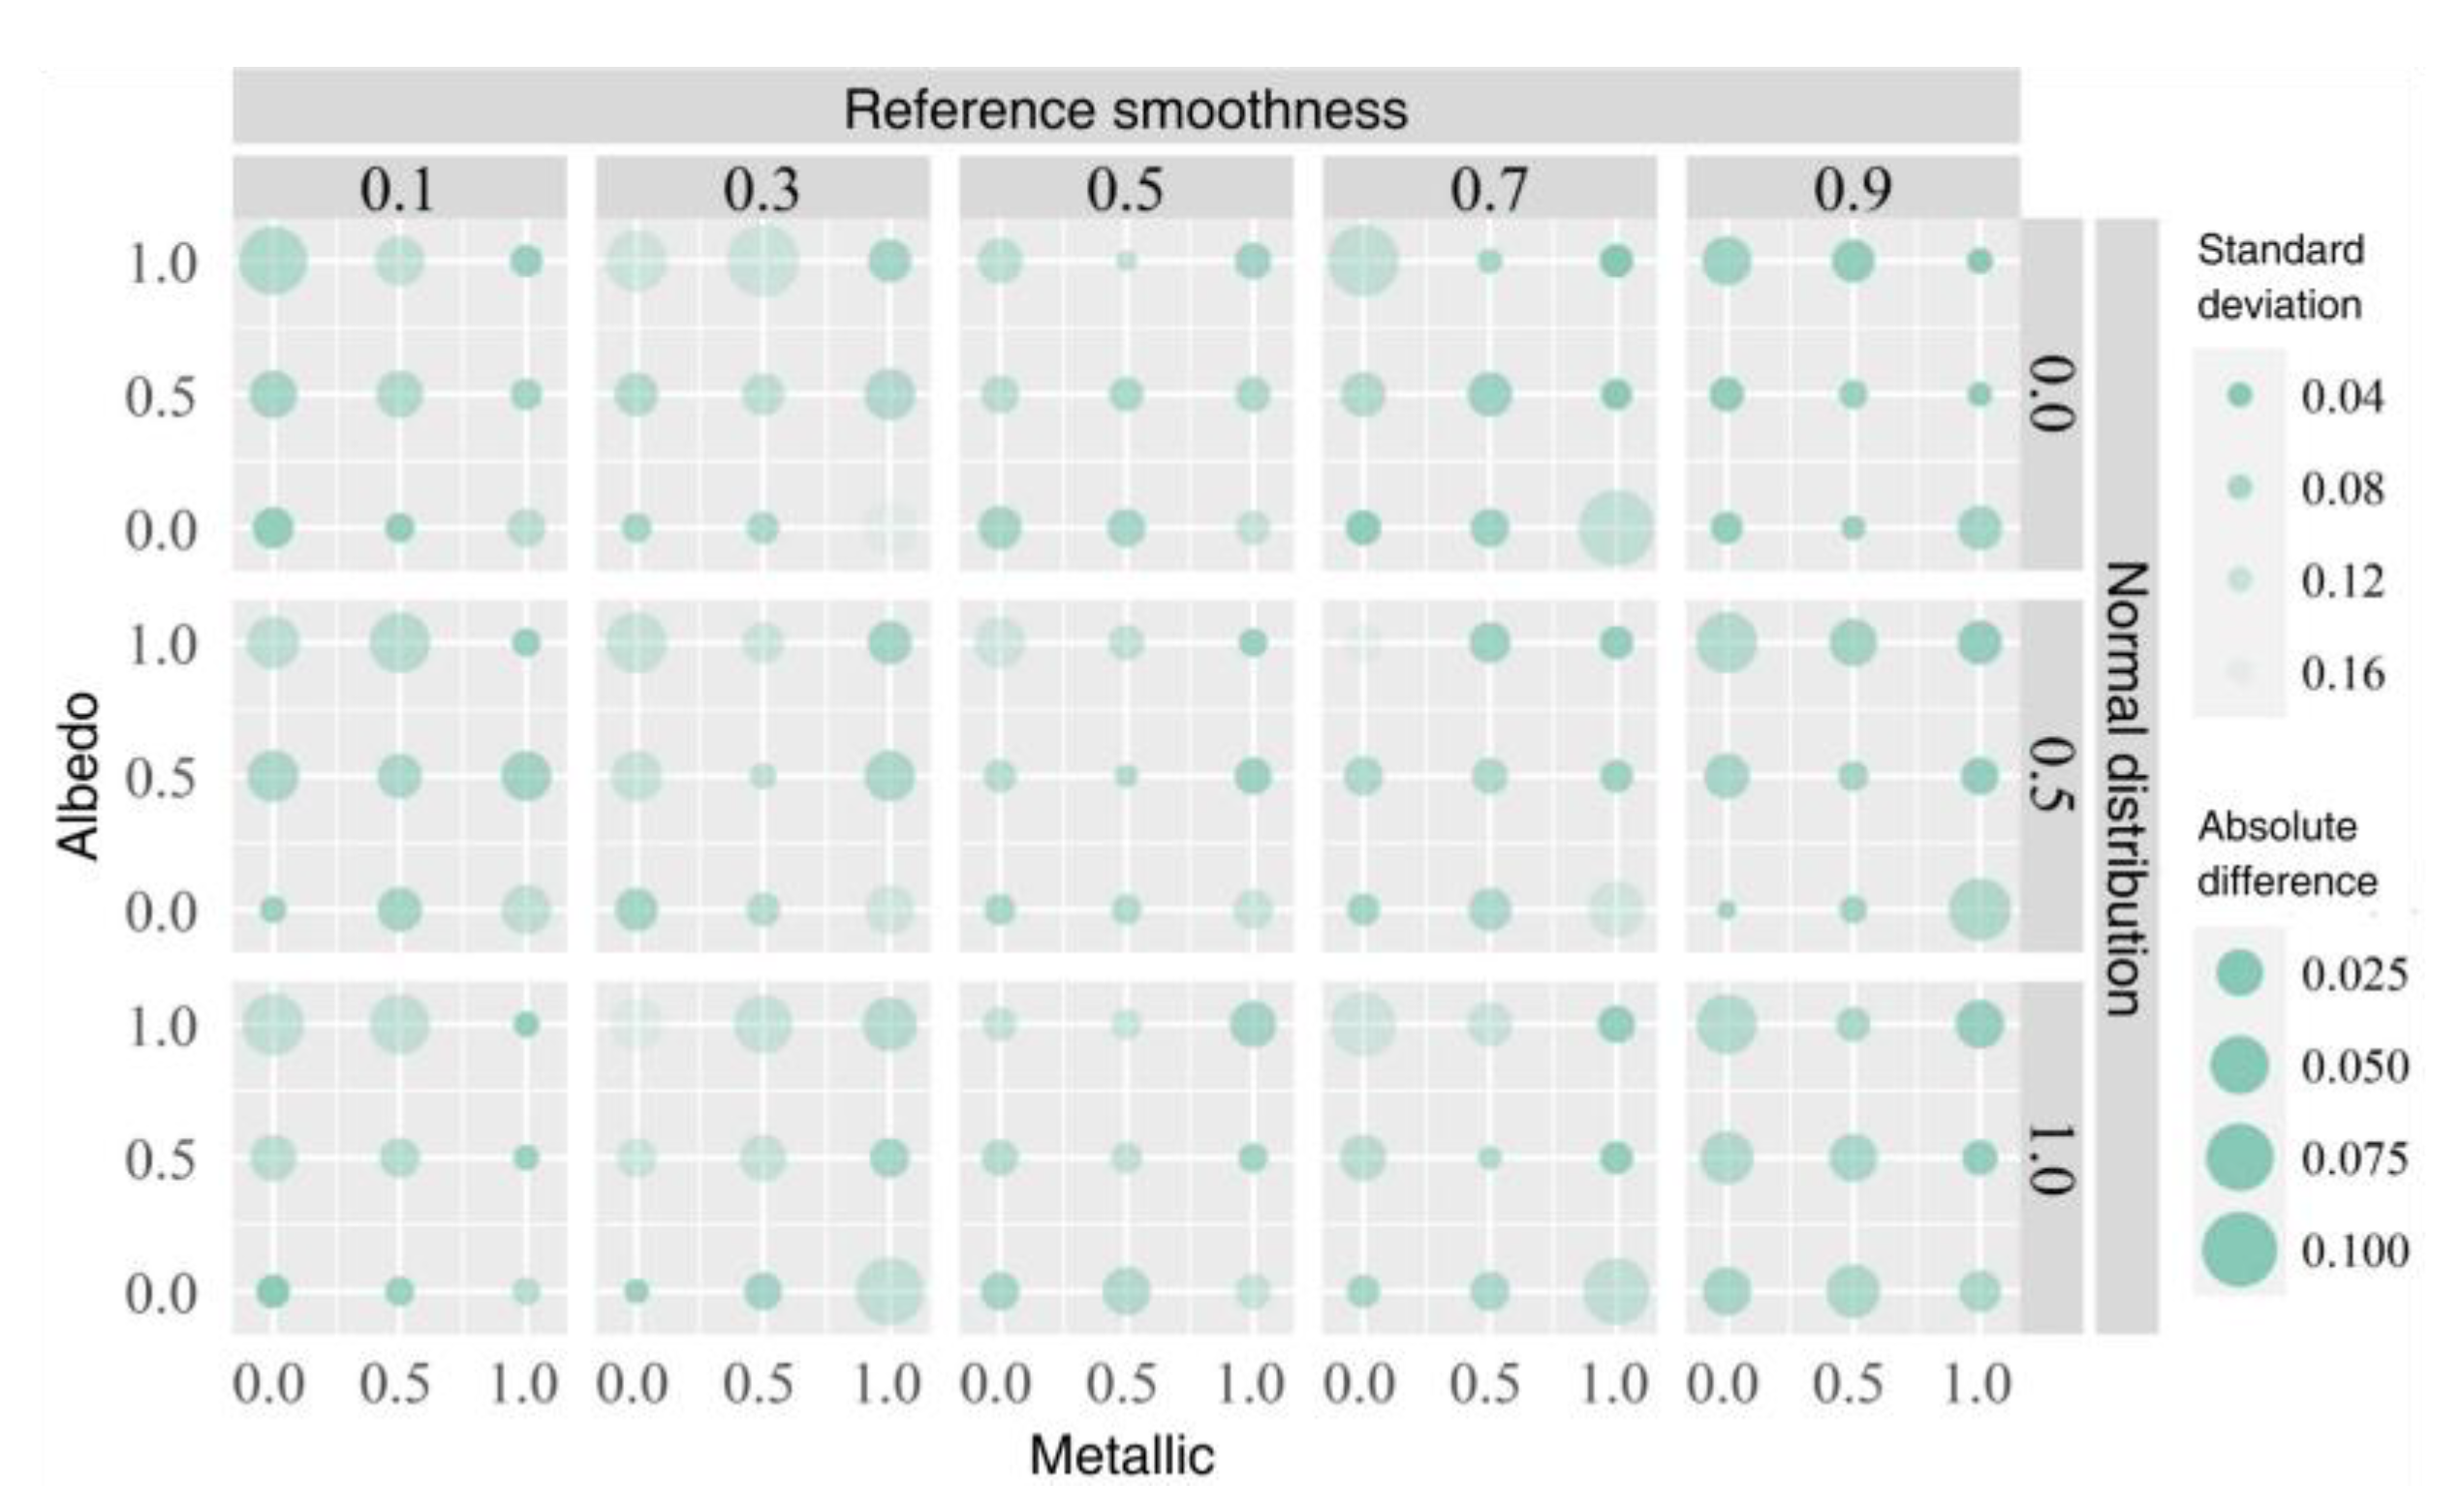
3.2.1. Differential Distribution Analysis
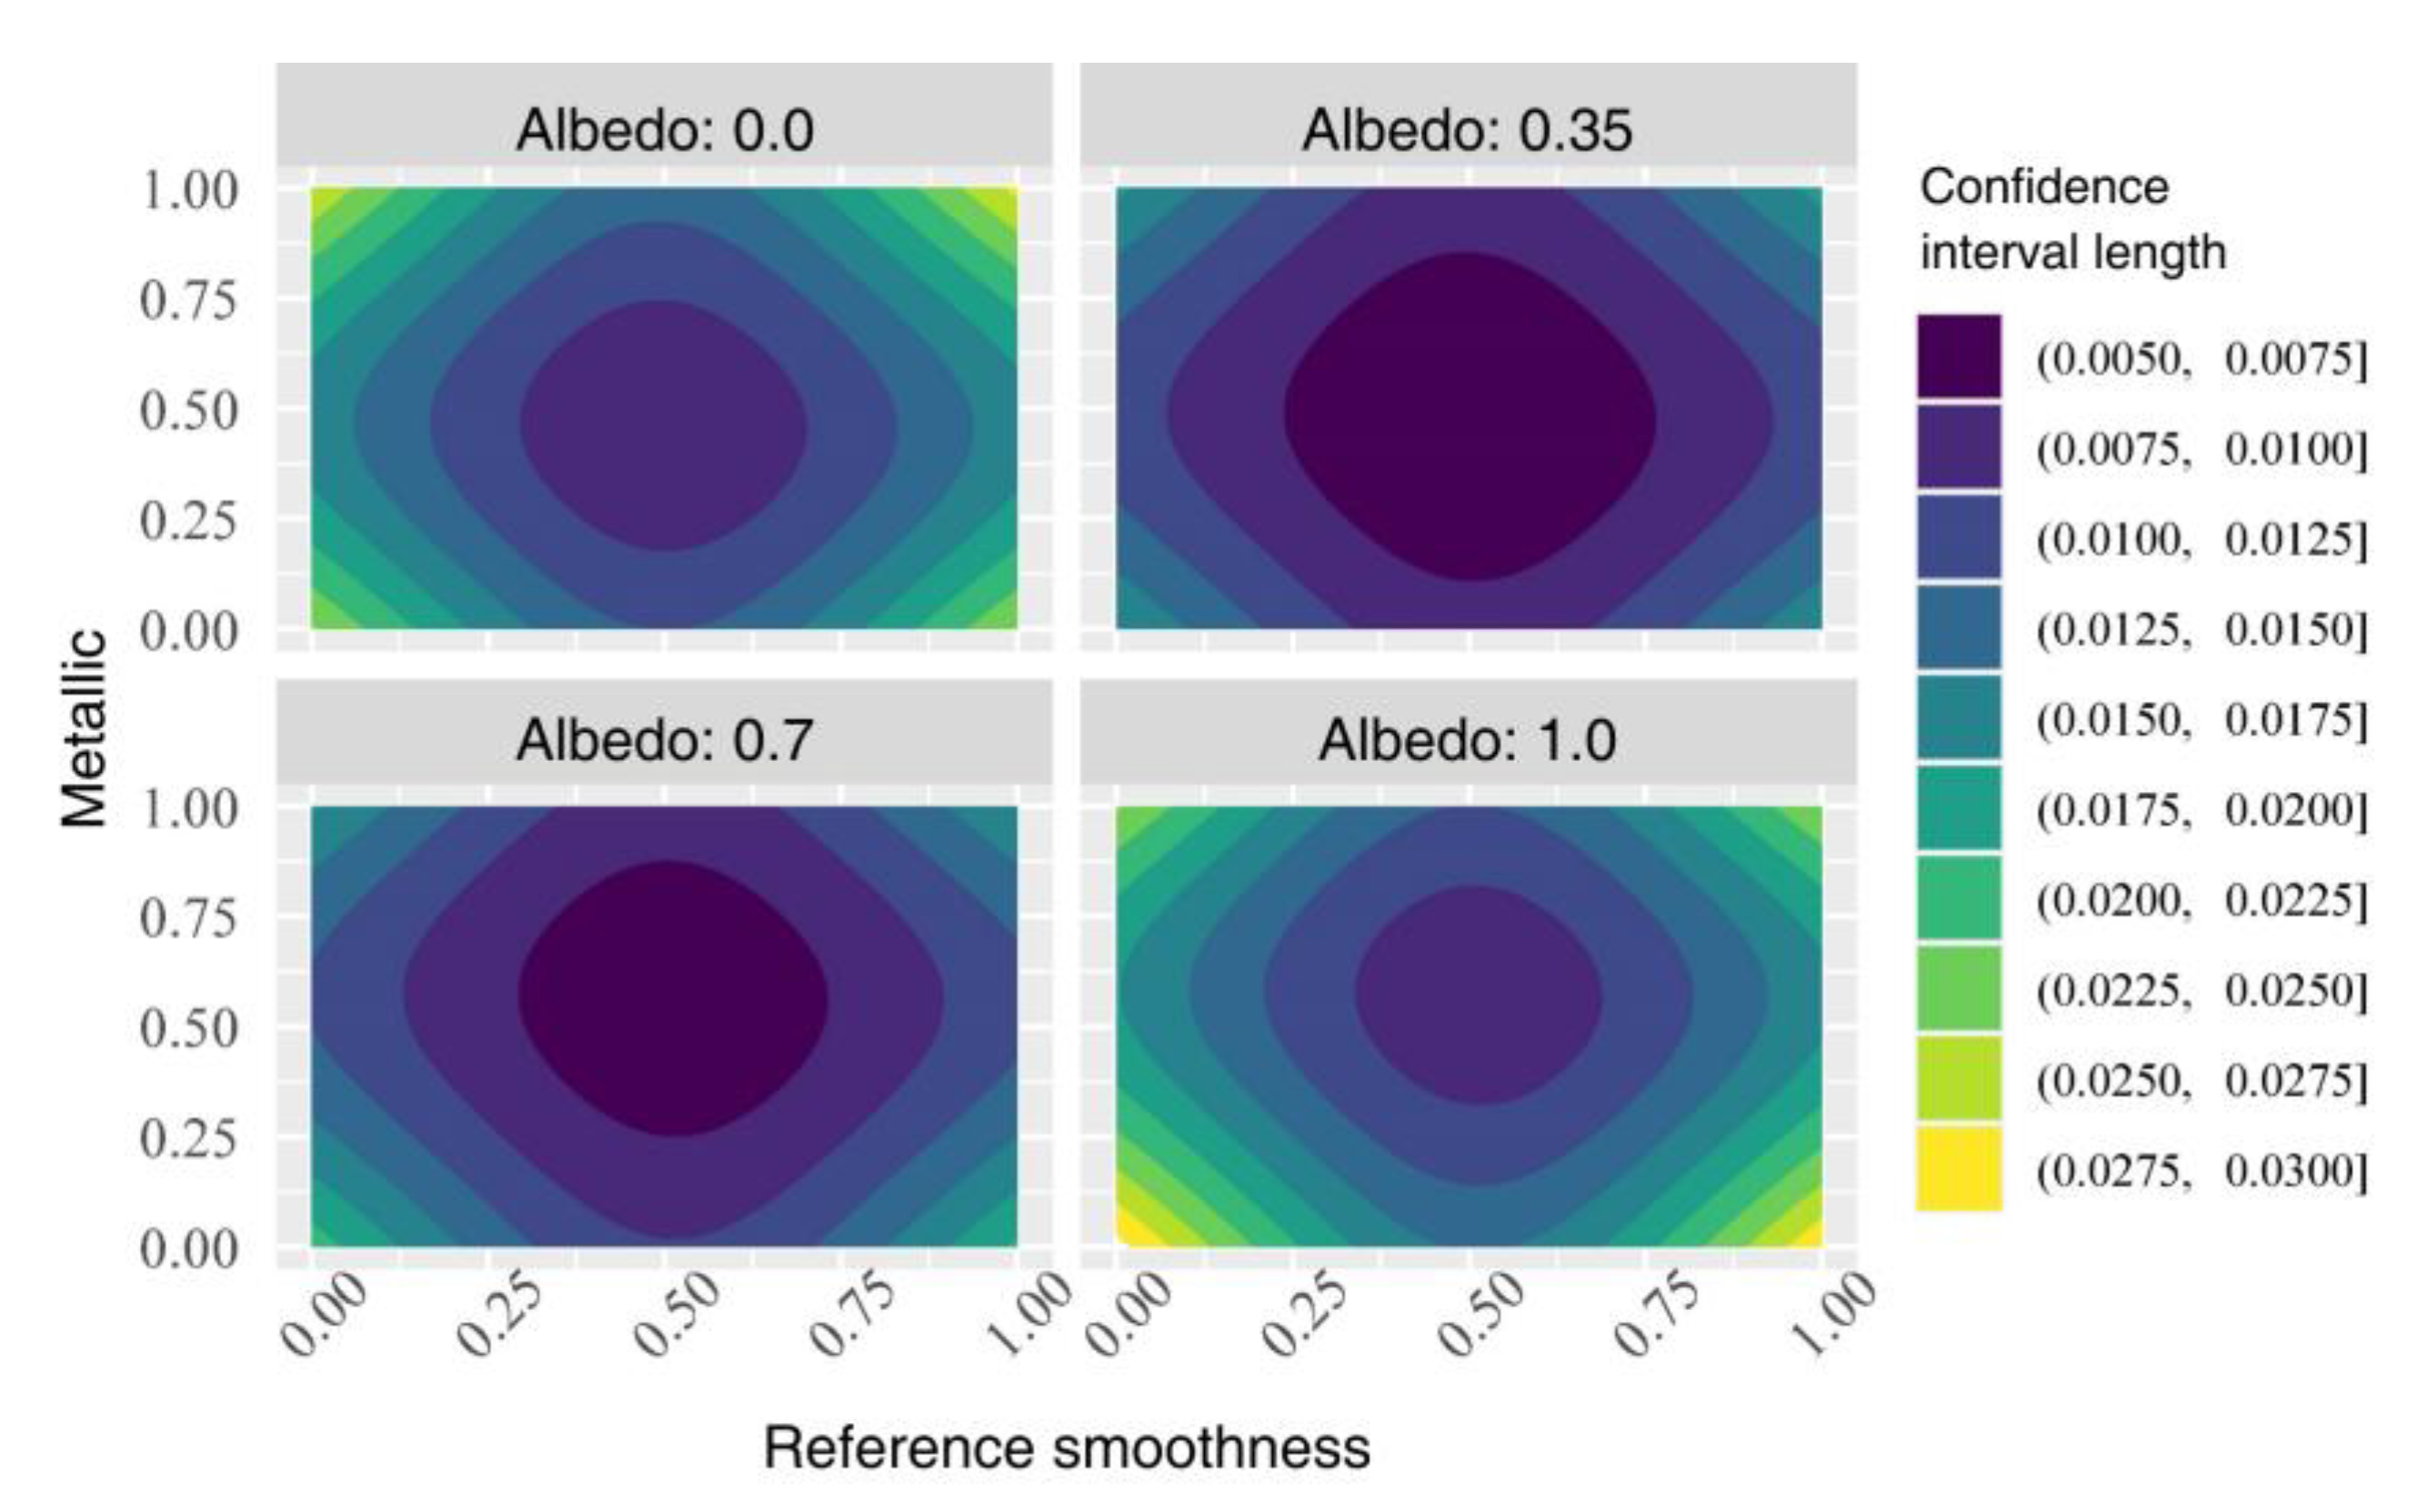
3.2.2. Multiple Regression Analysis
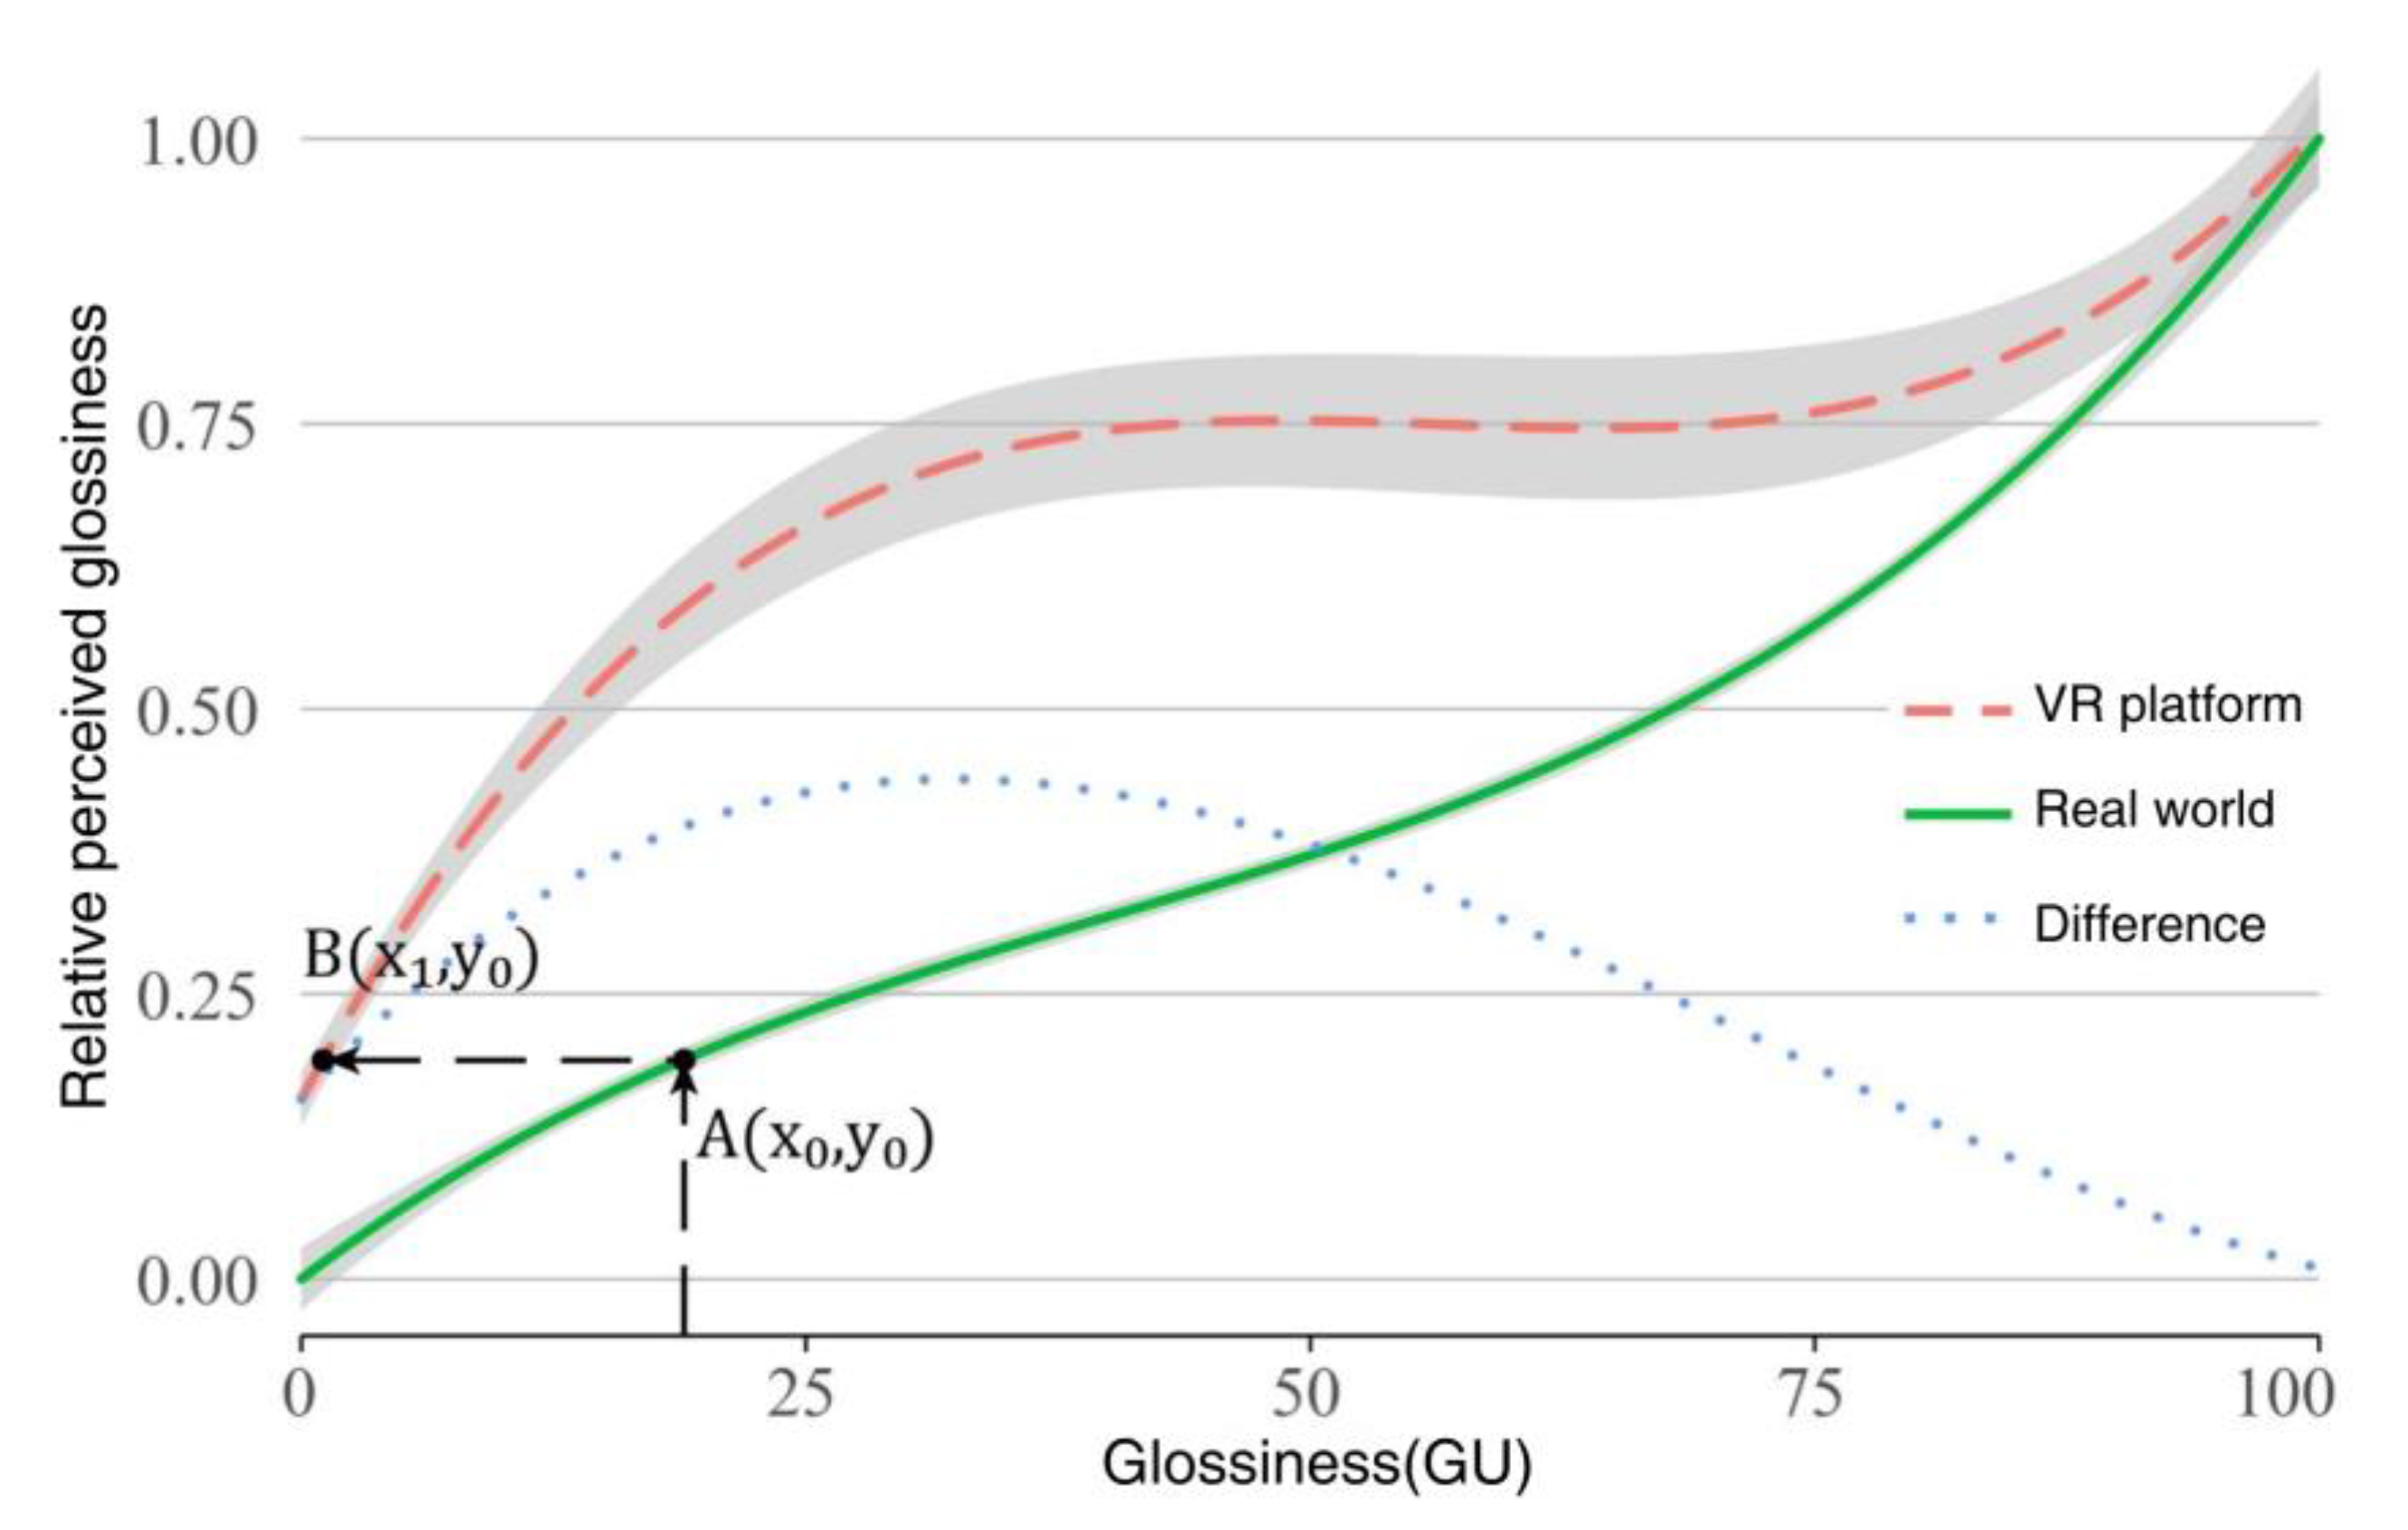
4. Gloss-Bridge: The Glossiness Mapping Method
5. Conclusions
- (1)
- Developing quantitative methods based on psychology to measure other PBR material attributes (such as subsurface scattering intensity, transparency, etc.);
- (2)
- Investigating the impact of non-visual cues on material visual properties and their effect on VR immersion;
- (3)
- Examining the influence of perceptual constancy on material perception in VR;
- (4)
- Studying the representation of materials and its impact on perception, driven by emerging rendering technologies such as NERF.
Author Contributions
Funding
Institutional Review Board Statement
Informed Consent Statement
Data Availability Statement
Acknowledgments
Conflicts of Interest
References
- Nicodemus, F.E. Directional Reflectance and Emissivity of an Opaque Surface. Appl. Opt. 1965, 4, 767–775. [Google Scholar] [CrossRef]
- Hsia, J.J.; Richmond, J.C. Bidirectional Reflectometry. Part I.: A High Resolution Laser Bidirectional Reflectometer With Results on Several Optical Coatings. J. Res. Natl. Bur. Stand. Sect. A Phys. Chem. 1976, 80, 189–205. [Google Scholar] [CrossRef]
- Rabal, A.M.; Ferrero, A.; Campos, J.; Fontecha, J.L.; Pons, A.; Rubiño, A.M.; Corróns, A. Automatic go-nio-spectrophotometer for the absolute measurement of the spectral BRDF at in-and out-of-plane and retroreflection geometries. Metrologia 2012, 49, 213. [Google Scholar] [CrossRef]
- Baribeau, R.; Neil, W.S.; Côté, É. Development of a robot-based gonioreflectometer for spectral BRDF measurement. J. Mod. Opt. 2009, 56, 1497–1503. [Google Scholar] [CrossRef]
- Thomas, J.J. Proceedings of the 19th Annual Conference on Computer Graphics and Interactive Techniques, Chicago, IL, USA, 26–31 July 1992; ACM: New York, NY, USA, 1992.
- Bala, K.; Dutré, P. (Eds.) Proceedings of the Sixteenth Eurographics Conference on Rendering Techniques, Konstanz, Germany, 29 June–1 July 2005; Eurographics Association: Eindhoven, The Netherlands, 2005.
- Riviere, N.; Ceolato, R.; Hespel, L. Multispectral polarized BRDF: Design of a highly resolved reflectometer and development of a data inversion method. Opt. Appl. 2012, 42, 7–22. [Google Scholar]
- Mukaigawa, Y.; Sumino, K.; Yagi, Y. Multiplexed illumination for measuring BRDF using an ellipsoidal mirror and a projector. In Proceedings of the Computer Vision–ACCV 2007: 8th Asian Conference on Computer Vision, Tokyo, Japan, 18–22 November 2007; Proceedings, Part II 8. Springer: Berlin/Heidelberg, Germany, 2007; pp. 246–257. [Google Scholar]
- Woodham, R.J. Photometric Method for Determining Surface Orientation from Multiple Images. Opt. Eng. 1980, 19, 191139. [Google Scholar] [CrossRef]
- Tominaga, S.; Tanaka, N. Estimating reflection parameters from a single color image. IEEE Comput. Graph. Appl. 2000, 20, 58–66. [Google Scholar] [CrossRef]
- Phong, B.T. Illumination for computer generated pictures. Commun. ACM 1975, 18, 311–317. [Google Scholar] [CrossRef] [Green Version]
- Deschaintre, V.; Aittala, M.; Durand, F.; Drettakis, G.; Bousseau, A. Single-image svbrdf capture with a render-ing-aware deep network. ACM Trans. Graph. (ToG) 2018, 37, 1–15. [Google Scholar] [CrossRef] [Green Version]
- Li, Z.; Sunkavalli, K.; Chandraker, M. Materials for masses: SVBRDF acquisition with a single mobile phone image. In Proceedings of the European Conference on Computer Vision (ECCV), München, Germany, 8–14 September 2018; pp. 72–87. [Google Scholar]
- Zhang, J.; Meuret, Y.; Wang, X.; Smet, K.A.G. Improved and Robust Spectral Reflectance Estimation. Leukos 2021, 17, 359–379. [Google Scholar] [CrossRef]
- Whitted, T. An improved illumination model for shaded display. In Proceedings of the 6th Annual Conference on Computer Graphics and Interactive Techniques, Chicago, IL, USA, 8–10 August 1979; p. 14. [Google Scholar]
- Cook, R.L.; Torrance, K.E. A reflectance model for computer graphics. ACM Siggraph Comput. Graph. 1981, 15, 307–316. [Google Scholar] [CrossRef]
- Cook, R.L.; Torrance, K.E. A Reflectance Model for Computer Graphics. ACM Trans. Graph. 1982, 1, 7–24. [Google Scholar] [CrossRef]
- Dunn, F.; Parberry, I. 3D Math Primer for Graphics and Game Development; CRC Press: Boca Ration, FL, USA, 2011. [Google Scholar]
- Sharan, L.; Rosenholtz, R.; Adelson, E. Material perception: What can you see in a brief glance? J. Vis. 2009, 9, 784. [Google Scholar] [CrossRef]
- Sharan, L.; Rosenholtz, R.; Adelson, E.H. Accuracy and speed of material categorization in real-world images. J. Vis. 2014, 14, 12. [Google Scholar] [CrossRef] [Green Version]
- Sharan, L.; Liu, C.; Rosenholtz, R.; Adelson, E.H. Recognizing Materials Using Perceptually Inspired Features. Int. J. Comput. Vis. 2013, 103, 348–371. [Google Scholar] [CrossRef] [PubMed] [Green Version]
- Fleming, R.W.; Wiebel, C.; Gegenfurtner, K. Perceptual qualities and material classes. J. Vis. 2013, 13, 9. [Google Scholar] [CrossRef]
- Marlow, P.J.; Kim, J.; Anderson, B.L. The Perception and Misperception of Specular Surface Reflectance. Curr. Biol. 2012, 22, 1909–1913. [Google Scholar] [CrossRef] [Green Version]
- Marlow, P.J.; Anderson, B.L. Generative constraints on image cues for perceived gloss. J. Vis. 2013, 13, 2. [Google Scholar] [CrossRef] [Green Version]
- Bingham, G.P.; Bradley, A.; Bailey, M.; Vinner, R. Accommodation, occlusion, and disparity matching are used to guide reaching: A comparison of actual versus virtual environments. J. Exp. Psychol. Hum. Percept. Perform. 2001, 27, 1314. [Google Scholar] [CrossRef]
- El Jamiy, F.; Marsh, R. Survey on depth perception in head mounted displays: Distance estimation in virtual reality, augmented reality, and mixed reality. IET Image Process. 2019, 13, 707–712. [Google Scholar] [CrossRef]
- Knoblauch, K.; Maloney, L.T. MLDS: Maximum Likelihood Difference Scaling in R. J. Stat. Softw. 2008, 25, 1–26. [Google Scholar] [CrossRef] [Green Version]
- Obein, G.; Knoblauch, K.; Viéot, F. Difference scaling of gloss: Nonlinearity, binocularity, and constancy. J. Vis. 2004, 4, 4–20. [Google Scholar] [CrossRef] [Green Version]
- Mohammadalizadeh, A.; Ameri, F.; Moradian, S.; Mirjalili, F. Effect of color on some geometric attributes of visual appearance of non-effect coatings. J. Coatings Technol. Res. 2020, 17, 949–961. [Google Scholar] [CrossRef]
- Ho, Y.-X.; Landy, M.S.; Maloney, L.T. Conjoint Measurement of Gloss and Surface Texture. Psychol. Sci. 2008, 19, 196–204. [Google Scholar] [CrossRef] [PubMed] [Green Version]
- Akaike, H. A new look at the statistical model identification. IEEE Trans. Autom. Control 1974, 19, 716–723. [Google Scholar] [CrossRef]
- ISO 7668:1986; Anodizing of Aluminium and Its Alloys. Measurement of Specular Reflectance and Specular Gloss at Angles of 20°, 45°, 60° or 85°. International Organization for Standardization: Geneva, Switzerland, 1986.


| Index | Color | Glossiness Measured at 60°/GU |
|---|---|---|
| 1 | black | 5.5 |
| 2 | black | 10.9 |
| 3 | black | 21.4 |
| 4 | black | 23.2 |
| 5 | black | 45.1 |
| 6 | black | 54.5 |
| 7 | black | 62.7 |
| 8 | black | 77.7 |
| 9 | black | 90.6 |
| Terms | Coefficients | p Value |
|---|---|---|
| albedo | 0.078241 | |
| metallic | 0.037660 | |
| reference smoothness | 0.996924 | < |
| Albedo × metallic | −0.107515 | |
| albedo × reference smoothness | −0.134260 | |
| metallic × reference smoothness | −0.081839 | |
| albedo × metallic × reference smoothness | 0.240802 |
Disclaimer/Publisher’s Note: The statements, opinions and data contained in all publications are solely those of the individual author(s) and contributor(s) and not of MDPI and/or the editor(s). MDPI and/or the editor(s) disclaim responsibility for any injury to people or property resulting from any ideas, methods, instructions or products referred to in the content. |
© 2023 by the authors. Licensee MDPI, Basel, Switzerland. This article is an open access article distributed under the terms and conditions of the Creative Commons Attribution (CC BY) license (https://creativecommons.org/licenses/by/4.0/).
Share and Cite
Xiao, W.; Tan, T.; Xue, C. Gloss-Bridge: A Method to Reduce the Visual Perception Gap between Real-World Glossiness and PBR Reflectance Properties in Virtual Reality. Appl. Sci. 2023, 13, 4722. https://doi.org/10.3390/app13084722
Xiao W, Tan T, Xue C. Gloss-Bridge: A Method to Reduce the Visual Perception Gap between Real-World Glossiness and PBR Reflectance Properties in Virtual Reality. Applied Sciences. 2023; 13(8):4722. https://doi.org/10.3390/app13084722
Chicago/Turabian StyleXiao, Weiye, Taoyong Tan, and Chengqi Xue. 2023. "Gloss-Bridge: A Method to Reduce the Visual Perception Gap between Real-World Glossiness and PBR Reflectance Properties in Virtual Reality" Applied Sciences 13, no. 8: 4722. https://doi.org/10.3390/app13084722