1. Introduction
Fire engineering is a science discipline that requires a multidisciplinary approach to resolve fire safety parameters. Some of these parameters include the cause of the fire, the incipient phase of fire, fire detection systems, personal evacuation, fire development, and fire suppression systems. The fire processes are limited primarily to the characteristics of the fuel, the amount of fuel, and the availability of oxidants.
A simple method that can be used to graphically represent fire is the heat release rate (HRR) versus time, known as the “fire curve”. The HRR is so important that it has been described as the single most important variable for a fire hazard.
The traditional prediction for specifying the development of an enclosure fire assumes there is a homogeneous temperature condition in the enclosure. The accuracy and validity of this assumption was examined in Cardington and Dalmarnock’s experimental fire tests. The results clearly show that homogeneous temperature conditions are not present, and variations in the enclosure averages exist [
1].
During the course of the fire, the fire can change between being fuel-controlled and ventilation-controlled. In ventilation-limited fires, the airflow (oxygen) will govern whether the enclosure will be a fuel-rich environment or lean fuel environment. This can be due to the natural stages of the fire, the geometry of the enclosure, or the factors affecting the ventilation.
The idea of using a fire computation simulation “field model” to generate data has been shown to be useful in recent fire engineering studies, such as for fire detection in tunnels [
2], structural fire protection designs [
3], and hazard assessments. The field model would help avoid the need for conducting costly experiments and facilitate parametric studies of problems [
4].
There are different approaches employing CFD codes for turbulent flows. The visualization of a turbulent flow using “turbulent eddies” or Reynolds-averaged Navier–Stokes (RANS) equations is a rational approach considering that the direct numerical simulation (DNS) computing requirements for the direct solution are not practical. In this paper, turbulent fluid motions were modeled, but only a mean flow was resolved. The computations were not intended to model a specific fire scenario but rather an enclosure fire with a focus on ventilation variation and geometry to elaborate on the problems, visualize ideas, and achieve safety objectives.
2. Fire Curve
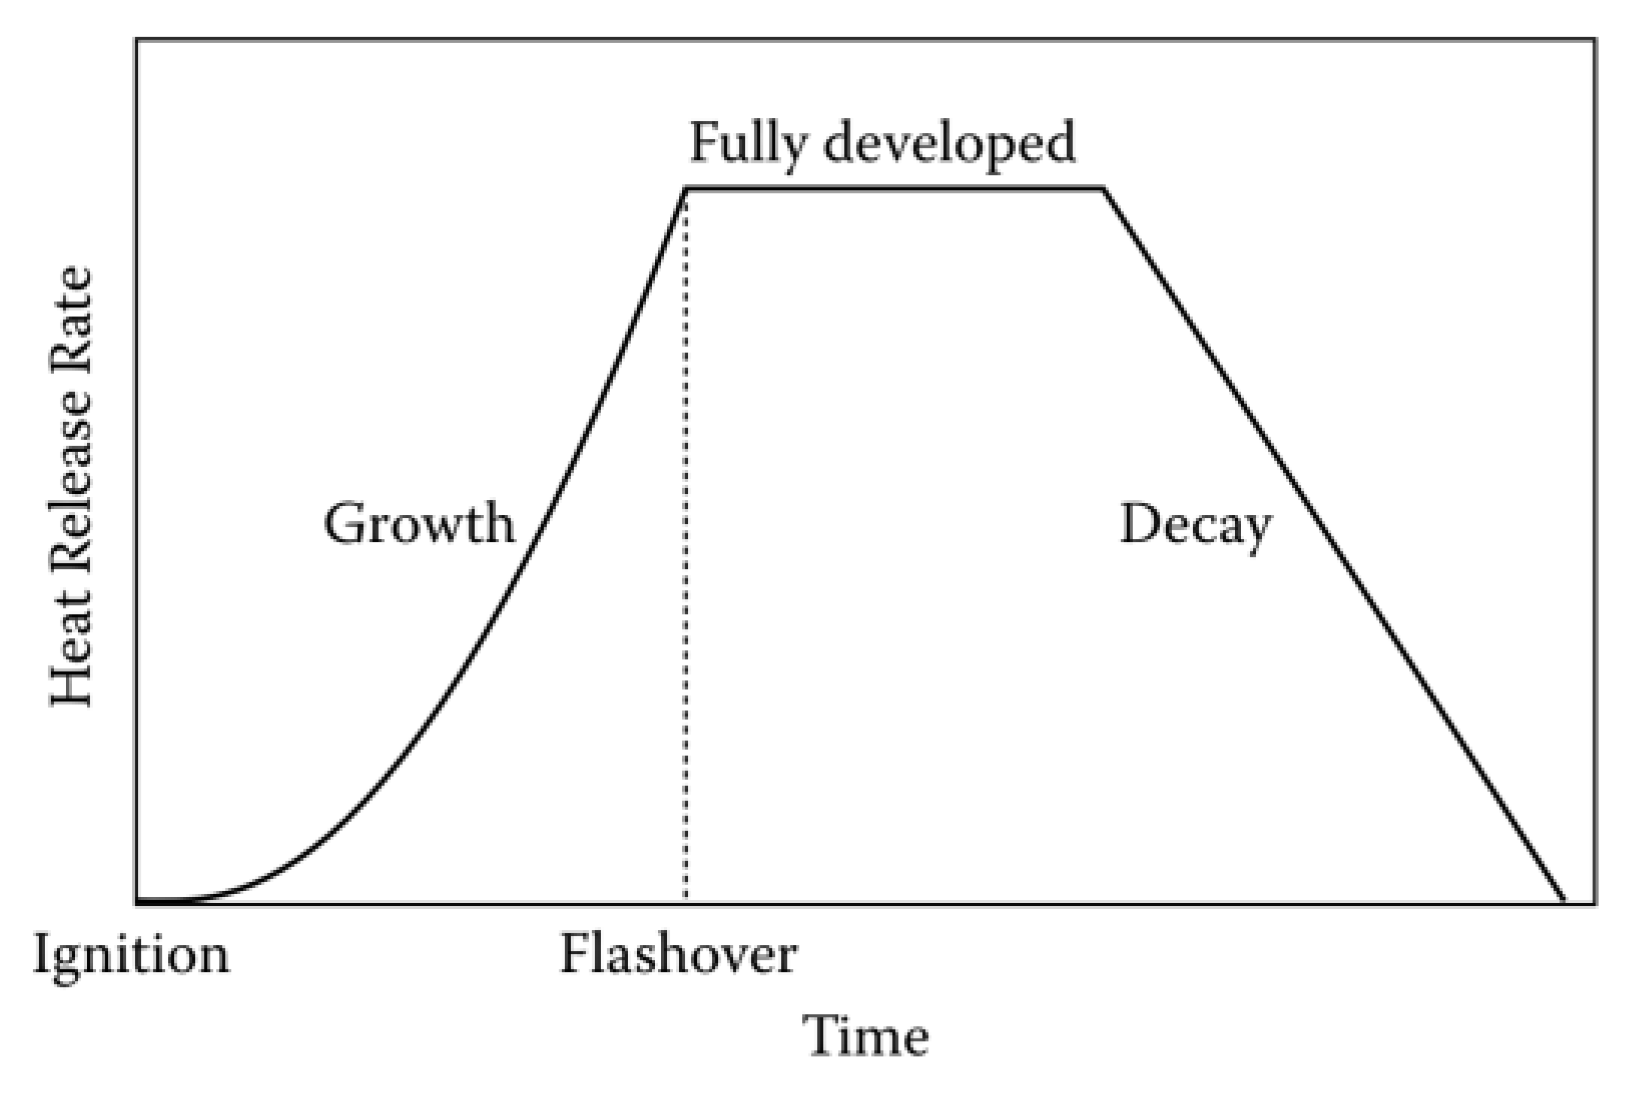
A fire curve is a simplified method for describing fire in a particular set of conditions (
Figure 1). It can be based on either the history or prediction of four phases: ignition, growth, full development, and decay. Defining fire phases requires a quantitative approach that uses correlations and analytical and experimental methodologies. The combination of these methodologies is crucial to obtain a realistic fire curve.
The ignition phase starts from the initial source of the fire, while the other materials in the fire area have the potential to ignite through either direct exposure or radiant energy. Multiple sources of fuel can be quantified as the fire load.
In the case of multiple materials in a fire area, the fire curve shape depends on the fire coefficient, which denotes the speed of fire growth. If a fire has a fast growth phase, a high but narrow curve will be produced, as shown in
Figure 2a. Conversely, if it has a slow growth phase, a relatively flat but broad curve will be produced, as seen in
Figure 2b. The initial fire source and the objects are the same as those in
Figure 2a [
5].
2.1. Fire Development
Ignition is the phase at which fuel, oxygen, and heat combine to begin combustion. During this phase, the time of ignition can be a few seconds, hours, or even days because of the fact that the HRR is negligible. The fire can self-extinguish or transit to the next phase. The calculations used in practice for the growth phase can be conducted with the power law equation:
Furthermore:
—the critical time at which a fire reaches a size of 1055 kW [s].
Two parameters are used for the NFPA file classification (
Table 1) [
6]:
The coefficient α defines the speed of fire growth;
The growth phase is also expressed using a critical time, which is the moment when the fire coefficient would be the constant.
The direct use of data for calculations is acceptable if the enclosure is large enough that the burning behavior is similar to that in the open atmosphere [
7].
The HRR of a burning item in an enclosure causes air vitiation effects, generates symmetrical airflow patterns, and, in some cases, enhances the burning rate due to radiation feedback from the hot surfaces and upper gas layer, which cause an increase in the HRR. To overcome these enclosure effects, standard test methods for measuring the HRR are operated in an open configuration, allowing for an unrestricted flow of air to the combustion zone [
8].
The ventilation factor is the controller of the fire growth phase; once the ventilation limitation is reached, fire continues until it reaches its fully developed phase. To simplify experiment data during this phase, an idealized t-squared fire or power law equation can be utilized when there are unknown variables (Equations (1) and (2) and, in
Table 2, Equations (3)–(8)).
The fully developed phase is computed using the HRR and the duration of the phase with Equation (4). A fuel-controlled fire is defined by multiplying the HRRPUA and the “heat release rate per unit area” from the test results, and if the fire is ventilation-controlled, then the limited ventilation methodology can be applied in Equation (4).
Essentially, the decay phase can be computed following the same calculations as the growth phase using Equations (5), (7) and (9) (
Table 2).
2.2. Ventilation-Limited Fire Curve
Flow occurs as a result of fire because of buoyancy-driven convection. Buoyancy causes a pressure difference that results in a velocity. Buoyant pressure and momentum push the flow [
9]. Consider an enclosure with an opening, as shown in
Figure 3. The pressure difference,
, is related to the buoyancy:
Velocity due to pressure caused by buoyancy:
—density of air (cold) ;
—density of smoke (hot) ;
—gravitational acceleration: ;
—height of opening .
The exact mass flow rate
depends on the temperature difference and size of the opening [
10]. The maximum air flow rate was first introduced by Kunio Kawagoe, the Japanese fire research pioneer [
11]:
—area of opening
.
The degree of ventilation, in principle, is the ratio of oxygen required over the oxygen available for complete stoichiometric combustion. This so-called equivalence ratio,
, is defined as:
Excess fuel produces a rich mixture
and excess air a lean mixture
. Since the overall combustion process is studied in this work,
is defined as the equivalence ratio for the overall combustion process. This is usually referred to as the global equivalence ratio [
12].
The stoichiometric limit for the maximum HRR in natural ventilation conditions can be calculated as [
13]:
—HRR stoichiometric limit of natural ventilation
.
The total ventilation of the enclosure is computed as the sum of individual vents:
—number of openings.
Multiple doors and windows, ceilings, or floor vents complicate the process. For more complex vent configurations, a simple formula computation should be prohibited. Those can only be appropriately computed with a more involved analysis, such as FDS (CFD) simulations, which can generate data on those complex processes.
The prediction of the entire range of the flow conditions can be expressed by Equation (16), and this has shown a degree of accuracy with the data within
[
14].
where:
—area of (window) opening ;
—height from floor to opening ;
—fire location coefficient (0.55 center; 0.85 near a wall; 1 corner).
The peak of the HRR is in correlation with the ventilation or fuel (
Figure 4).
In a real fire, ventilation can undergo random changes due to doors being left open by an occupant fleeing the fire, fire department personnel operations, or a window failure as a result of fire.
For a ventilation-controlled fire, the activation of the smoke management system will have a larger impact on the burning behavior since the air mass flow rate into the compartment changes; thus, the equation cannot be used directly under such conditions. The consequences of these differences are beyond the scope of this work and thus are not discussed.
3. Numerical Simulations
For a comprehensive consideration of the computing time and accuracy, the simulation used a fire dynamics simulator (FDS 6.7.9) developed by the National Institute of Standards and Technology (NIST) [
15]. In the paper, we used the mixture fraction combustion model (MFCM) to account for the mixing of fuel and oxygen without burning. Using the modified combustion model allows for realistic ventilation scenarios [
16]. The field model in this paper is limited to a simple enclosure configuration, but extensions can be made to other applications.
Boundary Conditions and Assumptions
To study natural ventilation conditions in the model, eight cases were considered in the simulations with changes in the ventilation and space geometry (with and without a partition wall), as can be seen in
Table 3.
The enclosure model dimensions were as follows: width = 3.8 m, length = 9 m, height = 2.75 m, and wall thickness = 0.2 m, with the wall being made from concrete. The dimensions for the partition wall were as follows: length = 1.6 m, height = 2.75 m, thickness = 0.2 m; the wall was made from brick, and the distance from the entrance door was 3.6 m. Two windows of the same geometry had individual ventilation factors of 0.85. The door ventilation had a factor of 2.83. The boundary conditions at the windows and door were treated as open vents. Eight thermocouple trees were placed at the front, middle, and rear of the enclosure, with separation heights of 0.5 m, 1.5 m, and 2.4 m (
Figure 5). After assigning the boundary conditions, the mesh calculation was established in auto-size mode with a cell size of 0.2 × 0.2 × 0.2. However, to achieve the exact result, the mesh of the region surrounding the ventilation openings was refined with a cell size of 0.1 × 0.1 × 0.1.
The environment temperature was set to 20 °C, and the pressure was equal to the atmospheric pressure. To create the HRR curve, the published cone calorimeter and furniture calorimeter experiment data were investigated.
The fire ignition occurred at 10 s from the start of the simulation. The fuel polyurethane had an HRR of 1500 kW, a t-square curve
, a fast growth rate phase
, a steady state of 20 s, and a medium decay rate phase
, as represented by
Figure 6. The total HRR was 297 MJ [
17,
18].
4. Results
In the early period, the oxygen in the enclosure was enough to maintain burning, the burning was fuel-controlled, and the curves obtained were almost the same as the literature data.
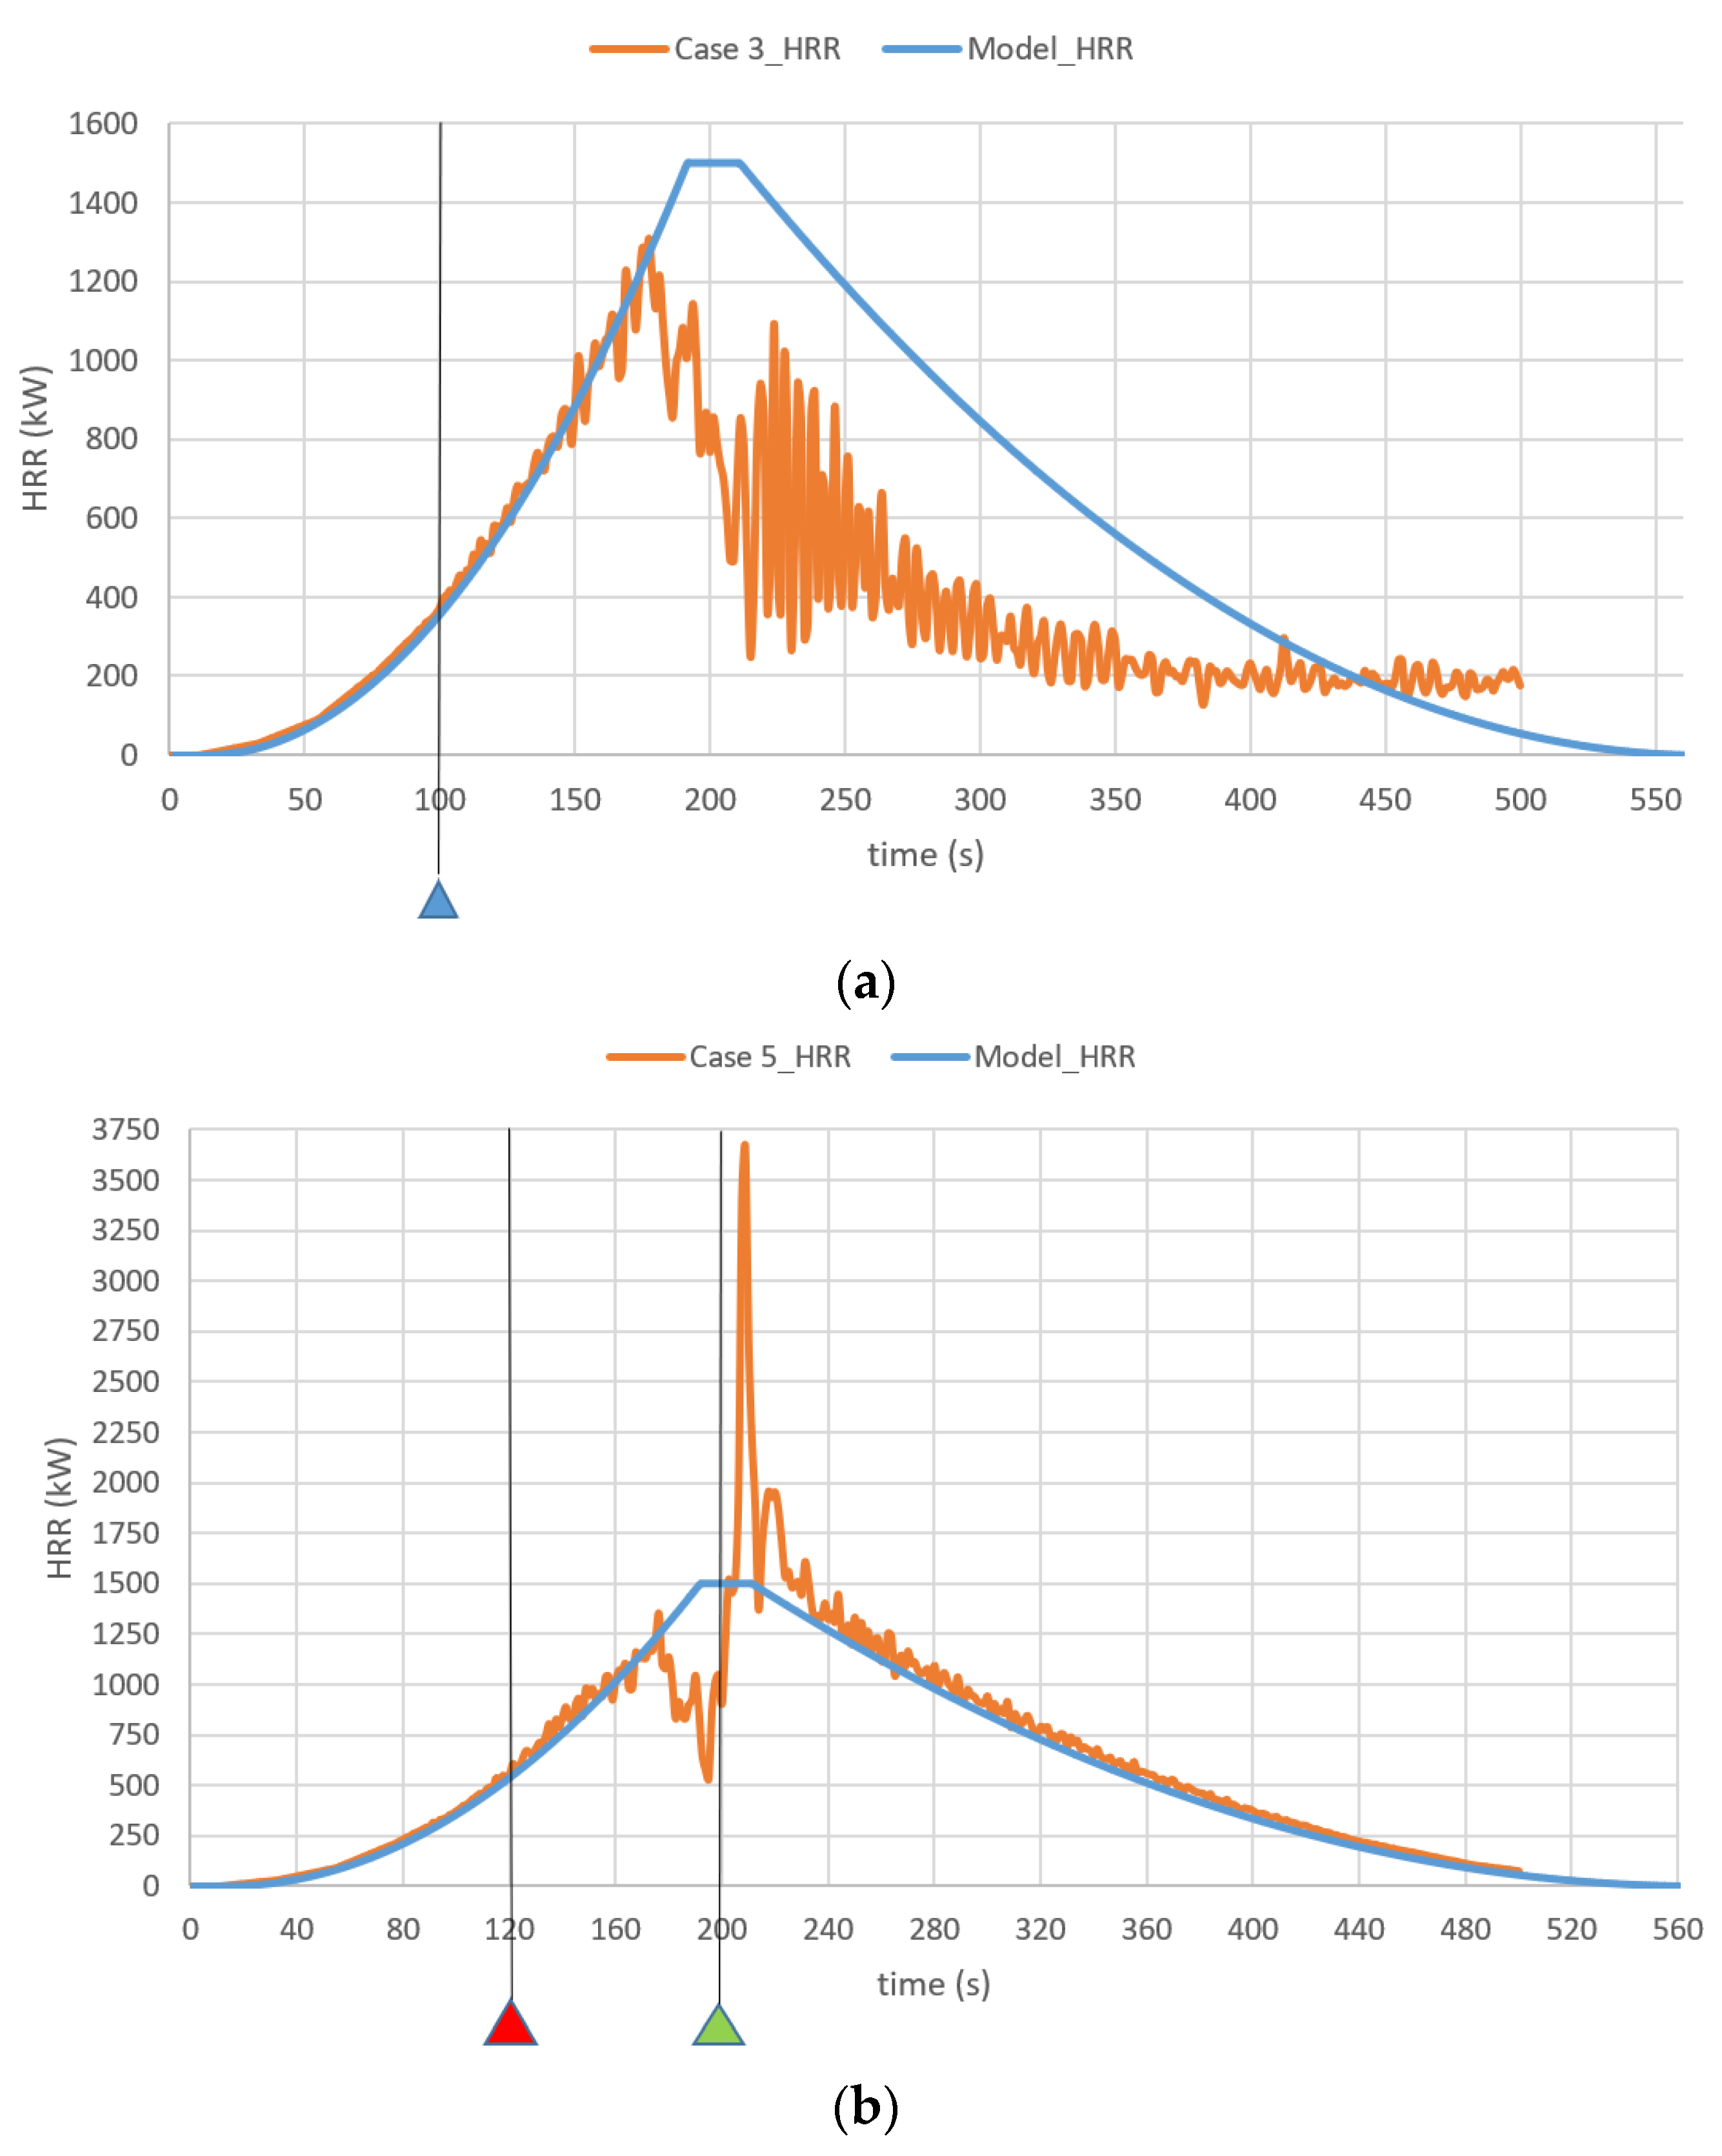
In cases 1, 2, 3, and 4, the fire was controlled by the ventilation,
, and the HRR did not follow standard test predictions (
Figure 7a). The characteristics of the fire, compartment volume, and geometry did not enhance the burning rate, the HRR max value was below the standard data predictions, and the fire was prolonged.
It is notable that there was a large amount of fluctuation in the HRR under all the ventilated conditions [
18].
In cases 5, 6, 7, and 8, at the time after 200 s when the fire was fuel-controlled,
, and the HRR followed the standard test predictions (
Figure 7b).
We assumed that the cause of the fluctuations in the HRR was oxygen deficiency flow, and the temperature in the lower layer below the smoke was fairly homogeneous. The gas temperature of the lower layer was above the temperature of the incoming air in the enclosure due to mixing as the air entered the vent and descended into the enclosure. This mixing effect could be inferred from the air entering above the height of the smoke layer in the compartment, as it had to entrain some smoke as it plunged to the floor. It formed a lower layer flow that sought out the fire. This mixing effect was responsible for less oxygen being brought to the fire and it competed with an increasing temperature to control the fire.
The described effect increased as the ventilation factor decreased. Under a ventilated enclosure, the fire would be sustained and reach the HRR according to the literature data. This indicates a difference between most of the data for burning materials in real fire conditions and standard test methods for measuring the HRR [
19].
The fire characteristics under ventilated conditions did not cause a flashover/backdraft in cases 1, 2, 3, and 4. Under ventilated conditions, the fire could be sustained or self-extinguished.
In cases 5, 6, and 8, a sudden increase in the ventilation factor did not cause flashover/backdraft [
20]. Case 7 had the same ventilation characteristics as case 8 with a different geometry (
Table 3).
FDS accurately predicted the increase in the ventilation factor, ventilation height, and ventilation delay due to an abrupt change in the ventilation at 400 s; this followed the occurrence of flashover/backdraft in case 7 at 411 s. The enclosure temperature was represented with a mean value for the front at the door with “temp. mean front”, at the middle of the model with “temp. mean middle”, and near the fire location with “temp. mean rear” (
Figure 8).
The geometry in case 7 was an open space similar to the “furnace” testing methods, which enhanced the homogeneous temperature distribution in the enclosure under ventilated conditions of a sustained fire and accumulated unburnt gases. After an abrupt change in the ventilation factor, those gases ignited and caused a flashover/backdraft at 411 s.
The side view of case 7 in
Figure 9 shows that the flashover/backdraft started on the opposite side of the fire location, at the door, which increased the ventilation factor.
In case 8, the partition wall increased the heterogeneity of the enclosure temperature and reduced temperature and the possibility of a flashover/backdraft (
Figure 8b and
Figure 9). In cases with a partition wall, the temperature was lower, and the heterogeneity increased (
Figure 10).
The outcome of the field model showed good agreement with Toxfire’s (a), Dalmarnock’s (b), and the Columbia UL Fire Safety Research Institute’s (c) fire test results:
- (a)
There was agreement that the HRR value decreased as the ventilation factor decreased; under ventilated conditions, this caused the HRR maximum to be below the assumed data. The HRR did not increase due to the enclosure’s geometry and ventilation because of the radiation impact [
21];
- (b)
There was further agreement in terms of the temperature heterogeneity of the enclosure [
22];
- (c)
Finally, there was agreement that the enclosure’s fires generated a fuel-rich environment [
23].
Some agreements arose due to experiments having unplanned realistic fire conditions, such as the unplanned breakage of windows or changes in the enclosure’s geometry.
5. Conclusions
The computations were not intended to model a specific scenario but rather to model an enclosure fire and focus on the effect of variations in the ventilation and geometry.
The standard test methods have the advantage of representing a worst-case scenario for a single element of construction, but they present a disadvantage in terms of the representation of a real fire in the enclosures.
There is a significant difference between real-situation fires and experiments carried out in specially designed rooms inside a shielded environment. The material data used for a well-ventilated condition will not apply due to changes in the ventilation factor and the enclosure’s geometry.
There is a need for better optimization of the experiments, as they will eventually require a more realistic set-up. Fire safety science needs to shift from using simplified models to field models that are more representative of a real fire and implement a performance-based approach for fire engineering. This approach will increase the safety of building occupants and fire emergency personnel and reduce the costs of fire protection and the construction of buildings.
Further research is required to generate a better understanding of the process of cold air injection into an enclosed space and how to entrain smoke and the flow of a deficient mixture of oxygen to the base of a fire.


