Article

Neural Network-Assisted Interferogram Analysis Using Cylindrical and Flat Reference Beams

by
Pavel A. Khorin
1,2,
Alexey P. Dzyuba
3,
Aleksey V. Chernykh
3,
Aleksandra O. Georgieva
3,
Nikolay V. Petrov
3,* and
Svetlana N. Khonina
1,2
1
Samara National Research University, 443086 Samara, Russia
2
Image Processing Systems Institute of RAS—Branch of the FSRC “Crystallography and Photonics” RAS, 443001 Samara, Russia
3
ITMO University, 197101 Saint-Petersburg, Russia
*
Author to whom correspondence should be addressed.
Appl. Sci. 2023, 13(8), 4831; https://doi.org/10.3390/app13084831
Submission received: 4 March 2023 / Revised: 7 April 2023 / Accepted: 9 April 2023 / Published: 12 April 2023
(This article belongs to the Special Issue Holographic Technologies: Theory and Practice)

Abstract

:
In this paper, we present the results of a comparative analysis of the sensitivity of interferograms to wavefront aberrations recorded with flat and cylindrical reference beams. Our results show that compared to classical linear interferograms based on flat wavefronts, cylindrical interferograms have at least 10% higher sensitivity for radially asymmetric types of aberrations and a 30% decrease in average absolute error for aberration recognition using a convolutional neural network. The use of cylindrical reference beams leads to an increase in the sensitivity of interferograms for detecting medium and strong aberrations.

1. Introduction

The task of measuring wavefront distortions is often encountered in optics, for example, in the design of ground-based astronomical telescopes, augmented reality systems, optical communication systems, industrial laser technology, medicine, etc. [1,2,3,4,5,6,7,8,9,10]. Almost always, the measurement of wavefront distortions is performed in order to compensate them, in particular, by means of adaptive or active optics [11,12,13,14]. The wavefront sensor is one of the main elements of the adaptive laser radiation correction system. Its task is to measure the aberrations of the wavefront and transmit the results of these measurements to the processing device. The main causes of wavefront aberrations are atmospheric turbulence [15], non-ideal shapes of the optical elements of the system, errors in system adjustment, etc. Today, there is a wide variety of wavefront sensors, including Shack-Hartman [16,17], pyramidal [18,19], fiber [20,21,22], and other sensors. One of the types of correlation sensors [23] are multiorder diffractive optical elements matched with the basis of Zernike polynomials [24,25,26].
Interferometry is one of the most accurate techniques for measuring wavefront aberrations [27]. However, it has its well-known limitations, such as the complexity of decoding interferograms and the sensitivity of the measuring equipment to vibrations. Traditionally, a flat wavefront has been used as the reference beam in interferometric sensors, as it allows for a simple algorithm based on the Fourier transform to be used for phase reconstruction [28,29]. Another area closely related to interferometry, where fringe demodulation techniques are also widely used, is fringe projection. Without using the interference principle for data recording, but at the same time actively using often identical data processing algorithms, these methods provide reliable information about the shape of objects. One of the current trends in further research aimed at improving these techniques is the optimization of the reference wave structure. Thus, it has recently been theoretically shown [30] that the optimal reference wave structure can be achieved by using circular-arc-shaped fringes centered at the epipole, providing the best phase sensitivities over the entire fringe pattern. In addition, it has been shown that the use of circular fringes in fringe projection profilometry is favorable since their central location serves as a good benchmark for shape reconstruction [31,32,33,34]. In addition, hexagonal stripes [35], gray-level coded patterns [36,37], and others are used. Returning to interferometry, it should be noted that in solving a number of problems, not only real but also virtual reference waves can be used [38,39].
Recent advancements in data mining and neural networks have enabled the extraction and recognition of the wavefront from both the intensity distribution [40,41,42,43,44,45,46] and real [47] and emulated [48] interference patterns. The current manuscript is a continuation of previous work [48], where neural networks were used to recognize the wavefront from conical interferograms. In that study, we utilized a system based on a digital micromirror device (DMD) and a technique for independent amplitude and phase modulation [49,50] to simulate the desired interference pattern with aberrations. In this work, two reference beams with a flat and cylindrical wavefront are considered to assess the sensitivity of the proposed interferograms. The use of reference beams with cylindrical wavefronts in the formation of interferograms is studied in order to improve the recognition of aberrations using a convolutional neural network.
Notably, the better the interferogram reflects the features of various aberrations, the more efficiently the recognition algorithm will work. In addition, it is necessary that the patterns corresponding to different types and levels of aberrations differ markedly. This possibility can be implemented in interference methods by choosing the type of reference beam.

2. Materials and Methods

2.1. Theoretical Foundations

Consider the Zernike circle polynomials, which are the complete set of orthogonal functions on a circle of unit radius [51]:
Z n m r , φ = n + 1 π r 0 2 R n m r cos m φ sin m φ ,
where R n m r is the Zernike radial polynomials, m and n are integers,
R n m r = s = 0 n m / 2 1 s n s ! s ! ( n + m ) / 2 s ! ( n + m ) / 2 s ! r r 0 n 2 s ,
A n is the normalizing factor:
A n = n + 1 π .
Wavefront aberrations encountered in optical systems are usually described in terms of Zernike functions as follows:
E W r , φ = exp i W r , φ ,
W r , φ = 2 π n = 0 n max m = 0 n c n m Z n m r , φ ,
where cnm is the weight of the wavefront aberration,
The interference of two fields is registered by the intensity of the following distribution:
I x , y = E W x , y + E B x , y 2
where E W x , y is analyzed field, e.g., aberrated wavefront, E B x , y is the reference beam.
As a reference beam, as a rule, some standard wavefronts are used (for example, flat, spherical, or vortex):
E B x , y = exp i B p x , y
In this paper, we consider two types of reference beams: a flat tilted beam (Figure 1) B p = 1 x , y = α x + β y (p is the reference beam type; α, β are parameters that determine the beam tilt angle), and a cylindrical beam (Figure 2) B p = 2 x , y = α x 3 (α is the parameter that determines the angle of inclination of the cylindrical front to the optical axis). The choice of the cubic beam type is related to its wide use in recent years for wavefront coding in order to increase the depth of focus [51,52,53,54].
Thus, in the case under consideration, the intensity of interferograms (6) is proportional to the following expression:
I p x , y 1 + cos W x , y B p ( x , y )
Furthermore, the frequency of the interferogram fringes will mainly depend on the parameters of the reference beam, and the complexity of the pattern being formed is determined both by the type of reference beam and by the aberration of the wavefront.
In order to quantitatively estimate the sensitivity of recognition of the types of interferograms under consideration, we introduce the parameter S, which corresponds to the value of the root-mean-square error (RMSE) of the p-type interferogram formed by an aberrated wavefront I p ( x , y ) , from the interferogram corresponding to the absence of aberrations I 0 p ( x , y ) :
S p = I p ( x , y ) I 0 p ( x , y ) 2 d x d y / I 0 p 2 ( x , y ) d x d y
Increasing the deviation for one type of interferogram compared to another should lead to an increase in recognition efficiency. This assumption is confirmed by the more stable recognition of interferograms with a conical reference wave compared to a flat reference wave [48]. For clarity, the value Δ is introduced as the sensitivity of interferogram recognition by machine learning methods:
Δ = ( S 2 S 1 ) / c n m
corresponding to the difference in RMSE values of cylindrical (p = 2) and linear (p = 1) interferograms and average sensitivity:
Δ ¯ = ( S ¯ 2 S ¯ 1 ) / c n m
where S ¯ p = q = 1 Q S p q , p is the interferogram type, q is the aberration type, and Q is the number of considered aberrations (Q = 8) for different types and levels of aberration. If Δ ≥ 0, then the sensitivity of the cylindrical interferogram is higher than the linear one; otherwise, the sensitivity is lower.
For clarity, the information content parameter is introduced as
E = S ¯ 2 / S ¯ 1 1
for cylindrical and linear interferograms for different types and levels of aberrations with a variation of the parameter α, which shows how many times one type of interferogram is more effective for recognizing aberrations from interferograms using convolutional neural networks.

2.2. Optical Setup

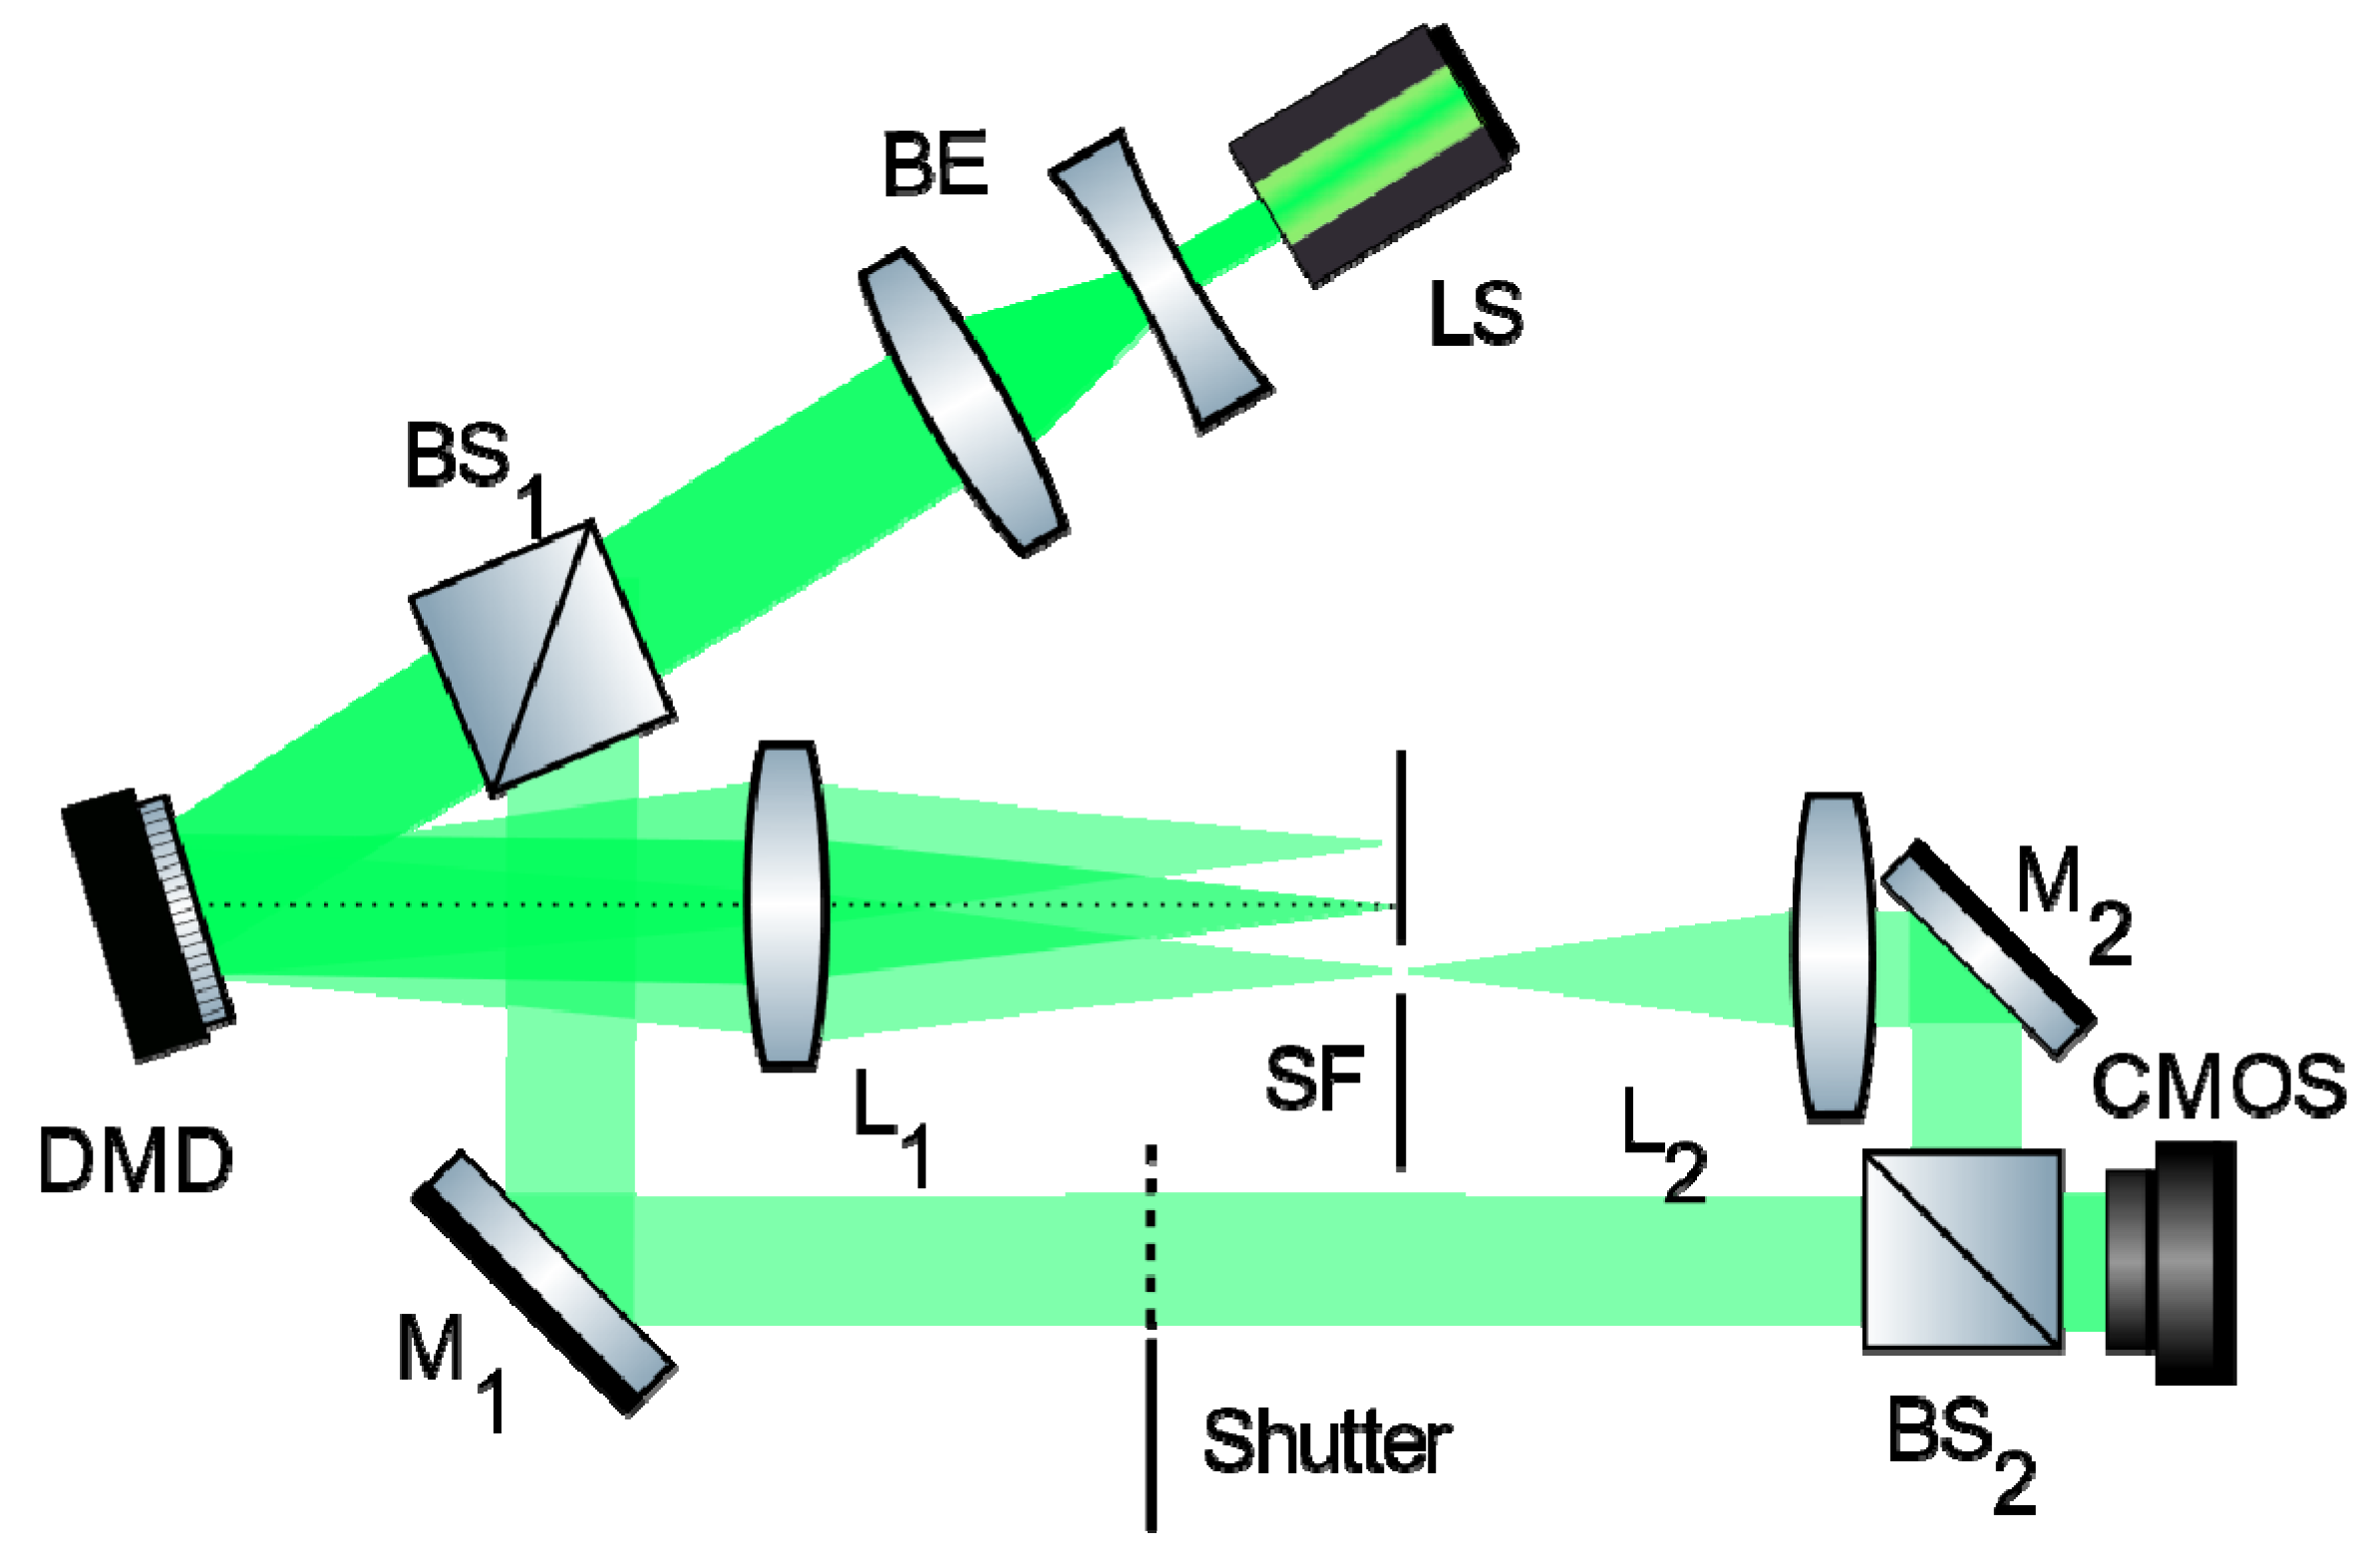
Our work employed the experimental setup (Figure 3) based on a Mach-Zehnder interferometer with the digital micromirror device (DMD) and the Fourier-plane filtered 4f-system [49,50] in one of its optical paths. The reference beam in the second optical path of the setup was utilized to monitor the phase distribution of the optical field formed by the DMD and 4f-system. Each of the optical paths of the interferometer was blocked by an opaque screen (shutter) according to the conditions of the experiment.
The DMD device allows only binary modulation. In our experimental setup, the Texas Instruments Light Crafter DLP6500FYE binary modulator (1920 × 1080 pixels with a size of 7.56 μm) operated by the DLPC900 controller was used. Each micromirror is located on a corresponding cell of the CMOS matrix and can be in one of two positions, +β or −β, which correspond to logical 1 and 0, respectively. Despite the binary limitation, it is possible to achieve independent amplitude-phase modulation by conjugating the DMD with an input plane of the 4f-system with spatial Fourier filtering. We used the method of obtaining independent amplitude and phase modulation from binary Lee holograms [55] to generate the patterns. This independent wavefront modulation of the amplitude and phase greatly expands the possibilities of the experiment. The standard two-arm interferometer scheme is a straightforward option, where the object arm contains a DMD for shaping the wavefront with predefined aberrations, and the reference beam containing a flat wavefront is directed to the matrix photodetector by the beam splitter. Another option is to use a single-arm scheme for forming interferograms with predefined aberrations and the reference beam, which simplifies the system and increases experiment accuracy and vibration resistance.
In the single-arm scheme, two beams with different amplitude and phase configurations can be implemented simultaneously using the same pattern on the DMD, in which the interference field of these beams is encoded. If one of these beams has a different wavefront tilt from the other, they can be spatially separated in the Fourier plane of the 4f-system. Figure 4 shows the Fourier spectra for the instances where the field is generated with the quadrafoil aberration (c44 = 1) (a) and its interference field with the plane tilted wave α = 10π (b) and α = 50π (c). The separation of diffraction suborders (Figure 4b,c) proves the formation of the interference pattern in a single-arm scheme is physically identical to the classical two-arm interference. The presence of wavefronts with quadrafoil aberration and linear tilt in the diffraction suborders was confirmed in the two-arm scheme with sequential blocking of each of them.
In our experimental setup, interferograms for the training of the neural network were formed only in the objective beam (the single-arm scheme), and the reference beam was used to validate the correct phase distribution, as shown in Section 3.2. The amplitude-phase distributions with a given type and level of aberrations were encoded into binary patterns as the sum of the complex fields of the wavefront aberration and the reference beam: Ew(x, y) = EB(x, y).
In order to experimentally confirm the coincidence between the interferograms synthesized in the single-arm scheme and the classical two-arm scheme with further quality estimation, the following experiment was performed. The interference fields of the plane tilted wave and complex wave containing the quadrafoil aberration synthesized in the single-arm scheme as well as the interference fields of the synthesized complex wave containing the quadrafoil aberration and the reference plane wave in the two-arm scheme were recorded. The local least squares method was applied to demodulate the interference fringes [56,57]. Figure 5 demonstrates the target amplitude and phase distributions encoded in the DMD pattern, the interferograms for single-arm and two-arm schemes, and the corresponding reconstructed phases.
The reconstructed phase distribution quality for the low carrier frequency interferograms (α = 10π and α = 14π) is lower than for the high-frequency case (α = 50π). This is due to the limitation of the reconstruction method, the main condition for it is that the object wave has smaller local variations than the reference wave. Therefore, in some cases, with a small angle of inclination of the reference wavefront to the optical axis of the interferogram, there may be a deterioration in the quality of the object wavefront reconstruction. Nevertheless, the low carrier frequency does not have a negative impact on the ability of the neural network to recognize aberrations.
The reconstructed phase distributions in Figure 5 have less smooth phase variation in the center of the distributions compared to the target phase distribution. This effect is caused by the limitations on quantization levels induced by the Lee holography method and amplitude-phase modulation with DMD [50]. Root mean square error (RMSE) was used as a quality metric for reconstructed phase distributions. The table under Figure 5 shows RMSE values for the phase distributions obtained for single-arm and two-arm schemes with respect to the target phase distribution. The error for interferograms with α = 10π and α = 14π is higher than for interferograms with α = 50π due to the difficulty of demodulating such interference fringes. With the single-arm scheme, there was a decrease in RMSE of 0.12 rad in the case of a high-frequency interferogram and by 0.08 rad in the case of a low-frequency interferogram compared to the results obtained with the two-arm scheme. It can be explained by additional factors affecting the quality of reconstruction in the two-arm scheme, such as the quality of the reference wavefront, induced by imperfections of optical elements in the reference arm, and external vibrations, which cause changes in the angle between the reference and object waves. The quality of the phase distributions is higher due to the elimination of additional artifacts introduced by the second arm of the interferometer.
In summary, the quality of the reconstructed object wavefront from interferograms in our scheme is affected by: (1) the quality of the wavefront; (2) the modulation error of the target distribution; and (3) the reconstruction error of the object wavefront. In the case of a two-arm scheme, the quality of the reference wavefront and vibrations, which can cause dynamic changes in the angle between the reference and object waves during registration, is also influenced. In addition, the formation of interference fields with low carrier frequency and their further demodulation is simpler from the experimental point of view in the single-arm scheme. Therefore, we experimentally verified the capability of the single-arm scheme to generate interference fields used to train a neural network for aberration recognition. It was also shown that the use of a single-arm scheme for generating such interference fields allows us to provide a better quality of the object wavefront compared to the two-arm scheme.

2.3. Neural Network

For this work, a neural network architecture based on Xception was used [58,59,60]. A distinctive feature of this model is the use of depthwise separable convolution.
Since we are dealing with a regression problem, the use of such metrics as accuracy, confusion matrix, and other metrics applicable to classification problems is not possible. To control the accuracy in this case, the mean absolute error function was used as a loss function. The training of the neural network was implemented using a Nvidia Tesla K80 video card with 12 GB of built-in DDR5 video memory. Libraries for machine learning—the Keras package. The essence of the “depthwise separable convolution” method is to split the transformations over the input tensor on each layer into two stages:
-
at the first stage, the tensor is convoluted with a 1 × 1 kernel. This operation is called “pointwise convolution.”
-
at the second stage, standard convolution is performed. After that, the results of the convolution of the tensor obtained as a result of applying the “pointwise convolution” operation to the input tensor are summed up with all the filters of the layer and form the output tensor of the layer. This operation is called “depthwise convolution.”
This technique allows you to significantly reduce the number of weights in the neural network, which significantly affects the learning rate required for training resources and the weight of the pre-trained model. Thus, the Xception architecture (Figure 6) is the best choice, providing sufficient training accuracy while requiring significantly fewer resources.
Since the given problem is a regression problem and the Xception architecture was developed to solve the classification problem, the original architecture was modified. One fully connected layer was added, the dimension of which is equal to the number of Zernike functions (chosen to be 8).
To obtain continuous values of the predicted coefficients, a linear activation function was used. To improve the convergence of the optimization algorithm, the network architecture was supplemented with a dropout layer in front of the output semi-connected layer.
For each type of interferogram, a data set was prepared corresponding to the superposition of two aberrations. The dataset consists of 6000 images. 4000, 1000, and 1000 images were used for training, testing, and validation, respectively. The value of cnm in the range from 0 to 1 and the type for the superposition of two aberrations were chosen randomly. Single-channel images of 299 × 299 pixels of two types were fed to the input of the neural network: linear interferograms as well as cylindrical interferograms.

3. Results

3.1. Numerical Simulation

We consider the formation of a linear and cylindrical (cubic) interferogram with the reference beam tilt angle α divisible by 2π, thus matching the frequency parameter of the interferogram with the value of the phase shift of the reference beam transmission function. Figure 1 and Figure 2 show that the parameter α becomes consistent with the phase shift at a multiplicity of 2π. Thus, the phase passes values from 0 to 2π α/π times, and, accordingly, the ideal interferogram (Z00) in the resulting plane will be represented as α/π full interference fringes.
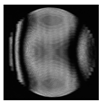
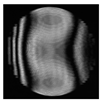
The interferograms for each of the aberrations up to the 4th order were calculated. Table 1 shows the patterns of the considered interferograms at α = 2π for aberrations in the form of separate Zernike functions.
As can be seen from the interferograms shown in Table 1, the cylindrical interferogram is less sensitive to weak aberrations, however, both types demonstrate significant differences in patterns (distortion of interference lines) at high levels of aberrations ( c n m = 0.5 ), i.e., they can be successfully used to analyze aberrations in a situation where expansion in terms of Zernike functions leads to noticeable recognition errors [61].
Consider a cubic interferogram using the example of a coma-type aberration Z31 with an aberration value c n m = 0.5 and different values of the tilt angle parameter of the reference cylindrical beam α (Figure 7).
It should be noted that the use of a reference cylindrical beam, in contrast to a flat beam in interferograms, leads to a complication of the intensity distribution pattern with an increase in the alpha α. This consideration is detailed in the Section 4.
It is assumed that interferograms using a structured reference beam corresponding to a cylindrical (cubic) carrier make it possible to form a more complex pattern of intensity distribution (especially in the peripheral part) in the resulting plane of the optical system under study and make it possible to more accurately detect and interpret aberrations in analyzed wavefronts, including by training neural networks.
For each type of interferogram, a data set was prepared corresponding to the superposition of two aberrations. The value of cnm in the range from 0 to 1 and the type for the superposition of two aberrations were chosen randomly. Examples of generated linear and cylindrical interferograms for various types and levels of aberrations with a variable parameter α are presented in Table 2.
Table 2 shows that the tilt angle of the flat reference beam α significantly affects the structure of the linear interferogram pattern. However, the image of a cylindrical interferogram retains its structure, with noticeable changes only in the peripheral part. This property of the proposed cylindrical interferogram gives an advantage in deciphering and unambiguously interpreting aberrations in the analyzed wavefront. In turn, unambiguity can help reduce errors in recognizing aberrations of the analyzed wavefront from interferograms with machine learning methods and neural networks.

3.2. Experimental Formation of Interferograms

Table 3 and Table 4 show examples of experimentally obtained linear and cylindrical interferograms for various types and levels of aberrations. Since conical interferograms showed [48] a significant difference in sensitivity for high-frequency and low-frequency types, both types were used in the analysis of experimental patterns.
As can be seen from the interferograms given in Table 4, both types demonstrate significant differences in patterns (distortion of interference lines) at high levels of aberrations ( c n m = 0.5 ) and are highly consistent with the results obtained in numerical simulation.
The interferograms were obtained in the single-arm scheme (see Figure 3, with the reference beam arm blocked by the shutter). The interference of the two fields was encoded in the pattern calculation, which was supplied to the DMD modulator. This approach simplifies the registration of complex distributions and avoids the influence of vibrations. In order to confirm the physical analogue of the amplitude-phase field distribution for the single-arm scheme, the second arm of the experimental setup was engaged, and the interference distributions of the interferogram and the tilted plane wave were recorded. Table 5 shows the model and reconstructed phase distributions, the cylindrical interferograms for the angle α = 6π with different types of aberration superposition.
Since a complex interference field of two beams containing amplitude and phase distributions is encoded on the DMD to form interferograms, a two-arm interferometer scheme was used to control the resulting phase distributions.
A set of digital interferograms was recorded for each DMD pattern containing aberration for further averaging. Processing of the digital hologram series was performed as follows: The phase was reconstructed from the set of holograms for one DMD pattern by the local least squares method. The phase distributions were multiplied by a binary mask to ensure that noise was excluded in further processing. The phase difference between the fields recorded with and without the introduced aberration was then calculated. Next, two stages of averaging the phase difference distributions were performed to eliminate the reconstruction error associated with external vibrations. The first stage of averaging consisted of calculating the mean value for each distribution and subtracting it from the corresponding phase. The second step was to calculate the arithmetic mean of the entire set of phase distributions for one pattern.
Table 5 shows the model and reconstructed phase distributions, the cylindrical interferograms for the angle α = 6π with different types of aberration superposition. The reconstructed phase distributions in Table 5 obtained from experimental interferograms with a two-arm scheme match with the simulated phase distributions with the error of the object wavefront reconstruction method and distortions induced by imperfections of the experimental scheme such as beam quality and interference fringes period instability. The results confirm that complex interference fields were obtained with the amplitude-phase modulation technique [50].

3.3. Neural Network Training

The neural network based on Xception [58,59,60] architecture was trained using a dataset corresponding to the superposition of two aberrations (6000 images: 4000, 1000, and 1000 images were used for training, testing, and validation, respectively), examples of which are presented in Table 2.
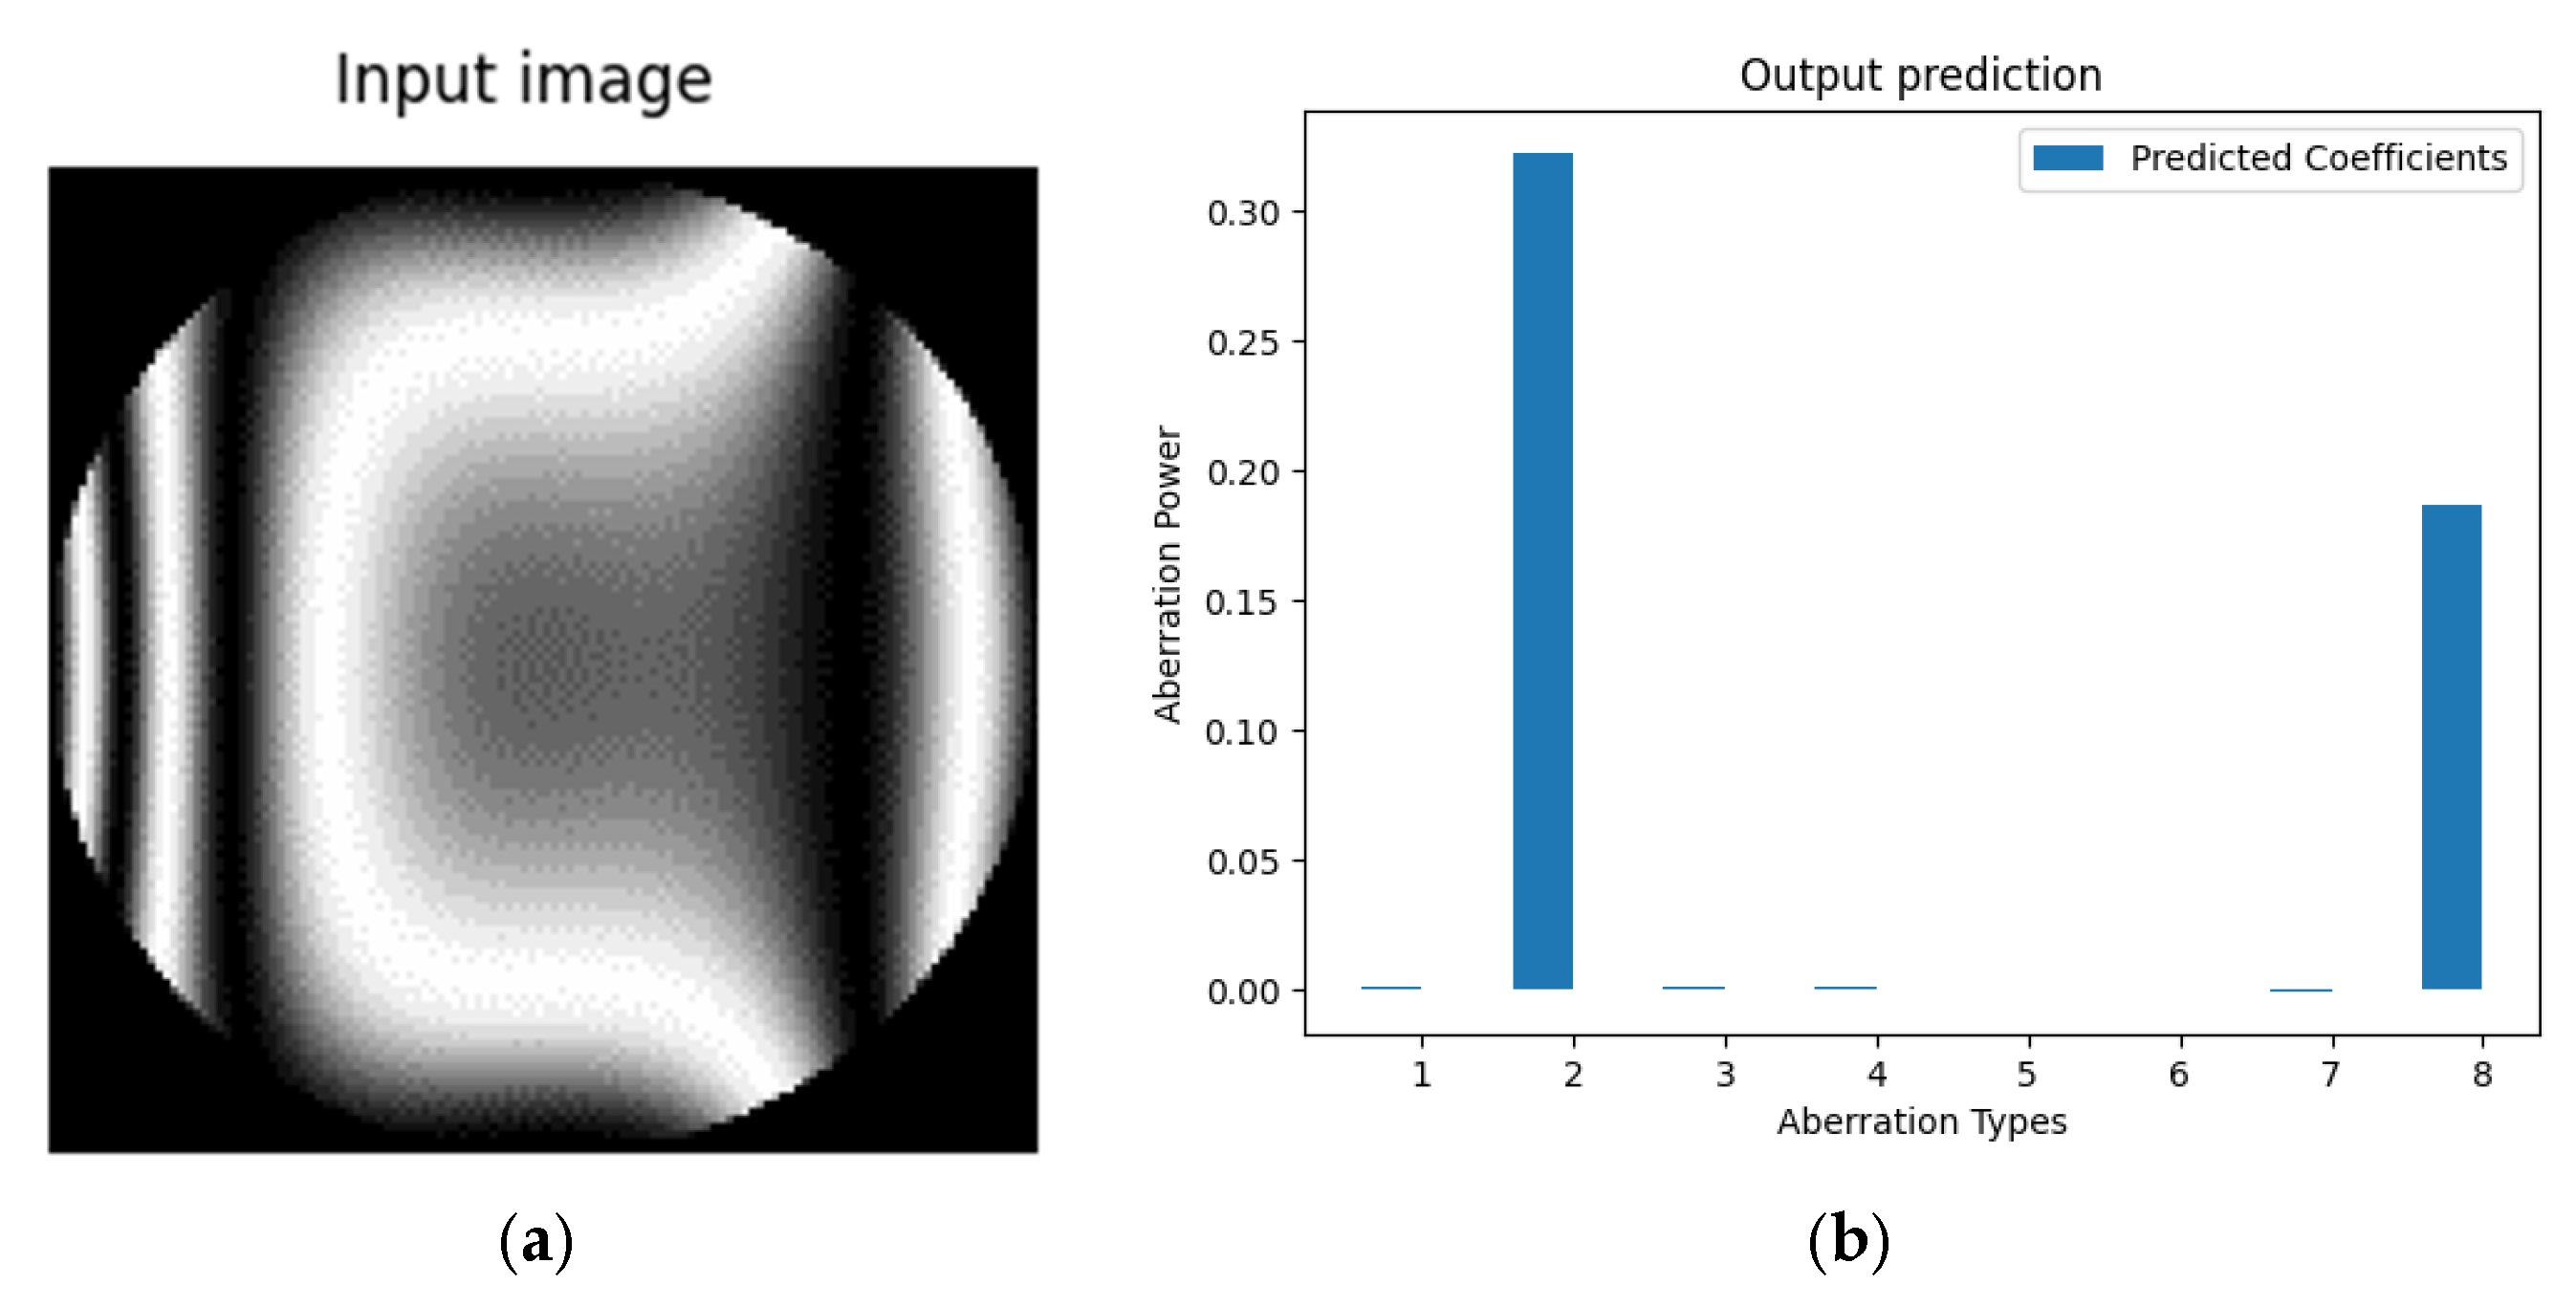
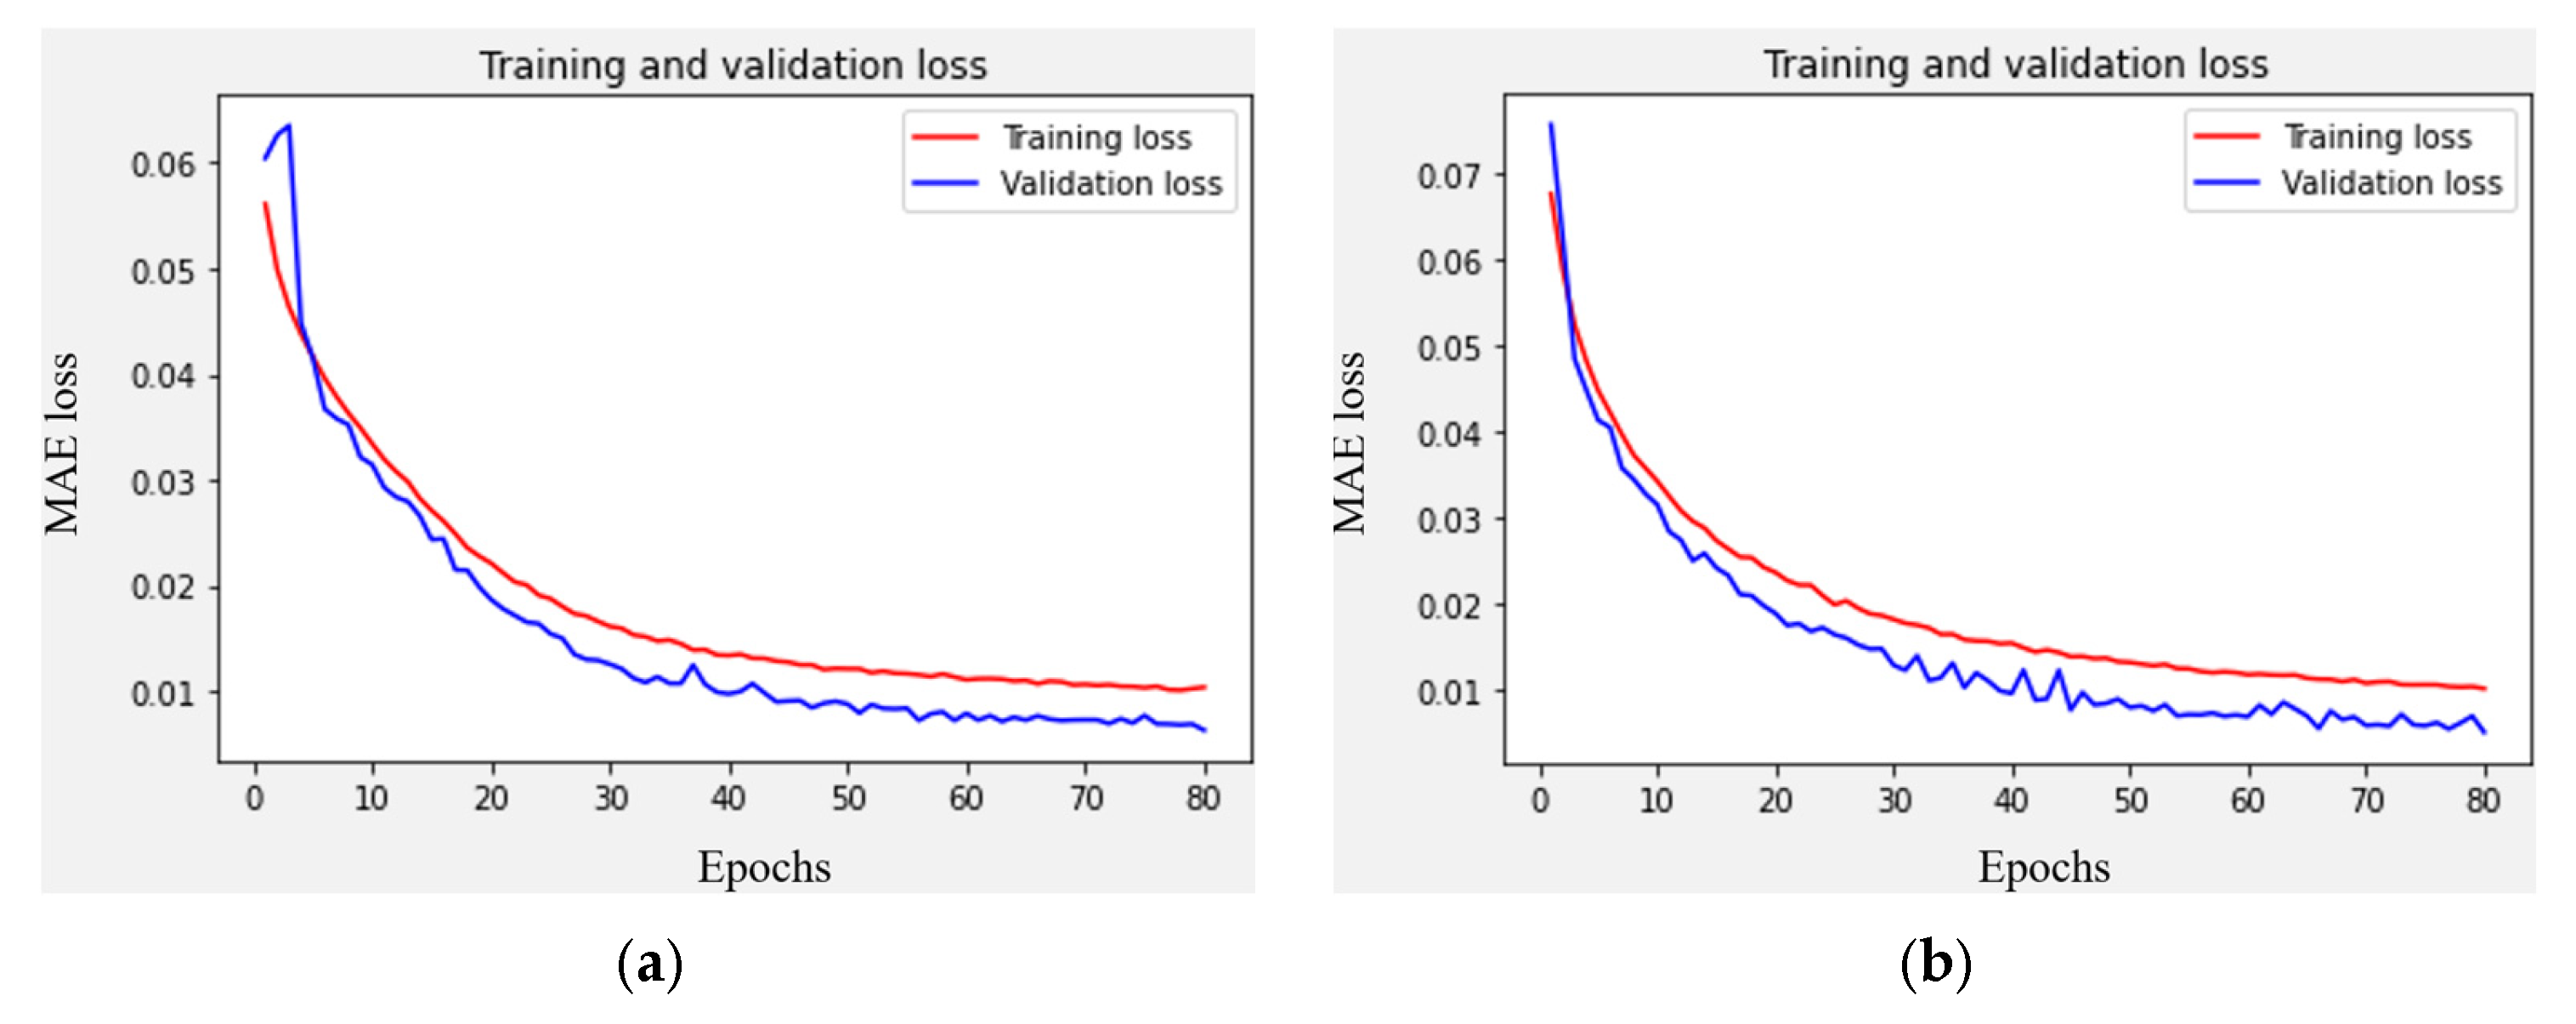
Upon completion of the learning process lasting 80 epochs for the mean absolute error (MAE) function, results were obtained on linear-type and cylindrical-type interferograms (Figure 7) with the parameter α = 2π. As a result of this learning process (Figure 8b), we get a model capable of making a prediction in the form of an array of eight elements, where each element corresponds to a level (or power) of an aberration type cnm. Predictions are made using only an image of an interferogram as input (Figure 8a).

3.3.1. Modeling Dataset

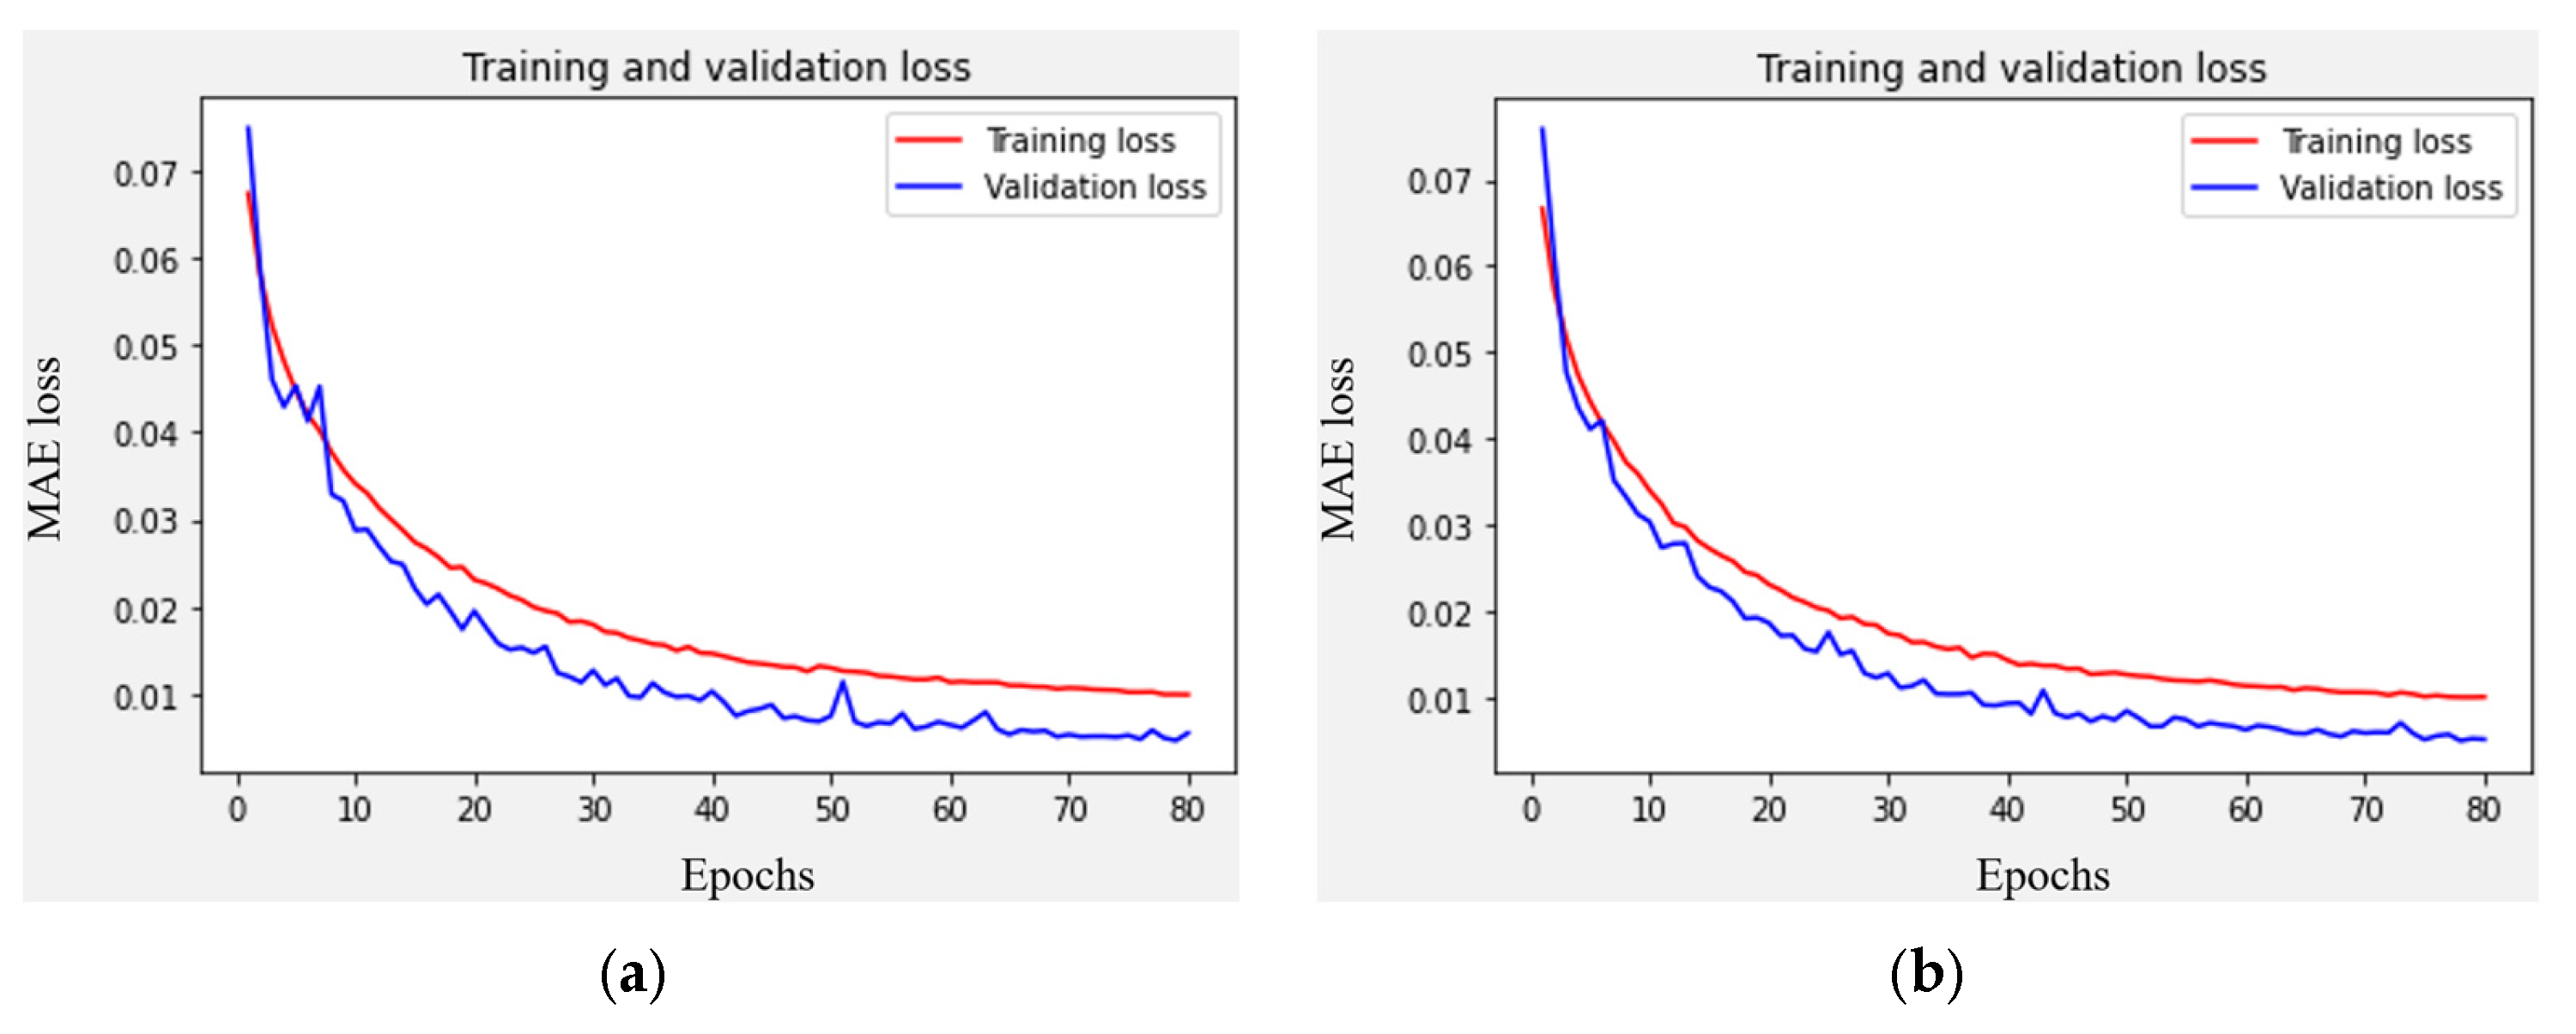
In several numerical experiments, the recognition errors of the superposition of aberrations were obtained from interferograms with a tilt angle of the reference beam in the range from 2π (Figure 9) to 6π (Figure 10). The results are presented in Table 6.
It has been found that a cylindrical interferogram makes it possible to reduce the aberration recognition error by 25% compared to a linear one, regardless of the beam tilt angle α. Moreover, it is confirmed that the recognition error is linearly related to the calculated parameter (informativeness) based on the RMSE of the reference interferogram compared to the aberrated one.
Thus, the use of cylindrical interferograms makes it possible to improve the results of the recognition of types and levels of aberrations—the average absolute error decreases by more than 30% (from 0.0068 for linear interferograms to 0.0047 for cylindrical interferograms).

3.3.2. Experimental Dataset

The neural network based on the Xception [58,59,60] architecture was trained using a dataset consisting of experimentally obtained interferograms corresponding to the superposition of two aberrations. A fragment of the dataset is presented in Table 4 and Table 7.
In several numerical experiments, the recognition errors of the superposition of aberrations were obtained from experimental cylindrical interferograms with a reference beam tilt angle in the range from 2π to 6π (Figure 11). The results are presented in Table 8.

4. Discussion

In this section, we discuss the relationship between an increase in the sensitivity of interferograms due to the structural complexity of the reference beam and a decrease in MAE recognition by the neural network.
In order to quantitatively estimate the sensitivity of recognition of the interferogram under consideration, we calculate the values of the parameters S1 and S2, which correspond to the value (9) of the RMSE of the p-type interferogram formed by an aberrated wavefront I p ( x , y ) , from the interferogram corresponding to the absence of aberrations I 0 p ( x , y ) .
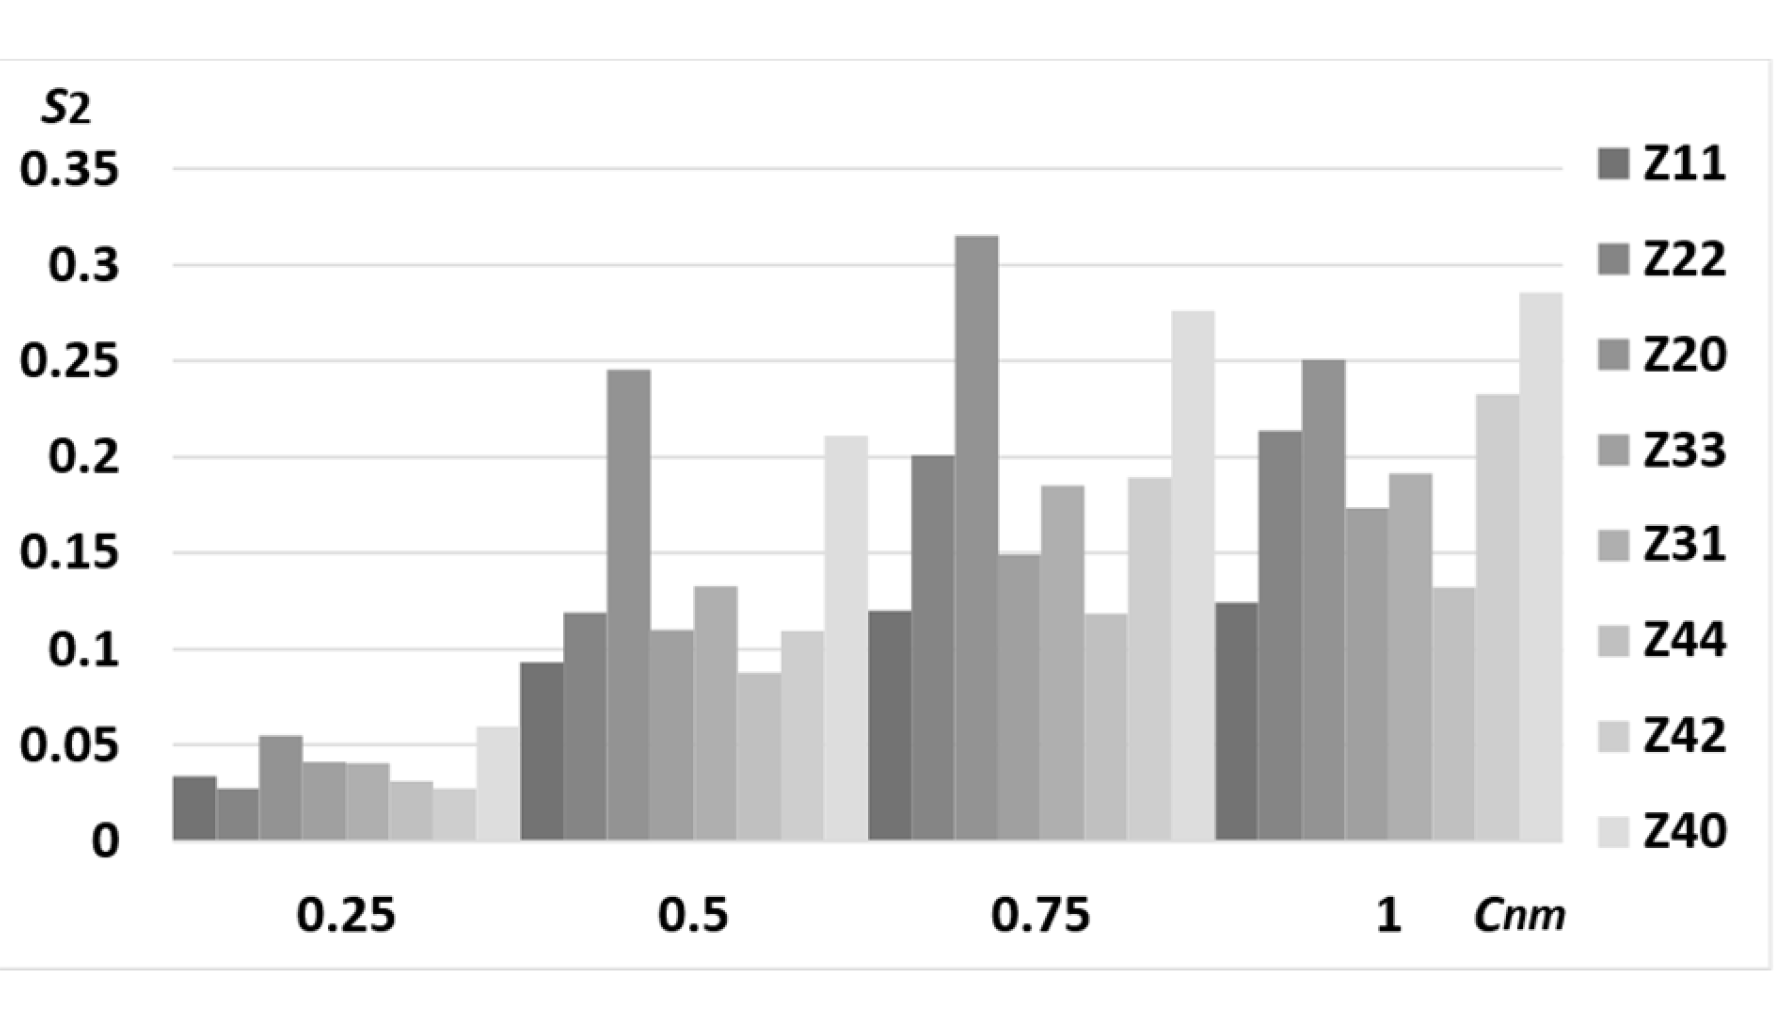
Figure 12 shows the RMSE values (9) of standard (without aberrations) cylindrical interferograms compared to aberrated ones. On average, the RMSE has a uniform distribution among the first 8 types of aberrations, except for radially symmetric ones. For aberrations of the Z20 и Z40 types, corresponding to defocusing and spherical aberration, an almost twofold increase in the RMSE is observed over the entire range of cnm from 0.1 to 1.
Figure 13 shows the average values of the RMSE of linear and cylindrical interferograms. It has been found that the RMSE increases with an increase in the aberration level cnm and barely depends on the tilt angle of the reference beam α. However, for cylindrical interferograms, the best sensitivity is at α = 4π–6π, while for a flat reference beam at α = 2π. This narrows the applicability range of a flat reference beam. In addition, at levels of aberration cnm ≥ 0.5, the sensitivity of cylindrical interferograms is higher than that of linear ones.
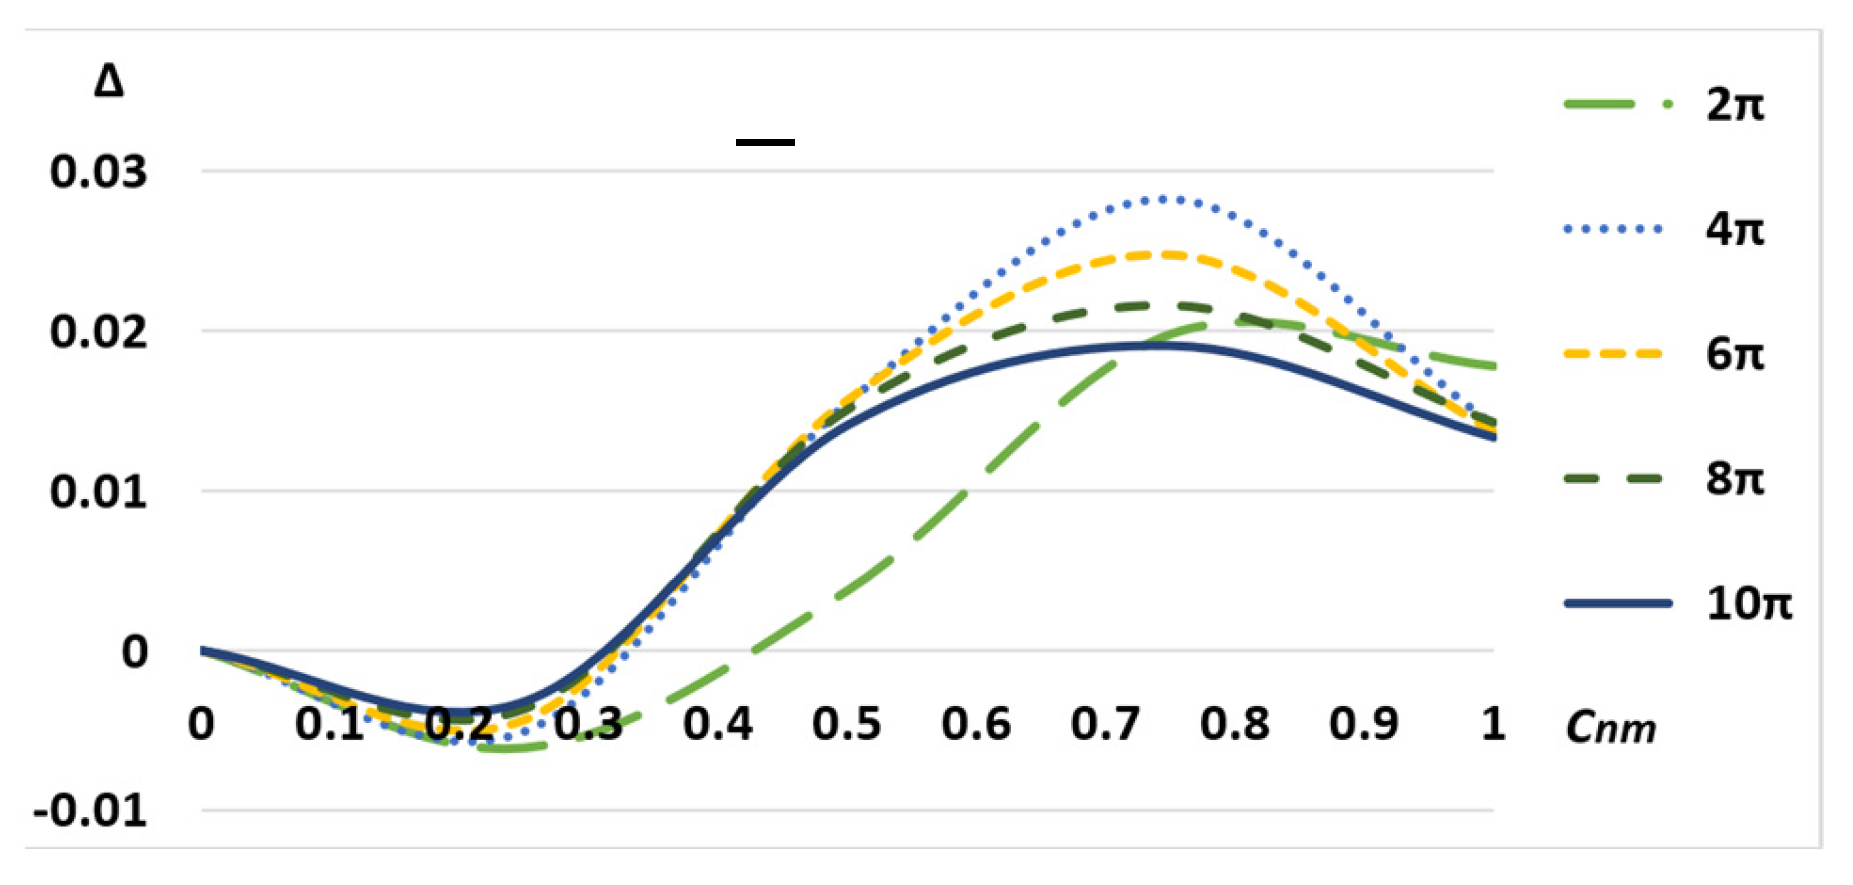
For clarity, the value Δ is introduced—the sensitivity of interferogram recognition by machine learning methods (11): if Δ ≥ 0, then the sensitivity of the cylindrical interferogram is higher than the linear one, otherwise the sensitivity is lower.
Figure 14 shows diagrams of the average sensitivity for various types of aberrations (Q = 8) in cylindrical and linear interferograms with variations in the parameters α and cnm. It can be seen from the graphs in Figure 14 that, for small aberrations, the cylindrical interferogram is less sensitive than the linear one. The cylindrical interferogram is more sensitive than the linear one for aberrations with levels of cnm ≥ 0.3.
For clarity, we will calculate the information content (12) of cylindrical and linear interferograms for different types and levels of aberrations with a variation of the parameter α, which shows how many times one type of interferogram is more effective for recognizing aberrations from interferograms using convolutional neural networks.
With an average value of aberrations, 0.3 < c n m < 0.7 cylindrical interferograms are more sensitive than linear ones, regardless of the parameter α. At high levels of aberrations, c n m > 0.7 cylindrical interferograms are also consistently more sensitive than linear ones.
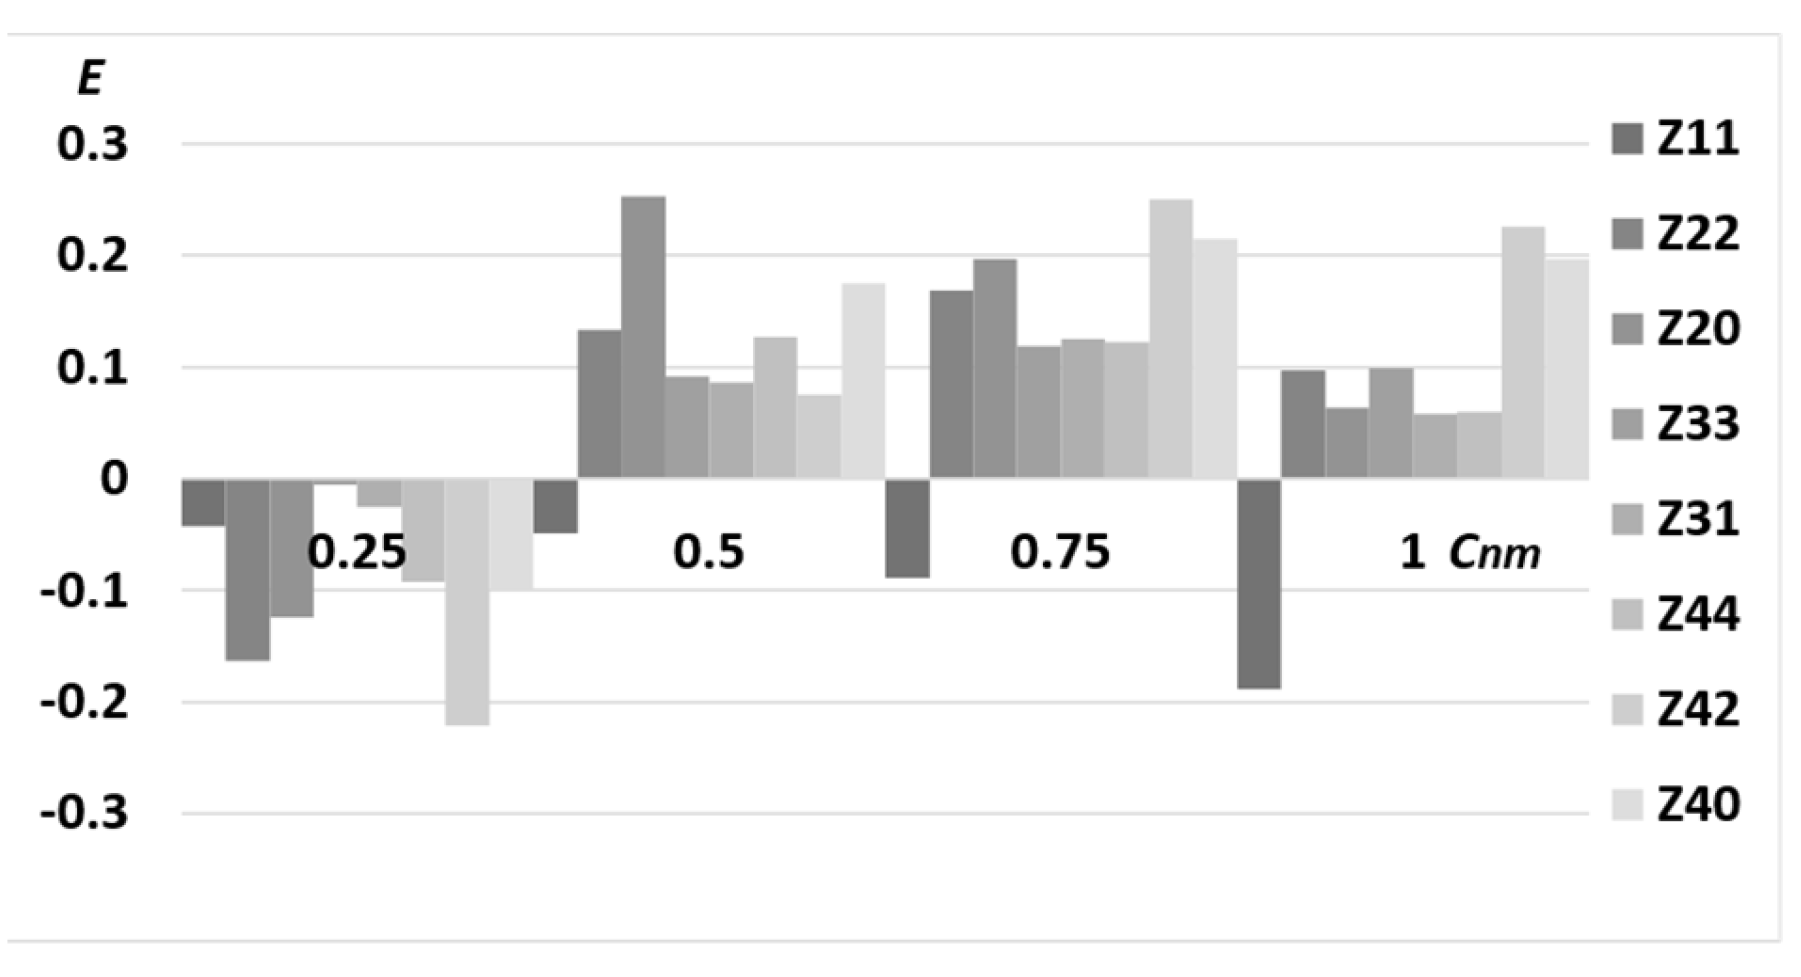
Figure 15 shows diagrams of information content (12) E of cylindrical and linear interferograms for different types and levels of aberrations with variations in the parameter α.
Thus, the maximum information content of cylindrical interferograms is achieved when detecting medium (≥0.5) and strong aberrations (>0.7). In this case, the cylindrical interferogram is 15% more informative than the linear one. The average information content in detecting medium and strong aberrations, regardless of the frequency of the interferogram, is 9%.
A 15% increase in information content parameter (Figure 16) for certain wave aberrations is shown (defocusing, astigmatism, spherical aberration, and 2nd order astigmatism) when used as a reference beam, a cubic cylindrical wavefront instead of a flat wavefront. Moreover, the use of cylindrical interferograms makes it possible to improve the results of neural network recognition (Table 6). The average absolute error decreases in the range of 20% to 30%.
It is worth noting that, among the limitations of the proposed approach, one can single out the influence of noise and other artifacts that affect the accuracy of the results of the recognition of aberrations. In addition, a reference plane beam can be easily created experimentally, and any structural reference beams (including those with a cylindrical wavefront) require additional optical elements, which is also a limitation of the interference method.
Thus, we can talk about some correlations between sensitivity and MAE recognition by the neural network. This makes it possible to predict which types of reference beams will give the best result before training the neural network.

5. Conclusions

A study was made on the sensitivity of interferograms formed using structured reference beams with a flat and cylindrical wavefront. The maximum sensitivity of cylindrical interferograms is achieved by detecting medium and strong aberrations. In this case, the cylindrical interferogram is more sensitive than the linear one by 0.03. The average sensitivity for detecting strong aberrations, regardless of the tilt angle α, is 0.025.
The increased sensitivity and information content of the proposed interferograms compared to classical (linear) ones based on a flat wavefront is confirmed by a decrease in the RMSE values and an expanded range of reference beam parameters, which allows more accurate tuning of the wavefront sensor to a specific range of the level of wave aberration.
The use of reference beams with cylindrical wavefronts is proposed to improve the recognition of aberrations from interferograms using convolutional neural networks. The sensitivity of interferograms (the change in the aberrated interferogram relative to the reference one) when using a cylindrical reference beam increases by at least 10% compared to a flat reference beam for radially asymmetric types of aberrations, and the mean absolute error of aberration recognition decreases from 0.0068 to 0.0047.
A comparative analysis between the use of a flat and cylindrical reference beam for wave aberration recognition from interferograms using neural networks showed that the average absolute error is reduced by more than 30%.
It should be noted that a cylindrical interferogram with a reference beam tilt angle α in the range from 2π to 6π turned out to be 15% more efficient than a high-frequency conical interferogram. This conclusion was made on the basis of data on the mean absolute recognition error [48] of conical interferograms.
Considering that optical interferometry is already widely used in many applications, such as precision measurements, astrophysics, seismology, quantum informatics, biomedical imaging, and digital contouring and deformation analysis in mechanics, an extension of the method with the help of various reference beams in combination with intelligent data analysis will preserve the advantages of the wavefront sensor and eliminate some of the disadvantages, depending on the specific application task.

Author Contributions

Conceptualization, P.A.K. and S.N.K.; methodology, P.A.K. and S.N.K.; software, A.P.D., P.A.K. and A.V.C.; validation, A.V.C. and A.P.D.; formal analysis, P.A.K. and S.N.K.; investigation, A.V.C. and A.O.G.; resources, S.N.K. and N.V.P.; data curation, A.P.D., P.A.K., A.O.G. and A.V.C.; writing—original draft preparation, P.A.K., N.V.P. and S.N.K.; writing—review and editing, P.A.K., N.V.P. and S.N.K.; visualization, P.A.K., A.V.C. and A.P.D.; supervision, N.V.P. and S.N.K.; project administration, N.V.P. and S.N.K.; funding acquisition, N.V.P. and S.N.K. All authors have read and agreed to the published version of the manuscript.

Funding

This work was supported by the Russian Science Foundation under Grant No. 22-12-00041 (numerical calculations), by the Ministry of Science and Higher Education of the Russian Federation under the FSRC “Crystallography and Photonics” of the Russian Academy of Sciences (state task No. 007-GZ/Ch3363/26) (theoretical research), and by the Ministry of Education and Science of the Russian Federation (Passport No. 2019-0903) (experimental research).

Institutional Review Board Statement

Not applicable.

Informed Consent Statement

Not applicable.

Data Availability Statement

Not applicable.

Acknowledgments

We acknowledge the equal contribution of all the authors.

Conflicts of Interest

The authors declare no conflict of interest.

References

  1. Park, J.-H.; Lee, B. Holographic techniques for augmented reality and virtual reality near-eye displays. Light Adv. Manuf. 2022, 3, 1. [Google Scholar] [CrossRef]
  2. Booth, M.; Andrade, D.; Burke, D.; Patton, B.; Zurauskas, M. Aberrations and adaptive optics in superresolution microscopy. Microscopy 2015, 64, 251–261. [Google Scholar] [CrossRef] [Green Version]
  3. Klebanov, I.M.; Karsakov, A.V.; Khonina, S.N.; Davydov, A.N.; Polyakov, K.A. Wavefront aberration compensation of space telescopes with telescope temperature field adjustment. Comput. Opt. 2017, 41, 30–36. [Google Scholar] [CrossRef]
  4. Gu, Z.; Wang, Y.; Ju, G. Computation of misalignment and primary mirror astigmatism figure error of two-mirror telescopes. J. Astron. Telesc. Instrum. Syst. 2018, 4, 019002. [Google Scholar] [CrossRef]
  5. Lombardo, M.; Lombardo, G. Wave aberration of human eyes and new descriptors of image optical quality and visual performance. J. Cataract Refract. Surg. 2010, 36, 313–320. [Google Scholar] [CrossRef] [PubMed]
  6. Khorin, P.A.; Khonina, S.N.; Karsakov, A.V.; Branchevskiy, S.L. Analysis of corneal aberration of the human eye. Comput. Opt. 2016, 40, 810–817. [Google Scholar] [CrossRef]
  7. Bisch, N.; Guan, J.; Booth, M.J.; Salter, P.S. Adaptive optics aberration correction for deep direct laser written waveguides in the heating regime. Appl. Phys. A. 2019, 125, 364. [Google Scholar] [CrossRef] [Green Version]
  8. Bian, Y.; Li, Y.; Li, W.; Hong, X.; Qiu, J.; Chen, E.; Li, L.; Wu, J. The impact of optical system aberration and fiber positioning error on the FMF coupling efficiency of an FSO receiver under atmospheric turbulence. J. Opt. 2022, 24, 085701. [Google Scholar] [CrossRef]
  9. Cabriel, C.; Bourg, N.; Dupuis, G.; Lévêque-Fort, S. Aberration-accounting calibration for 3D single-molecule localization microscopy. Opt. Lett. 2018, 43, 174. [Google Scholar] [CrossRef] [Green Version]
  10. Kuschmierz, R.; Scharf, E.; Ortegón-González, D.F.; Glosemeyer, T.; Czarske, J.W. Ultra-thin 3D lensless fiber endoscopy using diffractive optical elements and deep neural networks. Light Adv. Manuf. 2021, 2, 1. [Google Scholar] [CrossRef]
  11. Ellerbroek, B.L.; Vogel, C.R. Inverse problems in astronomical adaptive optics. Inverse Probl. 2009, 25, 063001. [Google Scholar] [CrossRef]
  12. Ji, N. Adaptive optical fluorescence microscopy. Nat. Methods 2017, 14, 374–380. [Google Scholar] [CrossRef]
  13. Bouchez, A.H.; Angeli, G.Z.; Ashby, D.S.; Bernier, R.; Conan, R.; McLeod, B.A.; Quirós-Pacheco, F.; Van Dam, M.A. An overview and status of GMT active and adaptive optics. Proc. SPIE 2018, 10703, 107030W. [Google Scholar] [CrossRef]
  14. Khorin, P.A.; Porfirev, A.P.; Khonina, S.N. Adaptive detection of wave aberrations based on the multichannel filter. Photonics 2022, 9, 204. [Google Scholar] [CrossRef]
  15. Zepp, A.; Gladysz, S.; Stein, K.; Osten, W. Simulation-based design optimization of the holographic wavefront sensor in closed-loop adaptive optics. Light: Adv. Manuf. 2022, 3, 27. [Google Scholar] [CrossRef]
  16. Platt, B.C.; Shack, R. History and principles of Shack-Hartmann wavefront sensing. J. Refract. Surg. 2001, 17, S573–S577. [Google Scholar] [CrossRef] [PubMed]
  17. Hongbin, Y.; Guangya, Z.; Siong, C.F.; Feiwen, L.; Shouhua, W.A. Tunable Shack-Hartmann wavefront sensor based on a liquid-filled microlens array. J. Micromech. Microeng. 2008, 18, 105017. [Google Scholar] [CrossRef]
  18. Fauvarque, O. General formalism for Fourier-based wave front sensing: Application to the pyramid wave front sensors. J. Astron. Telesc. Instrum. Syst. 2017, 3, 019001. [Google Scholar] [CrossRef] [Green Version]
  19. Hutterer, V.; Ramlau, R.; Shatokhina, I. Real-time adaptive optics with pyramid wavefront sensors: A theoretical analysis of the pyramid sensor model. Inverse Prob. 2019, 35, 34. [Google Scholar] [CrossRef]
  20. Karpeev, S.V.; Pavelyev, V.S.; Khonina, S.N.; Kazanskiy, N.L. High-effective fiber sensors based on transversal mode selection. Proc. SPIE Int. Soc. Opt. Eng. 2005, 5854, 163–169. [Google Scholar]
  21. Fang, Z.; Chin, K.; Qu, R.; Cai, H. Fundamentals of Optical Fiber Sensors; John Wiley and Sons Ltd.: Hoboken, NJ, USA, 2012; ISBN 978-0-470-57540-6. [Google Scholar]
  22. Khonina, S.N.; Karpeev, S.V.; Paranin, V.D. Birefringence detection of a gradient-index lens based on astigmatic transformation of a Bessel beam. Optik 2018, 164, 679–685. [Google Scholar] [CrossRef]
  23. Booth, M.J. Direct measurement of Zernike aberration modes with a modal wavefront sensor. Proc. SPIE 2003, 5162, 79–90. [Google Scholar]
  24. Porfirev, A.P.; Khonina, S.N. Experimental investigation of multi-order diffractive optical elements matched with two types of Zernike functions. Proc. SPIE 2016, 9807, 98070E. [Google Scholar] [CrossRef]
  25. Khonina, S.N.; Karpeev, S.V.; Porfirev, A.P. Wavefront Aberration Sensor Based on a Multichannel Diffractive Optical Element. Sensors 2020, 20, 14. [Google Scholar] [CrossRef] [PubMed]
  26. Khorin, P.A.; Volotovskiy, S.G.; Khonina, S.N. Optical detection of values of separate aberrations using a multi-channel filter matched with phase Zernike functions. Comput. Opt. 2021, 45, 525–533. [Google Scholar] [CrossRef]
  27. Malacara, D. Optical Shop Testing; John Wiley & Sons: Hoboken, NJ, USA, 2007. [Google Scholar]
  28. Takeda, M. Fourier fringe analysis and its application to metrology of extreme physical phenomena: A review. Appl. Opt. 2013, 52, 20. [Google Scholar] [CrossRef]
  29. Gao, W.; Huyen, N.T.; Loi, H.S.; Kemao, Q. Real-time 2D parallel windowed Fourier transform for fringe pattern analysis using Graphics Processing Unit. Opt. Express 2009, 17, 23147–23152. [Google Scholar] [CrossRef]
  30. Zhang, R.; Guo, H.; Asundi, A.K. Geometric analysis of influence of fringe directions on phase sensitivities in fringe projection profilometry. Appl. Opt. 2016, 55, 7675–7687. [Google Scholar] [CrossRef] [PubMed]
  31. Zhao, H.; Zhang, C.; Zhou, C.; Jiang, K.; Fang, M. Circular fringe projection profilometry. Opt. Lett. 2016, 41, 4951–4954. [Google Scholar] [CrossRef]
  32. Zhang, C.; Zhao, H.; Qiao, J.; Zhou, C.; Zhang, L.; Hu, G.; Geng, H. Three-dimensional measurement based on optimized circular fringe projection technique. Opt. Express 2019, 27, 2465–2477. [Google Scholar] [CrossRef]
  33. Ma, Y.; Yin, D.; Wei, C.; Feng, S.; Ma, J.; Nie, S.; Yuan, C. Real-time 3-D shape measurement based on radial spatial carrier phase shifting from circular fringe pattern. Opt. Commun. 2019, 450, 6–13. [Google Scholar] [CrossRef]
  34. Chen, Q.; Han, M.; Wang, Y.; Chen, W. An Improved Circular Fringe Fourier Transform Profilometry. Sensors 2022, 22, 6048. [Google Scholar] [CrossRef]
  35. Iwata, K.; Kusunoki, F.; Moriwaki, K.; Fukuda, H.; Tomii, T. Three-dimensional profiling using the Fourier transform method with a hexagonal grating projection. Appl. Opt. 2008, 47, 2103–2108. [Google Scholar] [CrossRef] [PubMed]
  36. Porras-Aguilar, R.; Falaggis, K.; Ramos-Garcia, R. Optimum projection pattern generation for grey-level coded structured light illumination systems. Opt. Lasers Eng. 2017, 91, 242–256. [Google Scholar] [CrossRef]
  37. Porras-Aguilar, R.; Falaggis, K. Absolute phase recovery in structured light illumination systems: Sinusoidal vs. intensity discrete patterns. Opt. Lasers Eng. 2016, 84, 111–119. [Google Scholar] [CrossRef]
  38. Belashov, A.V.; Petrov, N.V.; Semenova, I.V. Method for calculating the dynamic phase delay in holographic interferometry without phase unwrapping. Comput. Opt. 2014, 38, 710–716. [Google Scholar] [CrossRef]
  39. Belashov, A.V.; Petrov, N.V.; Semenova, I.V. Digital off-axis holographic interferometry with simulated wavefront. Opt. Express 2014, 22, 28363–28376. [Google Scholar] [CrossRef]
  40. Rivenson, Y.; Zhang, Y.; Günaydın, H.; Teng, D.; Ozcan, A. Phase recovery and holographic image reconstruction using deep learning in neural networks. Light Sci. Appl. 2018, 7, 17141. [Google Scholar] [CrossRef] [Green Version]
  41. Andersen, T.; Owner-Petersen, M.; Enmark, A. Neural networks for image-based wavefront sensing for astronomy. Opt. Lett. 2019, 44, 4618–4621. [Google Scholar] [CrossRef]
  42. Jia, P. Astronomical image restoration and point spread function estimation with deep neural networks. Astron. J. 2020, 159, 183. [Google Scholar] [CrossRef]
  43. Rodin, I.A.; Khonina, S.N.; Serafimovich, P.G.; Popov, S.B. Recognition of wavefront aberrations types corresponding to single Zernike functions from the pattern of the point spread function in the focal plane using neural networks. Comput. Opt. 2020, 44, 923–930. [Google Scholar] [CrossRef]
  44. Khorin, P.A.; Dzyuba, A.P.; Serafimovich, P.G.; Khonina, S.N. Neural networks application to determine the types and magnitude of aberrations from the pattern of the point spread function out of the focal plane. J. Phys. Conf. Ser. V. 2021, 2086, 012148. [Google Scholar] [CrossRef]
  45. Pinilla, S.; Mishra, K.V.; Shevkunov, I.; Soltanalian, M.; Katkovnik, V.; Egiazarian, K. Unfolding-Aided Bootstrapped Phase Retrieval in Optical Imaging: Explainable AI reveals new imaging frontiers. IEEE Signal Process. Mag. 2023, 40, 46–60. [Google Scholar] [CrossRef]
  46. Tang, X.; Zhu, J.; Zhong, P.; Chen, Y.; Zhang, B.; Hu, H. Reliable wavefront reconstruction from a single lateral shearing interferogram using Bayesian convolutional neural network. Opt. Lasers Eng. 2023, 160, 107281. [Google Scholar] [CrossRef]
  47. Liu, X.; Yang, Z.; Dou, J.; Liu, Z. Fast demodulation of single-shot interferogram via convolutional neural network. Opt. Commun. 2021, 487, 126813. [Google Scholar] [CrossRef]
  48. Khonina, S.N.; Khorin, P.A.; Serafimovich, P.G.; Dzuyba, A.P.; Georgieva, A.O.; Petrov, N.V. Analysis of the wavefront aberrations based on neural networks processing of the interferograms with a conical reference beam. Appl. Phys. B. 2022, 128, 60. [Google Scholar] [CrossRef]
  49. Georgieva, A.O.; Belashov, A.V.; Petrov, N.V. Complex wavefront manipulation and holographic correction based on digital micromirror device: A study of spatial resolution and discretisation. Proc. SPIE 2020, 11294, 112940B. [Google Scholar] [CrossRef]
  50. Georgieva, A.; Belashov, A.V.; Petrov, N.V. Optimization of DMD-based independent amplitude and phase modulation by analysis of target complex wavefront. Sci. Rep. 2022, 12, 7754. [Google Scholar] [CrossRef] [PubMed]
  51. Born, M.; Wolf, E. Principles of Optics: Electromagnetic Theory of Propagation, Interference and Diffraction of Light, 7th ed.; Cambridge University Press: Cambridge, UK, 1999. [Google Scholar]
  52. Sherif, S.S.; Cathey, W.T.; Dowski, E.R. Phase plate to extend the depth of field of incoherent hybrid imaging systems. Appl. Opt. 2004, 43, 2709–2721. [Google Scholar] [CrossRef]
  53. Khonina, S.N.; Ustinov, A.V. Generalized apodization of an incoherent imaging system aimed for extending the depth of focus. Pattern Recognit. Image Anal. 2015, 25, 626–631. [Google Scholar] [CrossRef]
  54. Khonina, S.N.; Volotovskiy, S.G.; Dzyuba, A.P.; Serafimovich, P.G.; Popov, S.B.; Butt, M.A. Power phase apodization study on compensation defocusing and chromatic aberration in the imaging system. Electronics 2021, 10, 1327. [Google Scholar] [CrossRef]
  55. Lee, W.H. Binary synthetic holograms. Appl. Opt. 1974, 13, 1677–1682. [Google Scholar] [CrossRef] [PubMed]
  56. Liebling, M.; Blu, T.; Unser, M. Complex-Wave Retrieval from a Single off-Axis Hologram. J. Opt. Soc. Am. A. 2004, 21, 367. [Google Scholar] [CrossRef] [PubMed] [Green Version]
  57. Katkovnik, V.; Shevkunov, I.A.; Petrov, N.V.; Egiazarian, K. Wavefront Reconstruction in Digital Off-Axis Holography via Sparse Coding of Amplitude and Absolute Phase. Opt. Lett. 2015, 40, 2417. [Google Scholar] [CrossRef]
  58. Chollet, F. Xception: Deep Learning with Depthwise Separable Convolutions. In Proceedings of the IEEE Conference on Computer Vision and Pattern Recognition, Vancouver, BC, Canada, 21–26 July 2017; pp. 1251–1258. [Google Scholar]
  59. Guo, Y.; Zhong, L.; Min, L.; Wang, J.; Wu, Y.; Chen, K.; Wei, K.; Rao, C. Adaptive optics based on machine learning: A review. Opto-Electron. Adv. 2022, 5, 200082. [Google Scholar] [CrossRef]
  60. Kaiser, L.; Gomez, A.N.; Chollet, F. Depthwise Separable Convolutions for Neural Machine Translation. arXiv 2017. [Google Scholar] [CrossRef]
  61. Khorin, P.A.; Volotovskiy, S.G. Analysis of the threshold sensitivity of a wavefront aberration sensor based on a multi-channel diffraction optical element. Proc. SPIE 2021, 11793, 117930B. [Google Scholar]
Figure 1. The transmission function of a flat reference beam (p = 1) for a linear interferogram depending on different beam angles α: (a) is 2π; (b) is 4π; (c) is 6π; (d) is 8π; (e) is 10π.
Applsci 13 04831 g001
Figure 2. The transmission function of a cylindrical reference beam (p = 2) for a cubic interferogram depending on different beam tilt angles α: (a) is 2π; (b) is 4π; (c) is 6π; (d) is 8π; (e) is 10π.
Applsci 13 04831 g002
Figure 3. Schemes experimental setup: LS is laser source diode 532 nm, BE is beam expander, M1–2 are mirrors, BS1–2 are beam splitters 30R/70T and 50R/50T, L1–2 are lenses with focal distance 200 and 100 mm, SF is the spatial filter, Shutter is the moveable screen, CMOS is the matrix of the camera Mind Vision MV-UB130GM with 1280 × 960 pixels with the size of 3.75 μm.
Applsci 13 04831 g003
Figure 4. Beam separation principle in Fourier plane of 4f-system. The amplitude modulus distribution in logarithmic scale for a single quadrafoil aberration pattern with EB = 0 (a) and its interference field with the tilted plane wave α = 10π (b) and α = 50π (c). Selectable diffraction orders and suborders are highlighted by the red rectangle.
Applsci 13 04831 g004
Figure 5. Target amplitude and phase distributions encoded in DMD pattern with experimentally obtained interferograms for single- and two-arm schemes with the tilted plane wave with α indicated above the images; and reconstructed phase distributions from corresponding interferograms. RMSE of reconstructed phase distributions and target phase is indicated under corresponding images.
Applsci 13 04831 g005
Figure 6. Xception neural network architecture.
Applsci 13 04831 g006
Figure 7. Patterns of cubic interferograms depending on different tilt angles α ((a) is 2π; (b) is 4π; (c) is 6π; (d) is 8π; (e) is 10π) of the reference cylindrical beam for coma-type aberration Z31 with aberration value c n m = 0.5 .
Applsci 13 04831 g007
Figure 8. An example of a prediction made by a trained neural network: is an input image (an image of an interferogram) (a) and an array of predicted coefficients as an output (b). For this image, the true coefficients are 0.3 for Z20 and 0.2 for Z44.
Applsci 13 04831 g008
Figure 9. The neural network learning process dynamics using model interferograms with the parameter α = 2π: linear type (a) and cylindrical type (b) expressed by the dependence of MAE on the number of epochs.
Applsci 13 04831 g009
Figure 10. The neural network learning process dynamics using model interferograms of a cylindrical type with the parameters α = 4π (a) and α = 6π (b) expressed by the dependence of MAE on the number of epochs.
Applsci 13 04831 g010
Figure 11. The neural network learning process dynamics using experimental cylindrical interferograms with the parameters α = 2π (a), α = 4π (b), and α = 6π (c) expressed by the dependence of MAE on the number of epochs.
Applsci 13 04831 g011
Figure 12. RMSE values of cylindrical interferograms (α = 2π) for different types of aberrations Znm.
Applsci 13 04831 g012
Figure 13. Average RMSE values for the first 8 types of aberrations for linear (a) and cylindrical (b) interferograms (α = 2π…10π).
Applsci 13 04831 g013
Figure 14. Averaged sensitivities of cylindrical and linear interferograms to wavefront aberrations.
Applsci 13 04831 g014
Figure 15. The information content parameter of cylindrical and linear interferograms to wavefront aberrations.
Applsci 13 04831 g015
Figure 16. Average values of information content parameter of cylindrical and linear interferograms to wavefront aberrations.
Applsci 13 04831 g016
Table 1. Interferogram patterns (α = 2π, β = 0) for aberrations in the form of separate Zernike functions.
Aberration Type Z n m x , y
Phase W(x,y)
( c n m = 0.5 )
Linear I p = 1 x , y Interferogram
( c n m = 0.1 , c n m = 0.5 )
Cylindrical I p = 2 x , y
Interferogram
( c n m = 0.1 , c n m = 0.5 )
Z 11 x , y - tilt
Applsci 13 04831 i001
Applsci 13 04831 i002Applsci 13 04831 i003Applsci 13 04831 i004Applsci 13 04831 i005
Z 22 x , y - astigmatism
Applsci 13 04831 i006
Applsci 13 04831 i007Applsci 13 04831 i008Applsci 13 04831 i009Applsci 13 04831 i010
Z 20 x , y - defocus
Applsci 13 04831 i011
Applsci 13 04831 i012Applsci 13 04831 i013Applsci 13 04831 i014Applsci 13 04831 i015
Z 33 x , y - trefoil
Applsci 13 04831 i016
Applsci 13 04831 i017Applsci 13 04831 i018Applsci 13 04831 i019Applsci 13 04831 i020
Z 31 x , y - coma
Applsci 13 04831 i021
Applsci 13 04831 i022Applsci 13 04831 i023Applsci 13 04831 i024Applsci 13 04831 i025
Z 44 x , y - quadrafoil
Applsci 13 04831 i026
Applsci 13 04831 i027Applsci 13 04831 i028Applsci 13 04831 i029Applsci 13 04831 i030
Z 42 x , y - secondary ast.
Applsci 13 04831 i031
Applsci 13 04831 i032Applsci 13 04831 i033Applsci 13 04831 i034Applsci 13 04831 i035
Z 40 x , y - spherical
Applsci 13 04831 i036
Applsci 13 04831 i037Applsci 13 04831 i038Applsci 13 04831 i039Applsci 13 04831 i040
Table 2. Examples of generated linear and cylindrical interferograms for various types and levels of aberrations with a variable parameter α.
Images of Linear InterferogramsImages of Cylindrical Interferograms
0.3 Z 20 x , y + 0.2 Z 44 x , y
Applsci 13 04831 i041Applsci 13 04831 i042Applsci 13 04831 i043Applsci 13 04831 i044Applsci 13 04831 i045Applsci 13 04831 i046
0.4 Z 22 x , y + 0.1 Z 33 x , y
Applsci 13 04831 i047Applsci 13 04831 i048Applsci 13 04831 i049Applsci 13 04831 i050Applsci 13 04831 i051Applsci 13 04831 i052
0.3 Z 42 x , y + 0.2 Z 20 x , y
Applsci 13 04831 i053Applsci 13 04831 i054Applsci 13 04831 i055Applsci 13 04831 i056Applsci 13 04831 i057Applsci 13 04831 i058
Table 3. Interferogram patterns (α = 2π, β = 0) for aberrations as separate Zernike functions.
Aberration Type Z n m x , y
Phase W(x,y)
( c n m = 0.5 )
Linear I p = 1 x , y Interferogram
( c n m = 0.1 , c n m = 0.5 )
Cylindrical I p = 2 x , y
Interferogram
( c n m = 0.1 , c n m = 0.5 )
Z 11 x , y - tilt
Applsci 13 04831 i059
Applsci 13 04831 i060Applsci 13 04831 i061Applsci 13 04831 i062Applsci 13 04831 i063
Z 22 x , y - astigmatism
Applsci 13 04831 i064
Applsci 13 04831 i065Applsci 13 04831 i066Applsci 13 04831 i067Applsci 13 04831 i068
Z 20 x , y - defocus
Applsci 13 04831 i069
Applsci 13 04831 i070Applsci 13 04831 i071Applsci 13 04831 i072Applsci 13 04831 i073
Z 33 x , y - trefoil
Applsci 13 04831 i074
Applsci 13 04831 i075Applsci 13 04831 i076Applsci 13 04831 i077Applsci 13 04831 i078
Z 31 x , y - coma
Applsci 13 04831 i079
Applsci 13 04831 i080Applsci 13 04831 i081Applsci 13 04831 i082Applsci 13 04831 i083
Z 44 x , y - quadrafoil
Applsci 13 04831 i084
Applsci 13 04831 i085Applsci 13 04831 i086Applsci 13 04831 i087Applsci 13 04831 i088
Z 42 x , y - secondary ast.
Applsci 13 04831 i089
Applsci 13 04831 i090Applsci 13 04831 i091Applsci 13 04831 i092Applsci 13 04831 i093
Z 40 x , y - spherical
Applsci 13 04831 i094
Applsci 13 04831 i095Applsci 13 04831 i096Applsci 13 04831 i097Applsci 13 04831 i098
Table 4. Examples of experimentally obtained linear and cylindrical interferograms for various types and levels of aberrations.
Images of Linear InterferogramsImages of Cylindrical Interferograms
0.3 Z 20 x , y + 0.2 Z 44 x , y
Applsci 13 04831 i099Applsci 13 04831 i100Applsci 13 04831 i101Applsci 13 04831 i102Applsci 13 04831 i103Applsci 13 04831 i104
0.4 Z 22 x , y + 0.1 Z 33 x , y
Applsci 13 04831 i105Applsci 13 04831 i106Applsci 13 04831 i107Applsci 13 04831 i108Applsci 13 04831 i109Applsci 13 04831 i110
0.3 Z 42 x , y + 0.2 Z 20 x , y
Applsci 13 04831 i111Applsci 13 04831 i112Applsci 13 04831 i113Applsci 13 04831 i114Applsci 13 04831 i115Applsci 13 04831 i116
Table 5. The model phase distribution, the reconstructed phase, and corresponding distribution interferogram for angle α = 6π.
Model Phase DistributionReconstructed Phase DistributionInterferogram
0.3 Z 20 x , y + 0.2 Z 44 x , y
Applsci 13 04831 i117Applsci 13 04831 i118Applsci 13 04831 i119
0.4 Z 22 x , y + 0.1 Z 33 x , y
Applsci 13 04831 i120Applsci 13 04831 i121Applsci 13 04831 i122
0.3 Z 42 x , y + 0.2 Z 20 x , y
Applsci 13 04831 i123Applsci 13 04831 i124Applsci 13 04831 i125
Table 6. Mean absolute recognition error (MAE) for model interferograms of various types.
Type AngleLinearCylindrical
α = 2π0.00630.0050
α = 4π0.00650.0047
α = 6π0.00680.0050
Table 7. Examples of experimentally obtained linear and cylindrical interferograms for various types and levels of aberrations.
Images of Cylindrical Interferograms
D 20 Z 20 x , y + D 44 Z 44 x , y
D 20 0.30
D 44 0.050.150.250.350.45
Interf.Applsci 13 04831 i126Applsci 13 04831 i127Applsci 13 04831 i128Applsci 13 04831 i129Applsci 13 04831 i130
Table 8. Mean absolute recognition error for cylindrical interferograms from the model and experimental dataset.
Type AngleCylindrical Model InterferogramCylindrical Experimental Interferogram
α = 2π0.00500.0049
α = 4π0.00470.0046
α = 6π0.00500.0052
Disclaimer/Publisher’s Note: The statements, opinions and data contained in all publications are solely those of the individual author(s) and contributor(s) and not of MDPI and/or the editor(s). MDPI and/or the editor(s) disclaim responsibility for any injury to people or property resulting from any ideas, methods, instructions or products referred to in the content.