5.1. MRTA Optimization
To prove the effectiveness of the penalty mechanism in the algorithm, the proposed algorithm in this paper is compared with the basic GA through simulation experiments. Assuming that all robots have sufficient initial energy, the initial parameters are set as follows: with energy consumption per unit distance A as a constant value, take A = 1.5 J, , population size , , , and iterations . In addition, the computational characteristics of the computer used for all experiments are as follows: DELL G3 3590, Intel(R) Core(TM) i7-9750H CPU @ 2.60 GHz, 16.0 GM (RAM), and the software is MATLAB R2019a.
Experiment 1: We set the number of tasks
m = 30 (the task nodes are represented by 1~30 serial numbers). When the number of robots is
n = 3 and
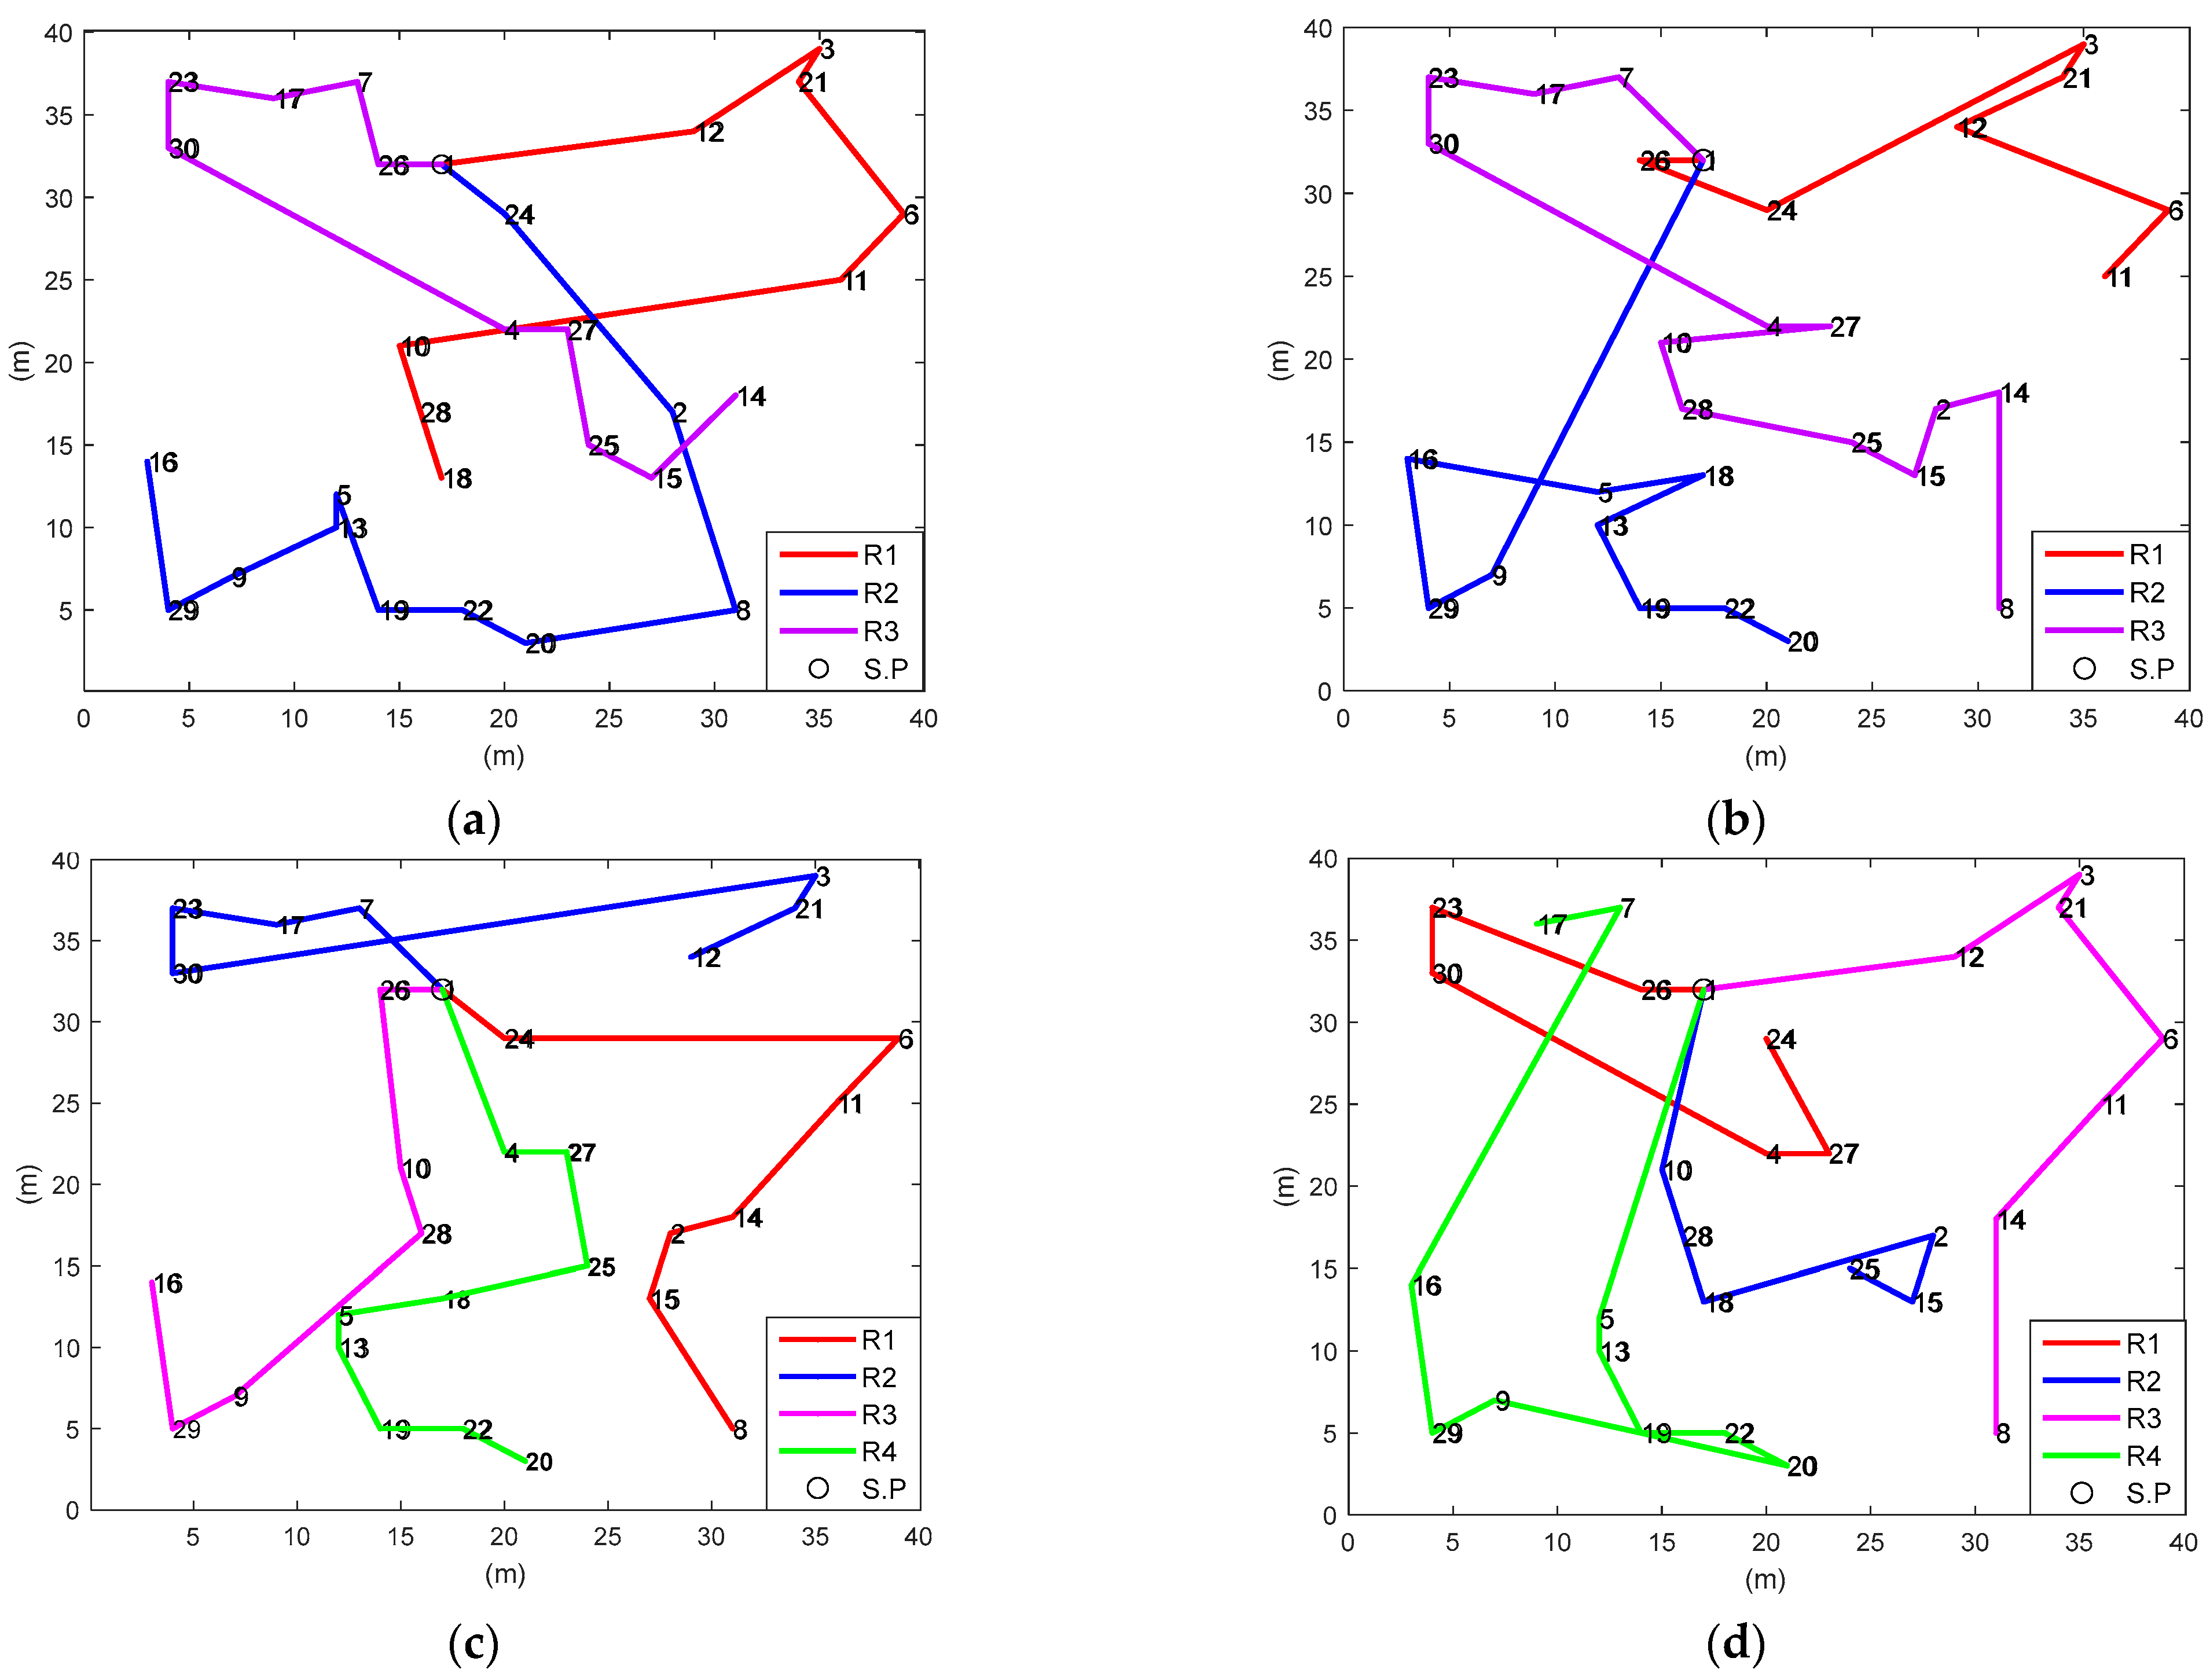
n = 4, the proposed algorithm and the basic GA are used to realize the task planning. Given the same barrier-free task environment, multiple robots begin to perform other tasks from starting point 1 (virtual task point). The simulation diagram of optimal task planning and the iterative curve of robot energy consumption are shown in
Figure 9 and
Figure 10.
The optimal task sequence (TS) and task number (TN) of the algorithm in this paper (
Figure 9a,c, respectively) are shown below.
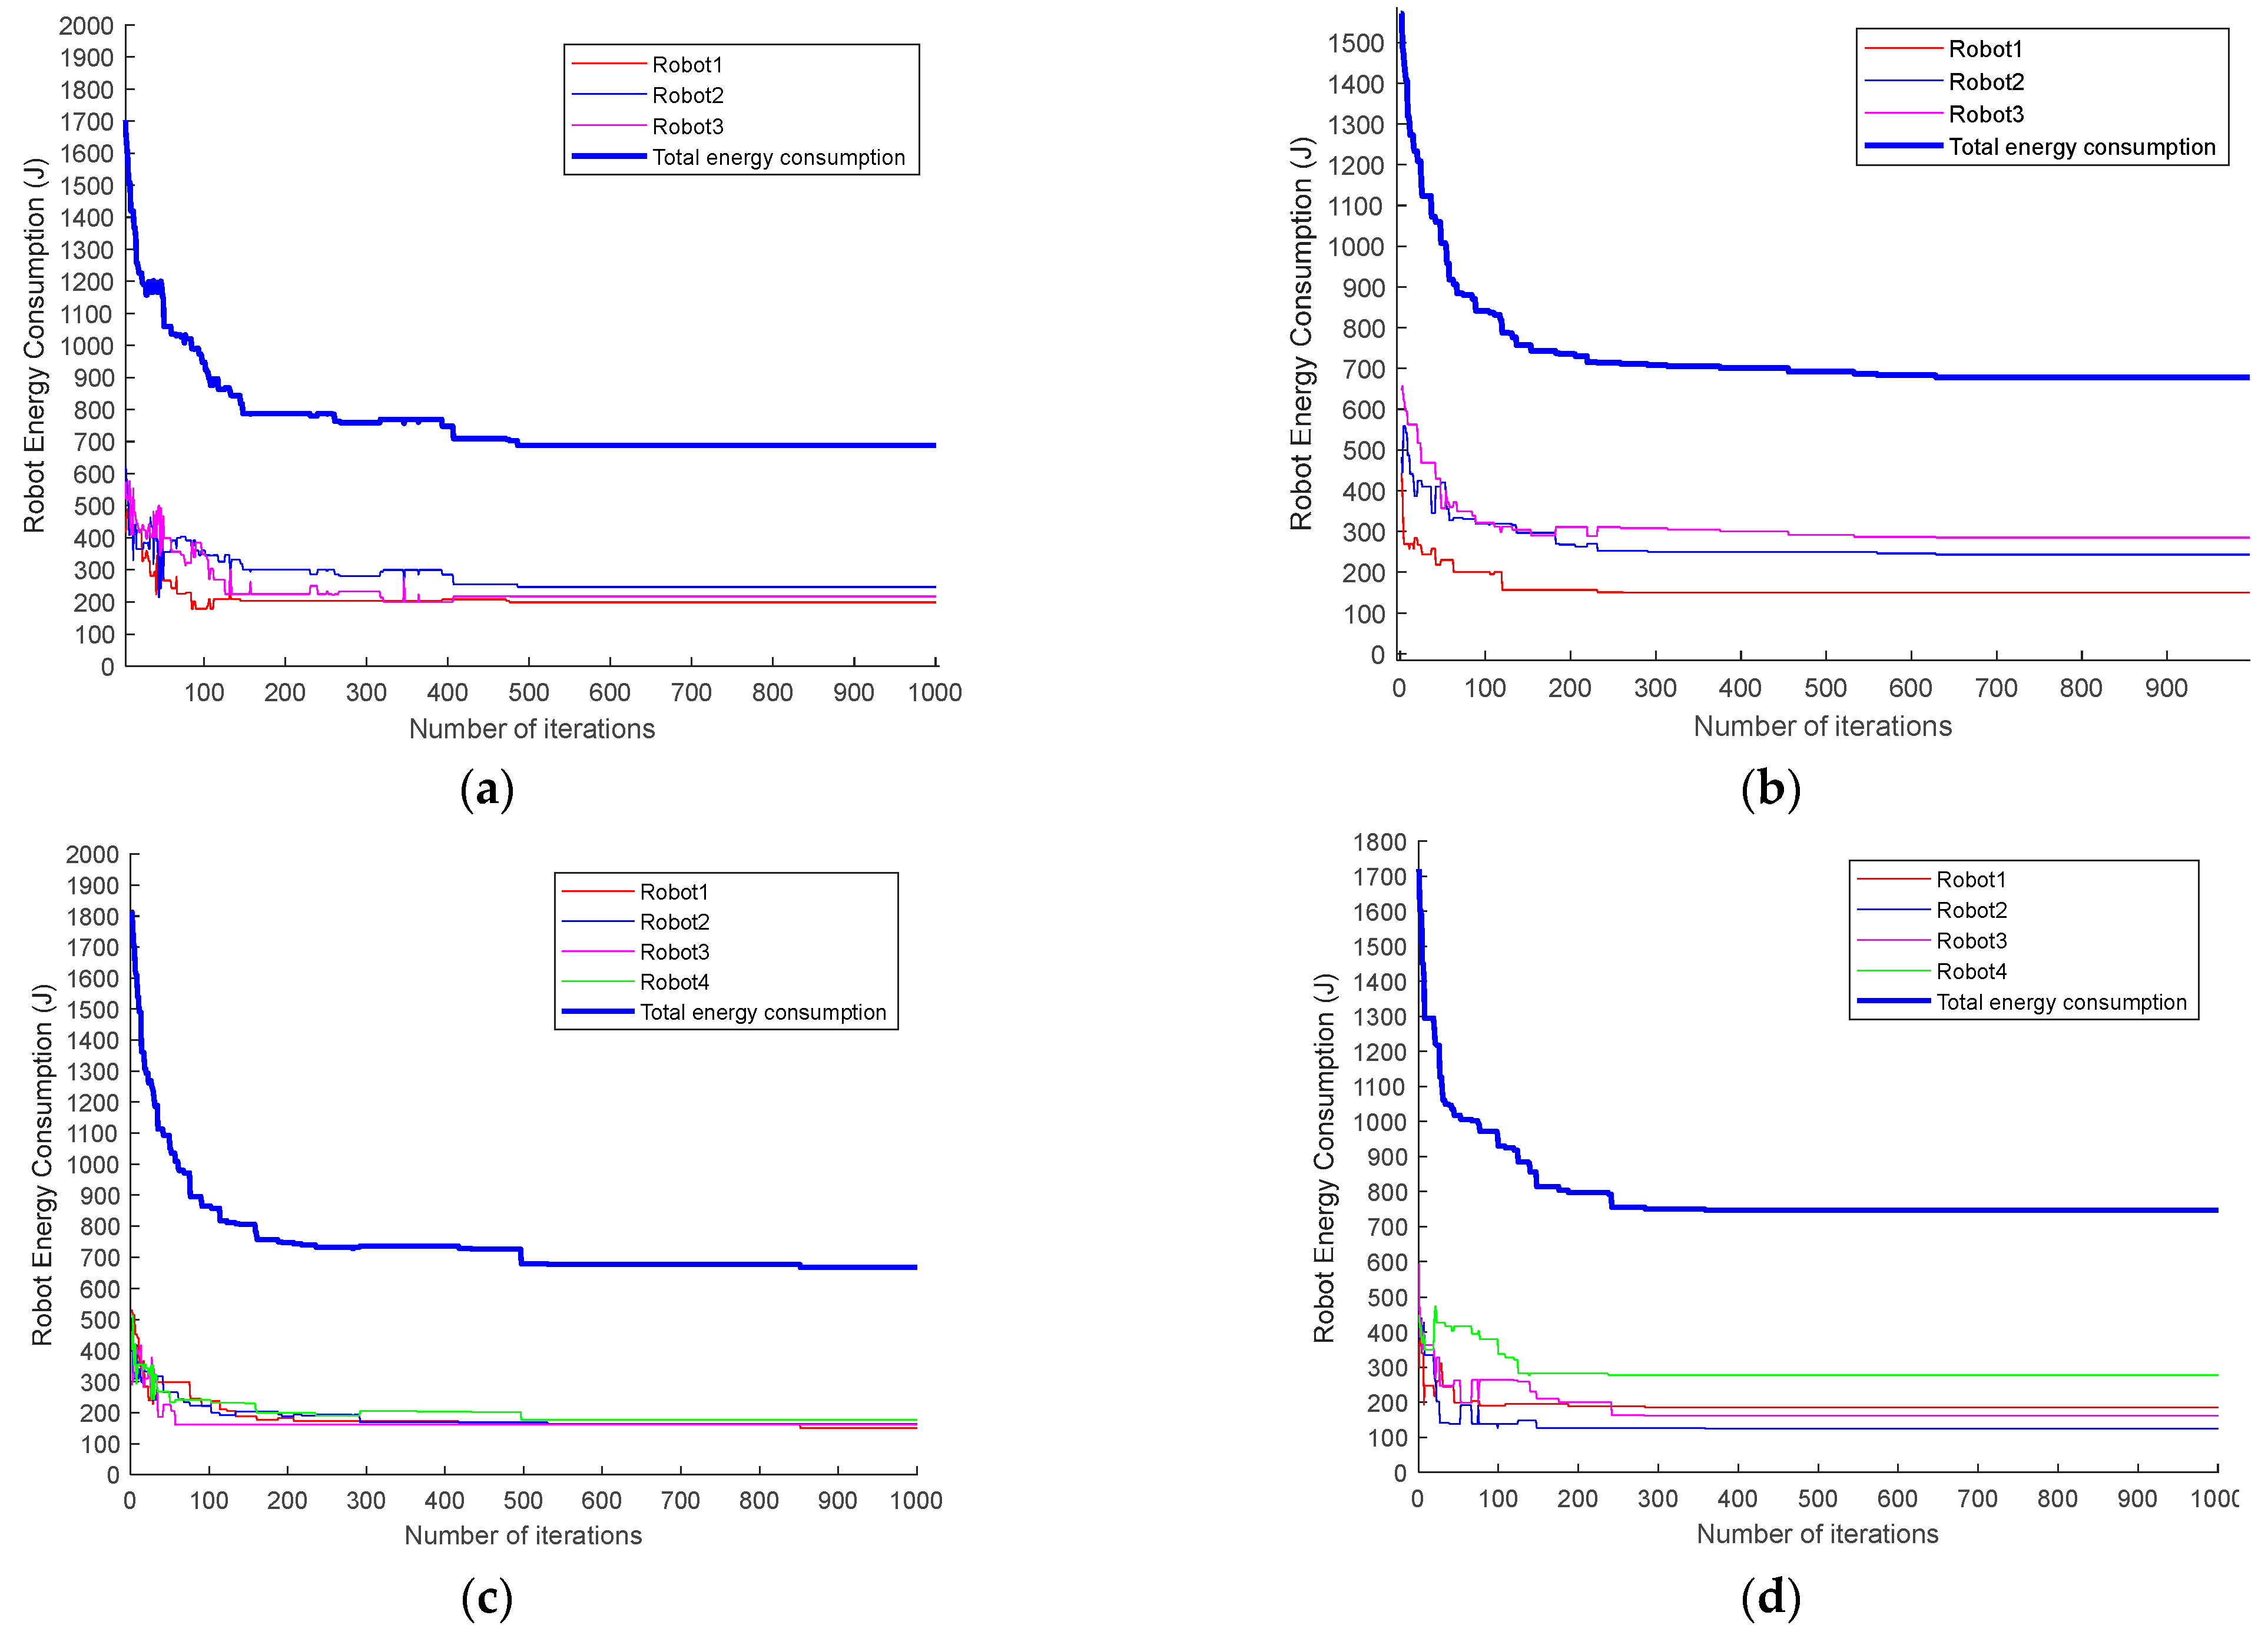
It can also be seen from the energy consumption iteration curve of the robot (
Figure 10a–d) that the GA of the energy penalty strategy improves the convergence speed of genetic iteration with lower total energy consumption and better energy balance. The experimental data of the robot energy consumption and standard deviation
are shown in
Table 1.
The results indicate that when
n = 3 and
n = 4, the total energy consumption rates of the proposed algorithm are 2.3% and 12.6% lower than those of the basic GA (without penalty mechanism), and the standard deviations are 65.6% and 83.8% lower, respectively. Therefore, compared with the basic GA (
Figure 9b,d), the task allocation of the proposed algorithm (
Figure 9a,c) is more reasonable. Furthermore, the task groups are relatively centralized, which ensures the balance of each robot’s movement distance and energy consumption. Thus, genetic optimization based on the energy penalty strategy can not only reduce the total energy consumption but also relatively balance the energy consumption of each robot. Moreover, without changing the number of tasks and the task environment, increasing the number of robots will reduce the total energy consumption by 1.4%, and the standard deviation of energy consumption will be reduced from 23.8 to 10.3; that is, the energy consumption will be more balanced, which means that with the increase of the number of robots, the optimization performance of the algorithm in energy consumption, and energy consumption balance will be more stable and reliable. Comparing the time consumption of obtaining the optimal solution between the two algorithms shows that the basic genetic algorithm is faster because the algorithm in this paper increases the calculation of penalty energy consumption. In addition, the change in the number of robots also affects the calculation time.
Experiment 2: To verify the effectiveness of the algorithm, change the number of tasks m = 40, and the task nodes are represented by 1–40 serial numbers. The simulation diagram of optimal task planning and the iterative curve of robot energy consumption are shown in
Figure 11 and
Figure 12.
The optimal TS and TN of the algorithm in this paper (
Figure 11a,c) are shown below.
When the number of robots increases, similar to the result of Experiment 1, the optimal scheme of the MRTA is more reasonable than the basic GA. It can be seen from the energy consumption iteration curve (
Figure 12) that it still has a better effect in terms of convergence speed and energy consumption. The specific experimental parameters are shown in
Table 2.
The results show that when the number of tasks is m = 40, the total energy consumption for completing all tasks with the number of robots n = 3 and n = 4 is reduced by 4.2% and 2.5% compared with the basic GA (without penalty mechanism), and the energy standard deviation is reduced by 60.6% and 76.5%, respectively. These findings reveal that the energy penalty strategy can stably maintain the optimal energy consumption and energy balance in genetic iteration. According to the calculation results of Experiments 1 and 2, different initial parameters, such as the number of robots and tasks and the task environment, have little impact on the algorithm performance. Furthermore, the improvement in the algorithm’s robustness is directly proportional to the increase in the number of tasks and robots. The comparison of time is similar to Experiment 1 and increases as the number of tasks increases.
Experiment 3: To compare the algorithm performance difference between this paper and the penalty function and genetic algorithm in [
34], we set the number of tasks
m = 30 and the number of robots
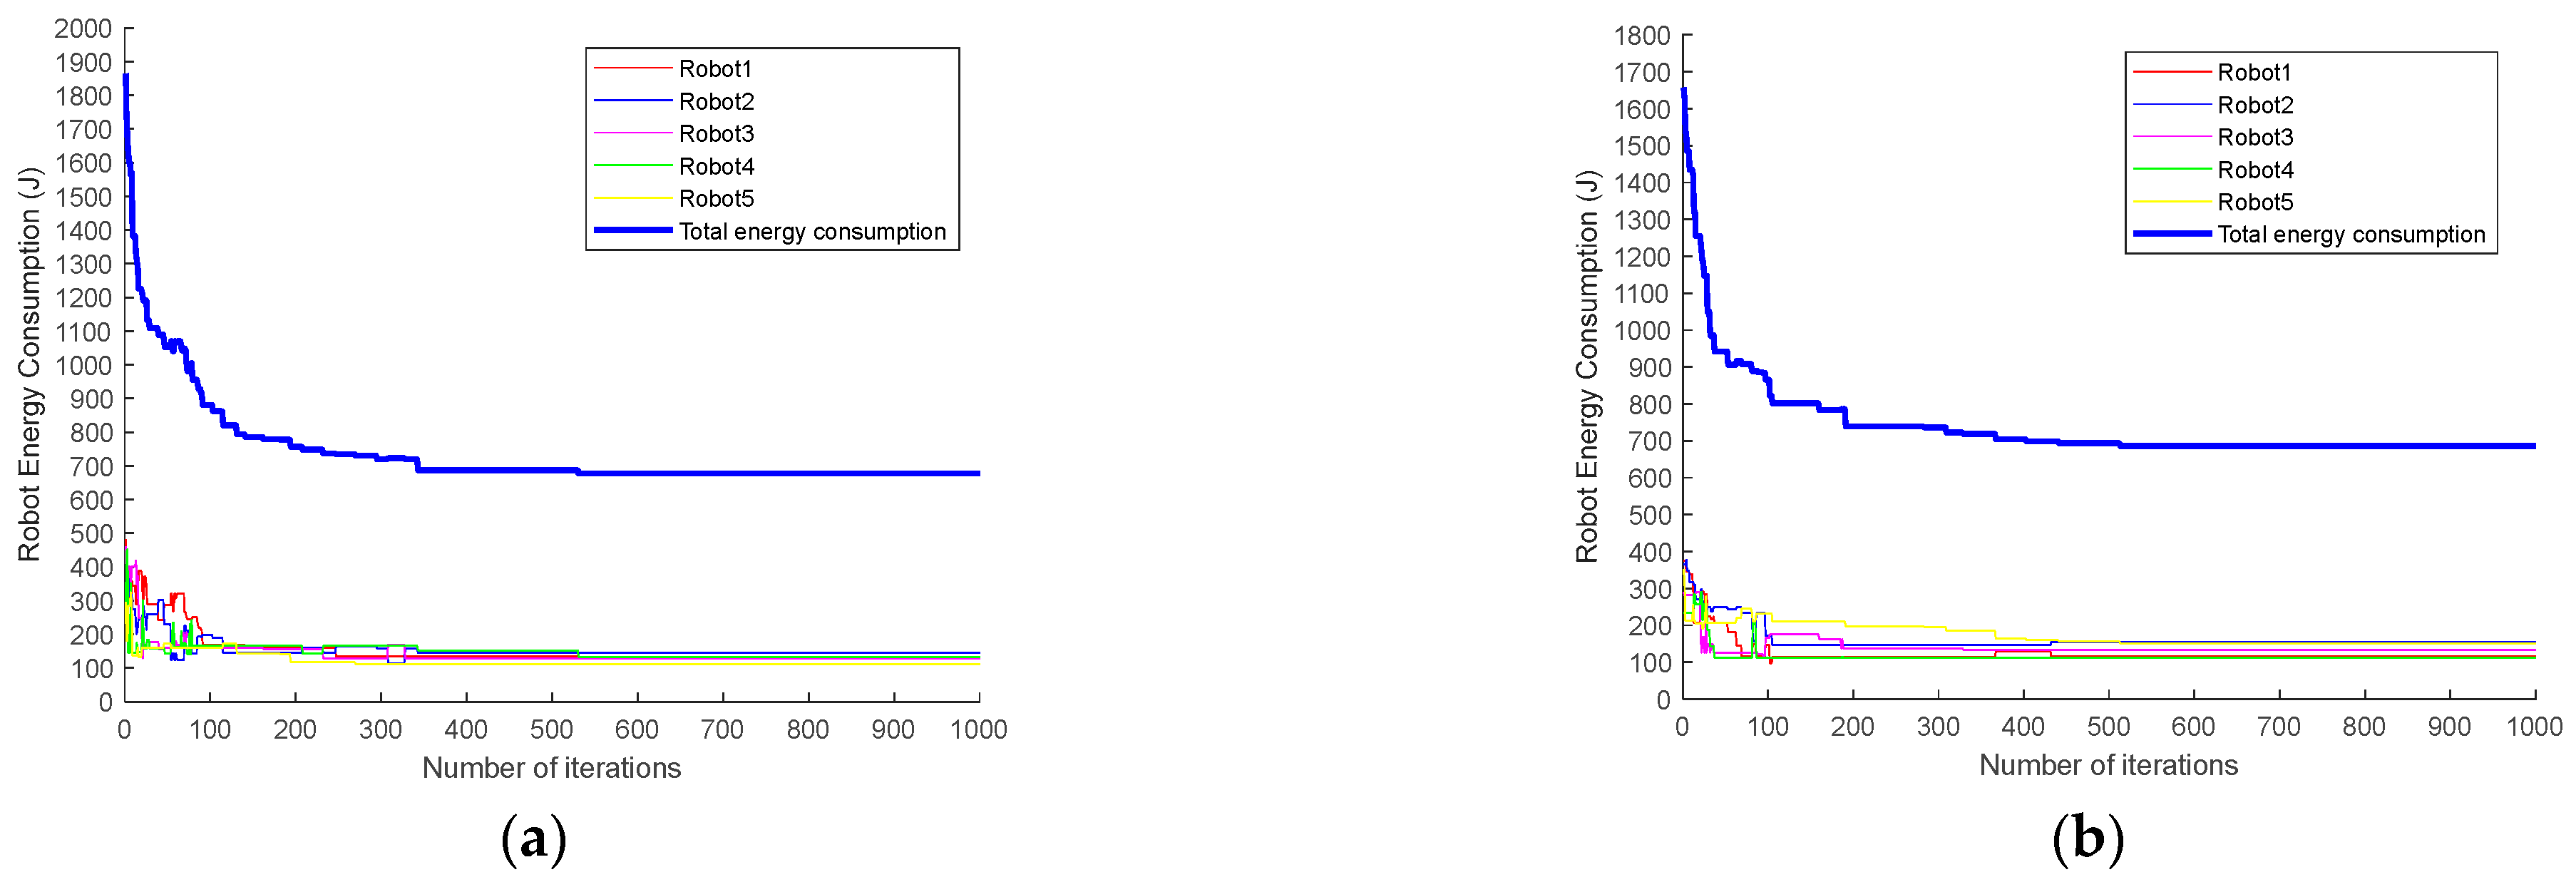
n = 5 and conducted simulation experiments under the same genetic parameter settings. The comparison of energy consumption iteration curves is shown in
Figure 13.
It can be intuitively seen in the figure that the total energy consumption of the algorithm in this paper is smaller in the stable iteration stage (after about 300 iterations) and that the energy consumption curve of each robot is more concentrated. The specific operation parameters are shown in
Table 3.
The experimental data reveal that, compared with the algorithm in [
34], the total energy consumption of the algorithm in the current work is reduced by 0.3%, and the standard deviation is also reduced by 29.6%. This indicates that the performance of the proposed algorithm is better than that of the basic GA. Therefore, the energy penalty strategy is effective and feasible in ensuring optimal and balanced energy consumption.
5.2. Task Sequence Optimization of A* + GA
In the two task environments of regular obstacles and irregular obstacles, the A* algorithm is used to plan the obstacle avoidance path between adjacent task nodes without changing the number of tasks. It is also used to recalculate and evaluate the robot energy consumption as well as to realize the secondary optimization of the energy excess robot task sequence through genetic iteration.
Experiment 4: We set a regular obstacle environment map and ensure that the distribution of task points is the same as that in Experiment 2. The number of tasks
m = 40, the number of robots
n = 3, and the size of the grid map is 80 × 80 m. The A* optimal path planning diagram before task sequence optimization is shown in
Figure 14.
As shown in
Table 4, the relative error of energy consumption of Robot 2
P2 = 5.56%, which exceeds the threshold
. Therefore, it is necessary to re-optimize the task sequence of Robot 2 to minimize its energy consumption. The optimized optimal path planning diagram of Robot 2 (renamed as “Robot 2a”) based on the GA is shown in
Figure 15. Meanwhile, the respective task sequences and related experimental data of Robot 2 before and after optimization are shown in
Table 5.
It can be seen that the path length of the optimized Robot 2 is reduced by 3.4%, and the energy consumption is reduced by 2.2%. As shown in
Table 6, the total energy after task sequence optimization is 0.78% lower than the previous one, and the standard deviation is also 13.85% lower. Therefore, the results indicate the effectiveness of the proposed algorithm.
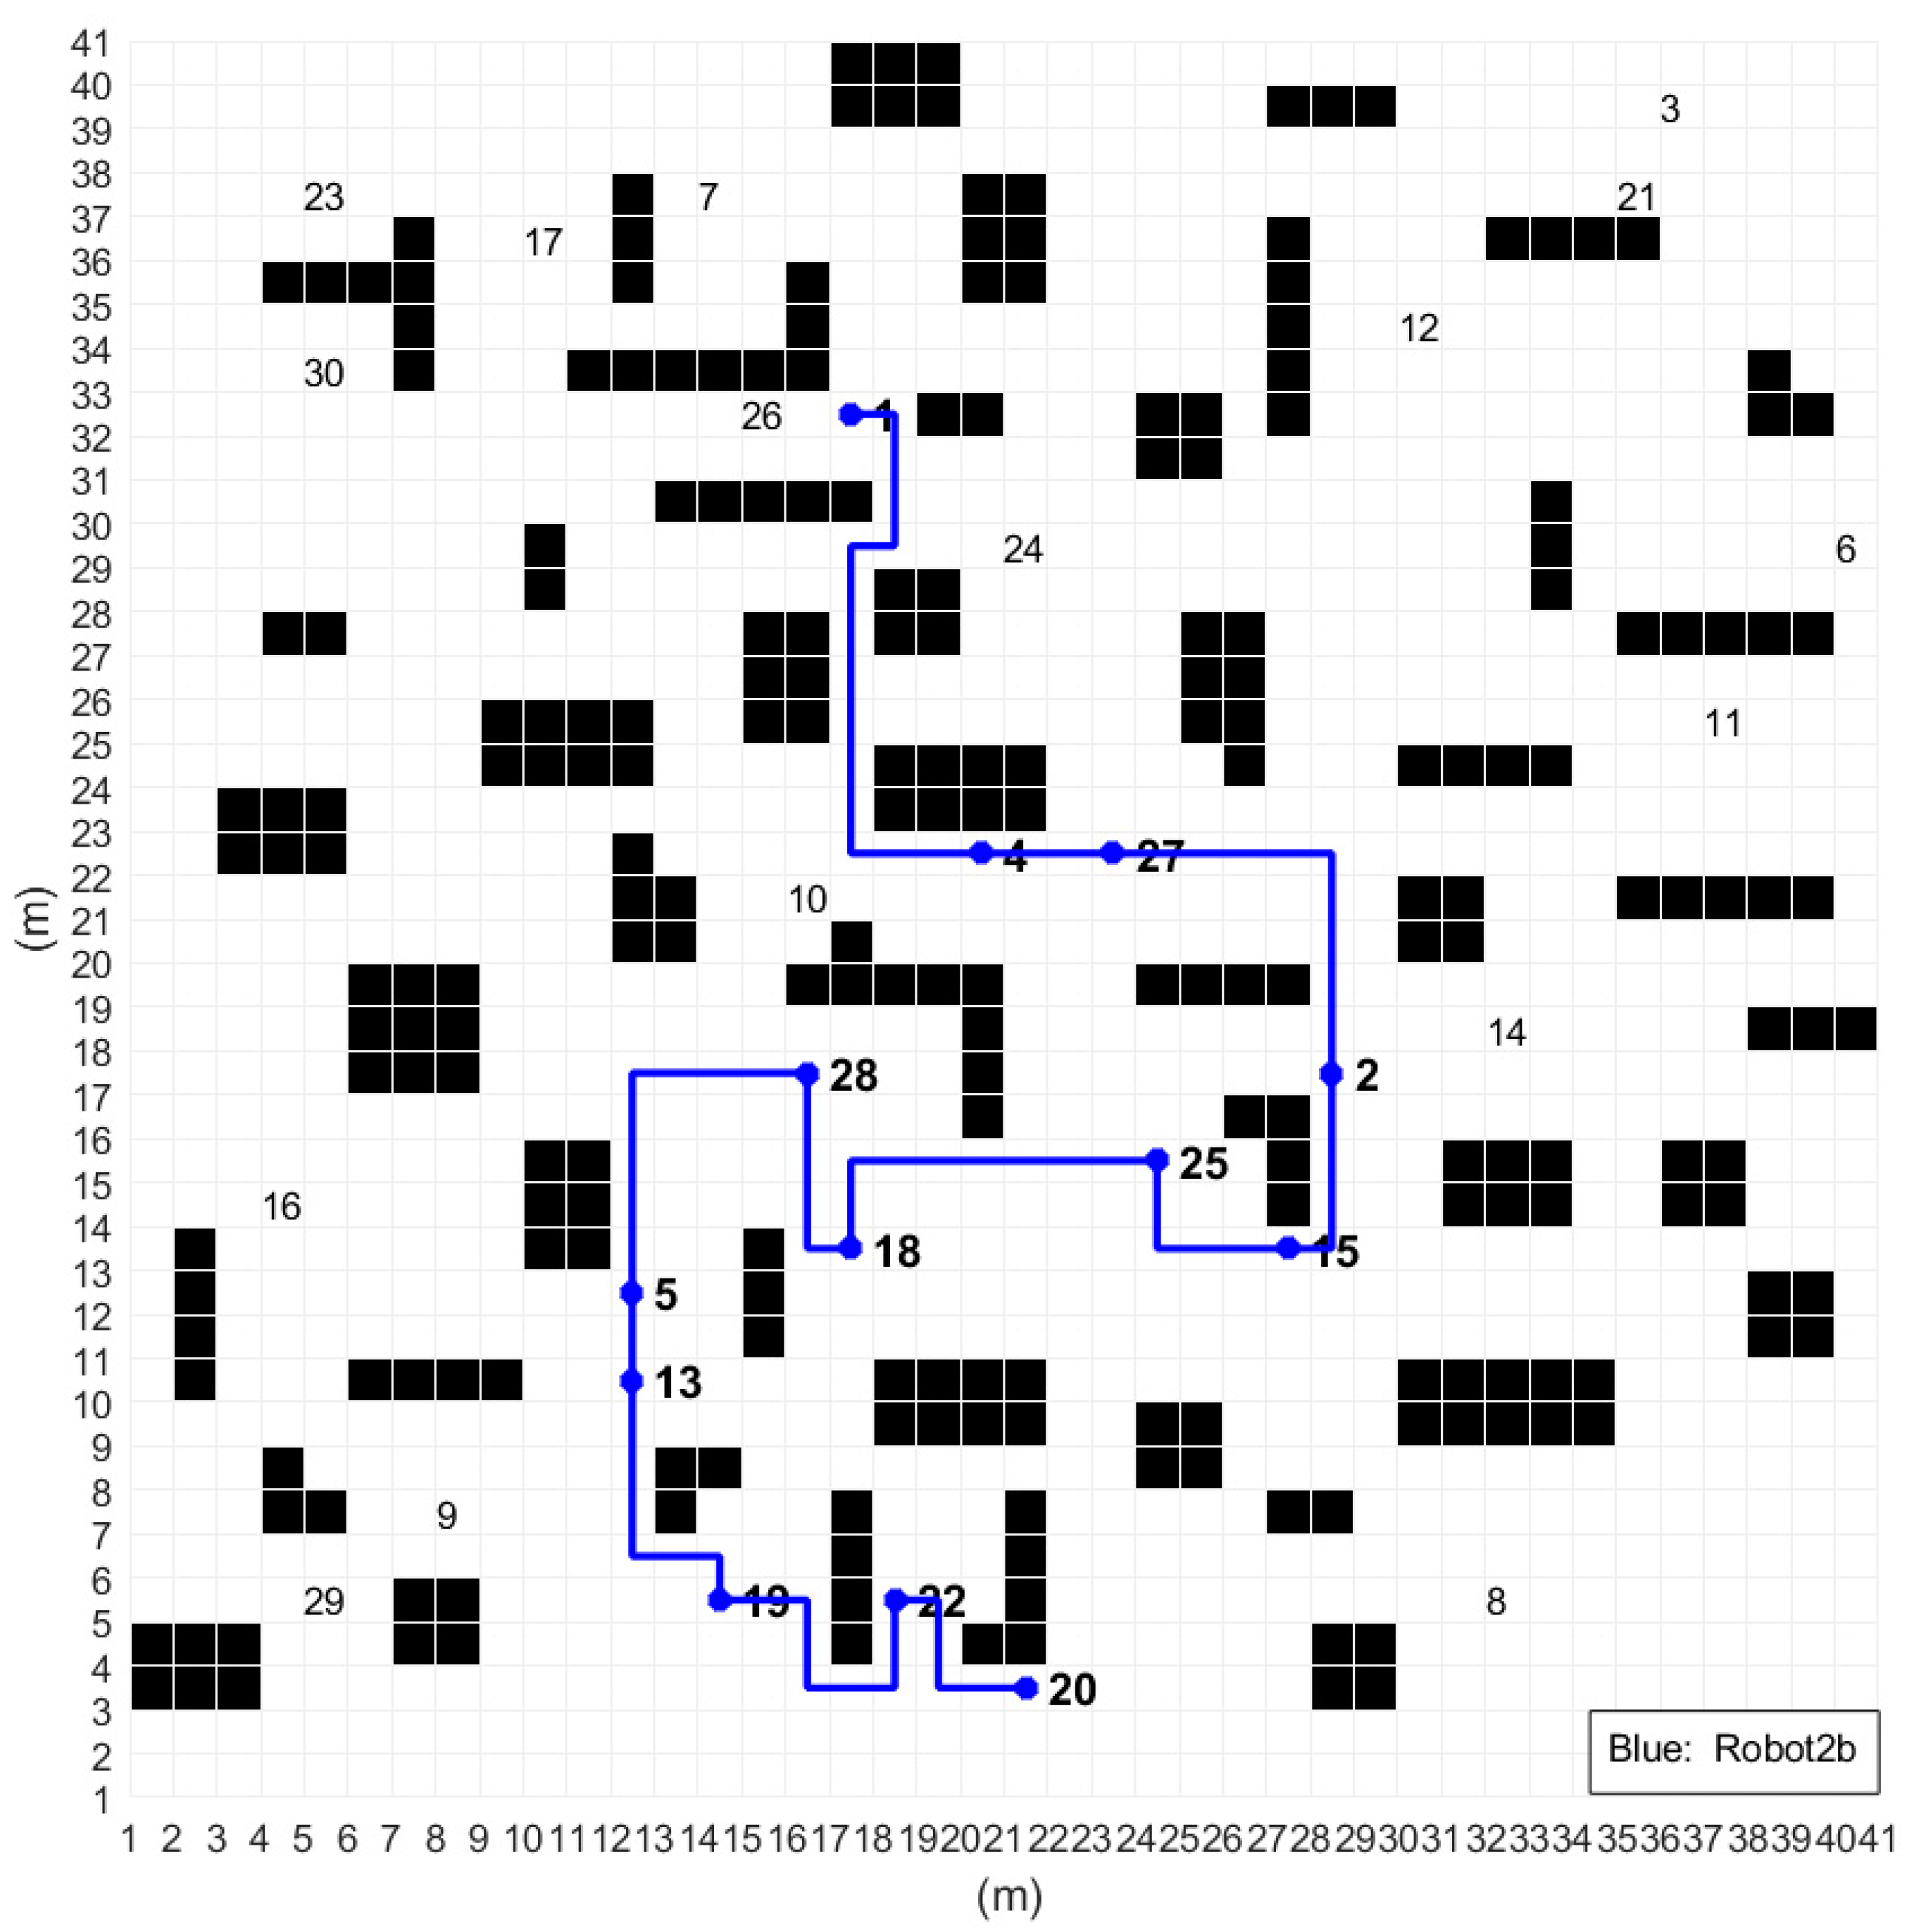
Experiment 5: Here, we set the irregular obstacle environment map, the number of tasks
m = 30, and the number of robots
n = 3. Furthermore, the distribution of task points is the same as that in Experiment 1, and the grid map size is 40 m × 40 m. The A* optimal path planning diagram before task sequence optimization is shown in
Figure 16.
As shown in
Table 7, the relative error of energy consumption of Robot 2
P2 = 10.71%, which exceeds the threshold
. Thus, the task sequence of Robot 2 should be re-optimized. The optimized optimal path planning of Robot 2 (renamed as “Robot 2b”) is shown in
Figure 17. The respective task sequences and experimental parameters of Robot 2 before and after optimization are shown in
Table 8.
As shown in
Table 8, the path length of the optimized Robot 2 is reduced by 18.6%, and the energy consumption is reduced by 17.4%. In
Table 9, the total energy after task sequence optimization is 6.41% lower than the previous one, and the standard deviation is also 51.58% lower.
The analysis of the results of Experiments 4 and 5 indicates that the task sequence optimization process using A* + GA can effectively reduce energy consumption and maintain energy balance in different task scenarios. Notably, in order to reduce the amount of computation, the second stage of the proposed algorithm optimizes the task sequence of the robot with a high energy consumption only on the basis of not changing the number of tasks. Other robot task sequences with low energy consumption do not need to be recalculated.


